Barwon-South Western Region Health and Wellbeing Workforce ... · Health and Wellbeing Workforce...
42
Department of Health Barwon-South Western Region Health and Wellbeing Workforce Planning Model and Process Technical Paper 2013
Transcript of Barwon-South Western Region Health and Wellbeing Workforce ... · Health and Wellbeing Workforce...
Department of Health
Barwon-South Western Region Health and Wellbeing Workforce Planning Model and Process
Technical Paper 2013
Barwon-South Western Region Health and Wellbeing Workforce Planning Model and Process
Technical Paper 2013

If you would like to receive this publication in an accessible format, please phone 03-5226-4544, or email: [email protected]
© Copyright, State of Victoria, Department of Health, 2013
This publication is copyright, no part may be reproduced by any process except in accordance with the provisions of the Copyright Act 1968.
Authorised and published by Victorian Government, 50 Lonsdale Street, Melbourne.
Contents
Introduction 1 What is health workforce planning? 1 Rationale for workforce planning - why is it important? 1 Forecasting supply and demand 2 Main conceptual approaches 2 Health workforce planning challenges 4 Innovative approaches to health workforce planning 5
Section 1 Workforce planning model and process 7 Future regional workforce planning model 7 Process for workforce strategy development 10 Delivering the strategy project 14 Implementation 15
Section 2 BSW Region geography, population and workforce 16 The Barwon-South West and its sub regions 16 Key health and wellbeing challenges 18 The BSW Region health and wellbeing workforce 29
Appendicies 33 Appendix 1: BSW Region Map 33 Appendix 2a: Summary of broad service provision by health care agencies in Great South Coast Sub-
region 34 Appendix 2b: Summary of broad service provision by health care agencies in the G21 Sub-region 35
References 36
Introduction
This Technical Paper accompanies the draft Barwon South-Western Region Health and Wellbeing Workforce Strategy 2012-2022.
Section 1 presents an innovative, evidence informed, aligned workforce planning model and process.
Section 2 presents an analysis of the available population and health and wellbeing workforce data at the regional level, and then at the sub-regional (Great South Coast and G21) level. A scan of the available population, health status and outcomes data, and the workforce data was conducted and the data analysed and presented to stakeholders for confirmation. The results of this process are presented in Section 2.
What is health workforce planning? Health workforce planning is a broad term that can describe the full range of approaches used to support implementation of health workforce policy including:
• regulation
• education/training content and infrastructure
• incentives
• role changes
• the provision of appropriate and accessible care, and more generally
• ensuring that an appropriate health workforce exists to meet health care needs.
Health workforce planning can be long term and strategic, or can be short term and focused on immediate issues, with the latter likely to dominate most health workforce planning exercises (WHO 2010).
The broad strategic approach has recently been summarised by the World Health Organisation and may include long term plans for education and training, new models of care, changes in regulation, and integration with broad objectives for the health care system (WHO 2010, Dussault et al 2010, Productivity Commission 2005).
In essence, effective workforce planning is “having the right people, with the right skills, in the right places and the right time” (Parsons 2010).
Typically, the different health professions are considered separately in their respective silos, however ideally all staff groups should be integrated and considered together, in line with the growing emphasis in the health care sector for team work and multidisciplinary care (Joyce et al 2004).
Rationale for workforce planning - why is it important? Workforce planning is an important instrument that controls for both shortage and oversupply within the healthcare labour market, both of which are known to limit the performance of health services (Greuningen et al 2012).
Sustainability [of the health sector] will require re-balancing many aspects of the current system and making decisions based on consumer and community need and reflective of and focusing on the most cost effective, efficient workforce arrangements to provide care. It will mean re-configuring the workforce and education and training programs that prepare and support them
HWA 2011, p.41
1 Health Workforce Australia (2011). National Health Workforce Innovation and Reform Strategic Framework for Action 2011-2015.
Adelaide HWA
Page 1
Barwon-South Western Region Health and Wellbeing Workforce Planning Model and Process
Workforce planning allows for appropriate changes to the health workforce to be made in order to adjust to demands for differing skills and needs and has been found to reduce staff wastage (Dussault 2010, Bosworth et al 2007). It allows health services to respond to demographic, epidemiologic, cultural and social profile changes within the population that impact demand on health services, and health service effectiveness.
Forecasting supply and demand The more common and narrow definition of health workforce planning, which is often used to support the broader approach, is concerned with the forecasting of health workforce demand and supply in an effort to determine the appropriate numbers of health care workers required (Roberfroid et al., 2009). This is based on an understanding of the demand for healthcare and estimating health workforce requirements; followed by the development of policy interventions to address the gap.
Quantitative forecasting models typically involve a comparison of the changing demographics of the population and of the health workforce in order to determine demand and supply.
In Australia, the National Health Workforce Taskforce developed the Health Workforce Planning Tool (HWPT) that produces such projections and estimates of requirements. It is based on demographic changes, taking into account inflow and exit of the health workforce, and comparing that to the utilisation of health services in order to determine the number of training places required (National Health Workforce Taskforce, 2008). Other such tools also exist and are based on similar workforce demographic approaches (Greenberg & Cultice 1997, WHO 2010, Denton et al 1994).
In the past, there have primarily been four main models utilised in estimating the future health workforce demands:
1. the health worker to population ratio is an approach usually determined by government or technical agencies and is simple to calculate and interpret
2. the service utilisation and demand approach which estimates future requirement based on current service levels and population projections
3. the service-target approach sets different targets in production and delivery of different services, and then converts these into staffing and productivity standards and
4. the health needs approach is a more in-depth approach that explores the likely changes in needs, based on changes in patterns of disease, injuries and disabilities and the services required to respond to these (Dussault et al 2010, WHO 2010).
Main conceptual approaches Demand for healthcare has been differentiated into two distinct concepts:
a. demand - a market-based concept reflecting purchasing decisions of individuals, or
b. need - a more clinical concept regarding the health status of the population (Segal & Leach, 2011).
Workforce planning is not solely confined to determining the requirements of the future workforce, but also determining what resources will be required to ensure that workforce considerations are aligned with service and financial planning (Parsons, 2010).
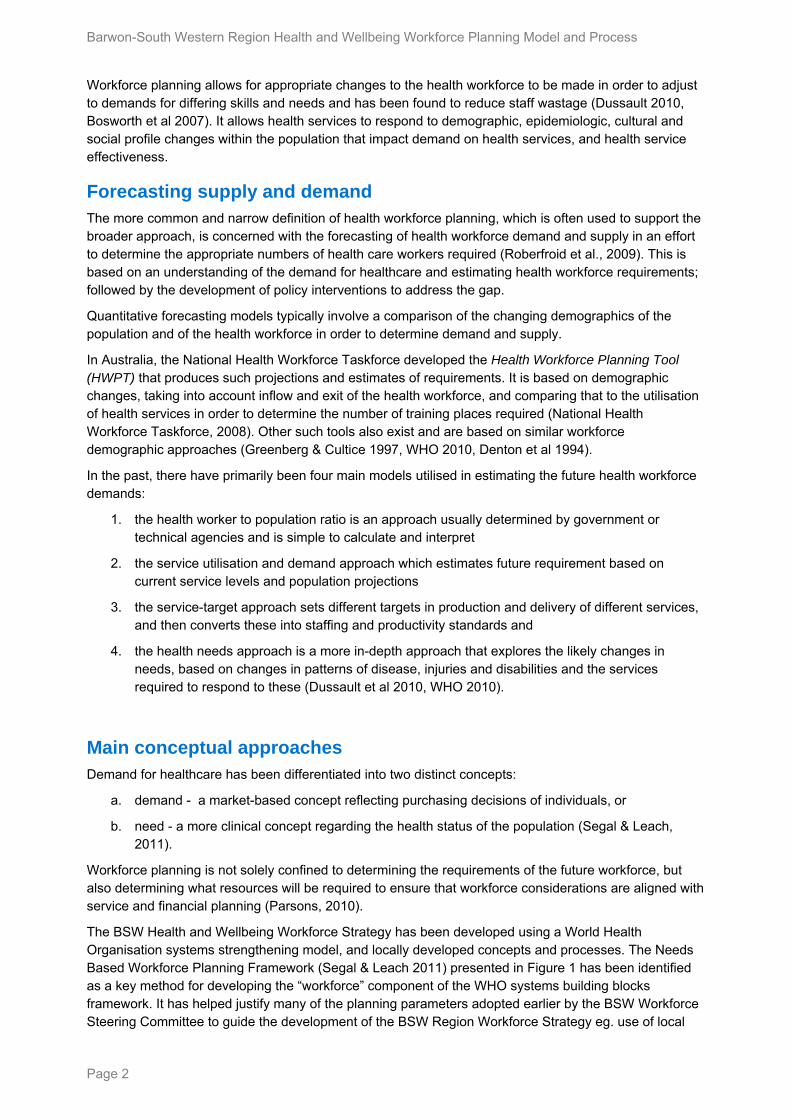
The BSW Health and Wellbeing Workforce Strategy has been developed using a World Health Organisation systems strengthening model, and locally developed concepts and processes. The Needs Based Workforce Planning Framework (Segal & Leach 2011) presented in Figure 1 has been identified as a key method for developing the “workforce” component of the WHO systems building blocks framework. It has helped justify many of the planning parameters adopted earlier by the BSW Workforce Steering Committee to guide the development of the BSW Region Workforce Strategy eg. use of local
Page 2
government area health and wellbeing profiles to identify need; use of social goals set out in G21 and Great South Coast whole of community plans linked to strategy. Where gaps in data about demand and workforce shortages were evident at the local level, evidence-informed consultations were used to bridge the gap.
Figure 1 Needs based workforce planning framework (Segal & Leach 2011)
Page 3
Barwon-South Western Region Health and Wellbeing Workforce Planning Model and Process
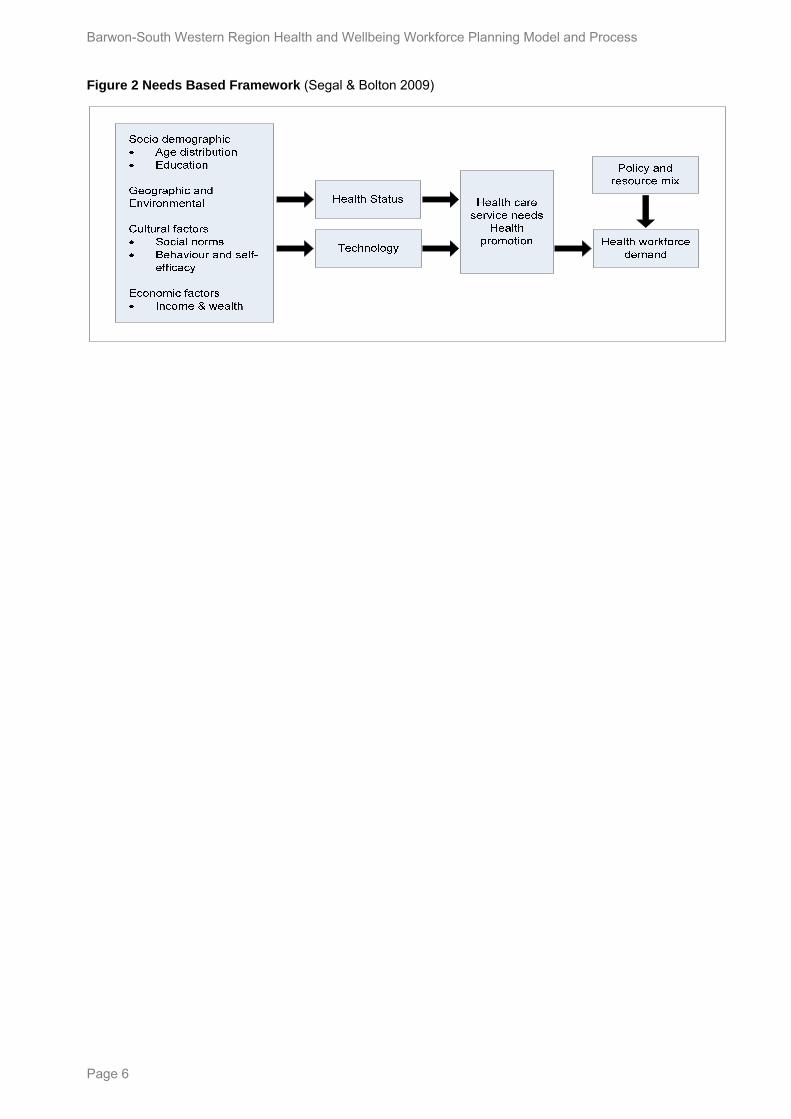
Health workforce planning challenges The dominant approach in planning for the health workforce has been a “simplistic” personnel-to-population ratio (Segal & Bolton 2009). There are no known approaches in place to plan for a “wellbeing” workforce.
Workforce planning is challenging because predicting workforce requirements requires planners to predict the future of health care systems, which is practically impossible (Parsons 2010).
It is commonly acknowledged that workforce planning is very important in controlling shortage and over-supply of certain workers within the health care labour market, for example, by controlling the inflow of medical training (Grenuningen et al 2012). If future increases in health care demand were to be met within Australia by increasing the medical workforce capacity, by 2050 Australia would be bankrupt (Brooks 2012). Having an oversupplied medical health workforce may inflate health care costs; at the other end of the spectrum an undersupply may result in unmet health needs and possibly health inequalities (Roberfroid 2009).
Strategies such as implementing competency-based education for health professionals, accommodating the overlap in professional boundaries and extending the scope of practice for health professionals have proven efficacious in comparable countries. However, there has been limited progress in applying them in Australia (HWA 2011). The slow rate of progress in workforce innovation and reform in Australia has been met with frustration.
Having a comprehensive needs assessment, that is not limited to a profession by profession approach, is necessary but challenging given that multiple factors contribute to the unpredictability of both user and health service provider behaviours. These factors include:
• retirement behaviours
• migration patterns
• changes in health structures
• changes in the broader economic and social environment, and
• the evolution of information technology (IT) and its impact on the health sector (Dussault 2010).
Fraher, Harden and Kimball (2011) have also reported a lack of collaboration between employers and educators. When a shortage exists, both employers and educators have typically responded by producing an increased number of health professionals, rather than considering perhaps, expanded roles of existing health professionals.
People living in regional, rural and remote areas are more likely to die from preventable diseases, injury, accidents or suicide (HWA 2011)2. Section 2 of this Technical Paper presents an analysis of available BSW regional level data to show variation in how populations are dispersed across the region and their health outcomes, age profiles, socioeconomic disadvantage, education and employment profiles.
The Great South Coast sub-region, for example, has higher levels of diabetes, greater rates of preventable hospital admissions, and higher incidence of avoidable mortality. These outcomes can be attributed to the ageing population, high levels of socioeconomic disadvantage, low post secondary school education rates and the high proportion of the population employed in the agriculture, forestry and fishing industries.
A failure to innovate and reform systems that prepare and support the health and wellbeing workforce could lead to increased burnout in the workforce, increased demand on health services and reduced capacity to retain current staff and attract new staff.
Australia’s general population is growing, ageing, and living longer, with health expenditure rising rapidly (HWA 2011). In contrast, Australia’s Aboriginal population has a relatively younger age profile, lower life
2 Health Workforce Australia (2011). National Health Workforce Innovation and Reform Strategic Framework for Action 2011-2015.
Adelaide HWA
Page 4
expectancy at birth and higher levels of disease and injury, and lower levels of access to education, employment and health and wellbeing services.
The Productivity Commission (2005) highlighted that the demand for health care services, and the health care workforce will primarily be driven by: the ageing of the population, increasing disability rates, changing technology, changing burden of disease, and higher incomes and expectations. Looking to the health workforce to meet these demands, it must be noted that generational changes mean that many providers are not working the long hours that their predecessors worked (HWA 2011) There is also a growing trend for workers to remain in the workforce longer, which is likely to affect aged care provision as informal carers stay longer in the workforce and are less able to assist the aged and chronically ill to stay home.
The growing ageing population within Australia calls for a shift in health services towards increased capacity to manage chronic conditions and respond to end-of-life needs. The health status of Aboriginal and Torres Strait Islander people is a national priority and in order to address these long-standing gaps, broader reform of the health workforce is required (HWA 2011)3.
The life expectancy of an Aboriginal male is 67.2 years and 72.9 years for an Aboriginal female, which is 10 years less than what is estimated for the non-Aboriginal Australian population (Thompson et al 2012).
Countries like Australia and Canada face enormous problems with servicing the health needs of their populations. A larger number of health workers alone will not address the issue of poor distribution of health providers in rural and regional areas. In Australia, various health care models have evolved to meet the demands within non-metropolitan areas (Humphreys et al 2008).
Innovative approaches to health workforce planning In Australia, the current approach to forecasting demand and supply within the health workforce is the Health Workforce Planning Tool (HWPT). This tool builds on previous approaches and has an “easy-to-use graphical user interface”. Although this model is easy to implement and provides quantitative projection, there are a number of issues.
Firstly, it focuses solely on increasing training places in order to increase supply, and ignores other policy change options, such as reducing exit rate. It also fails to address the geographical distribution of health services. Traditional models such as the HWPT, assume that demand and supply are independent of one another, when in fact an increase in supply can directly influence utilisation of health care, for example through changes in pricing which can have an influence on demand, or through over-servicing.
Finally, it uses a ‘silo’ approach, considering only one profession at a time and failing to account for interdependencies between health professionals, ignoring the potential for skill mix and role substitution (HWA 2011).
In Australia, it is not merely a matter of increasing the number of health care workers, but rather matching skills to community needs and addressing the issue of poor distribution of health care, particularly in rural and remote areas.
In order to address this issue, innovative strategies are required. In South Australia a needs based framework (Segal & Bolton 2009) that identifies factors and pathways influencing health workforce demand has been used to forecast future skills and competency requirements.
3 Health Workforce Australia (2011). National Health Workforce Innovation and Reform Strategic Framework for Action 2011-2015.
Adelaide HWA
Page 5
Barwon-South Western Region Health and Wellbeing Workforce Planning Model and Process
Figure 2 Needs Based Framework (Segal & Bolton 2009)
Page 6
Section 1 Workforce planning model and process
Future regional workforce planning model BSW Region has considered and adapted the Segal and Leach needs based planning framework set out in Figure 1 for local use in order to develop a well aligned BSW health and wellbeing workforce strategy now, and again in future years.
Following consultation the aim now is to align (rather than integrate) the strategy with the local community / regional development plans and future social and economic needs. The aim is also to interface the strategy with a number of key planning parameters such as:
• relevant national and state policy requirements;
• regional development strategies and objectives particularly in the social, economic and transport/connectivity domains;
• local health, education and training sector stakeholder requirements;
• sector industrial agreements with unions and professional associations;
• local industry innovation frameworks and opportunities;
• cost control measures; and
• person / community centred service models.
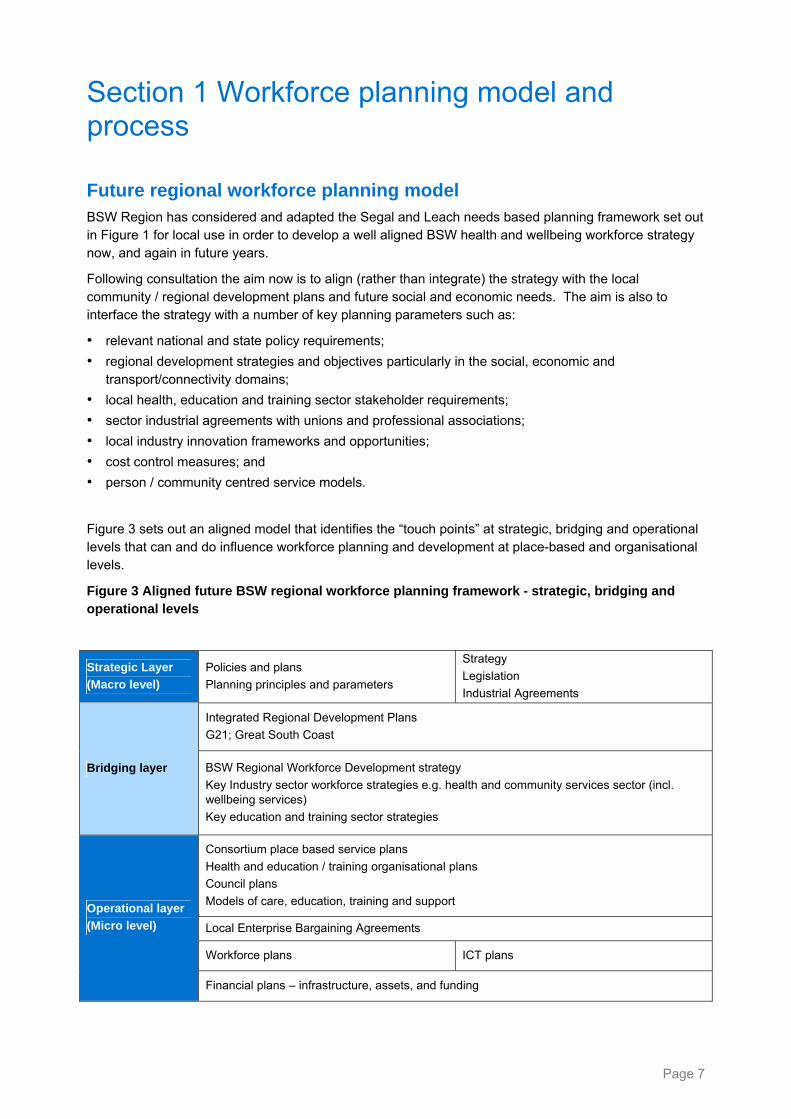
Figure 3 sets out an aligned model that identifies the “touch points” at strategic, bridging and operational levels that can and do influence workforce planning and development at place-based and organisational levels.
Figure 3 Aligned future BSW regional workforce planning framework - strategic, bridging and operational levels
Strategic Layer
(Macro level)
Policies and plans
Planning principles and parameters
Strategy
Legislation
Industrial Agreements
Integrated Regional Development Plans
G21; Great South Coast
Bridging layer BSW Regional Workforce Development strategy
Key Industry sector workforce strategies e.g. health and community services sector (incl. wellbeing services)
Key education and training sector strategies
Consortium place based service plans
Health and education / training organisational plans
Council plans
Models of care, education, training and support
Local Enterprise Bargaining Agreements
Workforce plans ICT plans
Operational layer
(Micro level)
Financial plans – infrastructure, assets, and funding
Page 7
Barwon-South Western Region Health and Wellbeing Workforce Planning Model and Process
Strategic layer
The National Health Workforce Innovation and Reform Strategic Framework for Action 2011-2015 is the overarching national platform that will guide future health workforce policy and planning in Australia. It sets out key priority areas and five essential domains that create the foundation for an integrated, high performing workforce fit to meet Australia’s health care needs. The strategies within the Framework aim to attract and retain, and enable and enhance the productivity of the existing and future workforce to meet current and emerging demands.
“The health sector needs to focus on wellness, prevention and primary health care if it is to be sustainable in the future. Sustainability will require re-balancing many aspects of the current system: making decisions based on consumer and community need and focusing on the most cost-effective and efficient workforce arrangements to provide care. It will mean reconfiguring the workforce, and the education and training programs that prepare and support that workforce. The Framework has been designed to provide an overarching, national platform that will guide future health workforce policy and planning in Australia.”
HWA 2011, p.1 4
In Victoria, the Victorian Health Priorities Framework is guiding planning about future development in health and wellbeing domains.5 It will assist local communities and councils to focus on using the wellbeing workforce to address issues associated with the social determinants of health, and health risk behaviours. It will also support the implementation of measures to “Close the Gap” between health outcomes for Aboriginal and Torres Strait Islander people.
Nationally and in Victoria work is already underway to plan, organise and develop a prevention workforce as part of refocusing on wellness, prevention and primary health care and other Australians.
The recently concluded Enterprise Bargaining Agreement round sets the current industrial parameters for workforce planning across the various professions.
Traditionally workforce design and planning has focused on working forward from the base of existing professions and their interests and skills, roles and responsibilities.
What is required now is a paradigm shift in ways of thinking about workforce design and planning at the strategic and operational levels, one that works backwards from outcomes for communities, consumer and population needs. New ways of engaging communities, unions and professional associations in a timely way to develop new community and consumer centric service designs need to be developed.
Bridging layer
In the Barwon-South Western Region there are two subregional plans in place, one for the G21 subregion, and another for the Great South Coast subregion.
These plans outline a set of interwoven strategies that aim to improve outcomes in the economic, social, environmental, transport and connections domains. The likely impact of forecast worker shortages on the social and economic fabric and future liveability of the region has led both plans to call for the development of the Barwon-South Western Region Health and Wellbeing Workforce Strategy 2012-2022 (Strategy).
The development of the Region’s human capital has been identified as a key regional development priority for the coming decade. As the third largest sector in the Barwon-South Western Region, the health and community services sector has significant social and economic importance; in the next ten years it is expected to grow to become the Region’s second largest sector.
4 Health Workforce Australia (2011). National Health Workforce Innovation and Reform Strategic Framework for Action 2011-2015.
Adelaide HWA 5 http://www.health.vic.gov.au/healthplan2022/
Page 8
In Victoria, the five rural and regional communities – Barwon-South Western, Grampians, Loddon Mallee, Hume, and Gippsland - have all developed whole of community integrated regional plans. A new planning process to refresh and update these plans is commencing.
At the same time these five regions are being challenged to lift their current “flat lining” productivity levels and focus clearly on skills / workforce development to better position these communities for the future. It is anticipated that this planning process is likely to have a focus on future skill requirements in the health and community services sector (including the wellbeing sector), as these sectors are industries of growth across Victoria.
The BSW Health and Wellbeing Workforce Strategy was developed using locally developed processes.
It provides the bridge between the Strategic layer and the Operational layers of Figure 3 and provides a connecting framework for health, wellbeing and education and training sector organisations to develop their organisational business and service plans, workforce, ICT plans and infrastructure plans in an aligned and value adding way.
Operational layer
Local health and wellbeing workforce planning models should be based on a good understanding of population health status and outcomes and a good understanding of community need, including information on population size, projected growth and demographic profile.
This information should be analysed in the context of the broad range of determinants of health and wellbeing, health system performance, community expectations and preferences, and the training pipeline.
The aligned workforce planning model in Figure 3 shows the importance of undertaking collaborative operational level workforce planning and development in alignment with the macro-national and Victorian policy and strategy context and the regional and local place-based plans.
It also shows the importance of aligning health service planning, workforce planning, ICT planning and financial planning to minimise risk of implementation failure. At the recent HWA Inspire 2012 Conference there were a number of significant examples provided of workforce development failure due to a fundamental lack of alignment.
Page 9
Barwon-South Western Region Health and Wellbeing Workforce Planning Model and Process
Process for workforce strategy development
Preparation
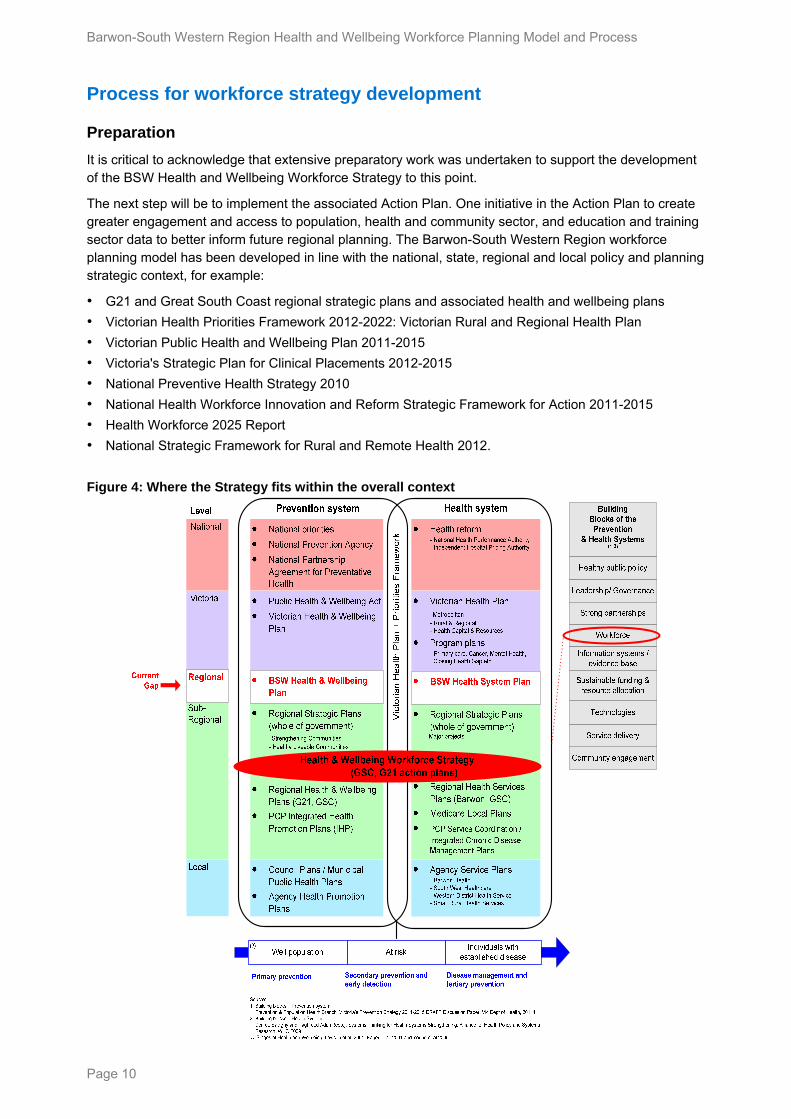
It is critical to acknowledge that extensive preparatory work was undertaken to support the development of the BSW Health and Wellbeing Workforce Strategy to this point.
The next step will be to implement the associated Action Plan. One initiative in the Action Plan to create greater engagement and access to population, health and community sector, and education and training sector data to better inform future regional planning. The Barwon-South Western Region workforce planning model has been developed in line with the national, state, regional and local policy and planning strategic context, for example:
• G21 and Great South Coast regional strategic plans and associated health and wellbeing plans
• Victorian Health Priorities Framework 2012-2022: Victorian Rural and Regional Health Plan
• Victorian Public Health and Wellbeing Plan 2011-2015
• Victoria's Strategic Plan for Clinical Placements 2012-2015
• National Preventive Health Strategy 2010
• National Health Workforce Innovation and Reform Strategic Framework for Action 2011-2015
• Health Workforce 2025 Report
• National Strategic Framework for Rural and Remote Health 2012.
Figure 4: Where the Strategy fits within the overall context
Page 10
Page 11
Conceptual schema
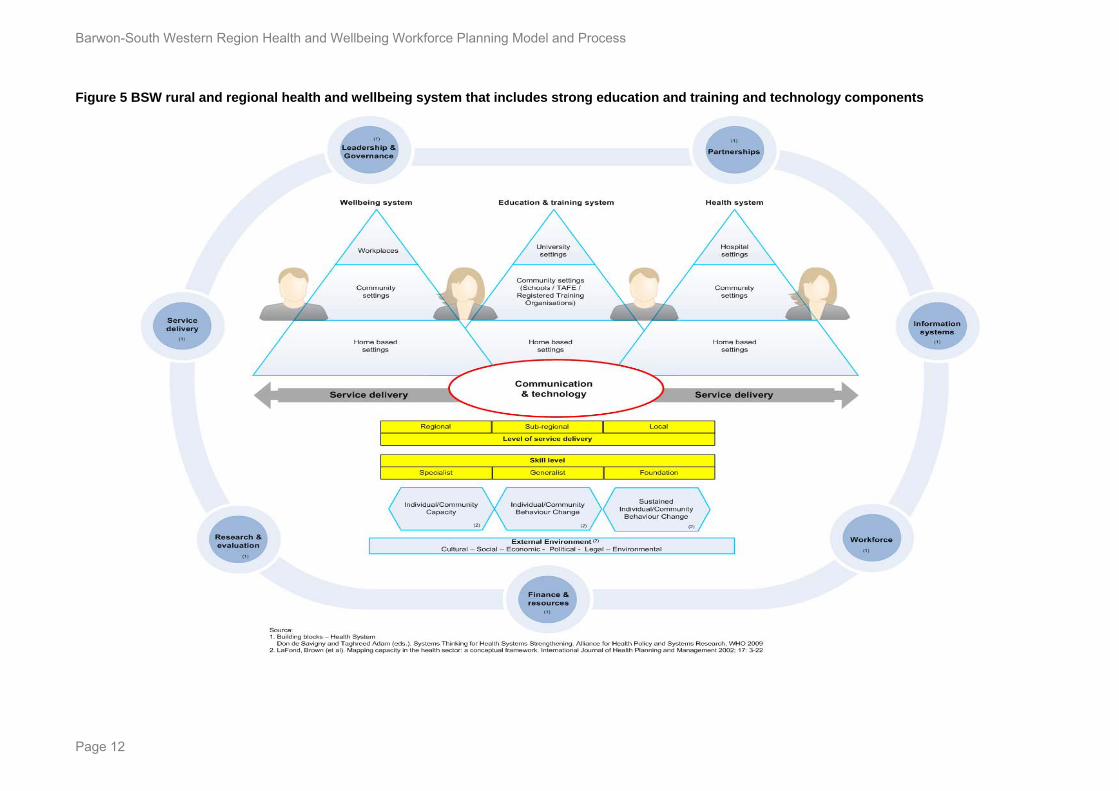
The prospect of shortages in rural medical, nursing and allied health disciplines is expected to affect the whole continuum of health and aged care from home and community based service settings through to service provision in the hospital setting. A conceptual schema (Figure 5) was designed by the BSW Workforce Steering Committee to assist providers in the health, wellbeing and education and training sectors to consider ways to:
• strengthen partnerships and pathways
• develop joined up service provision and workforce
• envisage new business models
• incorporate new technologies.
This schema was used during the consultation and engagement process to promote discussion about different layers of a contemporary BSW health and wellbeing system that includes strong health, wellbeing, education, training, and technology components. It is intended to be a useful overarching guiding framework for health, wellbeing and education and training organisations as they develop their:
• business and service plans
• workforce plans
• ICT plans
• program plans (eg health promotion, primary care, mental health, aged care, sport and recreation)
• clinical pathways plans (using capability frameworks)
• shared service models and plans – corporate service models, place-based service plans, place based workforce, ICT, asset management models.
The outer ring of the schema identifies health and wellbeing system building blocks that make up a generic systems setting and links with World Health Organization Systems Strengthening Models6. The health, wellbeing and education and training systems are each represented by a triangle within the broader systems setting. Each of the three systems – wellbeing, education and training, and health - is shown to deliver consumer-centred services in a generic set of home, community and institutional settings (eg workplaces, universities and hospitals) to Barwon-South Western Region’s residents and workers.
The schema reflects the reliance of both the health and wellbeing systems on the development of community capacity for individual self-management and engagement with services as well as the education and training system for workforce training and development programs and services. Across all three systems, services are delivered at regional, subregional and local area levels, and in various configurations.
Service models in universities, TAFEs, schools, health services and wellbeing services are being transformed and redesigned to better utilise new information and communications technology including cloud technologies. The schema identifies a major communications and technology platform that can potentially link all three systems.
Local residents, workers, students, patients and carers are beginning to use new web-based information and communication technologies in these contemporary models as they themselves become a central part of the delivery model in health, wellbeing, education and training sectors.
Many people however are not sufficiently ‘communications and technology literate’ and do need to develop appropriate ‘foundation’ skills and competencies to be able to actively participate in these emerging models with workers who have specialist and generalist skills and competencies. Suitably crafted training programs will be needed to support them.
6 http://www.who.int/healthsystems/strategy/everybodys_business.pdf
Barwon-South Western Region Health and Wellbeing Workforce Planning Model and Process
Figure 5 BSW rural and regional health and wellbeing system that includes strong education and training and technology components
Page 12
Substantial work was undertaken by the Department of Health Barwon-South Western Regional Office, and the project secretariat to develop a project brief including:
Defined overarching aims
The Strategy will aims to implement the national call to action – innovation and a refocusing of effort on wellness, prevention and primary health care in order to sustain the health system, and the achievement of a health and wellbeing workforce that has the appropriate balance of generalists and specialists matched to community need.
Goal
The Workforce Strategy will provide region-wide guidance on the workforce necessary to create a sustainable Barwon-South Western Region (BSW) rural and regional health system in the medium term to 2022. It will describe current and future needs, a vision for the health and wellbeing service system, and include principles, objectives and initiatives to develop and support the existing workforce, and develop the kind of future workforce necessary to realise that vision.
Purpose
The Strategy sought to:
• improve staff recruitment and retention outcomes;
• develop a range of pathways to careers in health and wellbeing
• strengthen regional leadership and governance arrangements
• establish integrated regional workforce planning capacity that is aligned with regional development goals and objectives
• create an environment for the innovations and reforms needed to sustain local health systems
• promote healthy workplace policy and action;
• improve workforce planning and development infrastructure
• strengthen regional capacity for local education training and development.
Deliverables
• The deliverables for the development of the Strategy were to:
• Create a vision for an innovative, contemporary BSW rural and regional health and wellbeing system (that includes strong education and training and technology components) to guide future healthcare and wellbeing services design and job design
• Develop an innovative evidence informed, integrated workforce planning model and process
• Produce a local BSW health and wellbeing workforce strategy and sub-regional action plans (G21 and Great South Coast). It should be an action oriented workforce strategy centred on the needs of the BSW community and incorporating a number of key themes such as:
• setting future aspirations in a contemporary rural and regional systems vision and schema
• strengthening rural and regional communities
• reducing rural and regional health inequalities
• designing new workforce planning approaches
• recruiting to retain and develop
• strengthening collaborative partnership relationships
• creating a best practice rural clinical / student placement model
• making the technology opportunities work
• developing workforce models that encourage innovations.
• develop a BSW Clinical Placement Network strategy and action plan as a key component.
Page 13
Barwon-South Western Region Health and Wellbeing Workforce Planning Model and Process
Project governance
A Strategy Control Group (SCG) comprising members from health, wellbeing, education, training and government sectors was the steering group for the project. It was chaired by the Project Director, the Chief Executive Officer (CEO) of the Western District Health Services (WDHS). The SCG supported WDHS and reported on progress and issues to the BSW Regional Director Health and Aged Care. A Technical Advisory Group was formed to act as an external sounding board for the Project.
Delivering the strategy project
Development of a Discussion Paper and a Technical Paper
A Discussion Paper was developed to support stakeholder engagement activities and evidence-informed consultations. The discussion paper was informed by:
• A review of key issues and directions in local, state and national government policy particularly workforce and innovation policy
• The background paper of the National Rural and Remote Health Workforce Innovation and Reform Strategy7 that included a review of the literature on rural and on remote workforce issues and reforms, nationally and internationally and a scan of current efforts already underway in Australia, focusing on:
– innovation and traditional workforce strategies and actions, and approaches to monitoring and
governance arrangements
lbeing issues facing the community, health service providers and education and
blished to guide the development of the Strategy and to
the
ltations and is presented in Section 2 as
the current planning support data and information component.
ngagement activities
ent nationally in the health human services and education and regional development
with stakeholders individually or in small focus groups were also conducted pre and post the workshops.
reporting on their impact and outcomes
– health and wellbeing workforce leadership and
– practical opportunities for workforce redesign
– practical and cost effective approaches to recruitment and retention
– key health and weltraining providers
– relevant policy, and rural research.
The Strategy Control Group (SCG) was estaprovide feedback on early and final drafts.
An accompanying Technical Paper was developed based on work by Mr Paul Gladigau supported by Barwon-South Western Region Secretariat. It presented analyses of population health and wellbeing data at a regional level, and a breakdown at the sub-regional level. The technical paper also provided an analysis of the available public health sector State Services Authority workforce data. The material in thepaper was updated based on advice received during the consu
Consultation and e
Stakeholders included:
• service providers and consumers across health and wellbeing services
• peak government and community agency representatives who influence policy and program developmsectors
• others, such as education providers, regional representatives, and council representatives.
Stakeholders participated by attending workshops in relevant locations, or by providing a response in writing by visiting the Barwon Health website. A small number of face-to-face or telephone interviews
7 http://www.hwa.gov.au/work-programs/workforce-innovation-and-reform/rural-and-remote-health-workforce
Page 14
Data analysis and strategy and action plan formulation
The Discussion Paper data and data from the consultations were analysed to develop a shared vision for the health and wellbeing system and principles for future workforce development for the health and wellbeing workforce in the BSW region and its sub-regions, and:
• Objectives
• Outcome Areas
• Strategies to achieve the Objectives for the next 10 years
• An Action Plan to implement the strategies in the next three years.
Implementation The progressive implementation of the Strategy and Action Plan is a critical success factor for the health and wellbeing sector going forward.
The new leadership arrangements need to be finalised and agreed.
The establishment of a new regional leadership and governance group – the BSW Health and Wellbeing Workforce Strategy Steering Group – and a supporting Working Group(s) has been endorsed “in principle” by the BSW Health CEO’s Forum as the key driving force behind the implementation of the Strategy.
The implementation arrangements should build on existing networks and be laid out in a new leadership and governance architecture that draws together the efforts of the various groups working on health and wellbeing workforce issues across the region (eg Southern Grampians Glenelg Health Steering Group; Barwon Health Shared Services Alliance; SouthWest Healthcare Service Development Group; BSW Allied Health Leaders Network; BSW Clinical Placement Network; BSW Directors of Nursing group; G21 and Great South Coast health and wellbeing pillars), to contribute to the implementation of the Strategy.
The Steering Group should comprise senior regional leaders from the health, education, training, wellbeing, regional development, and employment sectors. It should provide the authorising and monitoring environment for implementation and further refinement of the strategy over time.
The Working Group could be constructed “virtually” by utilising the existing networks mentioned above. Action Plan responsibilities would be assigned to key “Lead” organisations within those networks with the “lead” organisation supported by and agreed set of network partners.
A draft Terms of Reference for both the Steering Committee and Working Group(s) are to be developed and attached to this document.
The resources to support implementation of the Strategy need to be negotiated over time.
Page 15
Barwon-South Western Region Health and Wellbeing Workforce Planning Model and Process
Section 2 BSW Region geography, population and workforce
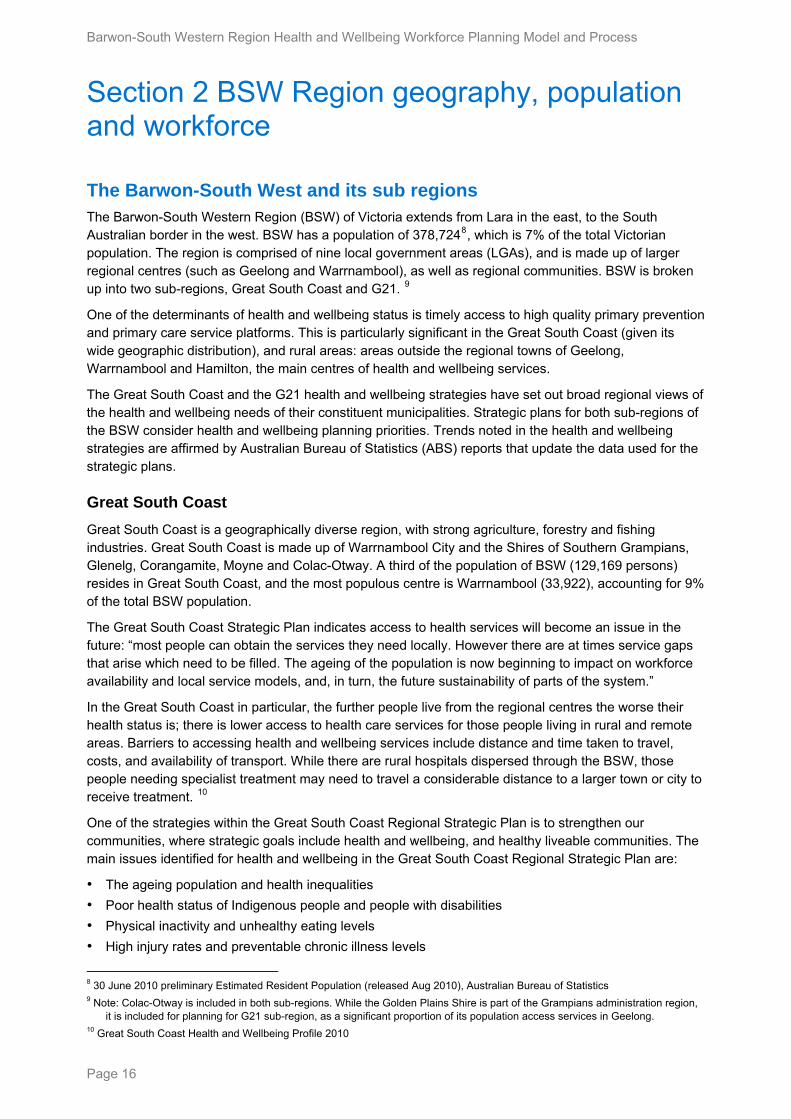
The Barwon-South West and its sub regions The Barwon-South Western Region (BSW) of Victoria extends from Lara in the east, to the South Australian border in the west. BSW has a population of 378,7248, which is 7% of the total Victorian population. The region is comprised of nine local government areas (LGAs), and is made up of larger regional centres (such as Geelong and Warrnambool), as well as regional communities. BSW is broken up into two sub-regions, Great South Coast and G21. 9
One of the determinants of health and wellbeing status is timely access to high quality primary prevention and primary care service platforms. This is particularly significant in the Great South Coast (given its wide geographic distribution), and rural areas: areas outside the regional towns of Geelong, Warrnambool and Hamilton, the main centres of health and wellbeing services.
The Great South Coast and the G21 health and wellbeing strategies have set out broad regional views of the health and wellbeing needs of their constituent municipalities. Strategic plans for both sub-regions of the BSW consider health and wellbeing planning priorities. Trends noted in the health and wellbeing strategies are affirmed by Australian Bureau of Statistics (ABS) reports that update the data used for the strategic plans.
Great South Coast
Great South Coast is a geographically diverse region, with strong agriculture, forestry and fishing industries. Great South Coast is made up of Warrnambool City and the Shires of Southern Grampians, Glenelg, Corangamite, Moyne and Colac-Otway. A third of the population of BSW (129,169 persons) resides in Great South Coast, and the most populous centre is Warrnambool (33,922), accounting for 9% of the total BSW population.
The Great South Coast Strategic Plan indicates access to health services will become an issue in the future: “most people can obtain the services they need locally. However there are at times service gaps that arise which need to be filled. The ageing of the population is now beginning to impact on workforce availability and local service models, and, in turn, the future sustainability of parts of the system.”
In the Great South Coast in particular, the further people live from the regional centres the worse their health status is; there is lower access to health care services for those people living in rural and remote areas. Barriers to accessing health and wellbeing services include distance and time taken to travel, costs, and availability of transport. While there are rural hospitals dispersed through the BSW, those people needing specialist treatment may need to travel a considerable distance to a larger town or city to receive treatment. 10
One of the strategies within the Great South Coast Regional Strategic Plan is to strengthen our communities, where strategic goals include health and wellbeing, and healthy liveable communities. The main issues identified for health and wellbeing in the Great South Coast Regional Strategic Plan are:
• The ageing population and health inequalities
• Poor health status of Indigenous people and people with disabilities
• Physical inactivity and unhealthy eating levels
• High injury rates and preventable chronic illness levels
8 30 June 2010 preliminary Estimated Resident Population (released Aug 2010), Australian Bureau of Statistics 9 Note: Colac-Otway is included in both sub-regions. While the Golden Plains Shire is part of the Grampians administration region,
it is included for planning for G21 sub-region, as a significant proportion of its population access services in Geelong. 10 Great South Coast Health and Wellbeing Profile 2010
Page 16
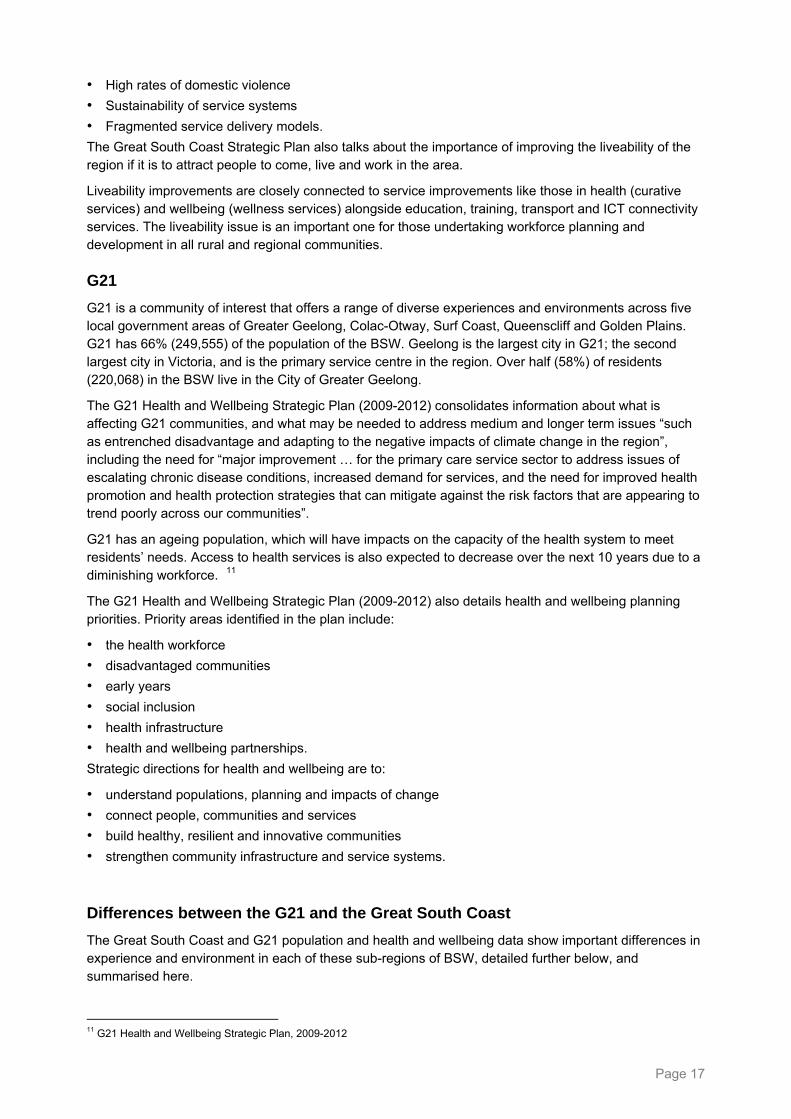
• High rates of domestic violence
• Sustainability of service systems
• Fragmented service delivery models.
The Great South Coast Strategic Plan also talks about the importance of improving the liveability of the region if it is to attract people to come, live and work in the area.
Liveability improvements are closely connected to service improvements like those in health (curative services) and wellbeing (wellness services) alongside education, training, transport and ICT connectivity services. The liveability issue is an important one for those undertaking workforce planning and development in all rural and regional communities.
G21
G21 is a community of interest that offers a range of diverse experiences and environments across five local government areas of Greater Geelong, Colac-Otway, Surf Coast, Queenscliff and Golden Plains. G21 has 66% (249,555) of the population of the BSW. Geelong is the largest city in G21; the second largest city in Victoria, and is the primary service centre in the region. Over half (58%) of residents (220,068) in the BSW live in the City of Greater Geelong.
The G21 Health and Wellbeing Strategic Plan (2009-2012) consolidates information about what is affecting G21 communities, and what may be needed to address medium and longer term issues “such as entrenched disadvantage and adapting to the negative impacts of climate change in the region”, including the need for “major improvement … for the primary care service sector to address issues of escalating chronic disease conditions, increased demand for services, and the need for improved health promotion and health protection strategies that can mitigate against the risk factors that are appearing to trend poorly across our communities”.
G21 has an ageing population, which will have impacts on the capacity of the health system to meet residents’ needs. Access to health services is also expected to decrease over the next 10 years due to a diminishing workforce. 11
The G21 Health and Wellbeing Strategic Plan (2009-2012) also details health and wellbeing planning priorities. Priority areas identified in the plan include:
• the health workforce
• disadvantaged communities
• early years
• social inclusion
• health infrastructure
• health and wellbeing partnerships.
Strategic directions for health and wellbeing are to:
• understand populations, planning and impacts of change
• connect people, communities and services
• build healthy, resilient and innovative communities
• strengthen community infrastructure and service systems.
Differences between the G21 and the Great South Coast
The Great South Coast and G21 population and health and wellbeing data show important differences in experience and environment in each of these sub-regions of BSW, detailed further below, and summarised here.
11 G21 Health and Wellbeing Strategic Plan, 2009-2012
Page 17
Barwon-South Western Region Health and Wellbeing Workforce Planning Model and Process
Socially and economically disadvantaged communities in the BSW have poorer outcomes, experience the negative effects of the determinants of health and have higher levels of physical and mental ill health, higher rates of chronic disease and lower life expectancies. The G21 area with its larger population base has a much larger scale of disadvantage, particularly in Geelong. In the Great South Coast community disadvantage is dispersed more widely across a number of towns and settlements.
G21 is less geographically spread out than the Great South Coast: the majority of the population lives in Greater Geelong. Access to specialist services is lower in Great South Coast than G21, as is the rate of year 12 education completion. Unemployment, however, is higher in G21.
Comparing population health and wellbeing across the two sub-regions, Great South Coast is poorer than G21 on many health outcomes. Chronic disease is a significant issue in G21, with high levels of conditions such as diabetes, heart disease, asthma, arthritis and cancer. Rates of alcohol consumption and smoking are also high. Life expectancies in Great South Coast are also shorter than the Victorian average, and rates of crime and family violence are higher. Incidence of avoidable mortality is higher in the Great South Coast than in G21. This is most significant for road traffic injury, where rates for men in the Great South Coast are more than double those for G21 and Victoria.
These poorer outcomes being experienced in the Great South Coast may be attributed to the ageing of the population, high levels of socio-economic disadvantage, low post secondary education qualification rates, and the high proportion of the population employed in the agriculture, forestry and fishing industries.
Access to specialist services (eg general practitioners, psychologists and psychiatrists) is lower in the Great South Coast sub-region than in G21. Because of the size of the Great South Coast sub-region, there is a higher likelihood of residents needing to travel further distances to access specialist hospital services.
Key health and wellbeing challenges The following section outlines key health and wellbeing data for the BSW as a whole, and for the Great South Coast and G21 sub-regions.
Population growth
Between 2010 and 2026 the BSW population is expected to grow by 24% (or by 91,046 persons), slightly less than the expected population growth rate for Victoria (27%). The population of G21 is expected to reach 500,000 in the next 30 to 40 years12. Between 2010 and 2026 G21 is expected to grow at a much higher rate (30% growth in population between 2010 and 2026) than the Great South Coast sub-region (13% expected growth).
Much of the growth in the BSW can be attributed to expected population increases in Greater Geelong13. The Surf Coast area in G21 is anticipated to have the highest percentage growth in the BSW, expected to grow by 11,142 persons (or 43%) between 2010 and 2026. The lowest growth is expected in Hamilton in the Great South Coast sub-region, with an 8% increase in population expected.14 15 Population growth rates for G21 are higher than those of the Great South Coast and Victoria.
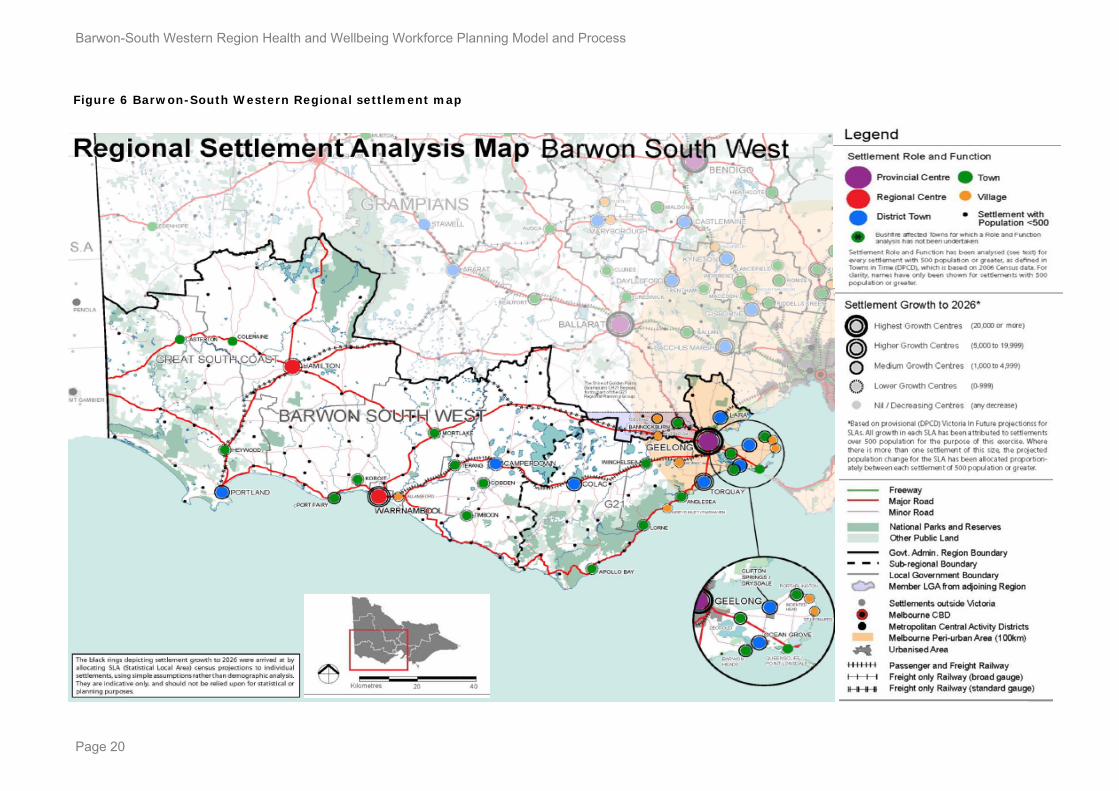
The Regional Settlement Analysis Map (see Figure 6 below) shows the settlement hierarchy and settlement growth to 2026.16 The map has been derived from two main sources: the settlement hierarchy established in the “Role and Function” table (described below), and population growth derived from “Victoria in Future 2008” population projections, Department of Planning & Community Development.
12 G21 Regional Growth Plan, April 2012 13 Between 2010 and 2026 the population of Greater Geelong is expected to increase by 62,519 persons. This is almost 70% of the
expected population increase for BSW as a whole. 14 2010 Preliminary Estimated Resident population (released Aug 2011), Australian Bureau of Statistics 15 Victoria in Future 2012 population projections, Department of Planning and Community Development 16 Barwon-South Western Region Health & Wellbeing Workforce profile (2012)
Page 18
Page 19
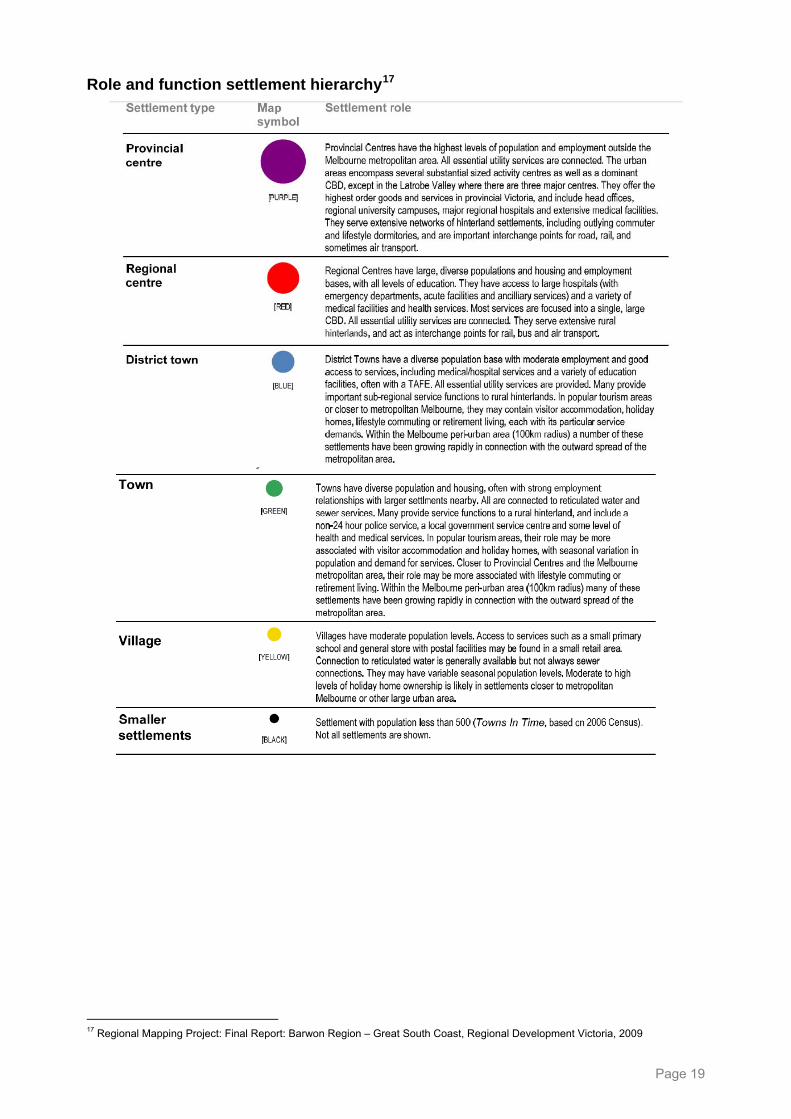
Role and function settlement hierarchy17
17 Regional Mapping Project: Final Report: Barwon Region – Great South Coast, Regional Development Victoria, 2009
Barwon-South Western Region Health and Wellbeing Workforce Planning Model and Process
Figure 6 Barwon-South Western Regional settlement map
Page 20
Birth rates
Birth rates in the BSW are comparable to Victorian rates. In 2011/2012, the birth rate per 1,000 women was 62.4 in Great South Coast and 61.5 in G21 (the Victorian rate was 62.5).18 19 The highest birth rate in the BSW in 2011/2012 was for mothers aged 30-34 years (rate of 137.1 per 1,000 women).
Between 2007 and 2012, there has been a shift towards women having children later in life (from 25-29 years in 2007/2008 to 30-34 years in 2011/2012), consistent with national trends. In 2011/2012 there was a higher rate of teenage mothers (aged 15-19 years) in BSW (and Great South Coast in particular) compared to the Victorian average (birth rate per 1,000 women: Great South Coast=13.2, G21=10.9, VIC=10.0).
These rates are lower than the average for rural Victoria (15.9 per 1,000 women). The LGA with the highest birth rate to teenage mothers was Glenelg (16.5 per 1,000 women).
Aboriginal and Torres Strait Islander peoples and population born overseas
The BSW has a higher proportion of Aboriginal and Torres Strait Islander peoples (1%) when compared to Victoria (0.7%), but less than Australia (2.5%). 20
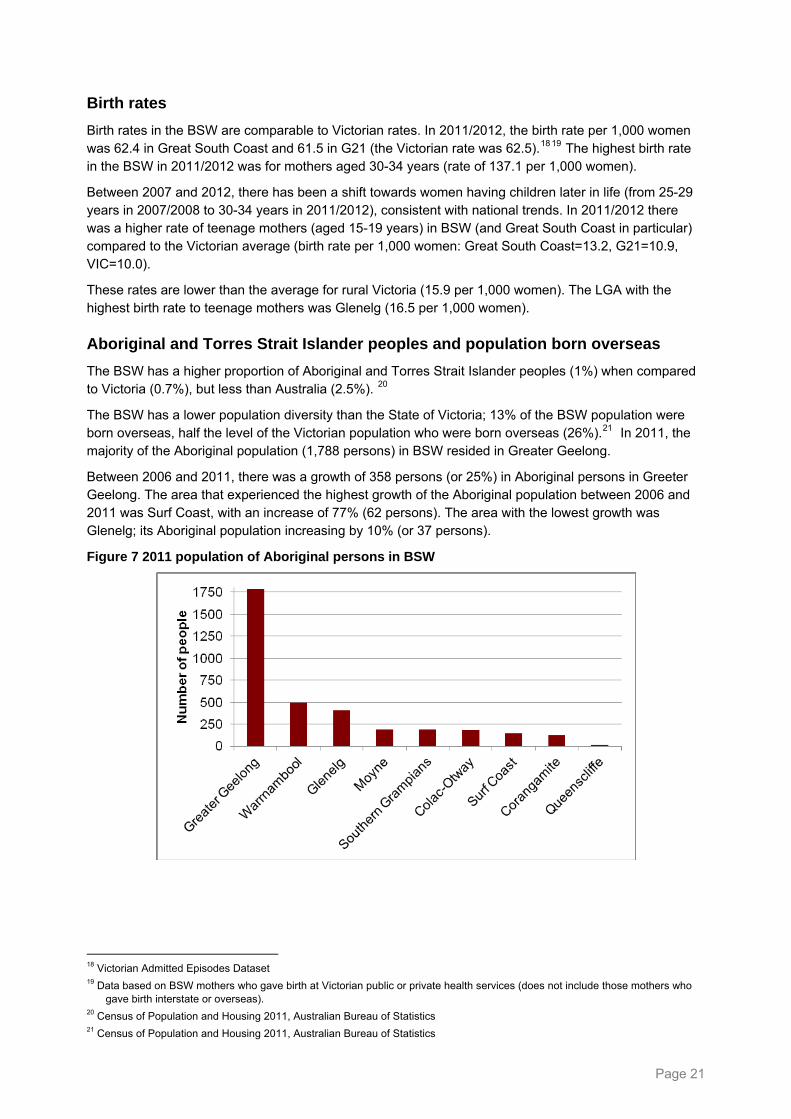
The BSW has a lower population diversity than the State of Victoria; 13% of the BSW population were born overseas, half the level of the Victorian population who were born overseas (26%).21 In 2011, the majority of the Aboriginal population (1,788 persons) in BSW resided in Greater Geelong.
Between 2006 and 2011, there was a growth of 358 persons (or 25%) in Aboriginal persons in Greeter Geelong. The area that experienced the highest growth of the Aboriginal population between 2006 and 2011 was Surf Coast, with an increase of 77% (62 persons). The area with the lowest growth was Glenelg; its Aboriginal population increasing by 10% (or 37 persons).
Figure 7 2011 population of Aboriginal persons in BSW
18 Victorian Admitted Episodes Dataset 19 Data based on BSW mothers who gave birth at Victorian public or private health services (does not include those mothers who
gave birth interstate or overseas). 20 Census of Population and Housing 2011, Australian Bureau of Statistics 21 Census of Population and Housing 2011, Australian Bureau of Statistics
Page 21
Barwon-South Western Region Health and Wellbeing Workforce Planning Model and Process
Age profile
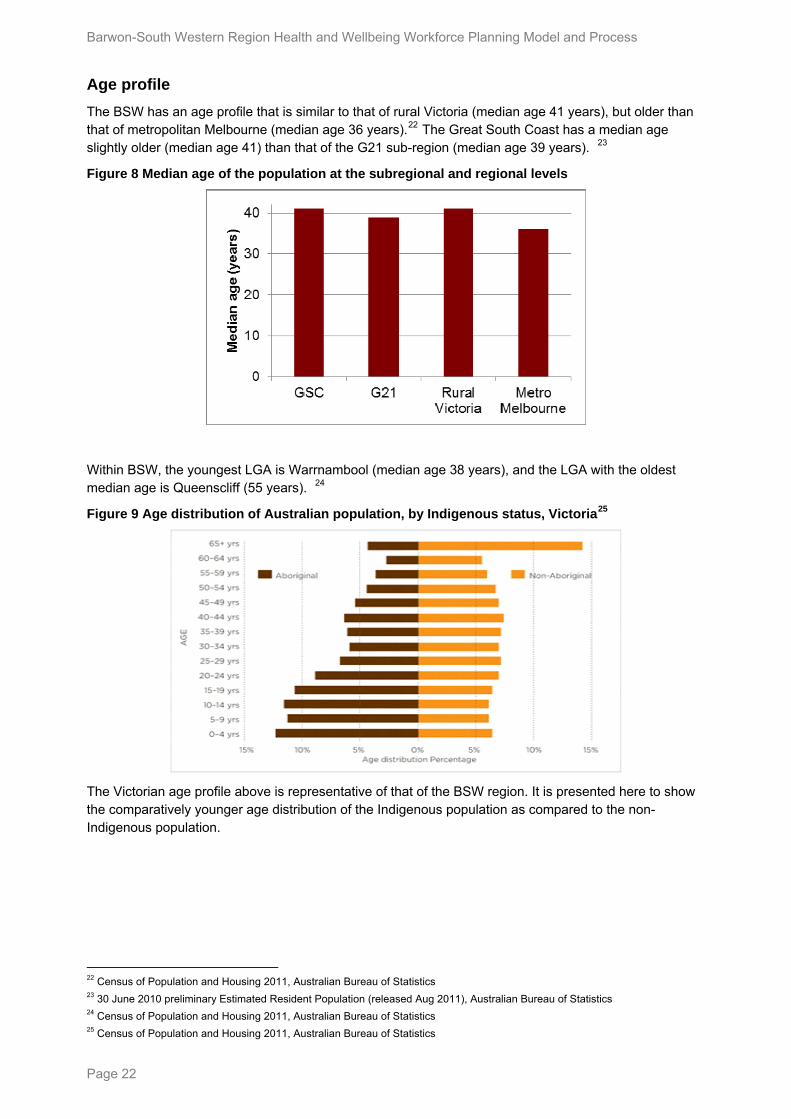
The BSW has an age profile that is similar to that of rural Victoria (median age 41 years), but older than that of metropolitan Melbourne (median age 36 years).22 The Great South Coast has a median age slightly older (median age 41) than that of the G21 sub-region (median age 39 years). 23
Figure 8 Median age of the population at the subregional and regional levels
Within BSW, the youngest LGA is Warrnambool (median age 38 years), and the LGA with the oldest median age is Queenscliff (55 years). 24
Figure 9 Age distribution of Australian population, by Indigenous status, Victoria25
The Victorian age profile above is representative of that of the BSW region. It is presented here to show the comparatively younger age distribution of the Indigenous population as compared to the non-Indigenous population.
22 Census of Population and Housing 2011, Australian Bureau of Statistics 23 30 June 2010 preliminary Estimated Resident Population (released Aug 2011), Australian Bureau of Statistics 24 Census of Population and Housing 2011, Australian Bureau of Statistics 25 Census of Population and Housing 2011, Australian Bureau of Statistics
Page 22
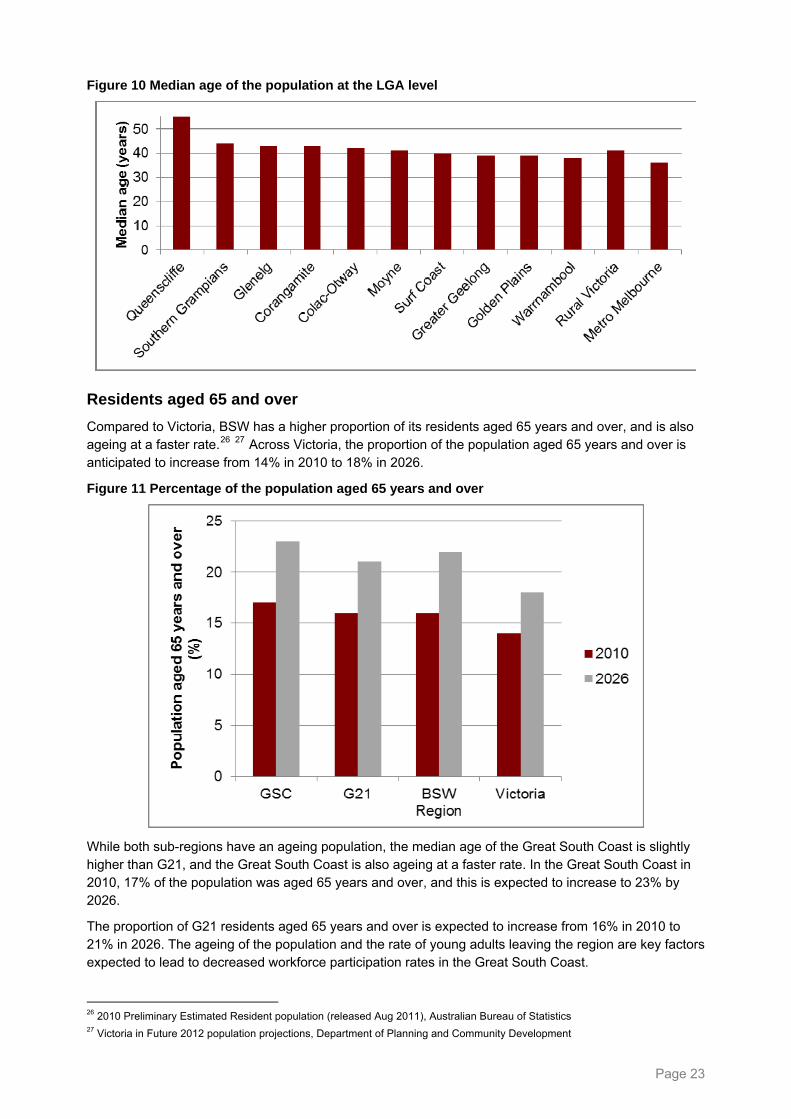
Figure 10 Median age of the population at the LGA level
Residents aged 65 and over
Compared to Victoria, BSW has a higher proportion of its residents aged 65 years and over, and is also ageing at a faster rate.26 27 Across Victoria, the proportion of the population aged 65 years and over is anticipated to increase from 14% in 2010 to 18% in 2026.
Figure 11 Percentage of the population aged 65 years and over
While both sub-regions have an ageing population, the median age of the Great South Coast is slightly higher than G21, and the Great South Coast is also ageing at a faster rate. In the Great South Coast in 2010, 17% of the population was aged 65 years and over, and this is expected to increase to 23% by 2026.
The proportion of G21 residents aged 65 years and over is expected to increase from 16% in 2010 to 21% in 2026. The ageing of the population and the rate of young adults leaving the region are key factors expected to lead to decreased workforce participation rates in the Great South Coast.
26 2010 Preliminary Estimated Resident population (released Aug 2011), Australian Bureau of Statistics 27 Victoria in Future 2012 population projections, Department of Planning and Community Development
Page 23
Barwon-South Western Region Health and Wellbeing Workforce Planning Model and Process
The BSW Health and Wellbeing Workforce Strategy 2012-2022 provides a bridging framework for health, wellbeing and education and training sector organisations to connect and develop their organisational business and service plans, workforce, ICT plans and infrastructure plans in an aligned and value adding way.
Dependency ratio
The ratio of dependent elderly in BSW is expected to increase from around 26% in 2011 to 36% in 2026. Over this fifteen year period the ratio of retirees to working age people will rise from 1:4 to 1:2. Such an increase in the proportion of dependent elderly people may also bring with it a shortage in the numbers of carers and volunteers. This follows the trend of the ageing of the population to 2026 across the region.28 29
Education and training
A lower proportion of the BSW population has completed year 12 education (41%) compared with Victoria (52%), but the rates of completion of a vocational qualification are similar for the BSW population (25%), rural Victoria (25%) and Victoria as a whole (23%).
Comparing education and training for the two sub-regions, the year 12 education completion rate is lower in Great South Coast (35%) than in G21 (44%).30 The proportion of the population that has completed a vocational qualification is 24% in Great South Coast and 25% in G21.
Unemployment
The unemployment rates of BSW and Victoria are similar (5.1% and 5.2% respectively). Unemployment is lower in Great South Coast (4.6%) than in G21 (5.3%).31 In March 2012, unemployment rates ranged from 2.2% in Queenscliffe to 9.0% in Corio-Inner (in Greater Geelong).32
Disadvantage
The LGAs with the highest levels of disadvantage among the BSW population are Glenelg and Colac-Otway (ranked 14 and 18 in Victoria respectively, where 1=most disadvantaged LGA in Victoria, and 79=least disadvantaged LGA in Victoria). Surf Coast and Queenscliff are the LGAs of least disadvantage in the BSW (ranked 74 and 67 respectively).33
Industry analysis
Health care and social assistance is the industry that employs the largest proportion of workers in BSW (15.1%), followed by manufacturing (13.9%). This profile changes at the sub-regional level however.
While the agriculture, forestry and fishing industry employs 4.8% of workers in the BSW as a whole, in the Great South Coast this increases to 17% (and up to 20 - 30% in some LGAs such as Southern Grampians, Corangamite, and Moyne).34 In Geelong 11.2% of the jobs are in manufacturing (and the associated supply chain industries).
28 Derived from Estimated Resident Population, 2000-2010, ABS; Projections – Victoria in Future 2012, Department of Planning
and Community Development. In Barwon-South Western Region Health & Wellbeing Workforce profile (2012). 29 The ratio of dependent elderly will increase in GSC from 26% to 39% between 2011 and 2026. In the G21 sub-region, the ratio of
dependent elderly will increase from 25% in 2011 to 35% in 2026. 30 Census of Population and Housing, Australian Bureau of Statistics 31 Small Area Labour Market analysis, Department of Employment & Workplace Relations 32 Quarterly Labour Force Survey, Australian Bureau of Statistics 33 Index of Relative Socio-economic disadvantage, Census of Population and Housing 2006, Australian Bureau of Statistics 34 Labour Force Data, four quarter average, Australian Bureau of Statistics , 2012
Page 24
Life expectancy
People living in the BSW have an average life expectancy (males=79.4 years, females=84.0 years) which is shorter than the average life expectancy for the State of Victoria (males=80.3 years, females=84.4 years), but longer than the average life expectancy of rural Victorians (males=78.9 years, females=83.8 years). 35
Within BSW, the populations of Glenelg and Corangamite have among the lowest average life expectancies in Victoria, and the Surf Coast ranks among the highest average life expectancies in Victoria.
Avoidable mortality
Those in the BSW have higher levels of avoidable mortality than in Victoria as a whole. Avoidable mortality describes deaths that could have been prevented through disease prevention activities or the use of available health care.36 The main causes of avoidable deaths for both males and females are ischaemic heart disease, lung cancer and colorectal cancer. Other main causes of avoidable death for males are suicide and road traffic accidents. For females, death from breast cancer, stroke and chronic obstructive pulmonary disease are the other main causes. 37
Within the BSW, people in the Great South Coast have a higher incidence of avoidable mortality than those in G21 (avoidable mortality rate per 100,000 persons; males: Great South Coast=235.5, G21=205.6, VIC=188.3; females: Great South Coast=128.0, G21=123.9, VIC=109.7).38 This may be partially attributed to the high proportion of those in Great South Coast employed in the agriculture, forestry and fishing industry, or the long driving distances in this sub-region.
Differences in avoidable mortality rates between the two sub-regions are particularly evident when the road traffic injury and suicide mortality rates are considered. The mortality rate for males from road traffic injuries is 23.6 per 100,000 persons in Great South Coast, more than double that for G21 (11.1) and Victoria (10.3).
The rate of suicide is also higher in Great South Coast than G21, particularly for males (Great South Coast=20.4 per 100,000 persons, G21=16.3). This may have implications for the mental health and alcohol and other drug workforce in the Great South Coast sub-region.
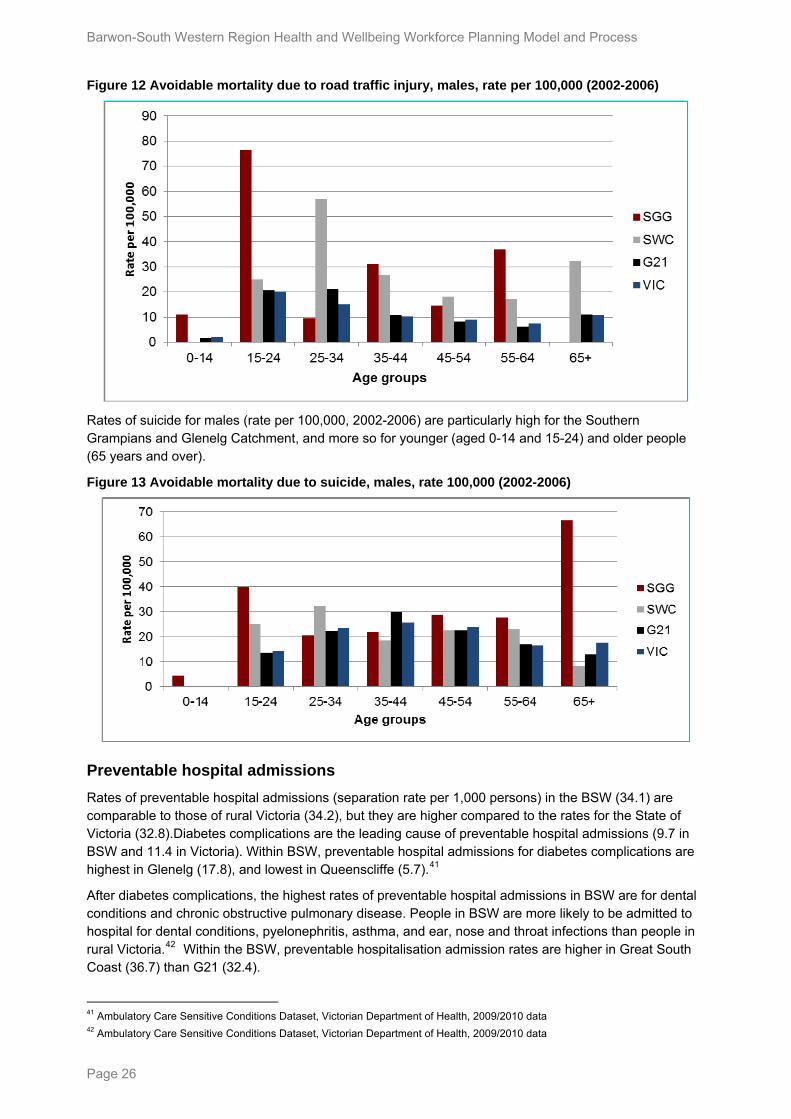
Differences between the sub-regions are also evident when avoidable mortality for males due road traffic injury and suicide is broken down by age group.39 40 Rates of avoidable mortality due to road traffic injuries are high in the Southern Grampians and Glenelg Catchment and the South West Catchment, particularly for younger people.
35 Life expectancy at birth: Victoria 2007 36 Potentially Avoidable Deaths, 1370.0-Measures of Australia’s Progress, 2010, Australian Bureau of Statistics 37 Victorian Health Information Surveillance System, Victorian Department of Health, 2002-2006 38 Victorian Health Information Surveillance System, Victorian Department of Health, 2002-2006 39 Data were not available at the LGA level, and so is grouped at the catchment level. The Southern Grampians and Glenelg (SGG)
catchment includes the LGAs of Southern Grampians and Glenelg. The South West Catchment (SWC) includes the LGAs of Warrnambool, Corangamite and Moyne. G21 includes the LGAs of Greater Geelong, Surf Coast, Queenscliff and Golden Plains.
40 Victorian Health Information Surveillance System, Victorian Department of Health
Page 25
Barwon-South Western Region Health and Wellbeing Workforce Planning Model and Process
Figure 12 Avoidable mortality due to road traffic injury, males, rate per 100,000 (2002-2006)
Rates of suicide for males (rate per 100,000, 2002-2006) are particularly high for the Southern Grampians and Glenelg Catchment, and more so for younger (aged 0-14 and 15-24) and older people (65 years and over).
Figure 13 Avoidable mortality due to suicide, males, rate 100,000 (2002-2006)
Preventable hospital admissions
Rates of preventable hospital admissions (separation rate per 1,000 persons) in the BSW (34.1) are comparable to those of rural Victoria (34.2), but they are higher compared to the rates for the State of Victoria (32.8).Diabetes complications are the leading cause of preventable hospital admissions (9.7 in BSW and 11.4 in Victoria). Within BSW, preventable hospital admissions for diabetes complications are highest in Glenelg (17.8), and lowest in Queenscliffe (5.7).41
After diabetes complications, the highest rates of preventable hospital admissions in BSW are for dental conditions and chronic obstructive pulmonary disease. People in BSW are more likely to be admitted to hospital for dental conditions, pyelonephritis, asthma, and ear, nose and throat infections than people in rural Victoria.42 Within the BSW, preventable hospitalisation admission rates are higher in Great South Coast (36.7) than G21 (32.4).
41 Ambulatory Care Sensitive Conditions Dataset, Victorian Department of Health, 2009/2010 data 42 Ambulatory Care Sensitive Conditions Dataset, Victorian Department of Health, 2009/2010 data
Page 26
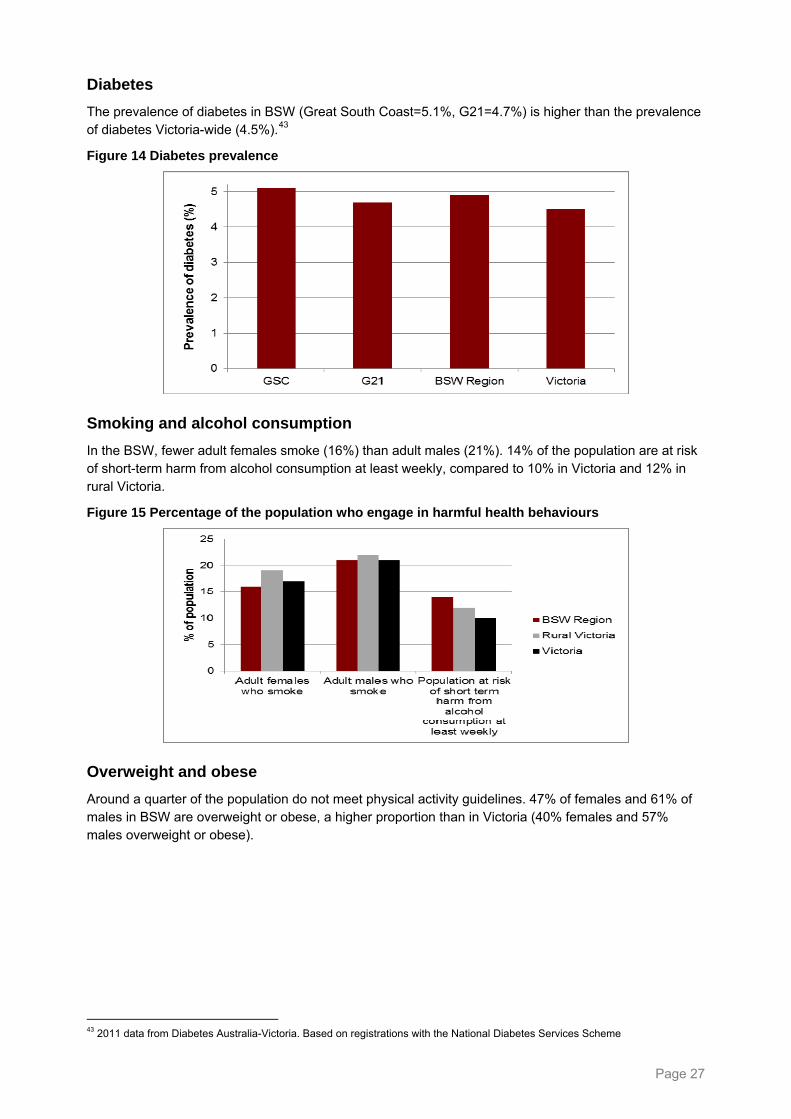
Diabetes
The prevalence of diabetes in BSW (Great South Coast=5.1%, G21=4.7%) is higher than the prevalence of diabetes Victoria-wide (4.5%).43
Figure 14 Diabetes prevalence
Smoking and alcohol consumption
In the BSW, fewer adult females smoke (16%) than adult males (21%). 14% of the population are at risk of short-term harm from alcohol consumption at least weekly, compared to 10% in Victoria and 12% in rural Victoria.
Figure 15 Percentage of the population who engage in harmful health behaviours
Overweight and obese
Around a quarter of the population do not meet physical activity guidelines. 47% of females and 61% of males in BSW are overweight or obese, a higher proportion than in Victoria (40% females and 57% males overweight or obese).
43 2011 data from Diabetes Australia-Victoria. Based on registrations with the National Diabetes Services Scheme
Page 27
Barwon-South Western Region Health and Wellbeing Workforce Planning Model and Process
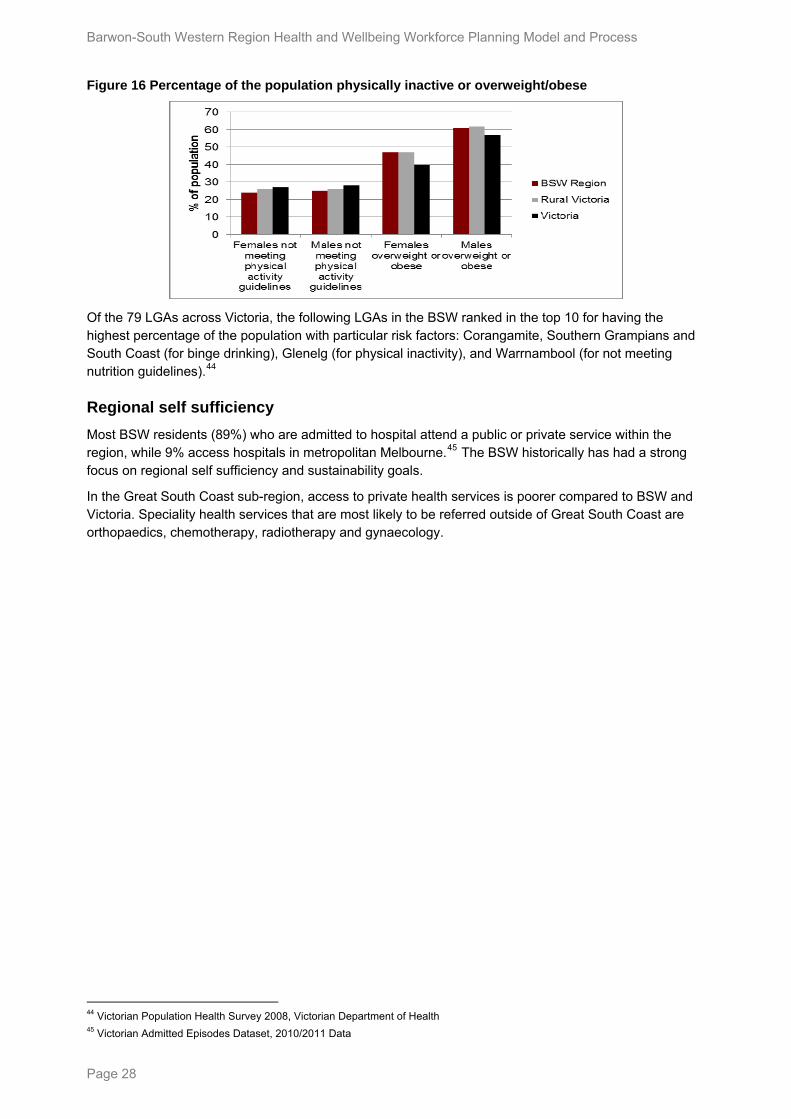
Figure 16 Percentage of the population physically inactive or overweight/obese
Of the 79 LGAs across Victoria, the following LGAs in the BSW ranked in the top 10 for having the highest percentage of the population with particular risk factors: Corangamite, Southern Grampians and South Coast (for binge drinking), Glenelg (for physical inactivity), and Warrnambool (for not meeting nutrition guidelines).44
Regional self sufficiency
Most BSW residents (89%) who are admitted to hospital attend a public or private service within the region, while 9% access hospitals in metropolitan Melbourne.45 The BSW historically has had a strong focus on regional self sufficiency and sustainability goals.
In the Great South Coast sub-region, access to private health services is poorer compared to BSW and Victoria. Speciality health services that are most likely to be referred outside of Great South Coast are orthopaedics, chemotherapy, radiotherapy and gynaecology.
44 Victorian Population Health Survey 2008, Victorian Department of Health 45 Victorian Admitted Episodes Dataset, 2010/2011 Data
Page 28
The BSW Region health and wellbeing workforce46 The purpose of this section is to provide a preliminary analysis of the available public health sector State Services Authority workforce data, to examine how it can inform the work on the Strategy and plans and, and what gaps in data can be identified at this early stage.47
Skilled health worker increases 2009 – 2011
Numbers of staff employed by regional and sub-regional health service providers in the BSW region increased between 2009 and 2011. Taking all the BSW regional health services together, there was an 8% increase in staff, but numbers of staff employed by rural health services decreased by 3%.
Over all, small rural health services saw a 6% increase in staff. This ranged between 3% in Great South Coast and 11% in G21. Some increased by a large percentage (eg Hesse Rural Health Service increased by 139%), and some decreased (eg Lorne Community Hospital saw a 23% decrease in staff).
More than 80% of the workforce growth in the BSW can be attributed to the regional public hospital, Barwon Health.
Industry position
The health and community services sector is expected to rise from being the third largest employer to the second largest across the region over the coming decade.
Major employers
Barwon Health is the largest regional employer (employing 61% of the total public sector workforce), with South West Healthcare (16%) and Western District health Service (8%) being the next largest. 85% of the public sector health workers employed in these three organisations.
Understanding this presents these employers with the opportunity to engage in collaborative workforce planning, recruitment, contracting and student placement activities (eg placements in a variety of rural and regional settings, supports for supervision, recruitment opportunities, etc).
Comparatively fewer health professionals are employed by sub-regional health services (24%), rural health services (8%), or by small rural health services (7%).Barwon Health, based in Geelong, employs 56% of the region’s nurses and midwives, 83% of its medical practitioners, 71% allied health, 75% oral health, and 48% of other support workers in the BSW region.
Sub-regional analysis
In the Great South Coast sub-region, 72% of health workers are employed by South West Healthcare and Western District Health Service (sub-regional health services). 12% are employed by the rural health service (Portland District Health), and 16% by small rural health services.
In G21, Barwon Health employs 90% of the health workforce. 7% are employed by Colac Area Health (the rural health service), and 4% by small rural health services.
46 Public agency response to annual workforce survey, Victorian State Workforce Services Authority, 2011 47 Limitations of the data should be noted. No workforce data were available for the private and not-for-profit sectors at the local
level. More complete data would be required to understand how health and aged care need are currently being met and the perceived gaps and barriers to meet them. In addition, the private and not-for-profit sectors may have implemented innovative strategies to make better use of the workforce at the local or regional subregional or community levels.
Page 29
Barwon-South Western Region Health and Wellbeing Workforce Planning Model and Process
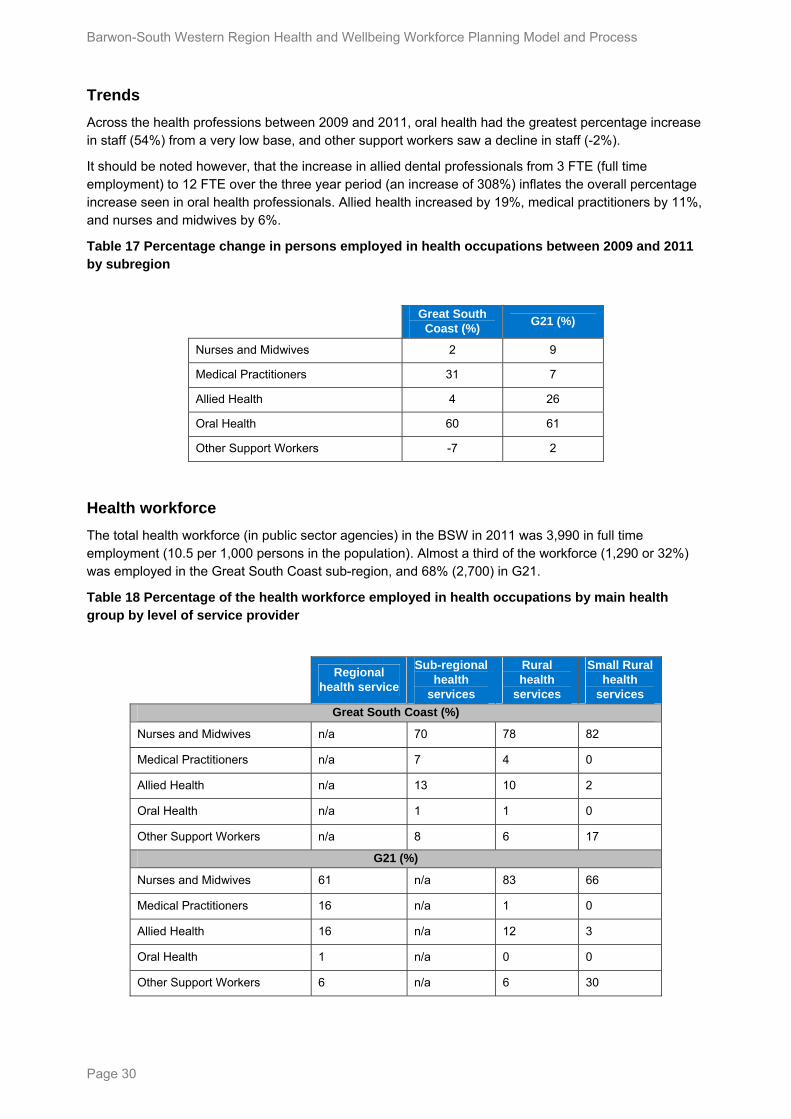
Trends
Across the health professions between 2009 and 2011, oral health had the greatest percentage increase in staff (54%) from a very low base, and other support workers saw a decline in staff (-2%).
It should be noted however, that the increase in allied dental professionals from 3 FTE (full time employment) to 12 FTE over the three year period (an increase of 308%) inflates the overall percentage increase seen in oral health professionals. Allied health increased by 19%, medical practitioners by 11%, and nurses and midwives by 6%.
Table 17 Percentage change in persons employed in health occupations between 2009 and 2011 by subregion
Great South
Coast (%) G21 (%)
Nurses and Midwives 2 9
Medical Practitioners 31 7
Allied Health 4 26
Oral Health 60 61
Other Support Workers -7 2
Health workforce
The total health workforce (in public sector agencies) in the BSW in 2011 was 3,990 in full time employment (10.5 per 1,000 persons in the population). Almost a third of the workforce (1,290 or 32%) was employed in the Great South Coast sub-region, and 68% (2,700) in G21.
Table 18 Percentage of the health workforce employed in health occupations by main health group by level of service provider
Regional
health service
Sub-regional health
services
Rural health
services
Small Rural health
services
Great South Coast (%)
Nurses and Midwives n/a 70 78 82
Medical Practitioners n/a 7 4 0
Allied Health n/a 13 10 2
Oral Health n/a 1 1 0
Other Support Workers n/a 8 6 17
G21 (%)
Nurses and Midwives 61 n/a 83 66
Medical Practitioners 16 n/a 1 0
Allied Health 16 n/a 12 3
Oral Health 1 n/a 0 0
Other Support Workers 6 n/a 6 30
Page 30
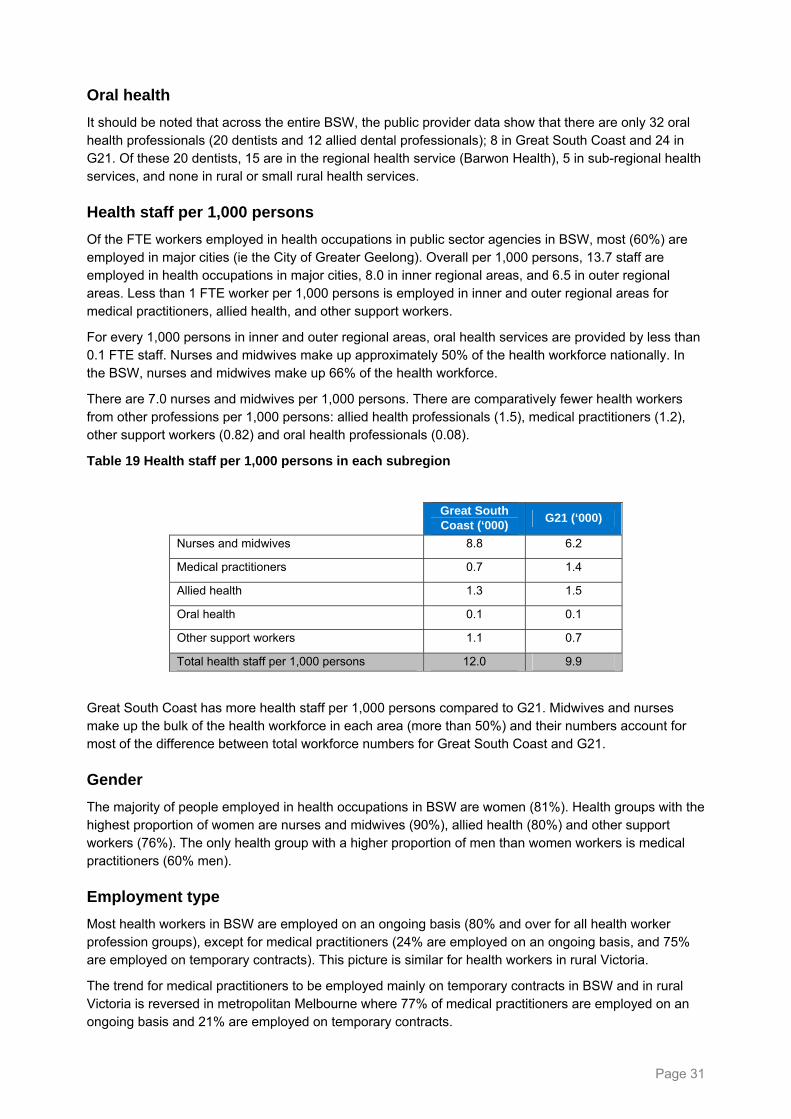
Oral health
It should be noted that across the entire BSW, the public provider data show that there are only 32 oral health professionals (20 dentists and 12 allied dental professionals); 8 in Great South Coast and 24 in G21. Of these 20 dentists, 15 are in the regional health service (Barwon Health), 5 in sub-regional health services, and none in rural or small rural health services.
Health staff per 1,000 persons
Of the FTE workers employed in health occupations in public sector agencies in BSW, most (60%) are employed in major cities (ie the City of Greater Geelong). Overall per 1,000 persons, 13.7 staff are employed in health occupations in major cities, 8.0 in inner regional areas, and 6.5 in outer regional areas. Less than 1 FTE worker per 1,000 persons is employed in inner and outer regional areas for medical practitioners, allied health, and other support workers.
For every 1,000 persons in inner and outer regional areas, oral health services are provided by less than 0.1 FTE staff. Nurses and midwives make up approximately 50% of the health workforce nationally. In the BSW, nurses and midwives make up 66% of the health workforce.
There are 7.0 nurses and midwives per 1,000 persons. There are comparatively fewer health workers from other professions per 1,000 persons: allied health professionals (1.5), medical practitioners (1.2), other support workers (0.82) and oral health professionals (0.08).
Table 19 Health staff per 1,000 persons in each subregion
Great South Coast (‘000)
G21 (‘000)
Nurses and midwives 8.8 6.2
Medical practitioners 0.7 1.4
Allied health 1.3 1.5
Oral health 0.1 0.1
Other support workers 1.1 0.7
Total health staff per 1,000 persons 12.0 9.9
Great South Coast has more health staff per 1,000 persons compared to G21. Midwives and nurses make up the bulk of the health workforce in each area (more than 50%) and their numbers account for most of the difference between total workforce numbers for Great South Coast and G21.
Gender
The majority of people employed in health occupations in BSW are women (81%). Health groups with the highest proportion of women are nurses and midwives (90%), allied health (80%) and other support workers (76%). The only health group with a higher proportion of men than women workers is medical practitioners (60% men).
Employment type
Most health workers in BSW are employed on an ongoing basis (80% and over for all health worker profession groups), except for medical practitioners (24% are employed on an ongoing basis, and 75% are employed on temporary contracts). This picture is similar for health workers in rural Victoria.
The trend for medical practitioners to be employed mainly on temporary contracts in BSW and in rural Victoria is reversed in metropolitan Melbourne where 77% of medical practitioners are employed on an ongoing basis and 21% are employed on temporary contracts.
Page 31
Barwon-South Western Region Health and Wellbeing Workforce Planning Model and Process
Page 32
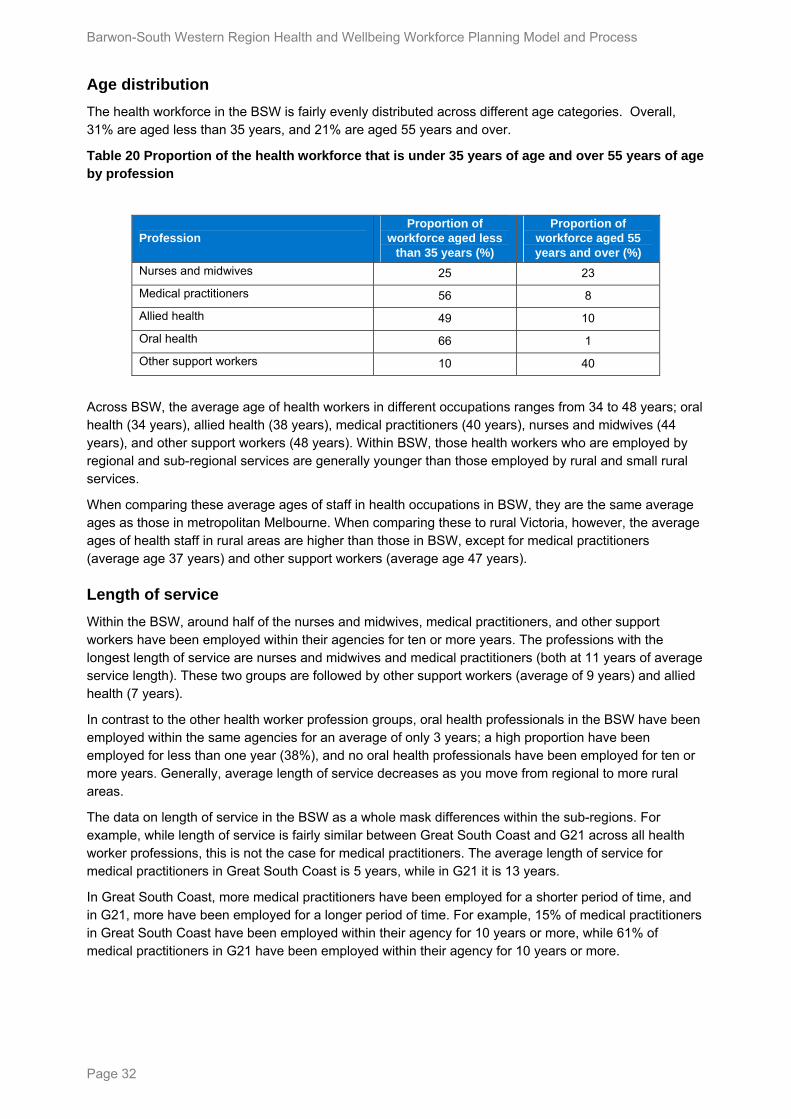
Age distribution
The health workforce in the BSW is fairly evenly distributed across different age categories. Overall, 31% are aged less than 35 years, and 21% are aged 55 years and over.
Table 20 Proportion of the health workforce that is under 35 years of age and over 55 years of age by profession
Profession Proportion of
workforce aged less than 35 years (%)
Proportion of workforce aged 55 years and over (%)
Nurses and midwives 25 23
Medical practitioners 56 8
Allied health 49 10
Oral health 66 1
Other support workers 10 40
Across BSW, the average age of health workers in different occupations ranges from 34 to 48 years; oral health (34 years), allied health (38 years), medical practitioners (40 years), nurses and midwives (44 years), and other support workers (48 years). Within BSW, those health workers who are employed by regional and sub-regional services are generally younger than those employed by rural and small rural services.
When comparing these average ages of staff in health occupations in BSW, they are the same average ages as those in metropolitan Melbourne. When comparing these to rural Victoria, however, the average ages of health staff in rural areas are higher than those in BSW, except for medical practitioners (average age 37 years) and other support workers (average age 47 years).
Length of service
Within the BSW, around half of the nurses and midwives, medical practitioners, and other support workers have been employed within their agencies for ten or more years. The professions with the longest length of service are nurses and midwives and medical practitioners (both at 11 years of average service length). These two groups are followed by other support workers (average of 9 years) and allied health (7 years).
In contrast to the other health worker profession groups, oral health professionals in the BSW have been employed within the same agencies for an average of only 3 years; a high proportion have been employed for less than one year (38%), and no oral health professionals have been employed for ten or more years. Generally, average length of service decreases as you move from regional to more rural areas.
The data on length of service in the BSW as a whole mask differences within the sub-regions. For example, while length of service is fairly similar between Great South Coast and G21 across all health worker professions, this is not the case for medical practitioners. The average length of service for medical practitioners in Great South Coast is 5 years, while in G21 it is 13 years.
In Great South Coast, more medical practitioners have been employed for a shorter period of time, and in G21, more have been employed for a longer period of time. For example, 15% of medical practitioners in Great South Coast have been employed within their agency for 10 years or more, while 61% of medical practitioners in G21 have been employed within their agency for 10 years or more.
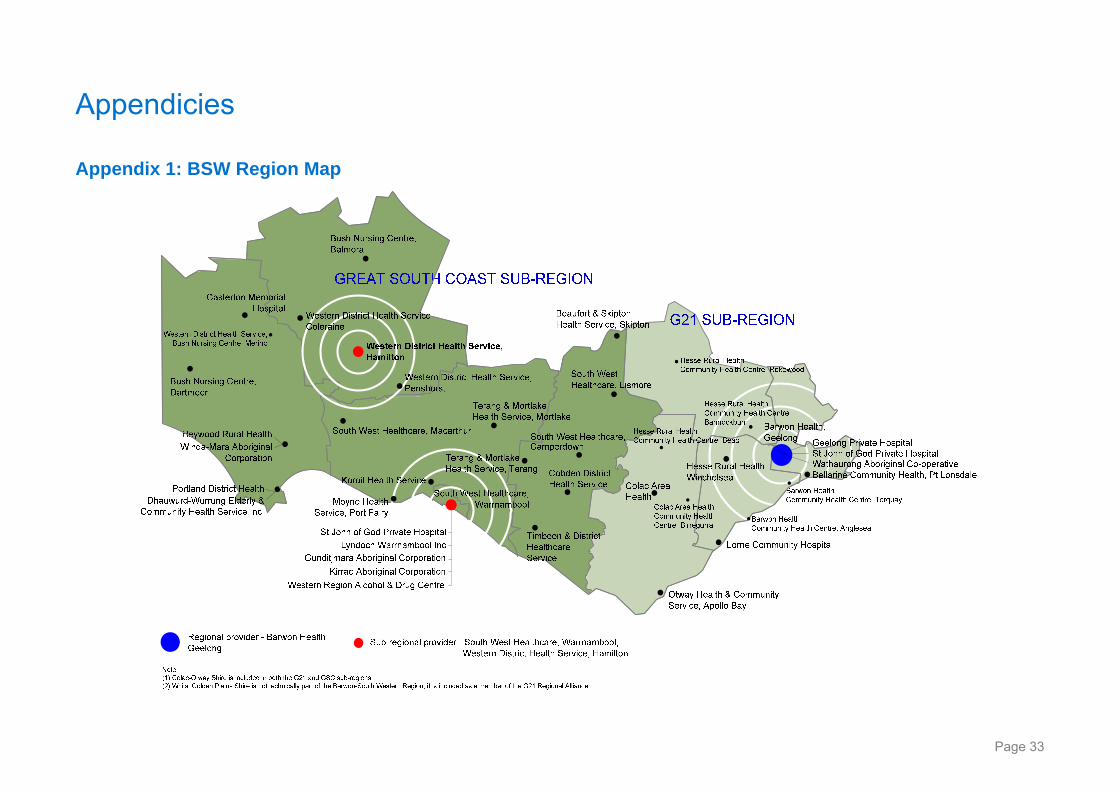
Appendicies
Appendix 1: BSW Region Map
Page 33
Barwon-South Western Region Health and Wellbeing Workforce Planning Model and Process
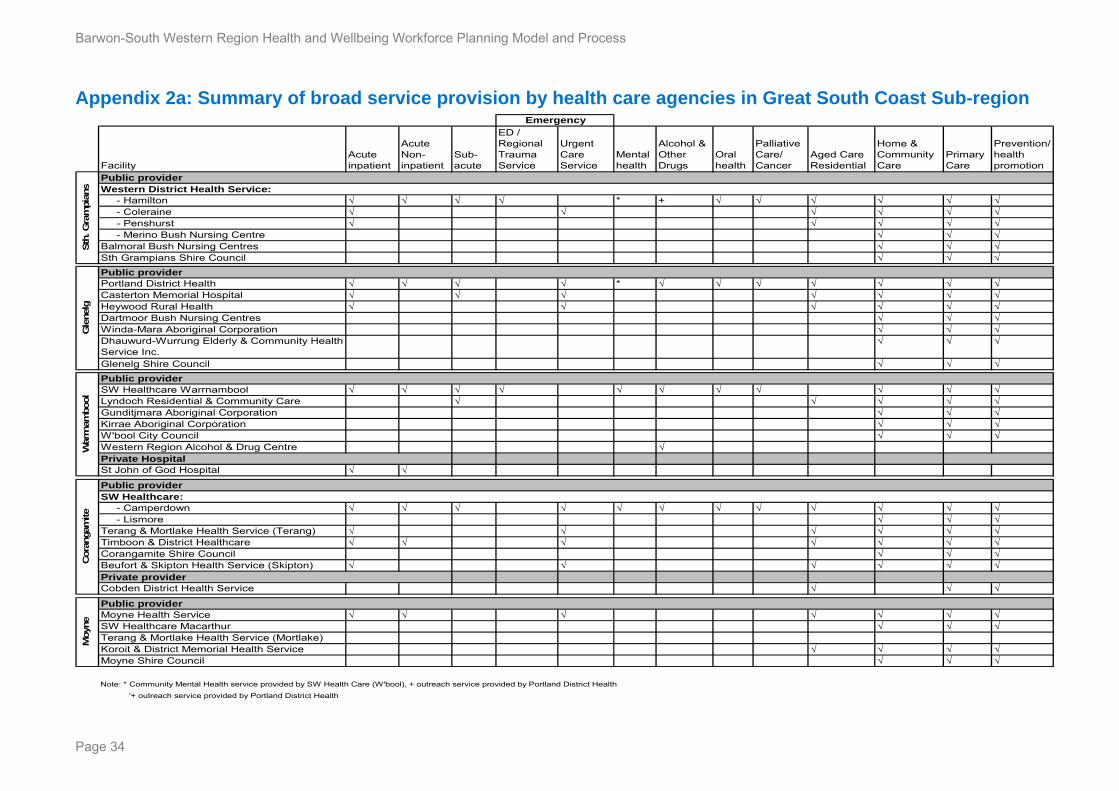
Appendix 2a: Summary of broad service provision by health care agencies in Great South Coast Sub-region
FacilityAcute inpatient
Acute Non-inpatient
Sub-acute
ED / Regional Trauma Service
Urgent Care Service
Mental health
Alcohol & Other Drugs
Oral health
Palliative Care/ Cancer
Aged Care Residential
Home & Community Care
Primary Care
Prevention/ health promotion
- Hamilton √ √ √ √ * + √ √ √ √ √ √ - Coleraine √ √ √ √ √ √ - Penshurst √ √ √ √ √ - Merino Bush Nursing Centre √ √ √Balmoral Bush Nursing Centres √ √ √Sth Grampians Shire Council √ √ √
Portland District Health √ √ √ √ * √ √ √ √ √ √ √Casterton Memorial Hospital √ √ √ √ √ √ √Heywood Rural Health √ √ √ √ √ √Dartmoor Bush Nursing Centres √ √ √Winda-Mara Aboriginal Corporation √ √ √Dhauwurd-Wurrung Elderly & Community Health Service Inc.
√ √ √
Glenelg Shire Council √ √ √
SW Healthcare Warrnambool √ √ √ √ √ √ √ √ √ √ √Lyndoch Residential & Community Care √ √ √ √ √Gunditjmara Aboriginal Corporation √ √ √Kirrae Aboriginal Corporation √ √ √W'bool City Council √ √ √Western Region Alcohol & Drug Centre √
St John of God Hospital √ √
- Camperdown √ √ √ √ √ √ √ √ √ √ √ √ - Lismore √ √ √Terang & Mortlake Health Service (Terang) √ √ √ √ √ √Timboon & District Healthcare √ √ √ √ √ √ √Corangamite Shire Council √ √ √Beufort & Skipton Health Service (Skipton) √ √ √ √ √ √
Cobden District Health Service √ √ √
Moyne Health Service √ √ √ √ √ √ √SW Healthcare Macarthur √ √ √Terang & Mortlake Health Service (Mortlake)Koroit & District Memorial Health Service √ √ √ √Moyne Shire Council √ √ √
Note: * Community Mental Health service provided by SW Health Care (W'bool), + outreach service provided by Portland District Health
'+ outreach service provided by Portland District Health
Moyn
e
Public provider
Emergency
Cora
ngam
ite
Public providerSW Healthcare:
Private provider
War
rnam
bool
Public provider
Private Hospital
Sth
. Gra
mpia
ns
Public provider
Gle
nelg
Western District Health Service: Public provider
Page 34
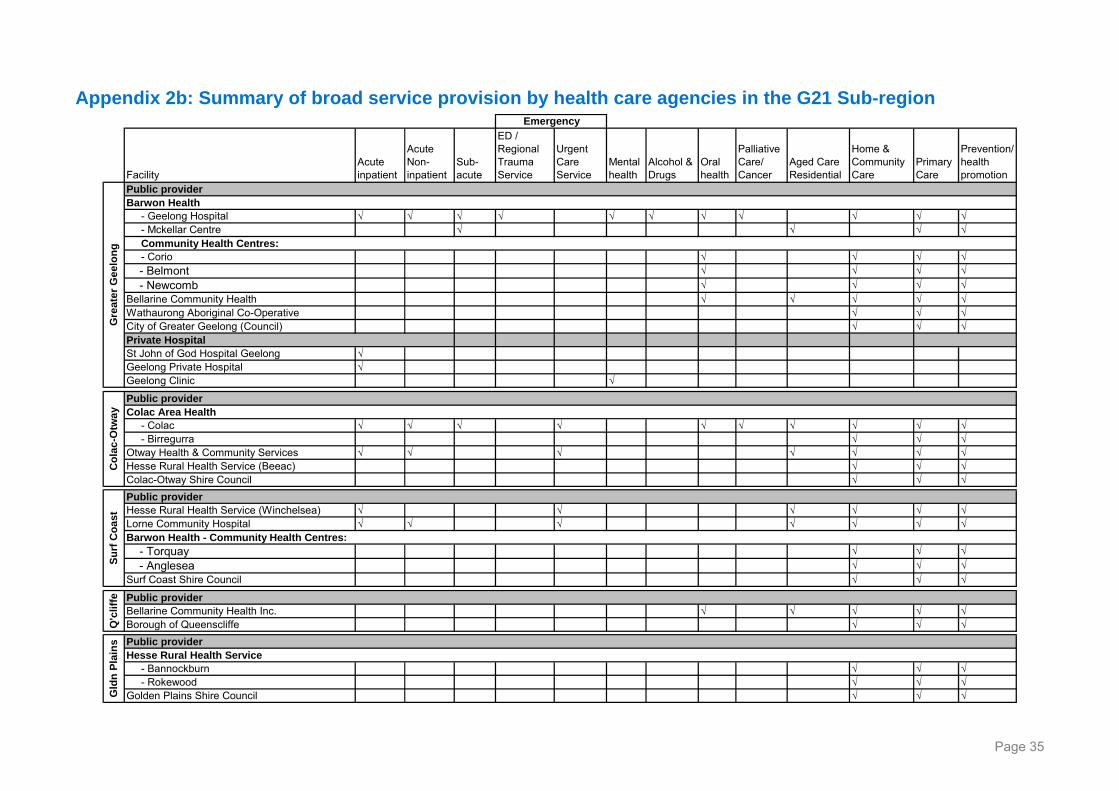
Page 35
FacilityAcute inpatient
Acute Non-inpatient
Sub-acute
ED / Regional Trauma Service
Urgent Care Service
Mental health
Alcohol & Drugs
Oral health
Palliative Care/ Cancer
Aged Care Residential
Home & Community Care
Primary Care
Prevention/ health promotion
- Geelong Hospital √ √ √ √ √ √ √ √ √ √ √ - Mckellar Centre √ √ √ √
- Corio √ √ √ √ - Belmont √ √ √ √ - Newcomb √ √ √ √Bellarine Community Health √ √ √ √ √Wathaurong Aboriginal Co-Operative √ √ √City of Greater Geelong (Council) √ √ √
St John of God Hospital Geelong √Geelong Private Hospital √Geelong Clinic √
- Colac √ √ √ √ √ √ √ √ √ √ - Birregurra √ √ √Otway Health & Community Services √ √ √ √ √ √ √Hesse Rural Health Service (Beeac) √ √ √Colac-Otway Shire Council √ √ √
Hesse Rural Health Service (Winchelsea) √ √ √ √ √ √Lorne Community Hospital √ √ √ √ √ √ √
- Torquay √ √ √ - Anglesea √ √ √Surf Coast Shire Council √ √ √
Bellarine Community Health Inc. √ √ √ √ √Borough of Queenscliffe √ √ √
- Bannockburn √ √ √ - Rokewood √ √ √Golden Plains Shire Council √ √ √
Emergency
Colac Area Health
Hesse Rural Health Service
Barwon Health - Community Health Centres:
Community Health Centres:
Gld
n P
lain
s Public provider
Gre
ate
r G
eel
on
gS
urf
Co
ast
Barwon Health
Co
lac
-Otw
ay
Public provider
Public provider
Private Hospital
Public provider
Q'c
liffe Public provider
Appendix 2b: Summary of broad service provision by health care agencies in the G21 Sub-region
Barwon-South Western Region Health and Wellbeing Workforce Planning Model and Process
References
Productivity Commission: Australia's Health Workforce Canberra: Productivity Commission; 2005.
Birch, S., Kephart, G., Tomblin-Murphy, G., O’Brien-Pallas, G., Adler, R. & MacKenzie, A. (2007). Human Resources Planning and the Production of Health: A Needs-based Analytical Framework. Canadian Public Policy, 33, s1 – s16.
Brooks, P. M. (2012). Do Available Predictions of Future Medical Workforce Provide a Sensible Basis for Planning? Yes. Medical Journal of Australia, 197, 266.
Curson, J. A., Dell, M. E., Wilson, R. A., Bosworth, D. L., & Baldauf, B. (2010). Who does workforce planning well? Workforce review team rapid review summary. International Journal of Health Care, 23, 110 – 119.
Duckett, S. J. (2005). Health Workforce Design for the 21st Century. Australian Health Review, 29, 201 – 210.
Dussault, G., Buchan, J., Sermeus, W. & Padaiga, Z. (2010). Assessing future health workforce needs. Geneva: European Obserrvatory on Health Systems and Policies, World Health Organisation.
Fraher, E. P., Harden, B., Kimball, M. C. (2011). An International Call to Arms to Improve Allied Health Workforce Planning. International Allied Health Workforce Planning, 43 – 49.
Gorman, D. F. (2012). Towards a sustainable and fit-for-purpose health workforce – lessons from New Zealand. Medical Journal of Australia, 1, 32 – 36.
Gorman, D. F. & Brooks, P. M. (2009). On solutions to the shortage of doctors in Australia and New Zealand. Health Care Reform, 190, 152 – 156.
Grueningen, M. V., Batenburg, R. S. & Van der Velden, L. F. J. (2012). Ten years of health workforce planning in the Netherlands: A tentative evaluation of GP planning as an example. Human Resources for Health, 10, 1 – 15.
Health Workforce Australia (2011). National Health Workforce Innovation and Reform Strategic Framework for Action 2011-2015. Adelaide: HWA.
Humphreys, J. S., Wakerman, J., Wells, R., Kuipers, P., Jones, J. A., & Entwistle, P. (2008). " Beyond workforce": a systemic solution for health service provision in small rural and remote communities. Medical Journal of Australia, 188(8), 77.
Masnick, K. & McDonnell, G. (2010). A model linking clinical workforce skill mix planning to health and healthcare dynamics. Human Resources for Health, 8, 1 – 10.
Maynard, A. (2006). Medical Workforce Planning: Some Forecasting Challenges. The Australian Economic Review, 39, 323 – 329.
National Health Workforce Planning and Research Collaboration (2010). Refining the National Workforce Planning Model. Adelaide: HWA.
National Health Workforce Planning and Research Collaboration (2011). Alternative Approaches to Health Workforce Planning. Adelaide: HWA.
Parsons, D. (2010). Medical workforce planning: an art or a science? The difficult problem of matching supply and demand. Human Resource Management International Digest, 18, 36 – 38.
Roberfroid, D., Leonard, C. & Stordeur, S. (2009). Physician supply forecast: better than peering in a crystal ball? Human Resources for Health, 7, 10 – 22.
Scheffler, R. M., Liu, J. X., Kinfu, Y. & Dal Poz, M. R. (2008). Forecasting the global shortage of physicians: an economic and needs-based approach. Bulletin of World Health Organisation, 86, 516 – 523.
Page 36
Scott, I. A. (2009). Health care workforce crisis in Australia: too few or too disabled? Medical Journal of Australia, 190, 689 – 692.
Segal, L. & Bolton, T. (2009). Issues facing the future health care workforce: the importance of demand modelling. Australia and New Zealand Health Policy, 6, 12 – 19.
Segal, L. & Leach, M. J. (2011). An evidence based health workforce model for primary and community care. Implementation Science, 6, 1 – 8.
Thompson, N., MacRae, A., Brankovich, J., Burns, J., Catto, M., Gray C., Levitan, L., Maling, C., Potter, C., Ride, K., Stumpers, S. & Urquhart, B. Overview of Australian Indigenous health status, 2011. Retrieved 14th November 2012 from http://www.healthinfonet.ecu.edu.au/overview_2012
Wilkins., R., Warren., D., Hahn., M. & Houng., B. 2010. Families, Incomes and Jobs, Volume 5: A Statistical Report on Waves 1 to 7 of the Household, Income and Labour
Melbourne Institute of Applied Economic and Social Research (2001). Household income and labour Dynamics in Australia (HILDA) Survey. Melbourne: The University of Melbourne
Zurn, P., Dal Poz, M. R., Stilwell, B. & Adams, O. (2004). Imbalance in the health workforce. Human Resources for Health, 2, 13 – 24
Page 37

Barwon-South Western Region Health and Wellbeing Workforce Planning Model and Process
Page 38