Mexican employment dynamics evidence from matched firm-worker

i
Worker Programs and Resource Use:
Evidence from Better Work Jordan
A thesis submitted by
Nathan Robins
In partial fulfillment of the requirements for the degree of
Master of Arts
In
Urban and Environmental Policy and Planning
Tufts University
February 2014
Adviser:
Mary Davis, Ph.D.
Reader:
Ann Rappaport, Ph.D
ii
Abstract
This paper examines data collected for the Better Work program in Jordan
which aims to protect laborers in the garment industry from poor working
conditions. Data are examined to look for benefits to the factories participating in
the program beyond improved compliance with labor law. In particular, potential
impacts to firm energy use are examined and correlations are tested between
electricity use rates and measures of worker outcomes and a number of factory
traits such as size and production input costs. Evidence was found to back up
work done in Vietnam with regard to resource use and distribution of electricity
expenses. It was also found that the type of data being collected is not ideal for
examinations of energy, and more direct methods are desirable, and that
considerable production obstacles are worker skill level, electricity prices, and to
a greater degree in Jordan than in previously examined countries, water prices.
Acknowledgements
I would like to thank Mary Davis, who saw me through this process and tolerated
my non-linear production path. Many thanks are owed also to Ann Rappaport for
providing guidance and encouragement on this project and throughout my
academic career. This project would not have been possible without the much
appreciated aid of Tab, diet soda.

iii
Table of Contents and Figures
Abstract ................................................................................................................... ii
Acknowledgements ................................................................................................. ii
Table of Contents and Figures ............................................................................... iii
List of Abbreviations .............................................................................................. v
1. Introduction ................................................................................................... 1
2. Background .................................................................................................... 4
Better Work ..................................................................................................................... 4
Jordan ............................................................................................................................. 5
The Garment Industry ..................................................................................................... 7
Laws and Agreements ..................................................................................................... 8
Electricity and Energy in Jordan .................................................................................. 12
Energy in the Garment Industry ................................................................................... 15
Auxiliary Benefits of Energy Efficiency ........................................................................ 16
3. Methodology ................................................................................................. 18
Better Work Jordan (BWJ) Data Collection ................................................................. 18
Data Selection and Cleaning ........................................................................................ 19
Generated Variables ..................................................................................................... 20
Analysis ......................................................................................................................... 23
4. Results ........................................................................................................... 26
Table 1: Summary Statistics ..................................................................................... 26
Table 2: Number of Factories Surveyed by Year ....................................................... 28
Table 3: Production Categories as Percentages of Total Production Cost................ 29
Table 4: Perception of production cost obstacles to business success .................... 30
Table 5: Perception of Production Management Obstacles to Business’ Success ... 33
Table 6: Distribution of Electricity cost per unit of output (efficiency) .................... 35
Table 7: Better Work Jordan Noncompliance Data .................................................. 36
Table 8: Significant Correlations with Number of Employees .................................. 38
Table 9: Significant correlations with Electricity Cost per unit Output .................... 39
Comparison to Earlier Works ....................................................................................... 41
Table 10: Comparison Statistics: Haiti, Jordan, And Vietnam ................................... 42
Table 11: Distribution of Factories by electricity cost per unit of output (efficiency)
in Jordan and Vietnam .............................................................................................. 45

iv
5. Conclusion .................................................................................................... 47
6. Appendix....................................................................................................... 52
Appendix Table 1: Better Work Jordan Compliance Clusters and Points ................. 52
Appendix Table 2: (Table 5 Extended): Perception of Production Management
Obstacles to Business’ Success ................................................................................. 53
Appendix Table 3: (Table 8 Extended): Correlations with number of employees .... 55
Appendix Table 4: (Table 9 Extended): Correlations with Electricity Cost per unit
Output ....................................................................................................................... 56
Appendix Table 5: Ownership of Jordanian Factories .............................................. 57
Appendix Table 6: Distribution of electrical cost per units produced in Jordan using
Sarewitz Method ....................................................................................................... 57
Appendix 7: Relevant Tables Produced by Rebecca Drejet using the Better Work
Vietnam Dataset ....................................................................................................... 58
Appendix 8: Relevant tables Produced by Maureen Sarewitz using the Better Work
Haiti Dataset ............................................................................................................. 59
7. Bibliography ................................................................................................. 59

v
List of Abbreviations
BWJ Better Work Jordan
EIA Energy Information Administration
EU European Union
GDP Gross Domestic Product
GNP Gross National Product
IFC International Finance Corporation
ILO International Labor Organization
JD Jordanian Dinar
JUSFTA Jordan-United States Free Trade Agreement
NEPCO National Electric Power Company
QIZ Qualifying Industrial Zone
QIZA Qualifying Industrial Zone Act
UN HCR United Nations High Commissioner for Refugees
UNDP United Nations Development Programme
US CIA United States Central Intelligence Agency
US DOE United States Department of Energy
USAID United States Agency for International Development
USD/US$ United States Dollar
USTR United States Trade Representative
WHO World Health Organization

1
1. Introduction
Industrialization, through the lens of history, leads to greater quality of life
and economic growth in the country of context (Arnold and Hartman 2005). This
is not to say however that it comes without cost. Many workers in industrializing
societies face a variety of risks such as exploitive wages and poor working
conditions and in extreme cases, severe depression (Pun and Chin 2012) and
death, as was the case most recently in factory fires in Bangladesh in October of
2013 (Associated Press 2013). A joint initiative of the International Labor
Organization and the International Finance Corporation called Better Work aims
to protect workers in the garment industry of a number of countries while
allowing these growing nations to experience the economic boon emerging
industries can provide (ILO 2013a).
The relationship between worker outcomes and efficiency in the Better
Work program has previously been examined in the work of Maureen Sarewitz
and Rebecca Drejet for the countries of Haiti and Vietnam, respectively (Drejet
and Rappaport 2012; Sarewitz 2013). These papers identify potential indicators
that may demonstrate a correlation between the efficient use of energy and worker
outcomes in some measures such as occupational health and safety, and working
time.
The purpose of this paper is to examine the data collected for the Better
Work program in Jordan, examining both the state of the industry in the country
and some of the effects the program may be having, especially with regard to
energy use and other factors which impact factory profits. An overview of some
2
of the underlying issues at play in the industry and program will be examined to
provide deeper background and context. This work builds on the aforementioned
work done for Vietnam and Haiti and will provide an additional point of
comparison.
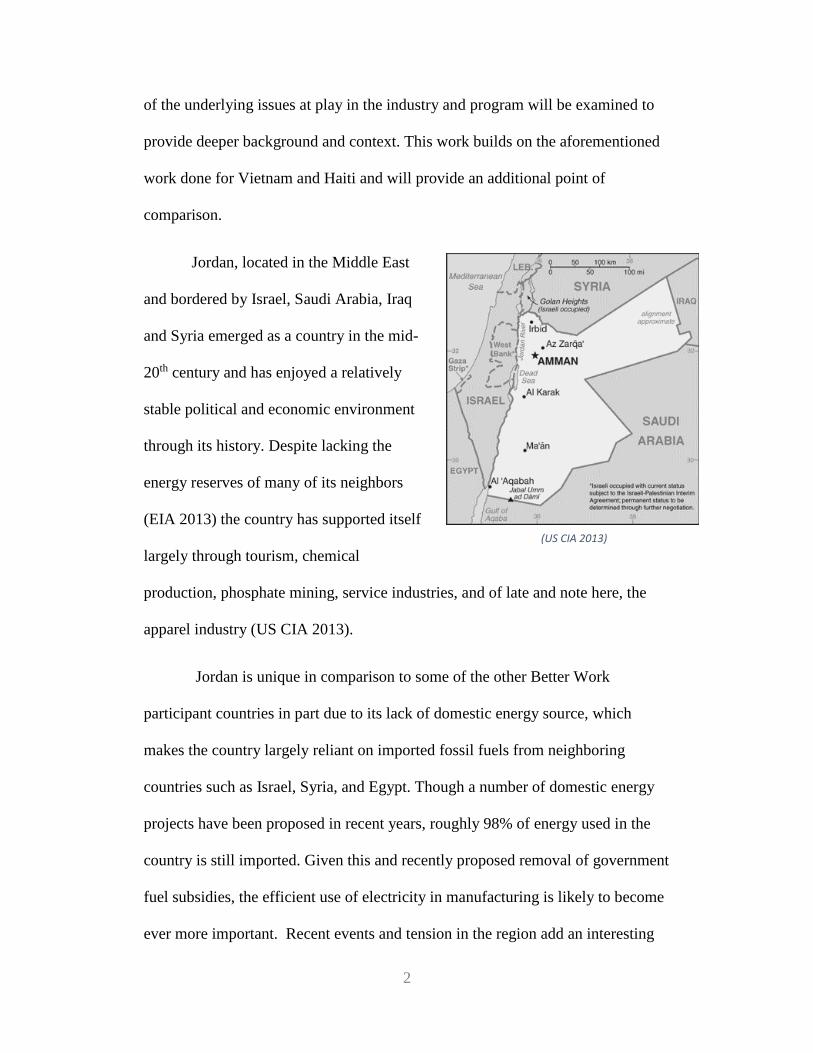
Jordan, located in the Middle East
and bordered by Israel, Saudi Arabia, Iraq
and Syria emerged as a country in the mid-
20th century and has enjoyed a relatively
stable political and economic environment
through its history. Despite lacking the
energy reserves of many of its neighbors
(EIA 2013) the country has supported itself
largely through tourism, chemical
production, phosphate mining, service industries, and of late and note here, the
apparel industry (US CIA 2013).
Jordan is unique in comparison to some of the other Better Work
participant countries in part due to its lack of domestic energy source, which
makes the country largely reliant on imported fossil fuels from neighboring
countries such as Israel, Syria, and Egypt. Though a number of domestic energy
projects have been proposed in recent years, roughly 98% of energy used in the
country is still imported. Given this and recently proposed removal of government
fuel subsidies, the efficient use of electricity in manufacturing is likely to become
ever more important. Recent events and tension in the region add an interesting
(US CIA 2013)

3
dimension to any examination of the country and its resident activities. However
due to the fact that the majority of the data collected for Better Work Jordan that
is available at present was collected before 2011, this will largely be left
unexamined.
Further still, the policy environment surrounding exports and
manufacturing in Jordan adds an interesting facet to the Better Work program
within the country. Of particular note is the Jordan United States Free-Trade
Agreement (JUSFTA), the first free trade agreement the United States has
established with a Middle Eastern country. Beyond international policy, the
Jordanian government has sought to increase employment throughout the country
in recent years, with growth in the apparel sector and others aimed at achieving
this goal, while also seeking to ensure worker protection: recently having
implemented requirements that almost all apparel factories participate in the
Better Work program.
This paper will provide an examination of the apparel industry of Jordan
and a review of relevant background information as well as an overview of
previous work already conducted by Better Work Jordan staff and other
researchers. It will also lay out a methodology for managing the collected Better
Work data and apply this to the data collected for Jordan. Finally, the data
analysis will be compared to the work done for Haiti and Vietnam to gain further
insights into possible global trends. It is important to note that while the data
collected for the program thus far is impressive, it is still in its infancy and a more
telling and stronger analysis could be performed for this and other participating

4
countries once additional years of data are avalible and reporting rates have
impoved.
2. Background
Better Work
The Better Work program is a joint initiative between the International
Finance Corporation (IFC) and the International Labor Organization which began
in 2007 following the success of the ILO’s Better Factories Program in
Cambodia. Currently programs have been established in seven countries:
Cambodia, Haiti, Indonesia, Jordan, Lesotho, Nicaragua and Vietnam and
programs are presently in development for Morocco and Bangladesh (ILO
2013a).
The program promotes worker protection within the garment industry of
the participating countries by monitoring factories for compliance with the ILO’s
core labor standards and with work standards in accordance with international and
national law (Better Work 2013a). The manner in which this monitoring occurs is
discussed in the methods section of this paper. Beyond monitoring factory
compliance, Better Work promotes dialog between workers and managers, helps
to implement solutions to working condition problems, facilitates the sharing of
best practices between factories and conducts training events (Better Work
2013b).
Better Work Jordan began in 2009. In 2011, as part of a push to promote
foreign investment following economic turmoil the Ministry of Labor established
a requirement that all factories producing goods for export participate in the

5
program. As of 2012, 53 out of an estimated 73 garment factories in the country
had joined (Better Work Jordan 2013a).
Implementation of Better Work programs is funded initially through
contributions from foreign governments but programs are typically designed to
become sustainable through international buyer participation and support from the
government of the resident country within seven years (ILO 2013a). The program
in Jordan is funded by USAID and the Jordanian Ministry of Labor, with the
additional support from corporations such as the Levi Strauss Foundation and the
United States Council Foundation (Better Work 2013c)
Jordan
Jordan, more formally known as the Hashemite Kingdom of Jordan,
emerged following post World War I partitioning of the Ottoman Empire as a
recognized country in the late 1940s. The country has developed as one of the
most stable and well developed in the region, noted as an upper-middle income
country (World Bank 2013a), and holds an advanced status partnership with the
European Union (European Union 2010).
Jordan is one of the few countries in the Middle East without significant
fossil fuel reserves (EIA 2013). Jordan’s economy has grown to be among the
freest economies in the region in terms of market openness, regulation and
government spending, and has seen continuous improvements to economic
freedom over the past five years. This has been attributed to more liberal leanings
(compared to much of the region) and changes in economic policy initiated by
King Abdullah II starting in the late 1990’s (Miller Kim and Edwin 2013).
6
As a consequence of its lack of energy resources, Jordan has relied on
other sectors to provide economic growth; among these are technical services,
tourism, chemical production and phosphate mining, manufacturing, and apparel.
Goods produced for export are valued at $7.897 billion (GDP is $31.21 billion),
with chief export partners including the United States, Iraq, Saudi Arabia and
India (US CIA 2013). With regard to total trade (imports and exports), Saudi
Arabia and the EU are Jordan’s most significant trading partners (European
Commission 2013). Despite a relatively stable economy, Jordan is heavily reliant
on foreign aid, and is likely to continue to be so for the foreseeable future (US
CIA 2013).
Jordan has a population of almost 6.5 million people (US CIA 2013) with
almost half of the population being under 19 years old and likely to enter the
workforce in the coming years (Better Work Jordan 2013b). The country is home
to a considerable numbers of refugees, immigrants and migrant workers. It is
estimated that over 800,000 refugees currently reside in Jordan, largely from Iraq
and Syria (UN HCR 2013). There are around 500,000 legal migrant workers in
the country in addition to refugees. While the precise number of workers in the
country illegally is unknown, it has been estimated to be around one million
(Malkawi 2012). Some of these illegal workers come from neighboring countries,
but many are from as far away as China, India, Madagascar and Bangladesh
(Better Work Jordan 2013b).
Unemployment in the country has remained high over the past decade.
Despite government initiatives to promote (what?), a considerable portion of jobs
7
created are acquired by immigrant laborers (Domat, Glass and Brown 2012).
Presently the unemployment rate is at 14% (Trading Economics 2013a) and
hasn’t been below 11% since 2007. The second least employed segment of the
population with regard to education level are people with a Bachelor’s degree (or
even higher professional degree). This has been attributed to a mismatch of skill
and perceptions of the sectors in which jobs are available (Domat, Glass and
Brown 2012). There is a perception of shame in taking a job that is beneath one’s
skill level, but many of the available jobs are in manufacturing (including
apparel); as such, a considerable number of the unemployed can be considered
voluntarily unemployed (World Bank 2008). It is also of note that unemployment
among females is twice that of men, and women make up a considerably smaller
portion of the workforce (Domat, Glass and Brown 2012).
The Garment Industry
The garment industry of Jordan has grown considerably over the past
decade (Domat Glass and Brown 2012), and makes up 16% of the country’s
export mix (valued at $1.05 billion US Dollars annually) (Better Work Jordan
2013b). The industry grew (in export value) by 8% from 2010 to 2011 alone
(Better Work Jordan 2012).
The majority of the roughly 73 garment factories in Jordan are located in
the 13 Qualifying Industrial Zones, discussed further below, which allow for more
competitive export to the United States, its largest export partner in this sector
(Bar and Alkobi 2013). Production includes a wide range of goods, from yarns
and fabrics to readymade clothing such as jeans and formal ware (Better Work

8
Jordan 2012a). Buyers include corporations such as Wal-Mart, Gap, Hanes, and
New Balance (Better Work Jordan 2013c).
As already noted it is likely that the lack of change in Jordanian
unemployment despite growth in this and other sectors is due in part to the heavy
presence of migrant workers (Domat Glass and Brown 2012). The laborers in
most of the factories are non-Jordanian, coming from countries such as Sri Lanka,
Bangladesh, India, China, and Burma. In Better Work participating factories,
foreign workers make up roughly 75% of the workforce (Better Work Jordan
2013b) compared to 79% for the sector as a whole (Better Work Jordan 2012b).
Women make up a larger share of the workforce in the garment sector compared
to men at roughly 60% (Better Work Jordan 2012a).
Laws and Agreements
A number of agreements with the United States have been noted as having
an impact on the apparel sector of Jordan, most significantly the Qualifying
Industrial Zone Agreement (QIZA) of 1996 and the Jordan-U.S. Free Trade
Agreement (JUSTFA), which was approved in 2001 (Domat Glass and Brown
2012).
Created as an amendment of the United States-Israel Free Trade Area
Implementation Act (1985) through the West Bank and Gaza Strip Free Trade
Benefits Act, the Qualifying Industrial Zone Agreement set out provisions for
establishing industrial zones within Jordan (and, as of 2005, Egypt). This
agreement allowed products produced in Jordan to access US markets without
tariffs or quotas as long as the products met certain qualifications with regard to

9
origin (Bolle Prados and Sharp 2006). The intent of this legislation was to help
solidify peace and cooperation within the region, to aid the economies of the
participating countries and to spur employment (Bolle Prados and Sharp 2006).
The QIZA established thirteen qualified industrial zones (QIZs), one of
which was later expanded and may be referred to by some as a fourteenth QIZ.
Three of these QIZ’s are operated by the Jordanian government while the rest are
privately held. Effectively these QIZs operate as free-trade industrial parks that
centralize operations, some of these also includefacilities such as dormitories for
migrant workers (ILO 2013c). Goods produced within the QIZs are free of tariffs
to enter US markets as long as 35% of the value of the final product is of US (up
to 15% of this 35% portion), Israeli or Jordanian origin. Products are approved by
a joint Israeli and Jordanian committee overseen by a US observer (Bolle Prados
and Sharp 2006).
While the QIZA may have not had the political impact of bringing peace
to the region the law in theory aspired too, it has had considerable economic
impact. In 2004 alone, the QIZs produced an estimated $100 million in additional
economic activity, and improved trade relations with the US has been important
to attracting new investors (Gaffney 2005). As of 2006, 75% of exports to the
United States from Jordan came from QIZs, although this percent will likely
fluctuate as JUSFTA is fully implemented and realized, as the agreement included
a ten year phase in period (Bolle Prados and Sharp 2006).
The QIZs have been especially beneficial to growth in the apparel sector,
with 99.9% of all QIZ-produced exports being garment or garment related goods

10
(Bolle Prados and Sharp 2006). The impact of the QIZs will likely wane in the
coming years with increasing competition from other labor markets due to the
expiration of quotas on textiles and clothing established in the Multi Fibre
Arrangement and the implementation of JUSFTA. It has however helped to bring
the economy, and specifically the apparel sector to a better place than it was prior
to its implementation (Bolle Prados and Sharp 2006; Gaffney 2005).
Beyond its economic impact, the QIZA has had notable social impacts.
The growth it fueled led to the production of jobs, a majority of which went to
women. This helped in some ways to break down cultural restrictions against
women by assisting in their transport and housing and allowing them to help
support their families (Bolle Prados and Sharp 2006). Such work has led women
to interact with others who they might not have previously (Gaffney 2005), such
as foreign workers, who as earlier noted made up a greater portion of these new
workers than native Jordanians. While these changes may be good, working
conditions in QIZs have been of concern. Efforts by organizations such as the ILO
have helped to reach collective bargaining agreements with factories and labor
unions after recent strikes in several QIZs (ILO 2013b) and Better Work Jordan
continues to support the improvement of working conditions.
The Jordan-U.S. Free Trade Agreement passed under the Bush
administration in 2001 was the first free trade agreement with a predominantly
Arab country and held similar goals for interregional cooperation and economic
enhancement as the QIZA (Momani 2007). Since its implementation, the apparel
industry has grown, exports have increased considerably, and jobs have been

11
created; however, as previously noted with the QIZA, these have been largely
filled by non-Jordanians (Butros and Al-Hiyari 2012). The JUSTFA extends
similar freedoms to those under the QIZA to goods produced in Jordan outside of
the QIZs while maintaining similar requirements for sourcing and value added
origin points, in this case 35% Jordanian value added (USTR 2013). This
essentially makes the entire country a QIZ, without the centralized aspect
provided by the zones. The provisions of the JUSTFA were slated to be fully
implemented by 2011 (Momani 2007), but were in full force starting January 1,
2010 (USTR 2013).
The JUSTFA was notable as a trade agreement as it is one of the few to
clearly and directly address issues of social concern, working conditions and
environmental protection specifically (Momani 2007). The Agreement called for
regular meetings of a panel representing both countries, “to advance
environmental protection in Jordan by developing environmental technical
cooperation initiatives, which take into account environmental priorities,” and to
aid in “the development and effective implementation of Jordanian environmental
laws” (USTR 2000).
Neither the Qualifying Industrial Zone Act nor the Jordan-US Free Trade
Agreement are without critics. The fact that employment has disproportionately
benefited non-Jordanians is certainly concerning (Gaffney 2005), but many take
issue with the fact that these initiatives have not accomplished their intended
political goals to develop greater collaboration in the region (Moore 2003).
Intraregional trade is still among the lowest in the world and firms circumvent the
12
intent of the laws in creative ways like counting Israeli developed software in the
value of finished goods (Momani 2007). The JUSTFA and similar proposed
legislation has also been criticized at making the region further dependent on the
United States (Moore 2003). Despite this it cannot be denied that these policies
have had an impact on Jordan (Federal Register 2009), and have caused
substantial growth in the garment sector (Bolle Prados and Sharp 2006).
Electricity and Energy in Jordan
In addition to water and other resource scarcities, energy constraints have
been noted as a hindrance to the Jordanian economy (US CIA 2013). Energy has
been described as the “Achilles heel of the Jordanian economy,” and at present,
97% of the energy used has to be imported by some means (Atzori 2013). Given
the recent political instability in the region, especially in Egypt, energy is likely to
continue to be of serious concern for all sectors of the economy (Al-Khalidi
2013).
Costs associated with energy consumption have grown in recent years due
to population growth, greater demand and rising oil prices (Al-Ghandoora Al-
Hintib Jaberc and Sawalha 2008). Though the Jordanian government has long
taken measures to reduce fuel use, the need for imported energy has continued to
grow to meet this demand (Tamini 1993). The government has two principal
aims: to decrease imports of oil and other fossil fuels, and to provide energy at the
lowest feasible price to help support economic growth (Jaber and Probert 2001).
The majority of electricity used in Jordan is created with steam turbine
generators (heated by burning fuel oil), with some gas turbines also being used
(Tamimi and O'Jailat 1995). Electricity is generated by four private companies
13
and is then bought by a government owned transmission company, the National
Electricity Power Company (NEPCO), and resold to three private distributors at a
rate set by the government Electricity Commission. NEPCO is also responsible
for purchasing fuel used by the four private producers. The financial burden of
the system falls on NEPCO, which loses money when fuel prices increase while
the private producers and distributors remain profitable (Verme 2011). Due to
disruptions in fuel availability as a result of the Arab Spring, and general
increases in the cost of fuels, the burden placed on NEPCO in the past several
years has increased dramatically. In 2013, the debt accumulated as a result of fuel
subsidies is estimated to be JD 1.3 billion (US$1.84 billion) making up a
considerable portion of the country’s debt (Neimat 2013).
Electricity prices are determined (and set through a NEPCO tariff system)
based on quantity used, with different bracket sets for residential and various
commercial sectors, three of which garment manufactures would likely fall into
depending on the firms size (Verme 2011). The burden of fuel subsidies on the
government is projected to potentially reach JD 7.5 billion (US$10.59 billion) by
2017. To combat this the government has begun increasing tariffs paid for
residential use over 600 KWh/Month (Jordan Times 2013a), and for medium and
large industrial users (increases of 6% and 15% respectively; calculated with
daytime use costs) (NEPCO 2013). Despite these changes, only very large
residential users and large mining operations (which use different quantities of
energy, but pay similar rates) pay at rates at or above the estimated 189
fils/kilowatt (US$0.27) generation cost (Jordan Times 2013b; NEPCO 2013).

14
However, additional increases of up to 15% have been proposed for 2014 but
currently consumers, on average pay 72 fills/KWh (US$0.10) (Jordan Times
2013b).
While renewable energy use onsite has been seen in the residential sector
(largely through solar water heaters), the industrial sector is almost entirely
dependent on grid electricity or, less frequently onsite electrical generation using
fossil fuel sources (Akash and Mohsen 2002). Presently, industrial energy use
accounts for roughly 31% of the country’s energy use. As industry grows,
demand for energy will as well. Absent reductions and efficiency measures,
energy demand is projected to grow by 63% over 2007 levels by 2019 (Al-
Ghandoora Al-Hintib Jaberc and Sawalha 2008). While the industrial sector may
be almost exclusively reliant on fossil fuel-derived energy, it is presently the most
efficient energy user in Jordan (Al- Ghandoor 2012). However, there is still great
potential for energy savings in the Jordanian industrial sector through efficiency
gains (Al-Ghandoor ALSalaymeh Al-Abdallat and Al-Rawashdeh 2013).
Rising electrical prices are likely to cause public outcry and potentially
protests (Jordan Times 2013a). Despite this, there may not be an impact on
activities in the industrial sector as analysis has shown that variance in energy
prices has not led to a greater adoption of energy efficiency measures in Jordanian
factories (Al-Ghandoora Al-Hintib Jaberc and Sawalha 2008).
Development of domestic energy sources has been examined in Jordan
going back many years (Anani and Abu-Allan 1988; Habau Hamdan Jubran and
Zaid 1988). A number of solutions are being considered to meet rising power

15
needs, including several proposed solar, nuclear and wind projects (Luck 2011).
In the interim, the government is seeking to control demand to a degree through
energy efficiency measures (Al-Khalidi 2013).
Energy in the Garment Industry
Given its significant role in the industrial sector, widespread energy
savings across the garment industry could both help reduce energy consumption
and save garment firms money. Furthermore, a stable and reliable energy source
is important for growth in the garment industry (Mehta 2013), and reducing total
use can help ease demand pressures and related black/brown outs. Unfortunately,
it is common in Jordan to import used machinery and equipment for use in
factories. Not only is this older equipment typically less efficient, it is often
implemented without proper technical knowledge and can lead to even greater
energy losses (Al-Ghandoora Al-Hintib Jaberc and Sawalha 2008). Energy loss in
the textile and garment industry can be associated with process heating and
cooling, water and space heating/cooling, illumination, and mechanical
inefficiencies depending on the configuration of an individual facility (Özdoĝan
and Arikol 1995). Mechanical inefficiencies can be found in the variety of electric
motors used in the garment industry. Upgrades to these motors can certainly lead
to savings, greater operator knowledge can also help in this regard as many
motors operate at peak efficiency with different degrees of load. Proper selection
and implementation of motors along with operational education can decrease
energy use while maintaining (or improving) productivity and operator safety
(Ozturk 2004). In the Jordanian industrial sector specifically, it is suspected that
considerable energy savings could likely be made through upgrading inefficient
16
electrical motors, which could also increase productivity (Al-Ghandoora Al-
Hintib Jaberc and Sawalha 2008). In instances where large amounts of fabric
must be cleaned, or hot water is needed for other purposes, energy costs can be
reduced substantially through the use of solar water heaters. This is especially
true in areas that receive considerable amounts of sunlight (Muneer Maubleu Asif
2006). Further energy savings can often be found through efficient lighting and
ventilation equipment choices (Ozturk 2004).
In addition to these technical challenges, factory owners and managers
often do not understand the importance of energy efficiency measures or their
potential impact on their firm (Al-Ghandoora Al-Hintib Jaberc and Sawalha
2008). In a survey conducted by Bilal Akash and Mousa Mohsen of managers at
10% of all Jordanian industrial firms, only 24% were aware of the price rates
being paid for electricity (Akash and Mohsen 2002). This same survey revealed
that 75% of managers were reportedly interested in reducing their electrical use to
save money, but less than 10% were willing to pay to for employee training
courses or workshops on conservation. Less than 3% were willing to hire a
consult to find solutions to reduce costs (Akash and Mohsen 2002).
Auxiliary Benefits of Energy Efficiency
Literature directly relating worker outcomes (health and safety, job
security) to energy efficiency is elusive, however there is a strong body of work
highlighting productivity gains (and greater profits) achieved through energy
efficiency measures across many industries and regions (Boyd and Pang 2000;
Kelly Blair and Gibbons 1989; US DOE 1997; Worrell Laitner Ruth and Finman
2003). Often these gains are associated with lower maintenance time and cost,
17
increased yield, and safety improvements, the latter of which certainly benefits
workers (Worrell Laitner Ruth and Finman 2003).
An analysis of existing literature has shown strong evidence linking
greater worker health outcomes and productivity gains to safe indoor working
conditions and energy efficient facilities (Fisk 2000). Workers properly trained in
the application of equipment are more likely to use it efficiently and in a manner
which best protects them. It has also been shown across multiple industries that
firms which engage in environmental and other social initiatives typically do not
see profit loss (Blanco Rey-Maquieira and Lozano 2009). It is important to
demonstrate the potential of improved or maintained profits to firm owners and
managers in convincing them to implement such measures (Akash and Mohsen
2002).
Work done using data from Better Work Vietnam demonstrated weak
correlations (p=0.20) linking factories that spend less on energy per item
produced with improved compliance in all Better Work compliance clusters
except for Freedom of Association and Collective Bargaining (Drejet and
Rappaport 2012). Similar work in done in Cambodia suggests that productivity
improvements (of which energy efficiency measures could be included) lead to
greater profitability and rising wages (Brown, Dehejia and Robertson 2011).
These may not hold true for worker safety - similar work in Vietnam found firms
which invested in worker protection measures to be less profitable (Brown,
Dehejia Robertson and Veeraragoo 2011).
18
3. Methodology
Better Work Jordan (BWJ) Data Collection
Data produced for the BWJ program comes in two forms: surveys filled
out by factory workers and factory administrators (General Manager, Financial
Manager, Chief Engineer and HR Manager) and compliance assessments
conducted by BWJ officials known as enterprise advisors. These datasets are then
combined to allow for analysis across the various surveys (the organization of this
combined dataset is described later). In the analysis preformed for this paper, data
was used from the General and Financial Manager surveys and the compliance
assessments.
Though not used in this paper, the worker surveys ask demographic
questions, questions about the working conditions of the factory, their perceptions
of the working environment and their supervisors’ actions, and their home lives.
Manager surveys ask questions relevant to the area a given manager oversees. For
example, the General Manager survey covers production and employment
numbers and manager perceptions of input costs and other obstacles to
production, while the Financial Manager survey examines production costs.
The compliance assessment conducted by BWJ is broken up into a series
of clusters relating to national and international labor laws, these are: Child
Labor, Compensation, Contracts and Human Resources, Discrimination, Forced
Labor, Freedom of Association and Collective Bargaining, Occupational Safety
and Health and Working Time. Within each cluster are a number of compliance
points which further specify issues, and within each point are a number of
questions (i.e. ‘Is there evidence of undocumented workers under the age of 18?’).
19
Should an assessor see evidence of noncompliance on any one of these individual
questions, it is marked as non-compliant for the entire compliance point (Better
Work Jordan 2012a). In the dataset this is seen in the form of binomial variables
representing the questions, so that a value of 1 indicates evidence of
noncompliance on a given compliance question, while a value of 0 indicates no
evidence.
Data Selection and Cleaning
In the analysis included in this paper, methodology was adapted from the
work done by Maureen Sarewitz and Rebecca Drejet for the Better Work
programs in Haiti and Vietnam (Drejet and Rappaport 2012; Sarewitz 2013). Data
selection was conducted by removing all of the Worker survey data from the
dataset as none of the questions asked in the worker survey were analyzed.
Likewise, as data from the Engineer and HR manager surveys were not used in
this analysis, it too was discarded. Then, duplicate data was removed based on
factory IDs and survey year, resulting in a dataset of only one set of manager
surveys and compliance assessments for each factory for each year it was assessed
and surveyed.
At present, only nine factories have been surveyed more than once, so
meaningful temporal analysis cannot be done. In the case where factories were
surveyed over multiple years, the data used in this research was that of the most
recent year, except in cases where the earlier data was more complete. Priority for
‘completeness’ of data was given based on the variables present and their
importance to the analysis. First priority was given to the compliance data, most
20
of which was present. Beyond compliance, data priority was given to electricity
and other input costs, production numbers, and finally employee numbers.
Generated Variables
To conduct the analysis for this paper a number of variables had to be
created from the existing data. These were:
Compliance cluster scores
Total production costs
Cost percentages for inputs such as energy and water
Electricity expenses per unit produced
Variables were created using the full dataset before the previously
described data selection and cleaning process. This was done to better catch any
anomalous or missing data that might be present in some entries but not in others,
and to help facilitate the data selection prioritization previously described. To the
extent possible, this methodology replicated the approach of Sarewitz and Drejet
(Drejet and Rappaport 2012; Sarewitz 2013).
It should be noted that the method used in this paper to calculate
compliance scores is not the same as that used by Better Work. Better Work
breaks the clusters into compliance points and looks for noncompliance in any of
the questions within each point - noncompliance in one question results in
noncompliance for the entire point. There was not enough information available
to directly replicate this methodology (however an overview of how the clusters
are broken down can be found in Appendix Table 1) so something more akin to
Sarewitz and Drejet was devised. For clarity, the clusters as categories remain the

21
same in both methods, but in the method described below the compliance score is
found as the average noncompliance of all of the questions within a cluster, and
calculations at the point level were not performed.
Compliance cluster scores were created by averaging all of the compliance
questions within a given cluster. Given the previously described binary nature of
compliance questions this resulted in scores of 0 to 1, so for example a score of
0.03152 in the Child Labor cluster would mean that there was evidence of non-
compliance in 3.125% of the child labor related compliance questions. Though
the clusters remain the same for all Better Work countries, the compliance
questions within each cluster vary. It also appears that even in the same year the
number of compliance questions looked for in factory visits varies, especially in
the Contracts and Human Resources and Freedom of Association and Collective
Bargaining clusters. For Jordan the clusters are broken down as follows:
Child Labor – 4 Questions (7 or 8 Starting in 2012)
Compensation – 27 Questions (28 Starting in 2012)
Contracts and Human Resources - ~35 Questions (Highly Variable)
Discrimination – 26 Questions
Forced Labor – 16 Questions (20 Starting in 2012)
Freedom of Association and Collective Bargaining – 28-38 Questions
(Highly Variable)
Occupational Health and Safety – 67-68 Questions
Working Time – 13 Questions (12 Starting in 2012)
Due to the variable nature of the number of compliance questions within
each cluster, the average compliance for a given cluster was calculated on an
observation (factory) by observation basis. It does not appear that this was done in

22
the work completed for Haiti and Vietnam (the total within a cluster was divided
by the assumed same number of questions) so any comparisons drawn should be
done with caution.
The Financial Manager survey contains questions as to the amount a firm
spends per quarter (‘in the last three months’) on electricity, communications
services, fuel, transportation, water and rent. These amounts were combined for
each factory to produce a total monthly cost. This variable does not include
employee compensation, material costs or other potential inputs and costs; it
makes for an easily tangible examination and mimics earlier work. Working
backward from this total, variables were created for each of these inputs as
fractions of the total cost of production (seen in Table 3 in the Results section).
Also working from data in the Financial Manager survey with output
numbers from the General Manager survey, a variable was created as a proxy for
energy efficiency in the form of electricity costs (in USD) per unit produced. This
was accomplished by first finding the output of the past month by taking the
maximum monthly output and multiplying it by the production level of the past
month (the general manager is asked both what the maximum monthly output is at
peak capacity and the percentage of this level the firm produced in the previous
month). This output quantity was then divided into the reported electricity costs
(converted from Jordanian Dinar to USD at an exchange rate of 1.41 USD: 1 JD
and divided by three as it is the cost over a quarter) to produce the proxy variable.
In the process of devising the methodology for this analysis, a discrepancy
was found between the Sarewitz and Drejet papers (Drejet and Rappaport 2012;
23
Sarewitz 2013). It appears that Drejet followed something similar to the above
(though her results could not exactly be replicated, which is likely due to
differences in data selection/availability when her work was done), while
Sarewitz neglected to divide the resulting electrical costs by three (as the reported
electrical costs are of the previous quarter, not month) resulting in values which
are actually 3 times the average electrical cost per piece produced. This was taken
into account when comparing data simply by dividing her calculated costs across
the quarter, and data produced for Jordan following her methodology can be
found in Appendix Table 6 for the sake of comparison.
Analysis
The analysis for this paper was conducted so as to best expand upon the
methodologies of Sarewitz and Drejet to facilitate comparisons across the studied
countries. Thus, similar tables were produced and are provided in comparable
format. Tables of summary statistics, frequency tables and correlation analyses
were produced using StataSE 12 (College Station, TX).
Pearson correlations were run between the electricity cost per piece and
all of the compliance variables, total sales, full capacity monthly output, net book
value of machinery, cost of: material goods, electricity, communications services,
fuel, transportation, water, rental, cost of electricity as a portion of total costs,
year the factory opened, and age of the oldest building. Pearson correlations were
also run between the factory size by means of worker population and the same set
of variables. These were examined at multiple thresholds of statistical
significance, specifically p=0.20, p=0.10, and p=0.05, for comparability to earlier

24
work, and for greater statistical relevance respectively. A Spearman's rank
correlation test was run on the between the electrical cost efficiency variable and
the same set of variables described above to further examine this potential
relationship. The child labor cluster was not examined for correlations as it has
only two non-zero values, with one factory having a noncompliance rate of 25%
and the other of 50%.
The charts produced by Sarewitz and Drejet (Drejet and Rappaport 2012;
Sarewitz 2013) were collected from their respective papers so as to examine their
correlations at these higher threshold levels. This was done rather than re-
examining the data for Vietnam and Haiti as the data available at the time of the
writing of those papers may have changed.
Limitations
Given the state of the data sets available, the analyses provided in this
paper are not robust enough to reach truly rigorous conclusions. Despite this it can
offer some insight and perhaps also guidance for any future work of a similar
nature or using a similar methodology. Though this is largely due to the limited
amount of data available, there is also some concern about anomalies and errors in
the data which would require a very close examination to puzzle out. An example
of this is the variable ‘oldest building’, which comes from a question asked on the
General Manager survey. Some responders entered the year the oldest building
was erected, while others listed its actual age. This was obviously caught and
corrected in the analysis but there may be other similar erroneous entries
25
throughout the data set that may have been undetected despite efforts to identify
them.
As there is no control group, such as a group of factories not participating
in the program, or data for the participating factories before they began the Better
Work program, it is hard to control for larger scale changes which might influence
the observed relationships. These could include changing import and export
practices, the state of the global economy, or the region a factory is located in.
Issues like these may be partially resolved as the data set grows.

26
4. Results
As seen below, Table 1 displays a number of key variables used in this
analysis and provides a broad picture of the information contained within the
dataset, along with the number of factories which responded to the various
questions examined. For the total number of factories surveyed exactly, see Table
2.
Table 1: Summary Statistics
Variable Obs. Mean Standard
Deviation Min. Max.
Full
Employee
Count
22 923.41 1,090.66 6 4,990
Total sales
(USD) 13 7,321,573.00 8,191,906.00 300000 31,000,000
Full Monthly
Output
(pieces)
23 743,500.00 1,143,761.00 200 5,000,000
Oldest
Building
(years)
21 9.78 3.552129 5 19
Net book
value
machinery *
17 1,213,648.00
($1,711,243.68) 1,335,790.00 5 4,272,185
Cost
electricity* 21
51,033.13
($71,956.71) 89,180.12 25 398,970.40
Cost
communicati
on services*
21 9,987.37
($14,082.19) 19,263.37 58 90,665.91
Cost fuel* 20 31,296.36
($44,127.87) 47,441.15 210 172,883.80
Cost
transport* 15
100,936.60
($142,320.61) 178,179.90 120 693,512.00
Cost water* 20 19,470.97
($27,454.07) 36,492.31 72 164,293.70
Cost rental* 16 57104.55
($80,517.42) 105,840.80 28 444961.8
*Jordanian Dinar (1 JD: 1.41 USD)

27
Table 1 shows the great variety of factories in the data set with the largest
employing 4,990 workers and the smallest six. While it is impossible to verify the
data for each and every factory individually (forgoing individual case
examinations) it is worth noting that while some of these numbers may seem
initially unusual, given individual circumstances they may make some sense. For
example, the factory with six listed workers also produces the lowest number of
garments and has the lowest revenue of any factory in the data set. This factory
also does not list their principal buyers, and the only garment information
provided is that they make jackets. In contrast, the largest factory with 4,990
workers produces the largest number of garments and also has the highest
revenue. This factory principally supplies Hanes and Walmart. Consequently,
factory could be producing more complicated garments for a higher end retailer,
or possibly making more customized jackets, which might explain the lower
output and the lower number of workers.
Table 1 also indicates the variety of the ages of the factory buildings in
Jordan. The oldest building is 19 years old and the youngest is five, while the
average is 9.7 years. This is interesting considering the noted growth of the past
decade (Domat, Glass and Brown 2012), which is associated with the Qualifying
Industrial Zone Agreement and began around the time many of the buildings in
the sample would have gone into use. Thus the buildings indicated by this average
are likely the product of the growth in the sector this initiative helped instigate. It
is worth noting that this date is not exactly accurate as the building age variable
28
was not adjusted to take into account the year of the survey used; however, the
bulk of the data was either from 2010 or 2011.
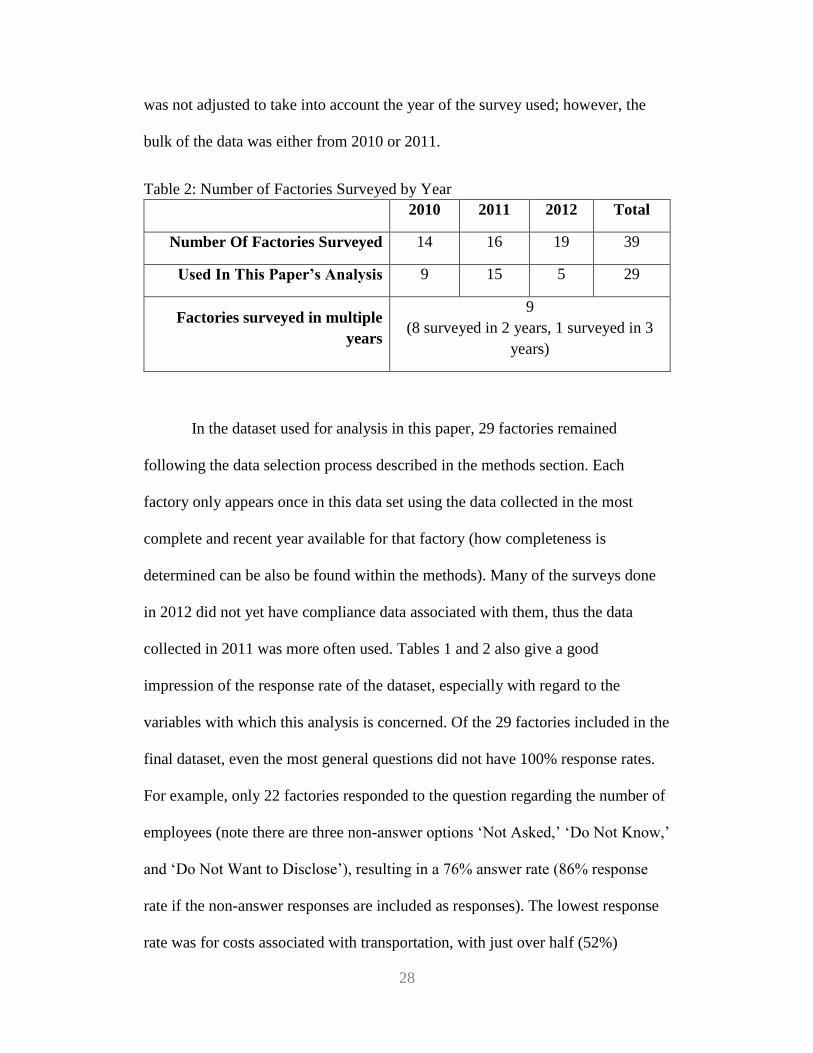
Table 2: Number of Factories Surveyed by Year
2010 2011 2012 Total
Number Of Factories Surveyed 14 16 19 39
Used In This Paper’s Analysis 9 15 5 29
Factories surveyed in multiple
years
9
(8 surveyed in 2 years, 1 surveyed in 3
years)
In the dataset used for analysis in this paper, 29 factories remained
following the data selection process described in the methods section. Each
factory only appears once in this data set using the data collected in the most
complete and recent year available for that factory (how completeness is
determined can be also be found within the methods). Many of the surveys done
in 2012 did not yet have compliance data associated with them, thus the data
collected in 2011 was more often used. Tables 1 and 2 also give a good
impression of the response rate of the dataset, especially with regard to the
variables with which this analysis is concerned. Of the 29 factories included in the
final dataset, even the most general questions did not have 100% response rates.
For example, only 22 factories responded to the question regarding the number of
employees (note there are three non-answer options ‘Not Asked,’ ‘Do Not Know,’
and ‘Do Not Want to Disclose’), resulting in a 76% answer rate (86% response
rate if the non-answer responses are included as responses). The lowest response
rate was for costs associated with transportation, with just over half (52%)
29
responding, while the highest response rate (83%) was observed for compliance
questions, which is expected considering these are the questions answered by
Better Work Jordan evaluators.
Table 2 also shows that in the dataset as it exists at the time of this writing,
there are nine factories for which multiple observations (surveys done in different
years) are available, one of these having data for three years. While not enough
data are available to perform a meaningful analysis of change over time, this
might be feasible in the future.
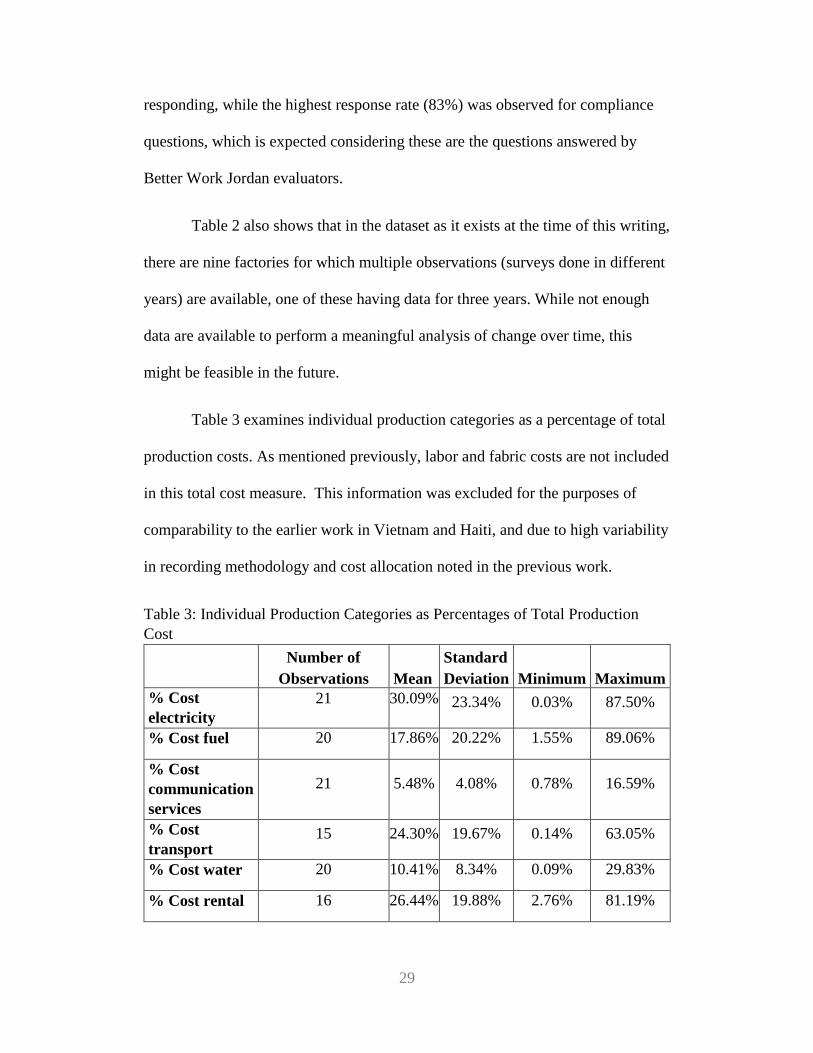
Table 3 examines individual production categories as a percentage of total
production costs. As mentioned previously, labor and fabric costs are not included
in this total cost measure. This information was excluded for the purposes of
comparability to the earlier work in Vietnam and Haiti, and due to high variability
in recording methodology and cost allocation noted in the previous work.
Table 3: Individual Production Categories as Percentages of Total Production
Cost
Number of
Observations Mean
Standard
Deviation Minimum Maximum
% Cost
electricity
21 30.09% 23.34% 0.03% 87.50%
% Cost fuel 20 17.86% 20.22% 1.55% 89.06%
% Cost
communication
services
21 5.48% 4.08% 0.78% 16.59%
% Cost
transport 15 24.30% 19.67% 0.14% 63.05%
% Cost water 20 10.41% 8.34% 0.09% 29.83%
% Cost rental 16 26.44% 19.88% 2.76% 81.19%
30
Given the data, it appears that costs associated with electricity, facility
rental and transportation represent the greatest costs to the surveyed factories
while those associated with water, fuel and communications are smaller. There is
one factory with exceptionally high fuel costs, 89.06% of total costs, and it is also
the factory with the lowest reported electricity costs. It is possible that this one
factory uses non-grid electricity as its principal power source, although this is
impossible to verify with the data available. Aside from this one outlier, most of
the factories experience fuel as a far smaller degree of total cost, with 12 under
15% and the remaining 7 under 40% (most of these being around 20%). It is
likely that most of the factories in the program are located within the Qualified
Industrial Zones described in the background section of this paper and are
consequently close to grid power sources and do not need continuous onsite
generation of power.
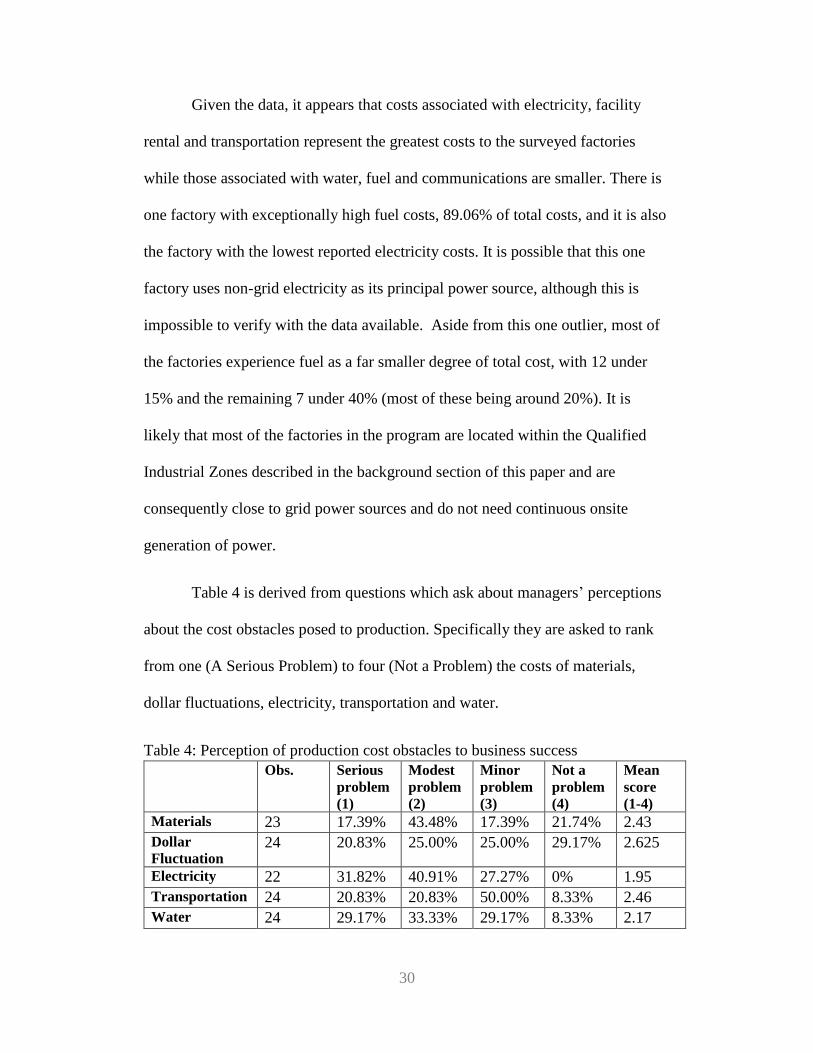
Table 4 is derived from questions which ask about managers’ perceptions
about the cost obstacles posed to production. Specifically they are asked to rank
from one (A Serious Problem) to four (Not a Problem) the costs of materials,
dollar fluctuations, electricity, transportation and water.
Table 4: Perception of production cost obstacles to business success
Obs. Serious
problem
(1)
Modest
problem
(2)
Minor
problem
(3)
Not a
problem
(4)
Mean
score
(1-4)
Materials 23 17.39% 43.48% 17.39% 21.74% 2.43
Dollar
Fluctuation 24 20.83% 25.00% 25.00% 29.17% 2.625
Electricity 22 31.82% 40.91% 27.27% 0% 1.95
Transportation 24 20.83% 20.83% 50.00% 8.33% 2.46
Water 24 29.17% 33.33% 29.17% 8.33% 2.17
31
As the table shows, the cost of electricity is viewed as the most significant
obstacle among these. This could spell trouble for the industry in the future as
electricity prices are slated to increase in Jordan in late 2013 (Reed 2013). Given
the heavy burden energy subsidies have placed on the country’s economy, such
increases are no longer a matter of ‘if’ and will likely have an effect on the
industry in coming years. If electricity costs are truly such a concern, the industry
will likely have to find ways to become more efficient, or cut costs elsewhere.
There were in fact no managers who stated that electricity costs presented no
issue.
Given that Jordan is ranked the fourth water poor country in the world
(World Bank 2013b) it is of little surprise that water costs are ranked highly as an
obstacle to production. In fact, it may be surprising that it’s not ranked higher, and
much like electricity costs are projected to continue to rise in the coming years
due to growth in the industrial and agricultural sectors, drought, and a growing
population (Denny et al. 2008). This is especially troubling considering that
Jordan faces a negative water balance, with roughly 32% of water used coming
from largely non-renewable ground water sources, up from 20% in 1996 (Drake
1997). This suggests that the problem of water shortage is likely to persist, and
worsen. As of 2009, following several years of projects by outside organizations
such as the World Bank and World Health Organization, the Jordanian
government has established plans to decrease non-renewable water usage (Abu
Saud 2009). As these plans will involve increasing water use efficiency and

32
variable pricing by sector (Abu Saud 2009; WHO 2013), this is something the
industry will have to adapt to in the coming years.
Absent context it may be surprising that cost implications due to dollar
fluctuations appear to be the least significant of the examined obstacles in the
eyes of the surveyed managers, considering that a vast majority of products are
exported to US markets. As a result of government management of the exchange
rate through special drawing rights with the International Monetary Fund (Schuler
2004), the exchange rate remained remarkably stable between the US Dollar and
the Jordanian Dinar over the years covered in the dataset, and in fact over the
course of the past two decades (Trading Economics 2013b).
Managers are also asked about non-cost related production obstacles, the
full results of these questions can be found in Appendix Table 2. Table 5 presents
the highlights in the form of the top and bottom six problems identified by mean
score.

33
Table 5: Perception of Production Management Obstacles to Business’ Success
Obs. Serious
problem
(1)
Modest
problem
(2)
Minor
problem
(3)
Not a
problem
(4)
Mean
Score
(1-4)
Top Problems
Identified
Shortage of
skilled workers
24 70.83% 16.67% 12.50% 0.00% 1.42
High workforce
turnover
22 50.00% 31.82% 13.64% 4.55% 1.73
Low skill of
workers
24 50.00% 29.17% 12.50% 8.33% 1.79
Low efficiency
rate
24 37.50% 37.50% 20.83% 4.17% 1.92
Customer
penalties for late
delivery
23 43.48% 21.74% 30.43% 4.35% 1.96
Change in
technical
requirements by
the customer after
production has
begun
24
33.33% 33.33% 20.83% 12.50% 2.13
Bottom Problems
Identified
Legal limits on
overtime
24 8.33% 33.33% 37.50% 20.83% 2.71
Each customer
has its own
working
conditions
requirements
24
12.50% 25.00% 29.17% 33.33% 2.83
Each customer
has its own
technical
requirements
24
12.50% 20.83% 33.33% 33.33% 2.88
Customer
requirements for
production
machinery
23
0.00% 26.09% 43.48% 30.43% 3.04
Customer
requirements for
safety equipment
24 0.00% 0.00% 29.17% 70.83% 3.71
Customer
requirements for
other equipment
(such as punch
clock, computers,
etc.)
23
0.00% 0.00% 21.74% 78.26% 3.78

34
Lack of skilled workers is an interesting top challenge as Jordan has a very
well educated workforce. This likely relates back to the social perceptions of
factories (as described in the Background section). It is not for a lack of skill in
the populous that this issue arises, but rather that those people with the desired
skills will not work under factory conditions or in the industry due to its
reputation, or that wages are not high enough to counteract with the reputation of
the industry. The low skill of workers and high turnover rate are possibly
interrelated. As previously mentioned many of the workers are transient laborers
or are immigrants who may also be refugees who lack a stable social position and
consequently relocate frequently, alternately wages may not be sufficient to retain
workers long enough to develop needed skills. Given these possible factors,
workers may not remain employed long enough to acquire the skills desired by
managers. This too could impact workers efficiency.
In large part, the issues faced relating to the factories’ consumers are
perceived as less serious concerns, implying that managers perceive that many of
these consumers do not have their own production standards regarding labor, or if
they do that they are below those required under Jordanian labor law. The
exception to this are ‘Customer penalties for late delivery’ and ‘Change in
technical requirements by the customer after production has begun’. The first of
these is hard to blame on the customer, as penalties are expected when a contract
is not met. The second is interesting in that customer technical requirements is
35
ranked rather low, but it is the change in these requirements that cause problems
and likely production delays.
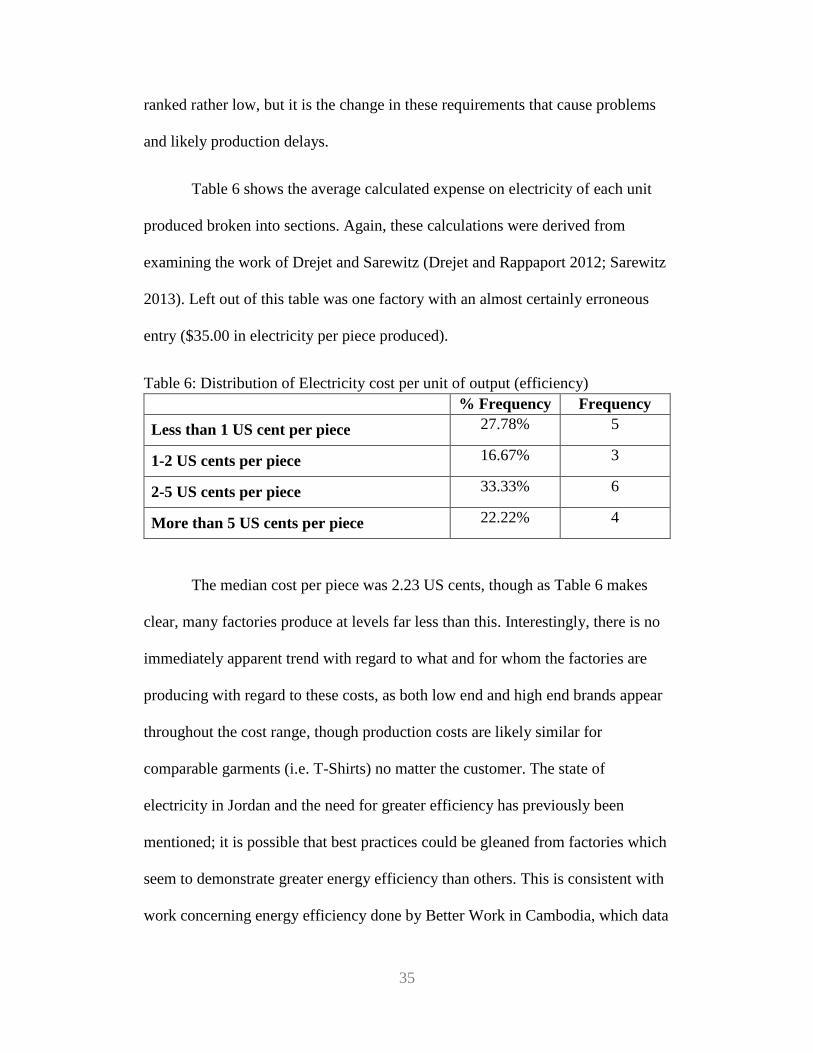
Table 6 shows the average calculated expense on electricity of each unit
produced broken into sections. Again, these calculations were derived from
examining the work of Drejet and Sarewitz (Drejet and Rappaport 2012; Sarewitz
2013). Left out of this table was one factory with an almost certainly erroneous
entry ($35.00 in electricity per piece produced).
Table 6: Distribution of Electricity cost per unit of output (efficiency)
% Frequency Frequency
Less than 1 US cent per piece 27.78% 5
1-2 US cents per piece 16.67% 3
2-5 US cents per piece 33.33% 6
More than 5 US cents per piece 22.22% 4
The median cost per piece was 2.23 US cents, though as Table 6 makes
clear, many factories produce at levels far less than this. Interestingly, there is no
immediately apparent trend with regard to what and for whom the factories are
producing with regard to these costs, as both low end and high end brands appear
throughout the cost range, though production costs are likely similar for
comparable garments (i.e. T-Shirts) no matter the customer. The state of
electricity in Jordan and the need for greater efficiency has previously been
mentioned; it is possible that best practices could be gleaned from factories which
seem to demonstrate greater energy efficiency than others. This is consistent with
work concerning energy efficiency done by Better Work in Cambodia, which data

36
showed a very wide range of efficiency among studied factories (D’Amico
Sokuntheary and Duzer 2009).
Table 7 shows the calculated compliance data for the Better Work Jordan
dataset. This information should be evaluated carefully as this was conducted in a
manner similar to Sarewitz and Drejet and not that done in the manner of official
Better Work documents and releases. In comparing clusters it should be
remembered that the number of questions within each cluster varies, and may
affect the weight given to each question.
Table 7: Better Work Jordan Noncompliance Data
Observations Mean Standard
Deviation
Minimum Maximum
Child Labor 24 3.13% 11.21% 0.00% 50.00%
Compensation 24 11.57% 12.27% 0.00% 44.44%
Contracts and
Human
Resources 24 6.91% 7.54% 0.00% 30.30%
Discrimination 24 1.44% 2.49% 0.00% 7.69%
Forced Labor 24 10.82% 14.73% 0.00% 58.33%
Freedom of
Association
and Collective
Bargaining 24 6.69% 6.02% 0.00% 18.75%
Occupational
Safety and
Health 24 8.35% 3.08% 5.26% 17.1%
Working Time 24 22.95% 11.09% 7.35% 41.79%
Overall 24 13.41% 6.73% 4.84% 28.57%
37
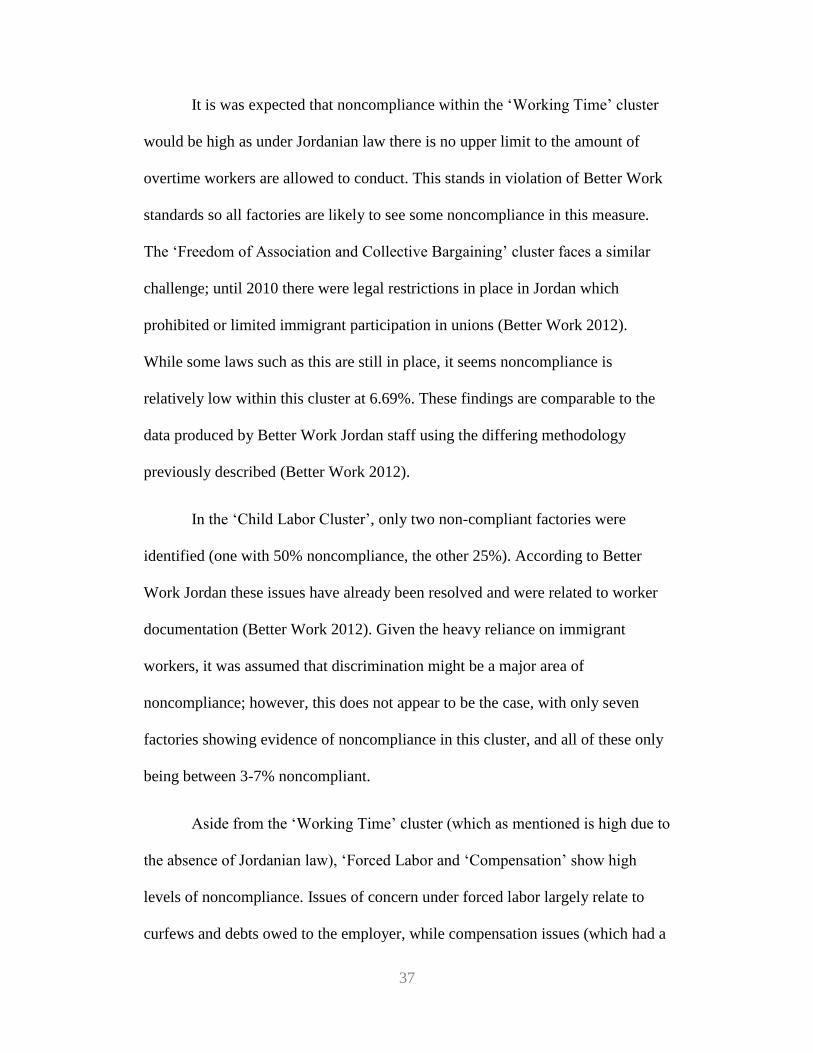
It is was expected that noncompliance within the ‘Working Time’ cluster
would be high as under Jordanian law there is no upper limit to the amount of
overtime workers are allowed to conduct. This stands in violation of Better Work
standards so all factories are likely to see some noncompliance in this measure.
The ‘Freedom of Association and Collective Bargaining’ cluster faces a similar
challenge; until 2010 there were legal restrictions in place in Jordan which
prohibited or limited immigrant participation in unions (Better Work 2012).
While some laws such as this are still in place, it seems noncompliance is
relatively low within this cluster at 6.69%. These findings are comparable to the
data produced by Better Work Jordan staff using the differing methodology
previously described (Better Work 2012).
In the ‘Child Labor Cluster’, only two non-compliant factories were
identified (one with 50% noncompliance, the other 25%). According to Better
Work Jordan these issues have already been resolved and were related to worker
documentation (Better Work 2012). Given the heavy reliance on immigrant
workers, it was assumed that discrimination might be a major area of
noncompliance; however, this does not appear to be the case, with only seven
factories showing evidence of noncompliance in this cluster, and all of these only
being between 3-7% noncompliant.
Aside from the ‘Working Time’ cluster (which as mentioned is high due to
the absence of Jordanian law), ‘Forced Labor and ‘Compensation’ show high
levels of noncompliance. Issues of concern under forced labor largely relate to
curfews and debts owed to the employer, while compensation issues (which had a
38
noncompliance rate closer to 30% according to Better Work Jordan statistics)
relate to poor record keeping, delayed payment of workers, and lack of overtime
pay (Better Work 2012).
Building from the work of Rebecca Drejet and Maureen Sarewitz as
described in the methods section, Pearson correlation tests were run between the
number of employees in a factory and a number of the variables already described
in the methodology, including all of the compliance clusters, electricity costs and
other production costs. The full results of these Pearson correlation tests can be
found in Appendix Table 3, while Table 8 shows those correlations within the
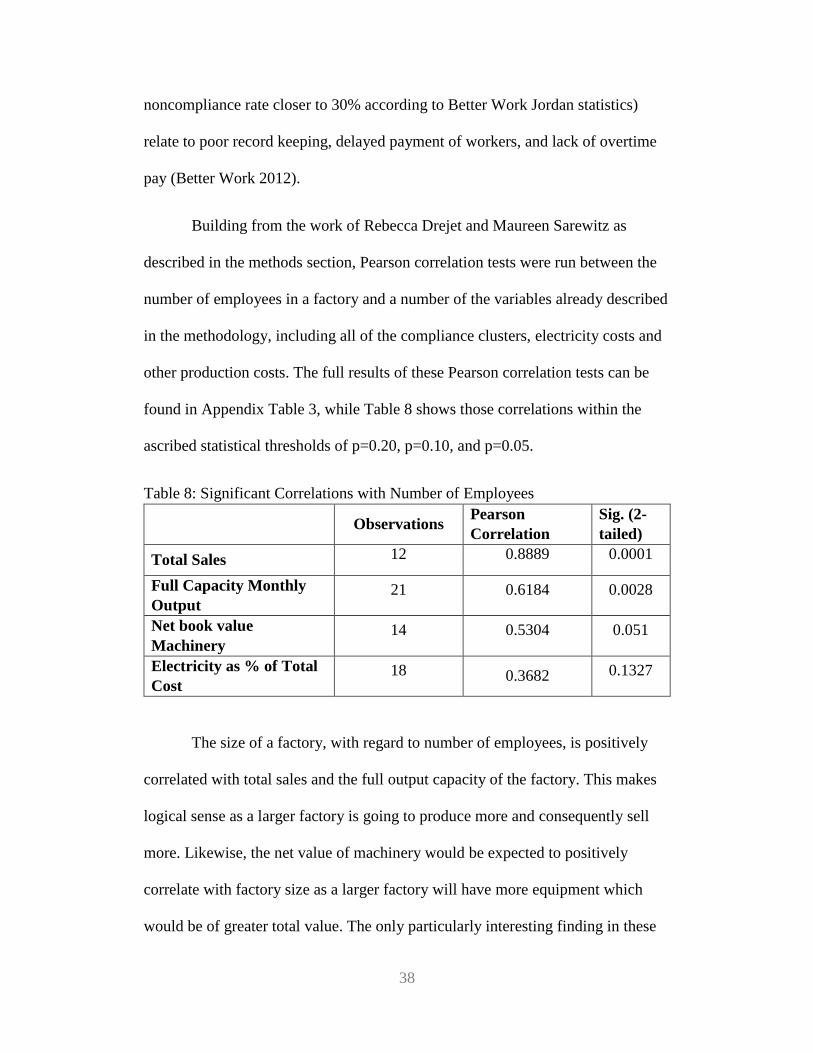
ascribed statistical thresholds of p=0.20, p=0.10, and p=0.05.
Table 8: Significant Correlations with Number of Employees
The size of a factory, with regard to number of employees, is positively
correlated with total sales and the full output capacity of the factory. This makes
logical sense as a larger factory is going to produce more and consequently sell
more. Likewise, the net value of machinery would be expected to positively
correlate with factory size as a larger factory will have more equipment which
would be of greater total value. The only particularly interesting finding in these
Observations Pearson
Correlation
Sig. (2-
tailed)
Total Sales 12 0.8889 0.0001
Full Capacity Monthly
Output 21 0.6184 0.0028
Net book value
Machinery 14 0.5304 0.051
Electricity as % of Total
Cost 18 0.3682 0.1327
39
tests was the positive correlation with electricity as a portion of the total cost of
production, although the p-value of 0.1327 does not reach statistical significance
by standard measures . That said, should this correlation hold up with more data it
would indicate that there is a positive correlation between the number of
employees and the electrical cost component of production. This could be seen to
mean that larger factories are less efficient or that the larger factories experience
fewer costs related to the other examined cost components (water,
communications, transport and rental), but the data is simply not robust enough to
draw any strong conclusions here.
Pearson correlation tests and Spearman’s rank correlation tests were run
between the cost of electricity per piece and the previously mentioned variables,
with the addition of year a factory was opened and the age of the oldest building.
Again, full results of these tests can be found in Appendix Table 4, and those
relationships that are statistically significant in either the Pearson or Spearman
correlation tests can be found below in Table 9.
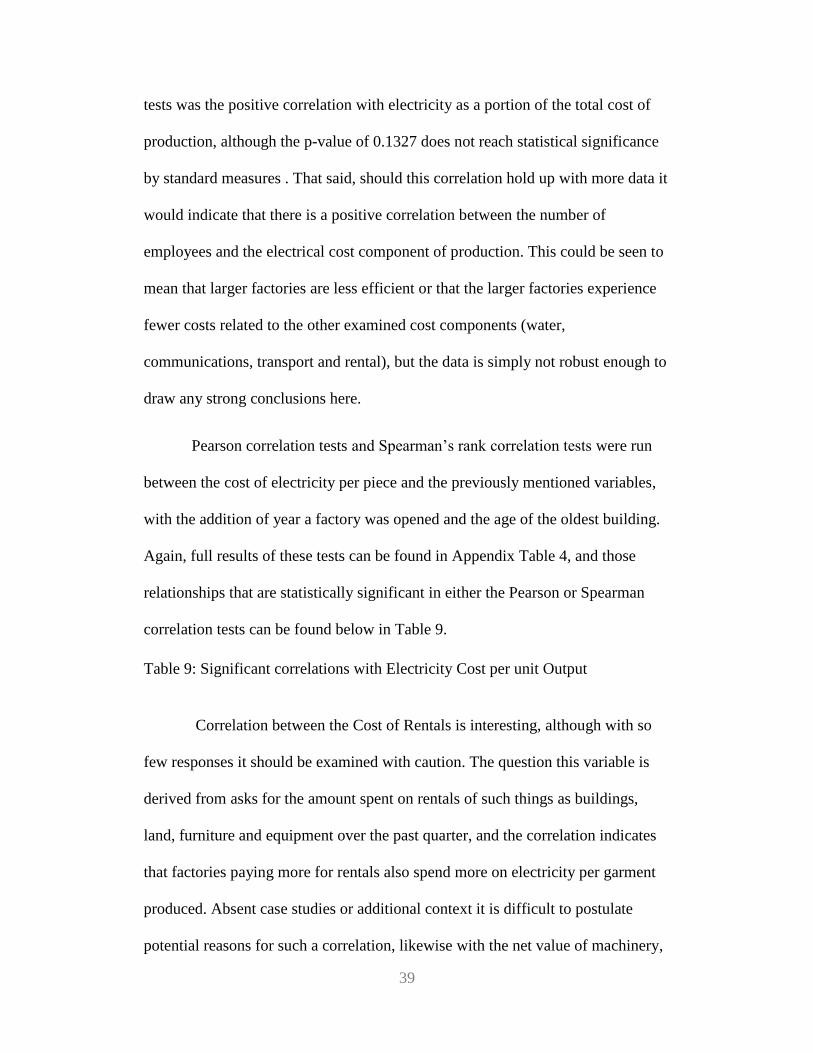
Table 9: Significant correlations with Electricity Cost per unit Output
Correlation between the Cost of Rentals is interesting, although with so
few responses it should be examined with caution. The question this variable is
derived from asks for the amount spent on rentals of such things as buildings,
land, furniture and equipment over the past quarter, and the correlation indicates
that factories paying more for rentals also spend more on electricity per garment
produced. Absent case studies or additional context it is difficult to postulate
potential reasons for such a correlation, likewise with the net value of machinery,

40
especially since there is not a correlation with factory size. One might assume
that factories with more expensive machinery have more efficient machinery as
well, but this is not what is indicated by the limited data available.
The age of the oldest building of a factory is positively correlated with
energy expenditures per piece produced. This would indicate that newer buildings
are more efficient than older ones, which makes logical sense as factories with
newer facilities likely have newer and more energy efficient equipment. The
positive correlation with fuel costs also follows reason; factories capable of using
electricity efficiently are likely be able to do so with other energy sources as well.
This represents the one instance in which the directionality of the two correlation
coefficients indicate differing directionality, though the negative directionality
(which would indicate that newer buildings are less efficient than older ones) was
not statistically significant.
Obs Spearman
Correlation
Sig.
(2-tailed)
Pearson
Correlation
Sig.
(2-tailed)
Cost water 17 0.0153 0.0010 0.2178 0.4010
Cost electricity 18 0.6409 0.0042 0.2411 0.3352
Net book value
Machinery 14 0.6484 0.0121 0.3958 0.1613
Cost
transportation 12 0.0153 0.0153 0.2398 0.4529
Cost fuel 17 0.6763 0.0962 0.4885 0.0467
Cost Rental 13 0.1758 0.5866 0.6552 0.0151
Oldest
Building 16 -0.0502 0.8536 0.5547 0.0257

41
Positive correlations were seen between electricity efficiency and several
energy/resource intensive costs – water, electricity, transportation and fuel. This
could indicate that factories using one resource efficiently may be more likely to
do so with other resources, however further examination would be necessary to
clarify and support this hypothesis.
Though the data is limited at present, analysis does help to indicate some
possible trends which can be further explored in the future and helps to provide
some validity to assumptions made around factories and efficiency. In the next
section these results will be compared to those for Haiti and Vietnam.
Comparison to Earlier Works
As has been mentioned, much of the work in this paper was built upon the
work done by Rebecca Drejet on the Better Work Vietnam dataset and by
Maureen Sarewitz on the Better Work Haiti dataset. The following table
illustrates some findings across the Better Work Haiti, Jordan and Vietnam
datasets. More detailed findings from these works can be found in Appendices 7
(Tables 1-3) and 8 (Tables 1 and 2).

42
Table 10: Comparison Statistics: Haiti, Jordan, And Vietnam
Haiti Jordan Vietnam
Number of Factories 24 29 53
Mean Number of Employees 970 923 1,072
Minimum Number of Employees 53 6 20
Maximum Number of Employees 2,600 4,900 8,550
Average Quarterly Sales (USD) $358,107 $7,321,573 $3,719,458
Maximum Quarterly Sales (USD) $897,098 $31,000,000 $50,000,000
Average Age of Oldest Building 19 9.7 9
Average Cost of Electricity as a
Percentage of Total Cost
37.2% 30.1% 33.7%
Average Cost of Water as a
Percentage of Total Cost
3.2% 10.4% 3.0%
Average Cost of Fuel as a
Percentage of Total Cost
28.7% 17.9% 21.9%
Perception of Electrical Costs as an
Obstacle to Production (Mean
Score)
1.07 1.95 1.88
Perception of Water Costs as an
Obstacle to Production (Mean
Score)
2.20 2.17 2.45
Perception of Dollar Fluctuations
as an Obstacle to Production (Mean
Score)
2.13 2.63 1.86
As countries, Jordan, Haiti and Vietnam are very different, although there
are some similarities that are important to highlight. According to the UN’s
Human Development report, which monitors indicators such as education, life
expectancy, GNP and others, both Jordan and Vietnam are Medium Human

43
Development countries while Haiti is a Low Human Development country
(UNDP 2013). To some extent this may be seen in the previous table, all of the
countries have garment factories with a similar average number of employees, yet
the sales figures for Jordan and Vietnam are substantially higher. Jordan and
especially Vietnam are home to a number of very large factories, the largest of
which report sales of over thirty and fifty times the sales of the largest Haitian
factory. It is also clear that the Haitian industry is dealing with considerably older
infrastructure, with the average age of buildings almost a decade older than those
in the other countries.
Haitian factories, of the three, report the highest average percent
production costs from electrical and fuel expenses. Maureen Sarewitz posited that
the high fuel expenses were likely due to the reliance on backup generators due to
the unreliable nature of grid electricity in the country (Sarewitz 2013). Despite its
notoriously unreliable power grid, Haitian managers actually reported electrical
disruptions as less of an obstacle than their Vietnamese counterparts and roughly
equal to those in Jordan with an average score of 2.27 (where 1: Serious Problem
and 4: Not a Problem), while the averages in Jordan and Vietnam were 2.30 and
1.82, respectively. It is somewhat surprising that Jordan has the lowest perception
of electricity costs as an obstacle given the energy problems the country faces.
However the comparably higher costs and perceptions of issues around water are
understandable since it is located in one of the world’s driest regions and faces the
water concerns previously described.

44
Managers from all three countries list a lack of skilled workers and low
efficiency as top production obstacles. Given the geographic diversity this may
suggest a shortcoming in the industry as a whole, likely caused by a lack of
attractive wages. This might be one of the few areas where an outside
organization such as Better Work could easily implement programs to support
factories by helping to educate workers in the skills needed once those were
clearly defined, though if this is simply caused by low wages there is little Better
Work can do to directly assist. In Jordan, specifically helping to foster a better
reputation for the industry could also aid in this regard by attracting workers who
have the necessary skills but dislike or fear the factory environment.
The smaller amount of data available for Haiti limited findings with regard
to electricity expenses per unit produced, although a similar trend to that seen in
Vietnam of larger factories producing at greater efficiency was noted (Sarewitz
2013). This trend continuesto hold true when these data are corrected for the
differences in methodology described previously. As can be seen in Table 11,
factories in Vietnam and Jordan produce garments in the range of two to five US
cents in electricity per piece (Vietnam - 35.40%, Jordan -33.33%), and also under
2 US cents per piece (Vietnam - 50%, Jordan - 44.45%) in similar proportions to
each other. In the under two US cents per piece group, Jordan shows a greater
proportion producing under one US cent while Vietnam has a greater proportion
producing in the two to five US cents range. Jordan also has a slightly higher
proportion of factories producing over five US cents per garment.
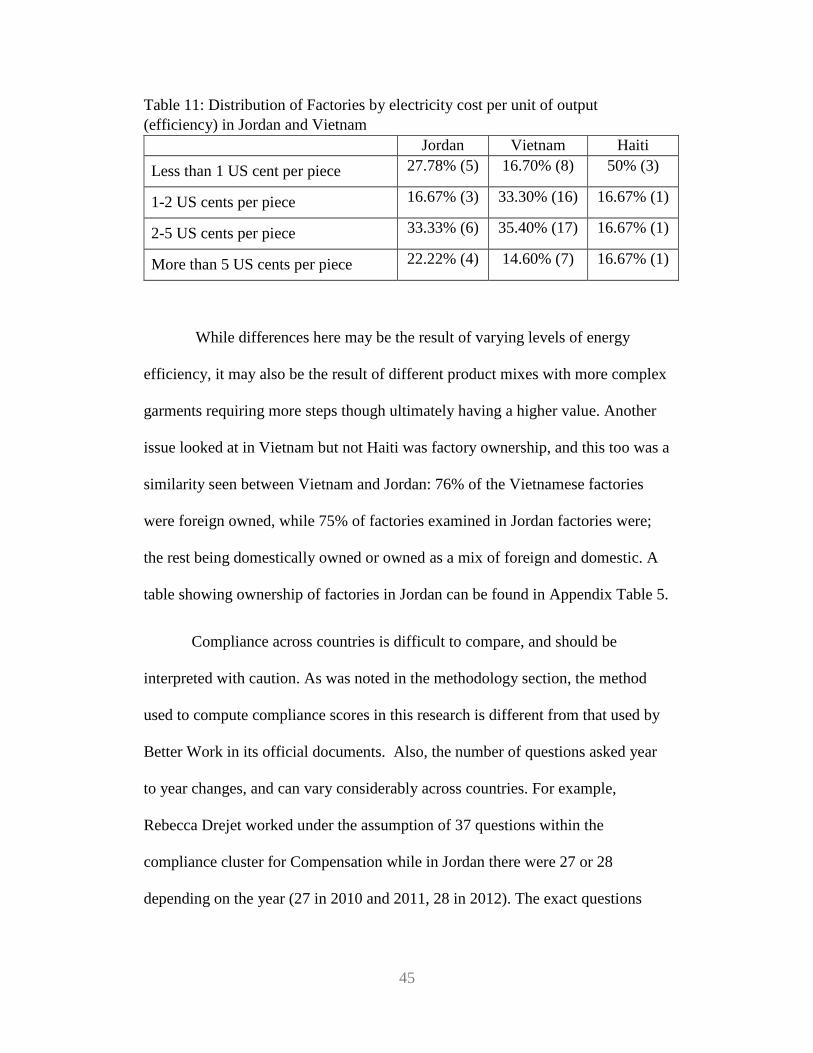
45
Table 11: Distribution of Factories by electricity cost per unit of output
(efficiency) in Jordan and Vietnam
Jordan Vietnam Haiti
Less than 1 US cent per piece 27.78% (5) 16.70% (8) 50% (3)
1-2 US cents per piece 16.67% (3) 33.30% (16) 16.67% (1)
2-5 US cents per piece 33.33% (6) 35.40% (17) 16.67% (1)
More than 5 US cents per piece 22.22% (4) 14.60% (7) 16.67% (1)
While differences here may be the result of varying levels of energy
efficiency, it may also be the result of different product mixes with more complex
garments requiring more steps though ultimately having a higher value. Another
issue looked at in Vietnam but not Haiti was factory ownership, and this too was a
similarity seen between Vietnam and Jordan: 76% of the Vietnamese factories
were foreign owned, while 75% of factories examined in Jordan factories were;
the rest being domestically owned or owned as a mix of foreign and domestic. A
table showing ownership of factories in Jordan can be found in Appendix Table 5.
Compliance across countries is difficult to compare, and should be
interpreted with caution. As was noted in the methodology section, the method
used to compute compliance scores in this research is different from that used by
Better Work in its official documents. Also, the number of questions asked year
to year changes, and can vary considerably across countries. For example,
Rebecca Drejet worked under the assumption of 37 questions within the
compliance cluster for Compensation while in Jordan there were 27 or 28
depending on the year (27 in 2010 and 2011, 28 in 2012). The exact questions

46
asked may be different or more specified for different countries and different
years.
That being said, a few findings can be noted and may be of future interest:
Vietnam and Jordan scored similarly in Child Labor (though as described
previously these issues were quickly resolved in Jordan) while Haiti saw no non-
compliance. Jordan scored considerably better in the area of Occupational Health
and Safety than the other two countries while falling between them with regard to
Working Time compliance. The Overall compliance scores were all relatively
similar, within one or two percent of each other; these may be the most
comparable averages as the number of questions may help to minimize the
possible discrepancies in variable weight caused by the number of questions
asked within clusters for the different countries.
The Vietnam dataset is considerably larger than those for the other
countries, and a greater number of correlations were identified for both of the
Pearson’s correlation tests run (against employee numbers and electrical cost per
unit produced). Correlations which were identified in the analysis performed for
this paper and which had comparable correlations in the Vietnam analysis appear
with the same directionality indicating similar trends. The only correlation seen
with energy expense per piece in both analyses was with two somewhat
comparable variables: Oldest Building for Jordan and Year Opened for Vietnam.
This would indicate a tendency for newer factories to be more energy efficient,
which could relate to newer facilities employing more energy efficient equipment.

47
Spearman's rank correlation tests were not performed in Vietnam or Haiti, so
results from that test cannot be compared.
5. Conclusion
This paper analyzed the Better Work program in Jordan, examining the
context in which the program is operating, the nature of the garment industry and
energy use. Statistical analysis was performed to create an understanding of the
data available through the program and to look for possible correlations with
energy use, specifically with regard to worker outcome measures. While such
correlations were not seen to a significant degree in this paper, many limitations
in the dataset presently exist and future examinations should be conducted on this
and other Better Work countries to look for such trends.
The Jordanian garment industry has seen tremendous growth over the past
decade, indicating greater industrialization and economic development (Domat
Glass and Brown 2012). Jordan has future potential for growth as is more
developed in some ways than other markets where the garment industry has
expanded: having higher education rates (Better Work Jordan 2012a), 98%
electrification (Verme 2011) and other significant developments. While the
garment sector has grown substantially due in large part to US intervention in the
form of the Qualifying Industrial Zone Act and the Jordan-US Free Trade
Agreement, questions remain as to how effective these measures are beyond their
economic impact, with working conditions being of particular concern (Gaffney
2005).

48
Energy in Jordan is a significant hurdle the country must face. Presently
energy subsides have resulted in considerable public debt, and plans are in place
to increase electricity tariffs (Jordan Times 2013a), which could impact
businesses. There is great potential for energy savings in the Jordanian industrial
sector through measures such as equipment upgrades, and garment production
makes up a significant proportion of this sector (Al-Ghandoor ALSalaymeh Al-
Abdallat and Al-Rawashdeh 2013). These savings would benefit firms by
decreasing costs, but may have an impact on workers as well.
Identifying relationships between worker outcomes and other aspects of
firm performance can play a significant role in promoting programs such as Better
Work. Businesses are driven largely through profit motive, and participation in
energy saving measures is influenced by the potential of heightened profitability
(Akash and Mohsen 2002; Worrell Laitner Ruth and Finman 2003). If worker
protection measures and/or heightened worker outcomes are found to correlate
with productivity (energy efficiency being the proxy used here in this paper) it
furthers the case that such initiatives are good for business.
Literature showing improved worker health related to energy efficiency
changes (Fisk 2000) and rising wages (Brown Dehejia and Robertson 2011) is
also encouraging; absent direct correlation between worker outcomes and
productivity gains it can be shown that projects which benefit the firm (through
decreased energy expenses) can also help workers.
Beyond the potential impact of rising energy expenses, Jordan also faces
potentially severe water scarcity. In this paper it was noted that sampled firms

49
faced higher proportional water costs than the Better Work factories in Haiti or
Vietnam. While not discussed in this paper there are potential areas for savings
here, through activities such as waste water recycling and evaporation control.
However, these may not have as direct a link with worker outcomes as energy
savings may (particularly with regard to health and safety), though any savings
could potentially increase productivity. Water use proxy variables could be
created in a similar manner to the electricity use variables used in this analysis to
further examine this issue.
There is great potential for future work in this area, both in Jordan and
elsewhere. In the future, once more data is available, insights could be gained by
identifying temporal trends between a number of variables such as production
numbers or efficiency increases or decreases against changing compliance levels.
Variables could be created showing the amount of change in overall compliance,
which could be compared to change in production level, electricity use, water use,
revenue, or any other factor measured by the surveys. At present, this does not
seem feasible in any of the Better Work countries since the programs have not
been in effect long enough and data prior to the initiation of programs is not
available.
Ideally, were this concept to be examined in full, more direct
measurements of energy efficiency would be desirable. This could be
accomplished by measuring how much energy is actually used rather than
working backward from expenses. Case studies for a number of factories could
also provide insight. As it stands it is difficult to get a clear picture of the

50
operations of many of these factories. They range widely in size and product, and
it is unclear what steps in the garment process actually take place within a factory
(though a clearer idea could possibly be discerned through compiling data from
the industrial engineer surveys not examined in this paper). This would be
valuable in identifying potential energy savings measures and the relation they
might have to worker safety, as the little literature which is available is more
closely related to textile washing and dyeing than garment assembly (Ozturk
2004). Case studies could also help in determining best practices by comparing
efficient versus inefficient factory operations.
While it may not be possible at present to identify a causal relationship
between worker protection initiatives and energy savings, it is intuitively clear
that some energy saving measures benefit workers. (Provide example to support
the second half of this statement) Furthermore, one of the problems noted in
Jordan is the lack of skilled labor, and measures which produce a cleaner and
safer work environment may help to fill this labor gap. Jordan has a very well
educated but unemployed potential workforce who do not seek employment in
factories due to the reputation of the poor working conditions found there (World
Bank 2008). Correcting these issues and changing this perception could both
increase the availability of skilled workers and increase employment of native
Jordanians.
The ILO and Better Work Jordan have already made considerable strides
in providing a greater voice to workers in the garment industry, with changes in
laws that protect workers and increase the power of labor unions to affect change

51
(ILO 2013b). Moving forward organizations like Better Work could help facilitate
education of firm managers as to the impact simple changes and proper
application of skill on their production expenses (Akash and Mohsen 2002). This
has the added potential for environmental benefits and makes business sense in
the face of energy price fluctuations.
This paper was unable to demonstrate some of the correlations seen in the
previous work done in Vietnam (Drejet and Rappaport 2012). However,
relationships were outlined that indicate that firms efficient in use of one resource
are more likely to efficiently use others. This paper also did not show the opposite
– that diminished worker outcomes lead to greater efficiency, and it is possible
that the relationship may be revealed if reexamined at a time when a larger dataset
is available.
The issues at play are multifaceted, and industries in various countries will
face different challenges. While making a blanket statement that protecting
workers and their interests is beneficial to business may be overreaching based on
this analysis, it appears fair to say that improving worker outcomes while
achieving greater productivity is very much possible, and that actions taken
toward one of these ends may advance the other.

52
6. Appendix
Appendix Table 1: Better Work Jordan Compliance Clusters and Points
(Better Work Jordan 2012: Garment Industry 4th Compliance Synthesis Report)
Compliance Clusters Compliance Points
Co
re L
ab
ou
r S
tan
dard
s 1 Child Labour 1. Child Labourers
2. Unconditional Worst Forms
3. Hazardous Work
4. Documentation and Protection of Young Workers
2 Discrimination 5. Race and Origin
6. Religion and Political Opinion
7. Gender
8. Other Grounds
3 Forced Labour 9. Coercion
10. Bonded Labour
11. Forced Labour and Overtime
12. Prison Labour
4 Freedom of Association
and Collective Bargaining
13. Union Operations
14. Interference and Discrimination
15. Collective Bargaining
16. Strikes
Work
ing C
on
dit
ion
s
5 Compensation 17. Minimum wages
18. Overtime wages
20. Method of Payment
21. Wage Information, Use and Deduction
22. Paid Leave
23. Social Security and Other Benefits
6 Contracts and Human Resources
24. Employment Contracts
25. Contracting Procedures
26. Termination
27. Discipline and Disputes
7 Occupational Safety and Health
28. OSH Management Systems
29. Chemicals and Hazardous Substances
30. Worker Protection
31. Working Environment
32. Health Services and First Aid
33. Welfare Facilities
34. Worker Accommodation
35. Emergency Preparedness
8 Working Time 36. Regular Hours
37. Overtime
38. Leave

53
Appendix Table 2: (Table 5 Extended): Perception of Production Management
Obstacles to Business’ Success
Serious
problem
(1)
Modest
problem
(2)
Minor
problem
(3)
Not a
problem
(4)
Mean
Score
(1-4)
Shortage of skilled
workers 70.83% 16.67% 12.50% 0.00% 1.42
High workforce
turnover 50.00% 31.82% 13.64% 4.55% 1.73
Low skill of workers 50.00% 29.17% 12.50% 8.33% 1.79
Low efficiency rate 37.50% 37.50% 20.83% 4.17% 1.92
Customer penalties
for late delivery 43.48% 21.74% 30.43% 4.35% 1.96
Change in technical
requirements by the
customer after
production has begun
33.33% 33.33% 20.83% 12.50% 2.13
Disruptions in
electricity 34.78% 17.39% 30.43% 17.39% 2.3
Uncertain orders from
customers 43.48% 8.70% 21.74% 26.09% 2.3
Stress level of
supervisors 26.09% 30.43% 21.74% 21.74% 2.39
Too many rush orders 12.50% 41.67% 33.33% 12.50% 2.46
Customers lack
knowledge of
Jordanian labor law
20.83% 29.17% 25.00% 25.00% 2.54
Labor management
skills of managers
and supervisors
21.74% 26.09% 26.09% 26.09% 2.57
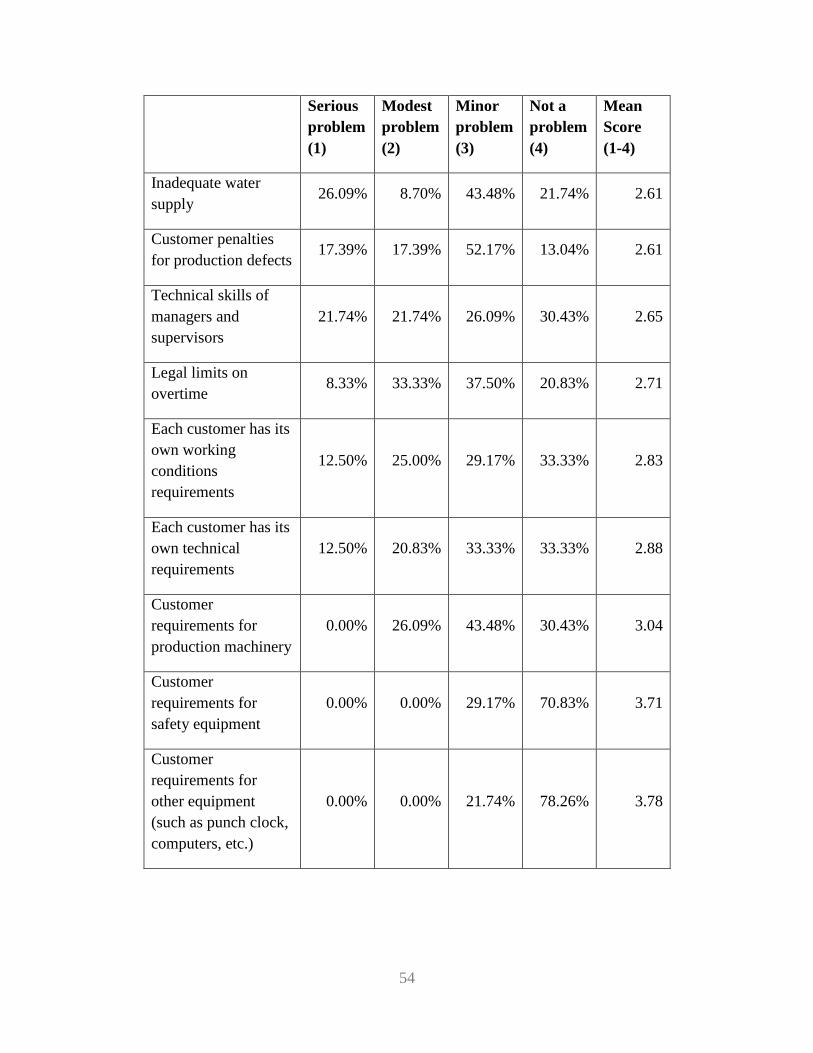
54
Serious
problem
(1)
Modest
problem
(2)
Minor
problem
(3)
Not a
problem
(4)
Mean
Score
(1-4)
Inadequate water
supply 26.09% 8.70% 43.48% 21.74% 2.61
Customer penalties
for production defects 17.39% 17.39% 52.17% 13.04% 2.61
Technical skills of
managers and
supervisors
21.74% 21.74% 26.09% 30.43% 2.65
Legal limits on
overtime 8.33% 33.33% 37.50% 20.83% 2.71
Each customer has its
own working
conditions
requirements
12.50% 25.00% 29.17% 33.33% 2.83
Each customer has its
own technical
requirements
12.50% 20.83% 33.33% 33.33% 2.88
Customer
requirements for
production machinery
0.00% 26.09% 43.48% 30.43% 3.04
Customer
requirements for
safety equipment
0.00% 0.00% 29.17% 70.83% 3.71
Customer
requirements for
other equipment
(such as punch clock,
computers, etc.)
0.00% 0.00% 21.74% 78.26% 3.78
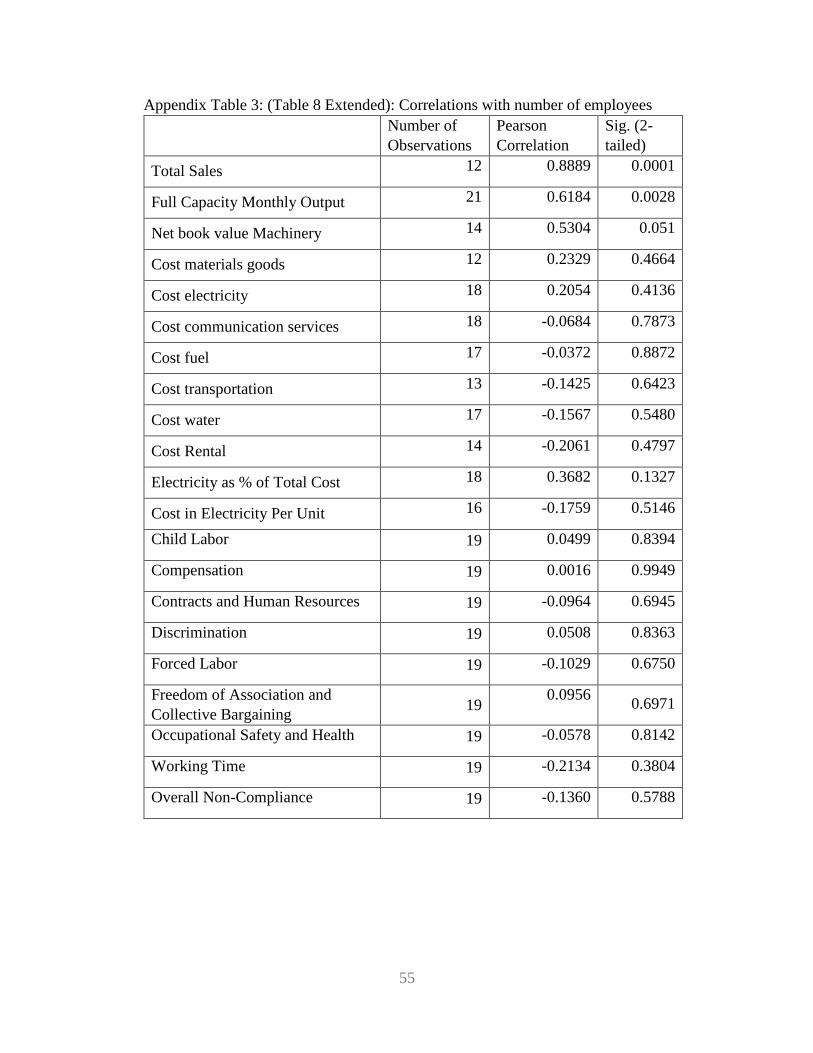
55
Appendix Table 3: (Table 8 Extended): Correlations with number of employees
Number of
Observations
Pearson
Correlation
Sig. (2-
tailed)
Total Sales 12 0.8889 0.0001
Full Capacity Monthly Output 21 0.6184 0.0028
Net book value Machinery 14 0.5304 0.051
Cost materials goods 12 0.2329 0.4664
Cost electricity 18 0.2054 0.4136
Cost communication services 18 -0.0684 0.7873
Cost fuel 17 -0.0372 0.8872
Cost transportation 13 -0.1425 0.6423
Cost water 17 -0.1567 0.5480
Cost Rental 14 -0.2061 0.4797
Electricity as % of Total Cost 18 0.3682 0.1327
Cost in Electricity Per Unit 16 -0.1759 0.5146
Child Labor 19 0.0499 0.8394
Compensation 19 0.0016 0.9949
Contracts and Human Resources 19 -0.0964 0.6945
Discrimination 19 0.0508 0.8363
Forced Labor 19 -0.1029 0.6750
Freedom of Association and
Collective Bargaining 19
0.0956 0.6971
Occupational Safety and Health 19 -0.0578 0.8142
Working Time 19 -0.2134 0.3804
Overall Non-Compliance 19 -0.1360 0.5788
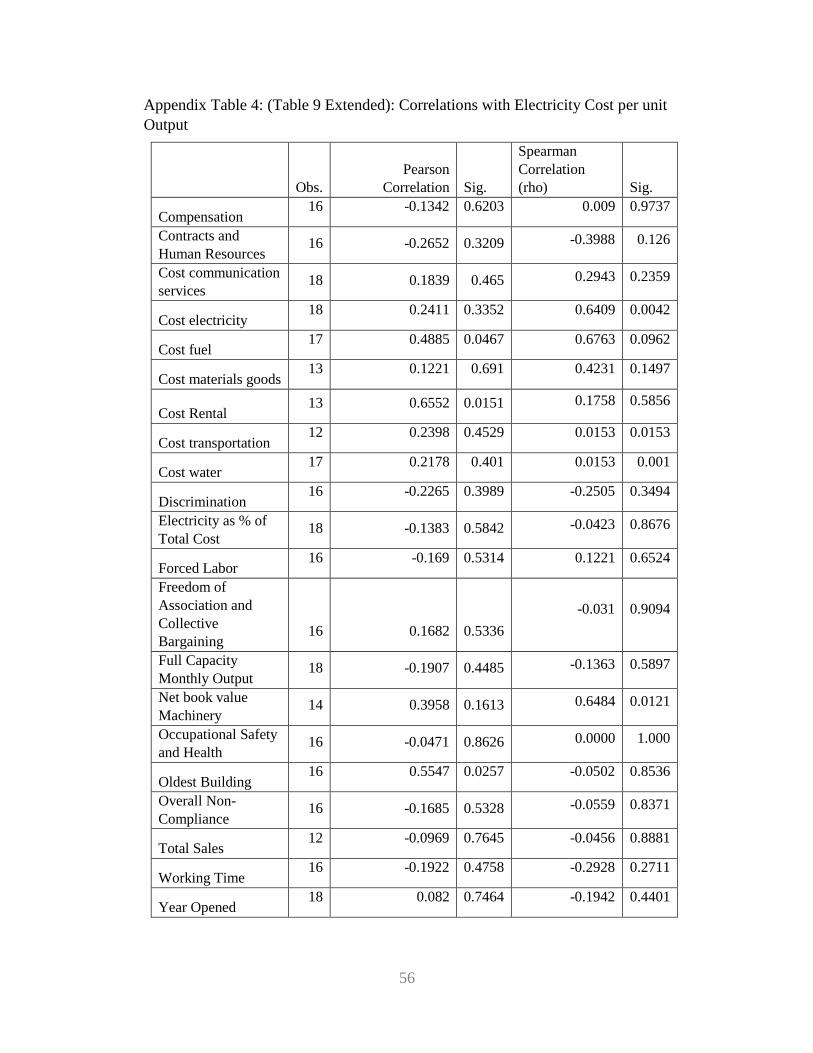
56
Appendix Table 4: (Table 9 Extended): Correlations with Electricity Cost per unit
Output
Obs.
Pearson
Correlation Sig.
Spearman
Correlation
(rho) Sig.
Compensation 16 -0.1342 0.6203 0.009 0.9737
Contracts and
Human Resources 16 -0.2652 0.3209 -0.3988 0.126
Cost communication
services 18 0.1839 0.465 0.2943 0.2359
Cost electricity 18 0.2411 0.3352 0.6409 0.0042
Cost fuel 17 0.4885 0.0467 0.6763 0.0962
Cost materials goods 13 0.1221 0.691 0.4231 0.1497
Cost Rental 13 0.6552 0.0151 0.1758 0.5856
Cost transportation 12 0.2398 0.4529 0.0153 0.0153
Cost water 17 0.2178 0.401 0.0153 0.001
Discrimination 16 -0.2265 0.3989 -0.2505 0.3494
Electricity as % of
Total Cost 18 -0.1383 0.5842 -0.0423 0.8676
Forced Labor 16 -0.169 0.5314 0.1221 0.6524
Freedom of
Association and
Collective
Bargaining 16 0.1682 0.5336
-0.031 0.9094
Full Capacity
Monthly Output 18 -0.1907 0.4485 -0.1363 0.5897
Net book value
Machinery 14 0.3958 0.1613 0.6484 0.0121
Occupational Safety
and Health 16 -0.0471 0.8626 0.0000 1.000
Oldest Building 16 0.5547 0.0257 -0.0502 0.8536
Overall Non-
Compliance 16 -0.1685 0.5328 -0.0559 0.8371
Total Sales 12 -0.0969 0.7645 -0.0456 0.8881
Working Time 16 -0.1922 0.4758 -0.2928 0.2711
Year Opened 18 0.082 0.7464 -0.1942 0.4401

57
Appendix Table 5: Ownership of Jordanian Factories
100%
Domestic
100%
Foreign
Half
Domestic
Half Foreign
Other*
Responses 2 15 1 2
% of Total 10% 75% 5% 10%
*Other % combination or a response totaling less than 100%.
Appendix Table 6: Distribution of electrical cost per units produced in Jordan
using Sarewitz Method
% Frequency Frequency
Less than 1 US cent per piece 11.11% 2
1-2 US cents per piece 11.11% 2
2-5 US cents per piece 11.11% 2
More than 5 US cents per piece 66.67% 12
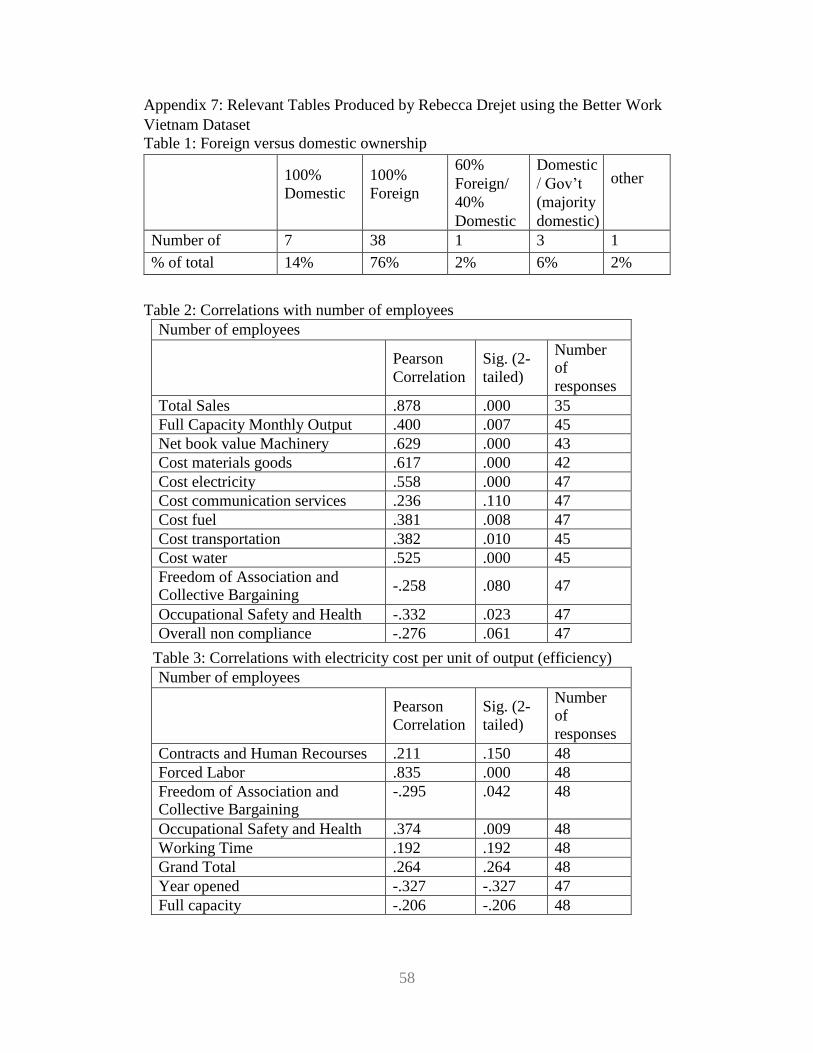
58
Appendix 7: Relevant Tables Produced by Rebecca Drejet using the Better Work
Vietnam Dataset
Table 1: Foreign versus domestic ownership
100%
Domestic
100%
Foreign
60%
Foreign/
40%
Domestic
Domestic
/ Gov’t
(majority
domestic)
other
Number of
responses
7 38 1 3 1
% of total 14% 76% 2% 6% 2%
Table 2: Correlations with number of employees
Number of employees
Pearson
Correlation
Sig. (2-
tailed)
Number of
responses
Total Sales .878 .000 35
Full Capacity Monthly Output .400 .007 45
Net book value Machinery .629 .000 43
Cost materials goods .617 .000 42
Cost electricity .558 .000 47
Cost communication services .236 .110 47
Cost fuel .381 .008 47
Cost transportation .382 .010 45
Cost water .525 .000 45
Freedom of Association and Collective Bargaining
-.258
.080
47
Occupational Safety and Health -.332 .023 47
Overall non compliance -.276 .061 47
Table 3: Correlations with electricity cost per unit of output (efficiency)
Number of employees
Pearson
Correlation
Sig. (2-
tailed)
Number of
responses
Contracts and Human Recourses .211 .150
48
Forced Labor .835 .000 48
Freedom of Association and Collective Bargaining
-.295 .042 48
Occupational Safety and Health .374 .009 48
Working Time .192 .192 48
Grand Total .264 .264 48
Year opened -.327 -.327 47
Full capacity -.206 -.206 48
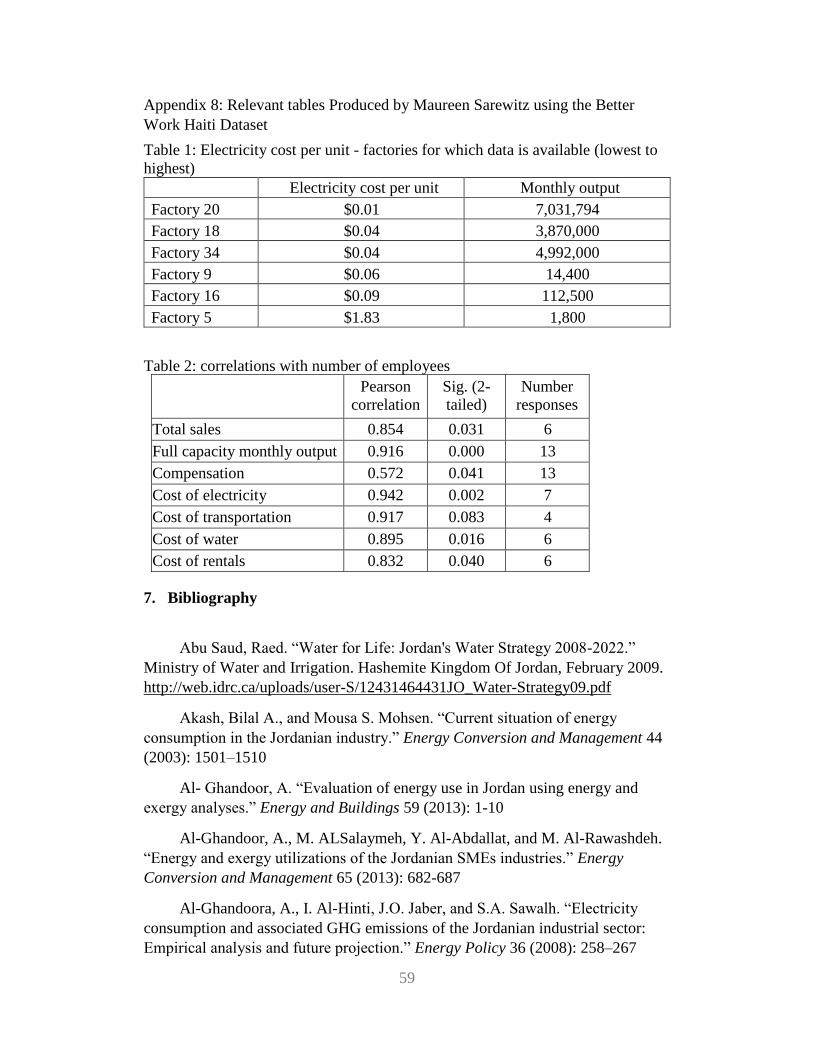
59
Appendix 8: Relevant tables Produced by Maureen Sarewitz using the Better
Work Haiti Dataset
Table 1: Electricity cost per unit - factories for which data is available (lowest to
highest)
Electricity cost per unit Monthly output
Factory 20 $0.01 7,031,794
Factory 18 $0.04 3,870,000
Factory 34 $0.04 4,992,000
Factory 9 $0.06 14,400
Factory 16 $0.09 112,500
Factory 5 $1.83 1,800
Table 2: correlations with number of employees
Pearson
correlation
Sig. (2-
tailed)
Number
responses
Total sales 0.854 0.031 6
Full capacity monthly output 0.916 0.000 13
Compensation 0.572 0.041 13
Cost of electricity 0.942 0.002 7
Cost of transportation 0.917 0.083 4
Cost of water 0.895 0.016 6
Cost of rentals 0.832 0.040 6
7. Bibliography
Abu Saud, Raed. “Water for Life: Jordan's Water Strategy 2008-2022.”
Ministry of Water and Irrigation. Hashemite Kingdom Of Jordan, February 2009.
http://web.idrc.ca/uploads/user-S/12431464431JO_Water-Strategy09.pdf
Akash, Bilal A., and Mousa S. Mohsen. “Current situation of energy
consumption in the Jordanian industry.” Energy Conversion and Management 44
(2003): 1501–1510
Al- Ghandoor, A. “Evaluation of energy use in Jordan using energy and
exergy analyses.” Energy and Buildings 59 (2013): 1-10
Al-Ghandoor, A., M. ALSalaymeh, Y. Al-Abdallat, and M. Al-Rawashdeh.
“Energy and exergy utilizations of the Jordanian SMEs industries.” Energy
Conversion and Management 65 (2013): 682-687
Al-Ghandoora, A., I. Al-Hinti, J.O. Jaber, and S.A. Sawalh. “Electricity
consumption and associated GHG emissions of the Jordanian industrial sector:
Empirical analysis and future projection.” Energy Policy 36 (2008): 258–267

60
Anani, Ali and Faisal Abu-Allan. “Potential of renewable energy in Jordan.”
Solar & Wind Technology 5, 4 (1988): 451-454
Associated Press. “Bangladesh: Garment Shop Fire Kills 10.” The New
York Times, October 8, 2013.
http://www.nytimes.com/2013/10/09/world/asia/bangladesh-garment-shop-fire-
kills-10.html?_r=0
Atzori, Daniel. "The Iraqi-Jordanian Pipeline Deal." About Oil, April 2013.
http://www.abo.net/oilportal/topic/view.do?contentId=2103830
Bar, Gabby and Alkobi, Hani. "Qualifying Industrial Zones (QIZ's)." State
of Israel, Ministry of the Economy. Accessed September, 2013.
http://www.moit.gov.il/NR/exeres/2124E799-4876-40EF-831C-
6410830D8F02.htm.
Better Work Jordan (2012a). “Better Work Jordan: Garment Industry 4th
Compliance Synthesis Report.” Better Work, ILO IFC, November 14, 2012
Better Work Jordan (2012b). “Better Work Jordan Newsletter, No. 5,
January-March 2012.” Better Work Jordan, ILO and IFC, January 2012.
http://betterwork.com/jordan/wp-content/uploads/BWJ-Newsletter-No.-5-Jan-
March-2012.pdf
Better Work Jordan (2013a). “Better Work Jordan.” Countries. Better Work
Jordan, ILO and IFC. Last Modified September 2012. Accessed September 2013.
http://betterwork.org/global/?page_id=320
Better Work Jordan (2013b). “Facts and Figures.” The Program. Better
Work Jordan, ILO and IFC. Last Modified 2012. Accessed September 2013.
http://betterwork.org/jordan/?page_id=20
Better Work Jordan (2013c). “Participating Buyers.” Partners. Better Work
Jordan, ILO and IFC. Last Modified 2012. Accessed September 2013.
http://betterwork.org/jordan/?page_id=267
Blanco, Esther, Javier Rey-Maquierira and Javier Lozano. “The Economic
Impacts of Voluntary Environmental Performance of Firms: A Critical Review.”
Journal of Economic Surveys 23, 3 (2009): 462-502
Bolle, Mary Jane, Alfred B. Prados, and Jeremy M. Sharp. “Qualifying
Industrial Zones in Jordan and Egypt.” The Library of Congress, Congressional
Research Service: Foreign Affairs, Defense, and Trade Division, July 5, 2006
Boyd, Gale A. and Joseph X. Pang. “Estimating the linkage between energy
efficiency and productivity.” Energy Policy 28, 5 (May 2000): 289–296
Brown, Drusilla, Rajeev Dehejia, and Raymond Robertson. “Is There a
Business Case for Improving Labor Standards? Some Evidence from Better
61
Factories Cambodia.” Working Paper, Tufts University and Macalester College,
August 11, 2011
Brown, Drusilla, Rajeev Dehejia, Raymond Robertson and Selevn
Veeraragoo. “Are Sweatshops Profit-Maximizing? Evidence from Better Work
Vietnam.” Internal Manuscript, Tufts University, July 31, 2011
Butros, Raghda and Baker Al-Hiyari. “Employment of Jordanians in the
Garment Industry: Challenges and Prospects” Better Work Jordan, ILO and IFC,
August 2012
Better Work (2013a). “Assessment Services.” Services. Better Work Jordan,
ILO and IFC. Last Modified 2012. Accessed September 2013
http://betterwork.org/global/?page_id=333
Better Work (2013b). “Advisory Services.” Services. Better Work Jordan,
ILO and IFC. Last Modified 2012. Accessed September 2013
http://betterwork.org/global/?page_id=339
Better Work (2013c). “Donors.” Donors. Better Work Jordan, ILO and IFC.
Last Modified 2012. Accessed September 2013
http://betterwork.org/global/?page_id=356
D’Amico, Sandra, Oum Sokuntheary, and Isabelle Duzer. “Energy
Performance In The Cambodia Garment Sector: A Benchmarking Survey.” Better
Work, ILO and IFC, Novemer 2009
Denny, Elaine, Kristina Donnelly, Roland McKay, Geoffroy Ponte, and
Tetsuya Uetake. “Sustainable Water Strategies for Jordan.” International
Economic Development Program, University of Michigan, April 2008
Domat, George, Benjamin Glass, and Drusilla Brown. “The Apparel
Industry: Jordan’s Comparative Advantage in International Trade.” Internal
Manuscript, Tufts University, December 12, 2012
Drake, Christine. “Water Resource Conflicts in the Middle East.” Journal of
Geography 96, 1 (January/February 1997): 4-12
Drejet, Rebecca and Rappaport, Ann. “Energy Efficiency and Worker
Outcomes in Vietnamese Apparel Factories.” Internal Manuscript, Tufts
University, 2012
European Union. “The EU agrees to grant Jordan “advanced status”
partnership.” Press Release Database. European Union, Last Modified October
26, 2010. Accessed November 2013. http://europa.eu/rapid/press-release_IP-10-
1388_en.htm

62
European Commission. “Jordan.” Trade. European Commission. Last
Modified November 19, 2013. Accessed November 2013.
http://ec.europa.eu/trade/policy/countries-and-regions/countries/jordan/
Federal Register. “Mission Statement; Jordan and Egypt Business
Development Mission.” A Notice by the International Trade Administration,
February 14-19, 2009. https://www.federalregister.gov/articles/2009/01/14/E9-
630/mission-statement-jordan-and-egypt-business-development-mission-february-
14-19-2009
Fisk, William J. “Health and Productivity Gains From Better Indoor
Environments and Their Relationship with Building Efficiency.” Annual Review
of Energy and Environment 25 (2000): 537-566
Gaffney, Joseph Patrick. “Jordan’s Qualified Industrial Zones: A Qualified
Success?.” Masters Thesis. University of Pennsylvania, 2005
Habau, S. M., M. A. S. Hamdan, B. A. Jubran, and Adnan I. O. Zaid.
“Assessment And Applications Of Wind Energy In Jordan.” Solar Energy 40, 2
(1988): 99-105
ILO (2013a). “Better Work.” Areas of Work. International Labor
Organization. Last Modified 2013. Accessed November 2013.
http://www.ilo.org/washington/areas/better-work/lang--en/index.htm
ILO (2013b). “More rights for Jordan’s garment workers.” ILO Newsroom.
International Labor Organization. Last Modified November 1, 2013. Accessed
November 2013. http://www.ilo.org/global/about-the-
ilo/newsroom/features/WCMS_228131/lang--en/index.htm
ILO (2013c). “Jordan moves to prevent fire risks in factories and
dormitories.” ILO Regional Office for the Arab States. Last Modified April 26,
2013. Accessed December 2013. http://www.ilo.org/beirut/media-
centre/news/WCMS_217684/lang--en/index.htm
Jaber, J.O., and Probert, S.D. “Energy demand, poverty and the urban
environment in Jordan.” Applied Energy 68 (2001): 119-134
Jordan Times (2013a). “Electricity price rise to go into effect after
Ramadan.” Jordan Times, July 6, 2013. http://jordantimes.com/electricity-price-
rise-to-go-into-effect-after-ramadan
Jordanian Times (2013b). “Electricity rate hikes set for 2013, 2014.” Jordan
Times, December 17, 2013. http://jordantimes.com/article/electricity-rate-hikes-
set-for-2013-2014
Kalan, Jonathan. “Migrant workers in Jordan are making their voices
heard.” ILO Newsroom. International Labor Organization. Last Modified

63
December 12, 2012. Accessed November 2013. http://www.ilo.org/global/about-
the-ilo/newsroom/features/WCMS_195584/lang--en/index.htm
Kelly H. C., P. D. Blair, and J. H. Gibbons “Energy Use and Productivity:
Current Trends and Policy Implications.” Annual Review of Energy 14
(November 1989): 321-352
Luck, Taylor. “‘Unstable’ Gas Supplies Highlight Potential Energy Crisis in
Jordan." The Jordan Times. Novemebr 27, 2011 Available in Copy:
http://www.menafn.com/qn_news_story_s.aspx?storyid=1093459143
Malkawi, Khetam. “Jordan faces challenge of meeting migrants' health
demands –– study.” The Jordan Time, August 28, 2012.
http://jordantimes.com/jordan-faces-challenge-of-meeting-migrants-health-
demands----study
Mehta, Manik. “The Global Economic Crisis and the Changing Pattern of
Sourcing.” Apparel. Last Modified August 7, 2013. Accessed November 2013.
http://apparel.edgl.com/case-studies/The-Global-Economic-Crisis-and-the-
Changing-Pattern-of-Sourcing87751
Miller, Terry, Kim R. Holmes, and Edwin J. Feulner. “Highlights of the
2013 Index of Economic Freedom: Promoting Economic Opportunity and
Prosperity.” The Heritage Foundation and The Wall Street Journal, 2013.
http://www.heritage.org/index/pdf/2013/book/index_2013.pdf
Momani, Bessma. “A Middle East Free Trade Area: Economic
Interdependence and Peace Considered.” The World Economy 30, 11 (November
2007): 1682-1700
Moore, Pete. “The Newest Jordan: Free Trade, Peace and an Ace in the
Hole.” Middle East Research and Information Project. Last Modified: June 26,
2003. Accessed November 2013. http://www.merip.org/mero/mero062603
Muneer, T., S. Maubleu, and M. Asif. “Prospects of solar water heating for
textile industry in Pakistan.” Renewable and Sustainable Energy Reviews 10
(2006): 1–23
Neimat, Khaled. “PM says lifting electricity subsidies inevitable.” The
Jordan Times, May 29, 2013. http://jordantimes.com/pm-says-lifting-electricity-
subsidies-inevitable
National Electric Power Company (NEPCO). “Electricity Tariff in Jordan.”
National Electric Power Company. Last Modified 2013. Accessed November
2013. http://www.nepco.com.jo/en/electricity_tariff_en.aspx
Özdoĝan, Sibel and Mahir Arikol. “Energy and Exergy Analyses of Selected
Turkish Industries.” Energy 20, I (1995): 73-80
64
Ozturk, Harun Kemal. “Energy usage and cost in textile industry: A case
study for Turkey.” Energy 30 (2005): 2424–2446
Rappaport, Ann. “Innovation in Haiti’s Apparel Sector 2012.” Internal
Manuscript, Tufts University, 2012
Reed, John. “Jordan poised to make electricity price rises after Ramadan.”
Financial Times, July 10, 2013. http://www.ft.com/intl/cms/s/0/dc1b1b4a-e95c-
11e2-9f11-00144feabdc0.html#axzz2joqCX525
Sarewitz, Maureen. “Hope for Haiti? An Assessment of Haiti’s Apparel
Manufacturing Industry.” Thesis, The Fletcher School of Law and Diplomacy,
Tufts University, April 25, 2013
Schuler, Kurt. “Tables of Modern Monetary History: Asia.” Originally
Posted On www.dollarization.org, Retrieved Through www.archive.org. February
29, 2004.
http://web.archive.org/web/20090224194704/http://users.erols.com/kurrency/asia.
htm
Tamimi, A. and Sameeh O'Jailat. “Analysis of Electrical Energy Generation
and Consumption in Jordan.” Energy Conversion and Management 36, 11
(November 1995): 1059–1062
Tamimi, A.“Energy situation in Jordan.” Energy Conversion and
Management 34, 6 (June 1993): 519–521
Trading Economics (2013a). “Jordan Unemployment Rate” Trading
Economics. Last Modified November 25, 2013. Accessed November 2013.
http://www.tradingeconomics.com/jordan/unemployment-rate
Trading Economics (2013b). “Jordanian Dinar” Trading Economics. Last
Modified November 25, 2013. Accessed November 2013.
http://www.tradingeconomics.com/jordan/currency
United Nations High Commissioner for Refugees (UN HCR). “2013
UNHCR country operations profile – Jordan.” United Nations High
Commissioner for Refugees. Last Modified November 25, 2013. Accessed
November 2013. http://www.unhcr.org/pages/49e486566.html
United Nations Development Programme (UNDP). Summary:Human
Development Report 2013: The Rise of the South: Human Progress in a Diverse
World.” United Nations Development Programme, 2013.
http://hdr.undp.org/en/media/HDR2013_EN_Summary.pdf
U.S. Central Intelligence World Factbook (US CIA). “Jordan.” The World
Factbook (2013-14), Central Intelligence Agency. Accessed November 2013.
https://www.cia.gov/library/publications/the-world-factbook/geos/jo.html
65
U.S. Department of Energy (US DOE). “Interrelationship between
environmental goals, productivity improvement, and increased energy efficiency
in integrated paper and steel plants.” Technical Information Center, United States
Department of Energy, June 1997
U.S. Energy Information Administration (US EIA). "Jordan." Independent
Statistics & Analysis, United States Energy Information Administration. Last
Modified May 30, 2013. Accessed November 2013.
http://www.eia.gov/countries/country-data.cfm?fips=JO
U.S. Trade Representative, Office of the (USTR). "Jordan Free Trade
Agreement." Office of the United States Trade Representative. Executive Office
of the President. Accessed November 2013. http://www.ustr.gov/trade-
agreements/free-trade-agreements/jordan-fta
U.S. Trade Representative, Office of the (USTR). “Agreement between The
United States Of America and The Hashemite Kingdom Of Jordan on the
Establishment of a Free Trade Area.” Office of the U.S. Trade Representative,
Executive Office of the President. 2000
Verme, Paolo. “Electricity Subsidies and Household Welfare in Jordan: Can
households afford to pay for the budget crisis?.” Ministry of Planning and
International Cooperation, Hashemite Kingdom Of Jordan, December 2011.
http://www.ecn.ulaval.ca/sites/ecn.ulaval.ca/files/electricity_note8.pdf
World Health Organization (WHO). “Jordan: Water is life.” Pilot Projects,
The Health and Environment Linkages Initiative, The World Health Organization.
Last Modified 2013. Accessed November 2013
http://www.who.int/heli/pilots/jordan/en/
World Bank. “Hashemite Kingdom of Jordan Resolving Jordan’s Labor
Market Paradox of Concurrent Economic Growth and High Unemployment
(Report No. 39201-JO).” Social and Economic Development Group, Middle East
and North Africa Region, The World Bank - http://ddp-
ext.worldbank.org/EdStats/JORpub08.pdf
World Bank (2013a). “Country and Lending Groups.” Data, The World
Bank. Last Modified 2013. Accessed November 2013.
http://data.worldbank.org/about/country-classifications/country-and-lending-
groups#Upper_middle_income
World Bank (2013b). “Jordan Overview.” Countries, The World Bank. Last
Modified 2013. Accessed November 2013.
http://www.worldbank.org/en/country/jordan/overview

66
Worrell, Ernst, John A. Laitner, Michael Ruth, and Hodayah Finman.
“Productivity Benefits of Industrial Energy Efficiency Measures.” Energy 28, 11
(September 2003): 1081–1098