Do informal risk-sharing groups reduce the challenge of providing weather indexed insurance product?

Work groups and knowledge sharing in a global organization
Jonathon N. Cummings
Human-Computer Interaction Institute
School of Computer Science
Carnegie Mellon University
June 3, 2001
This article is based on a dissertation submitted in partial fulfillment of the Ph.D. in Organization
Science, Carnegie Mellon University. I would like to thank my thesis committee, Bob Kraut
(Chair), Sara Kiesler, and David Krackhardt, as well as numerous faculty members in the
Department of Social and Decision Sciences for their sage advice. I also want to acknowledge
Deborah Ancona (Outside Reader), Catherine Cramton, Mark Fichman, Monica Higgins,
Eleanor Lewis, and Warren Thorngate, who made constructive comments on previous drafts of
this paper. This research was supported, in part, by the Knowledge and Distributed Intelligence
program of the National Science Foundation (#IIS-9872996).

2
Abstract
Groups incur a number of internal costs when members work in different geographic locations
and represent different functional areas. For example, it can be difficult for distributed group
members to develop a common understanding of the task, or for cross-functional group members
to reconcile dissimilar points of view. Relatively little scholarly attention, however, has been
given to the external benefits that distributed or cross-functional group members have available
to them. These include access to diverse sources of knowledge, such as customers in a variety of
locations or non-group employees from different functions. Past studies have shown a positive
relationship between external knowledge sharing and work group performance. This paper
extends previous research by examining whether distributed or cross-functional groups benefit
from external knowledge sharing more than co-located or functionally homogeneous groups. I
surveyed 182 work groups in a Fortune 500 corporation to assess how often members shared
general overviews, specific requirements, analytical techniques, progress reports, and project
results within and outside of the group. Members were located around the world, they
represented numerous functional areas, and they worked on tasks ranging from product
development to manufacturing operations. Senior managers in the company rated each work
group on their performance. I hypothesized and found that both internal and external knowledge
sharing were positively related to group performance. Building on social network theory, I also
hypothesized and found that as geographic distribution and cross-functionality increased, the
relationship between external knowledge sharing and group performance became even stronger.
These results suggest that external networks can provide distributed or cross-functional group
members with access to unique task information, know-how, and feedback.

3
Introduction
The goal of this paper is to offer insight into how geographic distribution and cross-
functionality affect the relationship between knowledge sharing and work group performance.
Consider, for a moment, examples of knowledge that members of the following distributed,
cross-functional groups shared during their projects in a Fortune 500 corporation:
– A product development group, with nine members spread across the US, Israel, and
Singapore, was charged with the task of creating a new electronics device. Members represented
the functional areas of computer-aided design, applications software, and electrical engineering.
Instead of designing a chip from scratch for use in the device, the group modified a chip design
borrowed from another group in the same location as one of the members. Toward the end of the
project, the group presented a technical paper on the results at an intra-company conference.
– A service improvement group, with ten members spread across two cities in China, was
charged with the task of upgrading a wireless network. Members represented the functional areas
of project management, quality assurance, and field engineering. Instead of conducting their own
consumer research, the group gathered satisfaction data from a marketing employee who was in
the same division as one of the members. Shortly thereafter, the group held a face-to-face
meeting with the customer to discuss ways to improve the existing network infrastructure.
– A process management group, with eight members spread across three buildings in
Illinois, was charged with the task of establishing a performance evaluation program. Members
represented the functional areas of human resources and information technology. Instead of
coming up with a program on their own, the group solicited best practices for performance
evaluation through email from other human resource managers throughout the corporation. After
synthesizing the responses, group members built a website for disseminating the best practices.

4
– A manufacturing operations group, with nine members spread across Ireland and
Scotland, was charged with the task of converting a production facility in Ireland from pagers to
cell phones. Members represented the functional areas of materials planning, product quality,
and test engineering. Instead of generating their own documentation for steps to be taken, the
group used another factory in Scotland for benchmarking every stage. Then, once the conversion
was under way, the group made suggestions to the company for improving the overall process,
such as alternative equipment specifications and training regimens.
The above examples highlight both the different kinds of knowledge that work group
members share and the different relations through which task information, know-how, and
feedback is provided and received. The examples also illustrate how work groups in global
organizations are often structured to accomplish their specialized tasks: Members are distributed
across different locations and they represent different functional areas. These features,
geographic distribution and cross-functionality, are two of the many ways that companies
compose work groups to maximize the knowledge, skills, and abilities of their employees. While
the changing nature of organizations appears to favor greater diversity in work groups
(DeSanctis & Monge, 1999; Jarvenpaa & Leidner, 1999; Maznevski & Chudoba, 2000), what are
the costs and benefits of diversity for knowledge sharing and work group performance?
In this section, I first argue that diversity is a mixed blessing for work groups. That is,
despite being able to accomplish specialized tasks, distributed or cross-functional groups often
incur much greater internal communication costs than co-located or homogeneous groups.
Second, I review the organizational literature on task communication and knowledge sharing
within work groups, showing that previous research supports the importance of both internal and
external knowledge sharing for group performance. Finally, I suggest that distributed or cross-

5
functional groups may benefit from knowledge sharing to an even greater extent than co-located
or functionally homogeneous groups because of the access to diverse information and resources
that being in different geographic locations and representing different functional areas provides.
The mixed blessing of diversity in work groups
An increase in the reliance on work groups has been documented repeatedly in the
organizational literature (Cohen & Bailey, 1997; Guzzo & Dickson, 1996; Sundstrom, De
Meuse, & Futrell, 1990). Groups are often used as the foundation of work because organizations
want to take advantage of the diverse perspectives, talents, and ideas members have to offer. A
variety of group effectiveness models emphasize group structures and processes that foster
members working together (Gladstein, 1984; Hackman, 1987; McGrath, 1984). All agree that
effectiveness arises out of a well-specified task, appropriate composition of membership, and a
supportive organizational milieu. However, even a superbly designed work group will not be
successful if members cannot create a common understanding of both the organizational context
and the task itself through communication about their work (cf. process losses, Steiner, 1972).
Popular press and practitioner writings on distributed groups have been optimistic about
the potential for high performance in “virtual teams” (Lipnack & Stamps, 1997; O'Hara-
Devereaux & Johansen, 1994; Townsend, DeMarie, & Hendrickson, 1998). Members of these
groups span physical distances and organizational boundaries, often communicating through
computer technologies to complete their work across multiple locations. However, a number of
past researchers have examined the negative consequences of physical distance for group
processes, such as information exchange, interpersonal friendship, and work satisfaction (Allen,
1977; Conrath, 1973; Monge, Rothman, Eisenberg, Miller, & Kirste, 1985). In a vividly
descriptive account, Cramton (in press) illustrates “the mutual knowledge problem” for

6
distributed work groups, which includes failures to discuss contextual information, uneven
communication among members, and discrepancies in how quickly information is accessed.
Being in different places simply makes communication more difficult for members who are
geographically distributed rather than co-located (Kiesler & Cummings, in press; Van den Bulte
& Moenaert, 1998).
Numerous researchers have also touted the importance of having members in cross-
functional groups, emphasizing their ability to improve coordination and integration, to cut
across organizational boundaries, and to accelerate cycle time for new product development
(Griffin & Hauser, 1992; Denison, Hart, & Kahn, 1996; Eisenhardt & Tabrizi, 1995). Cross-
functional work groups may benefit from creativity through increased task conflict, given that
members have diverse opinions regarding how to proceed with the work (Jehn, Northcraft, &
Neale, 1999; Pelled, Eisenhardt, & Xin, 1999). Unfortunately, the potential for bringing fresh
viewpoints to bear on the task is not always realized (McGrath, Berdahl, & Arrow, 1996;
Williams & O’Reilly, 1998). The communication challenges for cross-functional groups are
often too difficult, especially when members cannot bridge different “thought worlds” to
successfully develop new products or services (Dougherty, 1992).
Another popular form of diversity over the past few decades has been the matrix
organization (Burns, 1989; Davis & Lawrence, 1977; Ford & Randolph, 1992). In matrix
organizations, employees report through two command systems, one normally related to a
corporate function such as engineering or finance, and another often associated with a company
product, like automobiles or televisions. There are several potential benefits to this form of
organization, including increased lateral communication channels, capacity for information
processing, and flexibility of resource use. However, on the negative side, matrix organization

7
can increase role ambiguity, conflict among managers, and insecurity of employees through
reduced autonomy. Researchers have found that it is difficult for organizations to reply
effectively on the matrix structure, and generally recommend for work groups that all members
report to the same manager (Sundstrom and Associates, 1999, p. 8). It is increasingly often the
case, though, that different members of work groups report to different supervisors.
Work groups and knowledge sharing
For over 50 years, organizational scholars have been fascinated by the communication
required for group members to do their work effectively (Katz & Kahn, 1978; March & Simon,
1958; Thompson, 1967). Communication messages have been characterized along a number of
dimensions, such as informality – formality, spontaneous – planned, and socio-emotional – task-
related (Bales, 1950; Guetzkow, 1965). For example, Stohl & Redding (1987) distinguish
interpersonal influence, or gaining compliance or attempting to influence others, from
information exchange, or requesting information and formulating messages that inform others.
Frequent information exchange, or task communication, seems crucial for getting work
accomplished in many groups and helping them perform well (Allen, 1977; Ebadi & Utterback,
1984; Pelz & Andrews, 1966). Task communication is akin to knowledge sharing in this paper.
Polanyi’s (1966) early discussion of the tacit dimension of knowledge and Nelson and
Winter’s (1982) later discussion of knowledge embodied in organizational routines raised
awareness about the importance of the exchange of task-specific knowledge in organizations.
Recent issues of the Strategic Management Journal (Spender & Grant, 1996) and Organizational
Behavior and Human Decision Processes (Argote, Ingram, Levine, & Moreland, 2000) have
featured knowledge sharing as a form of task communication in groups and organizations.
Current theory is that knowledge resides in people as well as in products or procedures of the

8
corporation, and this knowledge can be imitated, copied, or transferred through communication
(Zander & Kogut, 1995). Knowledge sharing is not constrained to exchanges within and across
employees of a company, but can occur between employees and customers, other organizations,
or firms in entirely different industries (von Hippel, 1988).
Knowledge sharing is defined here as the provision or receipt of task information, know-
how, and feedback regarding a product or procedure. Given this definition, sharing is explicitly
conceived of as a communication process involving the task. In the research described below,
knowledge sharing is measured as the frequency that work group members report providing or
receiving general overviews, specific requirements, analytical techniques, progress reports, and
project results to others within or outside of the group. Knowledge sharing is part of task
communication as used in prior research, but is meant to pertain to exchanges of artifacts in
addition to verbal work communication. In the manufacturing operations group described above,
for example, members shared knowledge by exchanging electronic documents regarding the
factory benchmarking, physically observing the training regimens of another work group, and
sending paper copies of the equipment specifications for installing machinery.
Internal and external knowledge sharing
In a review of the literature on geographic distribution in work groups, there appeared to
be no evidence supporting a direct (positive or negative) effect of distance on performance.
Rather, as noted above, geographically distributed members had a more difficult time with
various group processes, such as informal communication with one another (Allen, 1977;
Conrath, 1973; Monge, Rothman, Eisenberg, Miller, & Kirste, 1985). Therefore, a prediction
regarding the direct impact of geographic distribution on performance is not made. However,
knowledge sharing may be affected by geographic distribution, though not as strongly as social

9
or informal communication. Knowledge sharing is typically purposeful through planned events
such as scheduled presentations or phone conferences and can include sharing concrete artifacts
through email attachments or documentary videotapes. Though given the greater challenges that
distributed group members face, one might expect that groups with more geographically
distributed members would share less knowledge internally, compared with members of
geographically co-located groups.
Hypothesis 1: As geographic distribution increases, internal knowledge sharing will
decrease.
Past research on cross-functionality in work groups has yielded mixed findings regarding
a direct effect on performance. On the one hand, Ancona & Caldwell (1992) and Pelled,
Eisenhardt, & Xin (1999) found significant negative correlations between cross-functionality and
performance; while on the other hand, Jehn, Northcraft, & Neale (1999) found a significant
positive correlation between cross-functionality and performance (see also a review by Williams
& O’Reilly, 1998, for an argument in favor of a positive correlation based on the potential
informational advantages of cross-functional groups). Therefore, a prediction regarding the direct
impact of cross-functionality on performance is not made. Compared to the impact on
performance, it appears much clearer that members representing different backgrounds have a
more difficult time discussing their functional areas (Dougherty, 1992; McGrath, Berdahl, &
Arrow, 1996). However, knowledge sharing may not be affected by cross-functionality as
strongly as functional discussion, given that knowledge sharing is specific to the task, which all
members are more familiar with than a particular function. Given the greater obstacles that cross-
functional groups must confront, though, one might expect that groups with cross-functional
members would share knowledge less than members of functionally homogeneous groups.

10
Hypothesis 2: As cross-functionality increases, internal knowledge sharing will decrease.
Though the primary emphasis is on geographic distribution and cross-functionality in
work groups, predictions are made regarding the number of different supervisors that members
report to in their groups. As mentioned before, it is increasingly unlikely that all group members
will report to the same supervisor; rather, different members have different supervisors. For the
reasons described above for geographic distribution and cross-functionality, there is no evidence
to suggest a direct effect of having different supervisors on performance. But, when members do
not have the same supervisor, they run the risk of encountering increased role ambiguity, conflict
among managers, and insecurity through reduced autonomy (Burns, 1989; Davis & Lawrence,
1977; Ford & Randolph, 1992). For example, if a work group has a project milestone to meet,
but the supervisor of one of the members also has a competing deadline on another project that
needs the assistance of the member, then tension is sure to arise. Furthermore, members who
report to different supervisors are also going to have less opportunity to interact, given that their
respective supervisors likely hold different weekly meetings or project reviews. One might
expect, then, that members of groups with different supervisors would share knowledge less than
members of groups with the same supervisors.
Hypothesis 3: As the number of different supervisors increases, internal knowledge
sharing will decrease.
Knowledge sharing among group members is necessary for executing their group task.
Past studies have demonstrated the importance of task communication within work groups
(Allen, 1977; Katz & Tushman, 1979; Tushman, 1978). For example, Katz & Tushman (1979)
found that intra-project administrative and problem-solving communication were positively
associated with performance for research projects. Along with helping to create a common
11
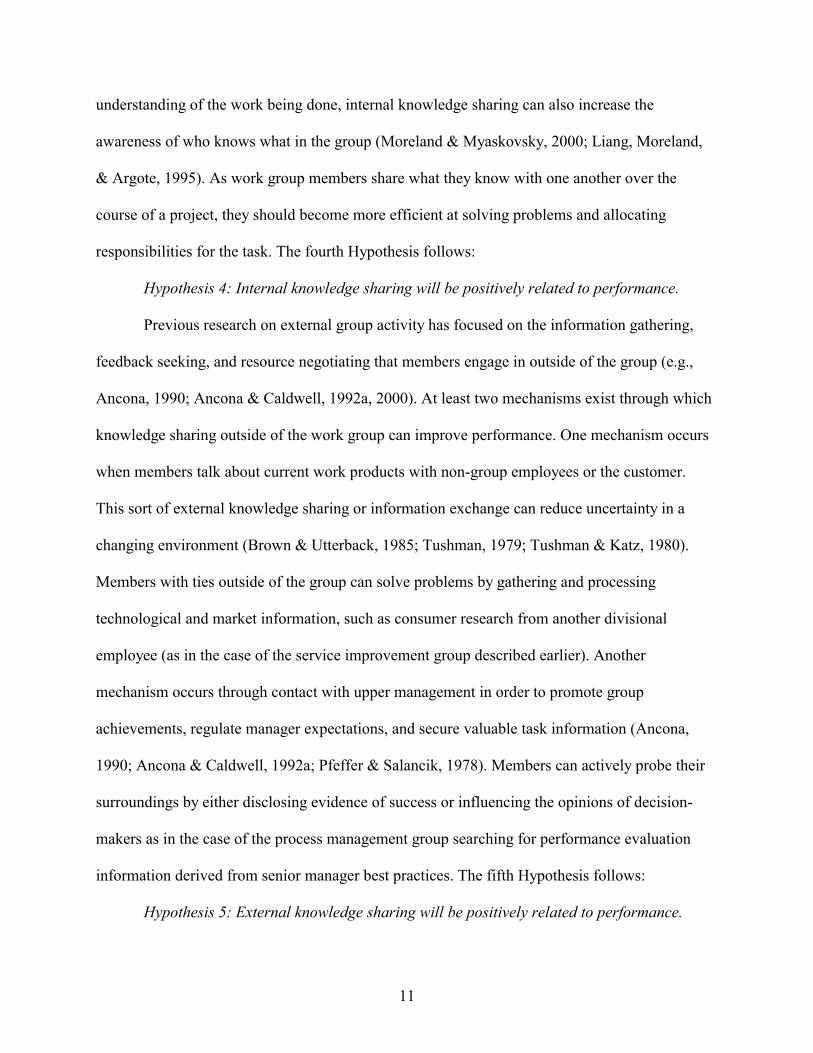
understanding of the work being done, internal knowledge sharing can also increase the
awareness of who knows what in the group (Moreland & Myaskovsky, 2000; Liang, Moreland,
& Argote, 1995). As work group members share what they know with one another over the
course of a project, they should become more efficient at solving problems and allocating
responsibilities for the task. The fourth Hypothesis follows:
Hypothesis 4: Internal knowledge sharing will be positively related to performance.
Previous research on external group activity has focused on the information gathering,
feedback seeking, and resource negotiating that members engage in outside of the group (e.g.,
Ancona, 1990; Ancona & Caldwell, 1992a, 2000). At least two mechanisms exist through which
knowledge sharing outside of the work group can improve performance. One mechanism occurs
when members talk about current work products with non-group employees or the customer.
This sort of external knowledge sharing or information exchange can reduce uncertainty in a
changing environment (Brown & Utterback, 1985; Tushman, 1979; Tushman & Katz, 1980).
Members with ties outside of the group can solve problems by gathering and processing
technological and market information, such as consumer research from another divisional
employee (as in the case of the service improvement group described earlier). Another
mechanism occurs through contact with upper management in order to promote group
achievements, regulate manager expectations, and secure valuable task information (Ancona,
1990; Ancona & Caldwell, 1992a; Pfeffer & Salancik, 1978). Members can actively probe their
surroundings by either disclosing evidence of success or influencing the opinions of decision-
makers as in the case of the process management group searching for performance evaluation
information derived from senior manager best practices. The fifth Hypothesis follows:
Hypothesis 5: External knowledge sharing will be positively related to performance.

12
Knowledge sharing in distributed or cross-functional work groups
Most of the work groups in past studies did not have members who interacted regularly
with each other at far distances or whose members were from numerous disciplines. For
example, the research program of Thomas Allen, Ralph Katz, and Michael Tushman (e.g., Allen,
1977; Katz & Allen, 1982; Katz & Tushman, 1979; Tushman, 1978, 1979; Tushman & Katz,
1980) investigated how factors such as task communication predicted project success in an R&D
laboratory. They gathered strong evidence in support of the critical role of internal and external
communication for work group effectiveness. However, their work was limited to groups with
members who were in the same location and who represent similar functions. No research has
yet examined whether diversity from geographic distribution and cross-functionality interacts
with knowledge sharing to improve performance. I argue that external knowledge sharing with
people at different locations and in different functions should improve group performance.
Distributed or cross-functional work groups, which are inherently diverse, should benefit most
from external knowledge sharing because of their access to different sources of knowledge.
Past studies on social network structure illustrate how diverse work groups can benefit
from external knowledge sharing (e.g., Burt, 1992; Granovetter, 1973, Krackhardt, 1992).1 Social
network theories predict that by maximizing differences in their external networks, group
members can enhance the performance of their group. One reason is that group members often
need to discuss the latest work procedures with a variety of former colleagues or potential
clients. The non-redundancy or uniqueness of these ties, in turn, can provide non-redundant or
unique resources and information that work group members could leverage for competitive
1 Though the social network literature distinguishes between at least three types of network benefits from weak (Granovetter, 1973) or non-redundant ties (Burt, 1992), for purposes of this thesis I combine them to focus only on the uniqueness of information. For example, while Friedkin (1982) focuses on the amount of potential help from

13
advantage (Burt, 1992; Friedkin, 1982; Granovetter, 1973; Lin, Ensel, & Vaughn, 1981). For
instance, group members can bridge areas of knowledge by visiting members from other groups
to observe and to compare operations with their own (as in the case of the manufacturing
operations groups described earlier). Another reason to expect enhanced performance is that by
tapping non-overlapping areas of expertise, group members elicit diverse ideas and insights from
others regarding the task (Ancona & Caldwell, 1992b; Cohen & Levinthal, 1990; Hansen, 1999).
For example, applications software and electrical engineering members in a product development
group can increase their likelihood of creativity or innovativeness by capitalizing on novel task
information acquired through their separate external networks.
For geographically distributed groups, the “eyes and ears” of members are in different
environments, which increases member exposure to potentially relevant task information. As the
distance between members increases, the novelty of the members’ settings also increases. This
expanse may introduce new opportunities for knowledge acquisition and use by the members.
Distributed work group members are also more likely to have different social networks outside
of the group because members run into different people in the hallways, see different people at
meetings, and communicate with different people socially. For members who utilize these
diverse external social networks, the prospects of accessing unique knowledge are strengthened
for them. However, member access to external sources of knowledge alone is not enough to
guarantee positive results for distributed work groups. Group members need to communicate
with those in their external networks about the task because other group members are often not in
the immediate vicinity. It may sometimes be necessary for distributed members to communicate
having weak ties; Granovetter (1973) and Burt (1992) focus on the advantages of having diversity in ties; and Lin, Ensel, & Vaughn (1981) focus on the benefits of having weak ties with greater resources.
14
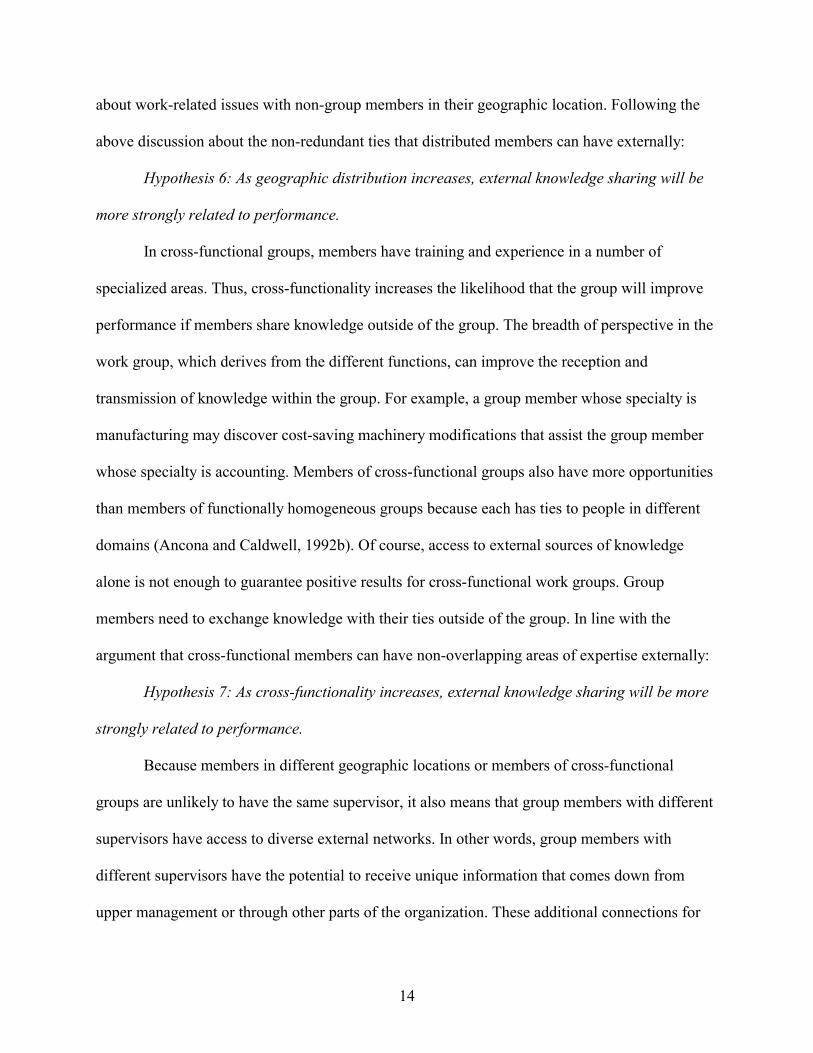
about work-related issues with non-group members in their geographic location. Following the
above discussion about the non-redundant ties that distributed members can have externally:
Hypothesis 6: As geographic distribution increases, external knowledge sharing will be
more strongly related to performance.
In cross-functional groups, members have training and experience in a number of
specialized areas. Thus, cross-functionality increases the likelihood that the group will improve
performance if members share knowledge outside of the group. The breadth of perspective in the
work group, which derives from the different functions, can improve the reception and
transmission of knowledge within the group. For example, a group member whose specialty is
manufacturing may discover cost-saving machinery modifications that assist the group member
whose specialty is accounting. Members of cross-functional groups also have more opportunities
than members of functionally homogeneous groups because each has ties to people in different
domains (Ancona and Caldwell, 1992b). Of course, access to external sources of knowledge
alone is not enough to guarantee positive results for cross-functional work groups. Group
members need to exchange knowledge with their ties outside of the group. In line with the
argument that cross-functional members can have non-overlapping areas of expertise externally:
Hypothesis 7: As cross-functionality increases, external knowledge sharing will be more
strongly related to performance.
Because members in different geographic locations or members of cross-functional
groups are unlikely to have the same supervisor, it also means that group members with different
supervisors have access to diverse external networks. In other words, group members with
different supervisors have the potential to receive unique information that comes down from
upper management or through other parts of the organization. These additional connections for

15
members hold the possibility of easing knowledge acquisition and transfer from outside the
group, since their reach in the organization is greater.
Hypothesis 8: As the number of different supervisors increases, external knowledge
sharing will be more strongly related to performance.
In this paper, I propose a model for how knowledge sharing within and outside of work
groups affects performance when members are geographically distributed or represent different
functions (see Figure 1). The field study of work groups and knowledge sharing reported here
finds that work group effectiveness is positively related to knowledge sharing both inside and
outside of the group. Second, it finds that work group effectiveness is more strongly related to
external knowledge sharing when group members differ by geographic locations and functional
areas. Data used to test hypotheses come from a sample of 182 work groups and include (a) 20
group interviews, (b) 182 surveys of group leaders, (c) 957 surveys of group members, and (d)
senior manager’s ratings of group performance. Through extending ideas about social network
structure to distributed or cross-functional groups, this investigation contributes to research on
the importance of group context for effectiveness (Alderfer & Smith, 1982; Ancona & Caldwell,
1992a; Hackman, 1987).
Methodology
The field study was part of a corporate-wide knowledge management initiative in a
Fortune 500 telecommunications firm. The goal of the initiative was to improve knowledge
sharing in a company that produces, among other things, communication technologies such as
cellular phones, digital pagers, and two-way radios. At the time of the research, the global
organization employed over 100,000 individuals, 40% of whom were engineers. Five divisions
were organized by product-market segments, operated fairly autonomously, and were responsible

16
for development, manufacturing, and sales. Each division was also spread over different regions
worldwide; members in the sample were from recently completed projects across United
States/Canada (63%), Latin/South America (3%), Europe (15%), Middle East/Africa (5%),
India/China (5%), and Japan/Korean/Malaysia (9%).
I studied work groups that carried out projects throughout the company. Two corporate
senior managers sponsored the research and division managers provided critical background
information on the nature of the work groups I examined. For example, a majority of the projects
in the organization are divided into groups, including product development and manufacturing
operations. Though most employees only work on one group at a time, there are a number of
employees who are on two, even three projects at a time. In addition, projects tend to last one to
two years, but not more than three, depending on market conditions and customer demand. After
I agreed not to disclose the corporation identity, they gave me permission to contact the work
groups used in this study.
Sample
Work groups in the sample were part of a corporate-wide reward and recognition
program. The goal of the program was to publicly acknowledge the best-performing work groups
in the company. General managers nominated work groups from regional sites around the world
to participate in a corporate-wide competition. Each group was asked to make a 20-30 minute
presentation to a panel of judges (ranging from 5 to 12 senior managers) who were given specific
instructions and training regarding the judging process. In most cases, judges were unfamiliar
with the projects before they made their ratings, given the large size of the corporation.
Managers first rated 280 groups at over 20 regional events worldwide. The 122 groups at
each of the events who were judged the highest advanced to five division-level events, where a

17
different panel of judges again rated the groups. The 21 division-level groups that were judged
the highest moved on to a final corporate-level event, where they made presentations to the
company CEO and senior vice-presidents. Background information could not be found for 98 of
the 280 work groups, so this sample includes 84/137 (61%) of groups participating in the
regional events, 77/122 (63%) of groups participating in the division-level events, and 21/21
(100%) of groups participating in the corporate-level event.
There are clear disadvantages and advantages to using a convenience sample of work
groups. The sample represents better performing groups, on average, than would a random
sample of work groups in the company. Furthermore, the convenience sample does not permit
generalizing to all work groups in the organization. On the other hand, the sponsors of the
research provided extensive access to members of these groups as well as performance ratings
made by senior managers.
The 182 groups in the sample met the following criteria of work groups in the literature:
they had intact social systems with boundaries and differentiated roles, performed at least one
task with measurable output, and operated within an organizational context (Hackman, 1987).
Accordingly, each work group had a “group name,” 4 to 12 members (average was 8), and a
specific project assigned to the group. The groups had a designated group leader, a general
manager responsible for providing resources, and an identifiable customer (64% of whom were
internal to the corporation). Members of work groups generally came from within the same
division (5% of groups reported having a member from another division); almost all were
company employees (8% of groups reported having one customer participate, including those
with internal customers).

18
The groups worked on projects ranging from product development (e.g., design handheld
scanning device for shipping company) to service improvement (e.g., convert client platform for
car phones from analog to digital) to process management (e.g., execute separation and sale of
business unit to another stakeholder) to manufacturing operations (e.g., modify existing factory
to support new production of pagers). The type of project most often determined the composition
of the work groups, and it was usually either the general manager or a group leader who decided
which employees should be on which groups. In this sample, ninety-four percent of the projects
started and ended between January 1998 and January 2000 (average project length was 15
months). For illustration, Table 1 provides project descriptions from six work groups, including
(fictitious) group names and other project characteristics.
Qualitative and quantitative evidence. Division managers provided archival data on the
groups, including project documentation, presentation slides, and other available written
materials. Exploratory interviews were conducted with all members of 20 work groups from one
division to learn about the nature of the projects and to develop surveys used later. I then
contacted group leaders to verify project descriptions as well as member names, geographic
locations, functional areas, and contact information. After gathering background information on
the 182 work groups in the sample, I created a survey with four main parts: Overall
communication with each member of the group, functional discussion about each function
represented in the group, knowledge sharing about five activities, and member-rated
performance. I pre-tested the survey on employees in the corporate office before sending it out in
June 2000 as an email attachment to each group member who had a valid email address
(1315/1474 or 89%). It took approximately 20-30 minutes to complete, and included a cover
letter describing the purpose of the study and ensuring confidentiality. The response rate for

19
those who were sent an email survey, including two follow-up reminders, was 73% (957/1315).2
At least one person responded from each group; 86 groups had greater than a 75% response rate;
63 groups had between a 50% and 75% response rate; 28 groups had between a 25% and 50%
response rate; and 5 groups had less than a 25% response rate. The survey was sent an average of
six months after groups had completed their projects. Finally, participants viewed a preliminary
analysis of the survey data, and commented on the findings.
Measures
Measures used in the analyses below are written in CAPITAL letters and higher values
correspond with the variable names (e.g., name represents 1 in dichotomous (0,1) measures).
Geographic Distribution. All participants were asked to indicate in the survey whether
each group member: (1) “worked immediately next to you,” (2) “worked on the same floor and
on the same hallway as you,” (3) “worked on the same floor, but on a different hallway than
you,” (4) “worked on a different floor than you,” (5) “worked in a different building than you in
the same city,” (6) “worked in a different building than you in a different city,” or (7) “worked in
a different building than you in a different state or country.” A geographic distribution index was
created by averaging the non-linear distances between members within each group (Allen, 1977).
For example, Table 1 shows that Group 1, Error Detection, has four group members located in
one building in Israel, whose group distribution index is 2.67. For the sample of work groups in
this paper, the index ranged from 1.00 to 6.47 (GEOGDIST: Mean = 3.42; SD = 1.13).
Cross-Functionality. The functional areas, as defined by company database codes,
2 Two selection bias analyses were conducted at the group level of analysis (N = 182). Correlations were computed between group size, project length, available resources, environmental uncertainty, geographic distribution, cross-functionality, performance and (1) the percentage of members with a valid email address and (2) the percentage of members who responded to the survey. Neither analysis revealed significant associations with group size, available resources, environmental uncertainty, and geographic distribution. However, greater cross-functionality (r = .18, p < .05) was associated with more valid email addresses and project length (r = .21, p < .01), cross-functionality (r = .17, p < .05), and performance (r = .24, p < .01) were associated with a higher percentage of survey responses.

20
included Engineering (29%), Manufacturing (20%), Technical Operations (14%), Quality (7%),
Marketing/Strategy (5%), Customer Service (4%), Project Management (4%), Information
Technology (4%), Administrative Support (3%), Sales (3%), Human Resources (2%), Finance
(2%), Business Administration (2%), and Purchasing (1%). The number of different functional
areas that all group members represented was used to compute an entropy-based index
(Teachman, 1980).
According to Ancona & Caldwell (1992b), “if there are N possible states {s} in which the system
can be, {and} P i is the probability that the system will be found in state i, then the formula can
be used to index the heterogeneity {H} in the system…the only exception occurs when a {state}
is not represented. In this case, the value assigned that state is zero” (p.328). The greater the
distribution of group members across functional areas, the higher the score on the index (the
theoretical maximum is dependent on the number of states). Table 1 shows that for Group 5,
Business Separation, there are eight group members, one who is in technical operations, six who
are in information technology, and one who is in human resources, yielding a score of .74. In the
sample of groups, the index ranged from 0 to 1.89 (CROSFUNC: Mean = 0.90; SD = 0.47).
Different Supervisors. The number of different supervisors that group members reported
to in each group, as defined by company database codes, was used to compute an entropy-based
index (Teachman, 1980). The greater the distribution of group members across supervisors, the
higher the score on the index. Table 1 shows that for Group 3, Platform Conversion, there are 9
group members who report to 8 different supervisors, yielding a score of 2.04. In the sample of
groups, the index ranged from 0.38 to 2.48 (DIFSUPER: Mean = 1.74; SD = 0.41).
ä−
−=s
iii PPH
1)(ln

21
Knowledge Sharing. Three steps went into developing the measures of knowledge
sharing reported here. First, 20 face-to-face interviews were conducted with group members to
assess the different kinds of knowledge that they shared during their projects. Though the
original goal was to measure dimensions of knowledge sharing such as tacit/explicit or
simple/complex (e.g., Winter, 1987), many of the group members were unsure how to rate these
dimensions, even with extensive definition and explanation. However, they had an easy time
identifying how often they shared certain kinds of knowledge, such as project overviews or
progress reports.
In the second step, I reviewed previous research and analyzed the group member
interviews. Together, they suggested five activities that characterize knowledge sharing in work
groups. All activities were measured on a 5-point scale (1:never, 2:rarely, 3:sometimes,
4:regularly, 5:a lot), and participants were asked “On average, how often did you share each kind
of knowledge during the project…”: (a) with group members (internal), (b) with non-group
employees inside your division (external), (c) with non-group employees outside your division
(external), and (d) with the customer (external). These five measures make up the internal and
external knowledge sharing scales used in the analyses below.3 Table 2 provides additional
examples of internal and external knowledge sharing for each of the activities.
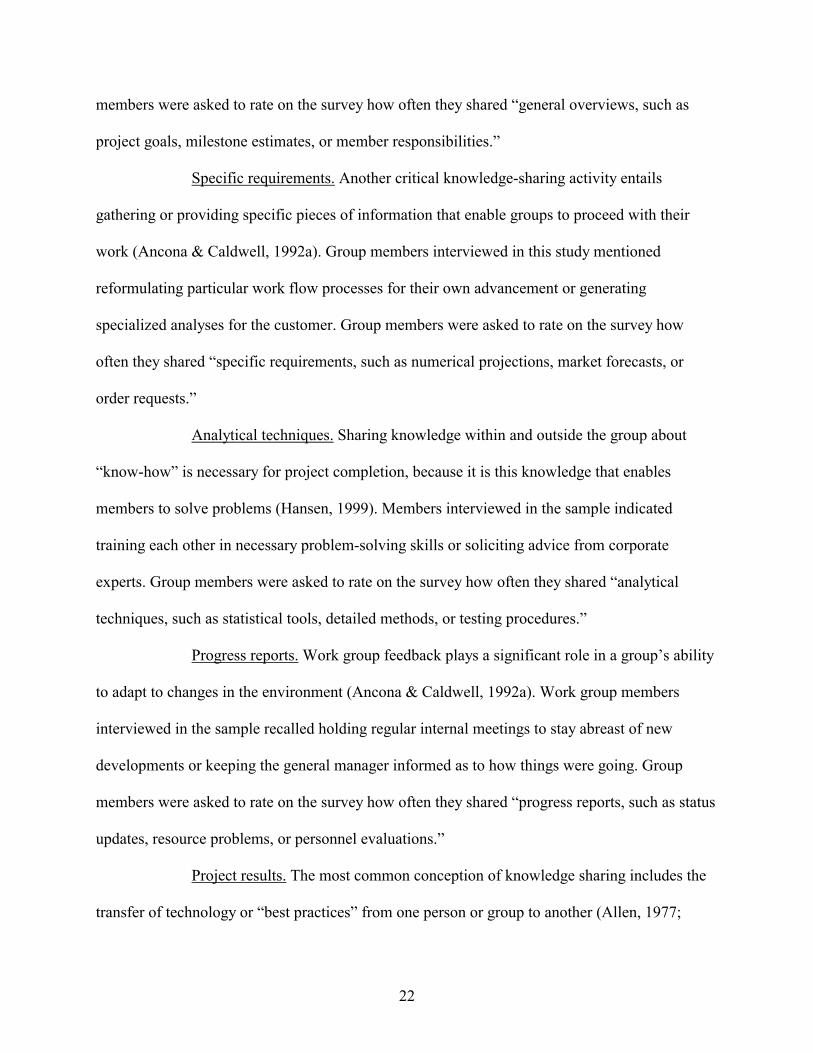
General overviews. A useful knowledge-sharing activity for work groups is being
able to articulate what they are doing and to benefit from what others are doing (Tushman &
Katz, 1980). Members interviewed in the sample reported having budget guidelines that allowed
them to track their own expenses or a business plan that they could discuss with others. Group
3 For purposes of reliability, members were asked questions about knowledge sharing during the planning phase and the completion phase of their projects (Eisenhardt & Tabrizi, 1995). Preliminary analyses did not reveal any knowledge sharing by phase interactions, so responses for the planning phase and completion phase were averaged to assess overall knowledge sharing (average correlation for knowledge sharing between phases was r = .83).
22
members were asked to rate on the survey how often they shared “general overviews, such as
project goals, milestone estimates, or member responsibilities.”
Specific requirements. Another critical knowledge-sharing activity entails
gathering or providing specific pieces of information that enable groups to proceed with their
work (Ancona & Caldwell, 1992a). Group members interviewed in this study mentioned
reformulating particular work flow processes for their own advancement or generating
specialized analyses for the customer. Group members were asked to rate on the survey how
often they shared “specific requirements, such as numerical projections, market forecasts, or
order requests.”
Analytical techniques. Sharing knowledge within and outside the group about
“know-how” is necessary for project completion, because it is this knowledge that enables
members to solve problems (Hansen, 1999). Members interviewed in the sample indicated
training each other in necessary problem-solving skills or soliciting advice from corporate
experts. Group members were asked to rate on the survey how often they shared “analytical
techniques, such as statistical tools, detailed methods, or testing procedures.”
Progress reports. Work group feedback plays a significant role in a group’s ability
to adapt to changes in the environment (Ancona & Caldwell, 1992a). Work group members
interviewed in the sample recalled holding regular internal meetings to stay abreast of new
developments or keeping the general manager informed as to how things were going. Group
members were asked to rate on the survey how often they shared “progress reports, such as status
updates, resource problems, or personnel evaluations.”
Project results. The most common conception of knowledge sharing includes the
transfer of technology or “best practices” from one person or group to another (Allen, 1977;

23
Szulanski, 1996; Teece, 1977). Work group members interviewed in the sample reported here
described holding end-of-project summits to reflect on key learnings or exchanging task
resolutions at intra-company conferences. Group members were asked to rate on the survey how
often they shared “results, such as preliminary findings, unexpected outcomes, or clear
recommendations.”
The third step I took to calculate the knowledge-sharing measures was to average across
the five activities to form internal and external knowledge-sharing scales. A factor analysis
(using varimax rotation) indicated that all activities loaded onto one factor with acceptable
reliability for internal knowledge sharing (α = .84; INT KS: Mean = 3.90; SD = 0.39) and for
external knowledge sharing (α = .97; EXT KS: Mean = 2.38; SD = 0.58). The reliability for
external knowledge sharing is very high because many employees reported sharing little external
knowledge. In fact, 39% (371/957) of group members reported sharing knowledge outside of the
group “rarely” (rating of 2/5) or less during their projects. The external networks (non-group
employees inside the division, non-group employees outside the division, and the customer) also
loaded reliably onto one factor (α =.78). See Table 3 for the means and standard deviations of
knowledge-sharing content by network, which shows that significantly more knowledge sharing
took place within, relative to outside of the group (t (181)= 37.54, p < .001).
Other measures of communication. In order to compare knowledge sharing with
two forms of communication studied in the past, additional measures were taken of overall
communication (e.g., Tushman & Katz, 1980) and functional discussion (e.g., Ancona &
Caldwell, 1992). For the measure of internal overall communication, each group member was
asked to indicate “How frequently did you communicate with X during the project?” on a 5-point
scale (1:never, 2:monthly, 3:weekly, 4:daily, 5:hourly) where X represented the name of every

24
other member (α = .77; INT OC: Mean = 3.01; SD = 0.42). For the measure of internal
functional discussion, each group member was asked to indicate “How much did you discuss Y
during the project?” on a 5-point scale (1:never, 2:rarely, 3:sometimes, 4:regularly, 5:a lot)
where Y represented the name of every function represented in the group (α = .65; INT FD:
Mean = 3.84; SD = 0.44). For the measures of external overall communication (α = .67; EXT
OC: Mean = 2.01; SD = 0.46) and external functional discussion (α = .69; EXT FD: Mean =
2.52; SD = 0.66), the same question was asked, except the targets were (a) division employees,
(b) non-division employees, and (c) the customer (α = .73 external overall communication; α =
.76 external functional discussion).
Work Group Performance. Work groups in the company-wide reward and recognition
program were rated by senior managers on seven dimensions: (1) teamwork, (2) clearly defined
problem selection, (3) appropriateness of method used to solve problem, (4) innovativeness of
remedies used to solve problem, (5) quality of impact from results, (6) institutionalization of
solution, and (7) clarity of presentation. A sample analysis of an event (N=12 judges and N=33
groups) revealed that judges were able to reliably rate overall performance (α = .88 across
judges), and provided evidence of a halo effect, whereby all seven dimensions loaded onto one
factor (α = .80 across dimensions). Ratings of work group performance varied across regions and
divisions, and manager ratings for 228/280 (81%) of the work groups were destroyed
immediately following the events in order to avoid the possible legal ramifications of identifying
managers who rated groups poorly. Therefore, the 182 groups were given a ranking of 1
(regional level, N = 84), 2 (division level, N = 77), or 3 (corporate level, N = 21) (PERFORM:
Mean = 1.65; SD = 0.68), which is used as the dependent variable below.4
4 To evaluate the broader significance of the performance measure, additional data were collected on the retention of

25
Control Variables. Previous research on work groups suggests that task type, group size,
project length, availability of project resources, and environmental uncertainty may influence
group performance. In addition, psychological closeness and knowledge-sharing difficulty may
influence knowledge sharing. These factors were measured as control variables.
Task type. Consistent with labels used in the corporation, tasks were categorized
as: (1) Product Development (25%) (PRODUCT: Mean = .25; SD = .43): in the projects, groups
developed new hardware or software products such as alphanumeric pagers, device drivers,
digital phones, and high frequency radios; (2) Service Improvement (25%) (SERVICE: Mean =
.25; SD = .43): in the projects, groups improved company services such as billing automation,
inventory tracking, product upgrades, and repair service; (3) Process Management (25%)
(PROCESS: Mean = .25; SD = .43): in the projects, groups changed work practices or other
management processes such as business forecasting, human resource programs, media relations,
and work flow integration; and (4) Manufacturing Operations (26%) (OPERATIONS: Mean =
.26; SD = .44): in the projects, groups modified operations for manufacturing products such as
capacity expansion, equipment implementation, preventive maintenance, and scrap recycling.
Because the four task types account for all 182 groups in the sample, only PRODUCT,
SERVICE, and OPERATIONS are used in the analyses below. However, PROCESS is included
in the correlation matrix, and does not change results when entered in the analyses.
Group size. Group leaders indicated the number of members in the group (Ancona
& Caldwell, 1992b; Hansen, 1999) (SIZE: Mean = 8.10; SD = 1.94).
employees nine months after senior managers assessed group performance. Participants who made it to the corporate-level event (99.5%) were more likely to stay with the company than division-level event participants (97.5%), who were more likely to stay with the company than regional-level event participants (90.0%) (F linear contrast (1, 1473) = 25.32, p < .001). While intriguing, it is unclear from this data, for example, whether high performance was related to increased commitment, or whether low performance was related to increased dissatisfaction.
26
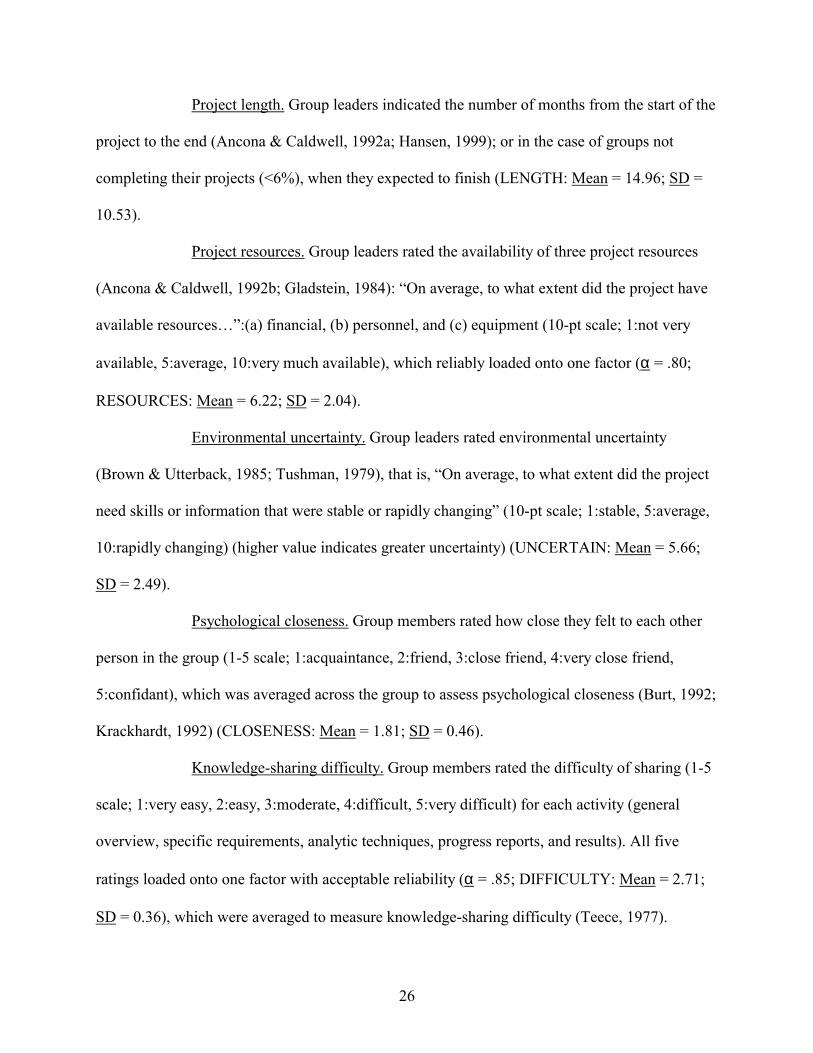
Project length. Group leaders indicated the number of months from the start of the
project to the end (Ancona & Caldwell, 1992a; Hansen, 1999); or in the case of groups not
completing their projects (<6%), when they expected to finish (LENGTH: Mean = 14.96; SD =
10.53).
Project resources. Group leaders rated the availability of three project resources
(Ancona & Caldwell, 1992b; Gladstein, 1984): “On average, to what extent did the project have
available resources…”:(a) financial, (b) personnel, and (c) equipment (10-pt scale; 1:not very
available, 5:average, 10:very much available), which reliably loaded onto one factor (α = .80;
RESOURCES: Mean = 6.22; SD = 2.04).
Environmental uncertainty. Group leaders rated environmental uncertainty
(Brown & Utterback, 1985; Tushman, 1979), that is, “On average, to what extent did the project
need skills or information that were stable or rapidly changing” (10-pt scale; 1:stable, 5:average,
10:rapidly changing) (higher value indicates greater uncertainty) (UNCERTAIN: Mean = 5.66;
SD = 2.49).
Psychological closeness. Group members rated how close they felt to each other
person in the group (1-5 scale; 1:acquaintance, 2:friend, 3:close friend, 4:very close friend,
5:confidant), which was averaged across the group to assess psychological closeness (Burt, 1992;
Krackhardt, 1992) (CLOSENESS: Mean = 1.81; SD = 0.46).
Knowledge-sharing difficulty. Group members rated the difficulty of sharing (1-5
scale; 1:very easy, 2:easy, 3:moderate, 4:difficult, 5:very difficult) for each activity (general
overview, specific requirements, analytic techniques, progress reports, and results). All five
ratings loaded onto one factor with acceptable reliability (α = .85; DIFFICULTY: Mean = 2.71;
SD = 0.36), which were averaged to measure knowledge-sharing difficulty (Teece, 1977).

27
Results
Preliminary Analyses
Before using regression analyses to test the eight hypotheses proposed above, preliminary
analyses were conducted on the data. First, descriptive statistics revealed that all variables were
normally distributed except for project length (which was skewed toward longer projects), thus
the natural log of project length is used in the analyses. Second, average intra-class correlations
computed for the group-level measures of internal and external knowledge sharing were .84 (p <
.01) and .95 (p < .01), respectively. This suggests that it is reasonable to aggregate individual
level measures. Third, correlations were calculated for the main variables in the study (see Table
4). One observation is that geographic distribution and cross-functionality were modestly related
(r = .20, p < .05), while both were significantly related to having different supervisors
(geographic distribution, r = .34, p < .01; cross-functionality, r = .35, p < .01). Another is that
having more geographic locations (r = .02, p > .10), functional areas (r = .07, p > .10), or
different supervisors (r = .05, p > .10) were unrelated to external knowledge sharing.
Finally, to address concerns regarding the uncertain effects on performance of group
design decisions made by managers before groups were invited to participate in the study,
geographic distribution (Model 1), cross-functionality (Model 2), and different supervisors
(Model 3) were regressed on the control variables (see Table 5). This analysis indicates whether
known factors predict the extent of diversity in the work groups. Furthermore, in the section
below, internal knowledge sharing (Model 1), and external knowledge sharing (Model 2) were
regressed on the control variables as well as geographic distribution, cross-functionality, and
different supervisors (see Table 6). This analysis indicates whether known factors predict the
extent of knowledge sharing within and outside of work groups. Though the focus of this paper

28
is primarily on the relationship between knowledge sharing and work group performance, these
analyses may yield some of the antecedents of diversity and knowledge sharing.
The first ordinary least squares model (see Table 5) with geographic distribution as the
dependent variable revealed that manufacturing operations groups, which were often situated in a
single facility, were more likely to be co-located (b = -.51, p < .05). The second regression model
with cross-functionality as the dependent variable indicated that service improvement groups,
which often included engineers as well as quality assurance and customer support employees,
were more likely to be cross-functional (b = .24, p < .05). The third regression model with
different supervisors as the dependent variable indicated that service improvement groups were
more likely to report to the same supervisor (b = -.12, p < .10). Also, there was a significant
association between group size and having different supervisors (b = .09, p < .01).
Hypothesis Testing
The first three hypotheses, that geographic distribution, cross-functionality, or having
different supervisors would be negative related to internal knowledge sharing, were not
supported. Geographic distribution (r = -.08, p > .10), cross-functionality (r = -.11, p > .10), or
having different supervisors (r = -.10, p > .10) did not have a significant negative association
with internal knowledge sharing, although the relationships were in the expected direction.
However, consistent with previous research, geographic distribution (r = -.41, p < .01) and
having different supervisors (r = -.31, p < .01) were significantly negative correlated with overall
communication, and cross-functionality was significantly negatively correlated with functional
discussion (r = -.37, p < .01).
Two ordinary least squares regression analyses were also conducted with internal and
external knowledge sharing as the dependent variables (see Table 6). The first model with
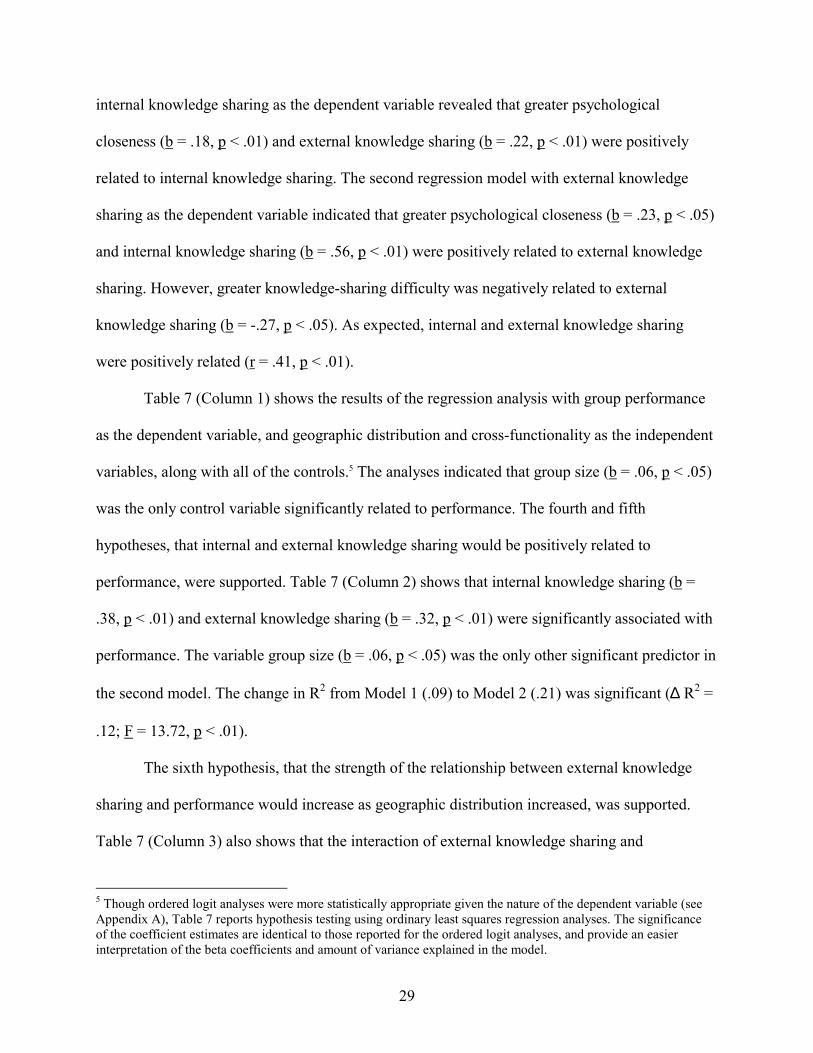
29
internal knowledge sharing as the dependent variable revealed that greater psychological
closeness (b = .18, p < .01) and external knowledge sharing (b = .22, p < .01) were positively
related to internal knowledge sharing. The second regression model with external knowledge
sharing as the dependent variable indicated that greater psychological closeness (b = .23, p < .05)
and internal knowledge sharing (b = .56, p < .01) were positively related to external knowledge
sharing. However, greater knowledge-sharing difficulty was negatively related to external
knowledge sharing (b = -.27, p < .05). As expected, internal and external knowledge sharing
were positively related (r = .41, p < .01).
Table 7 (Column 1) shows the results of the regression analysis with group performance
as the dependent variable, and geographic distribution and cross-functionality as the independent
variables, along with all of the controls.5 The analyses indicated that group size (b = .06, p < .05)
was the only control variable significantly related to performance. The fourth and fifth
hypotheses, that internal and external knowledge sharing would be positively related to
performance, were supported. Table 7 (Column 2) shows that internal knowledge sharing (b =
.38, p < .01) and external knowledge sharing (b = .32, p < .01) were significantly associated with
performance. The variable group size (b = .06, p < .05) was the only other significant predictor in
the second model. The change in R2 from Model 1 (.09) to Model 2 (.21) was significant (∆ R2 =
.12; F = 13.72, p < .01).
The sixth hypothesis, that the strength of the relationship between external knowledge
sharing and performance would increase as geographic distribution increased, was supported.
Table 7 (Column 3) also shows that the interaction of external knowledge sharing and
5 Though ordered logit analyses were more statistically appropriate given the nature of the dependent variable (see Appendix A), Table 7 reports hypothesis testing using ordinary least squares regression analyses. The significance of the coefficient estimates are identical to those reported for the ordered logit analyses, and provide an easier interpretation of the beta coefficients and amount of variance explained in the model.
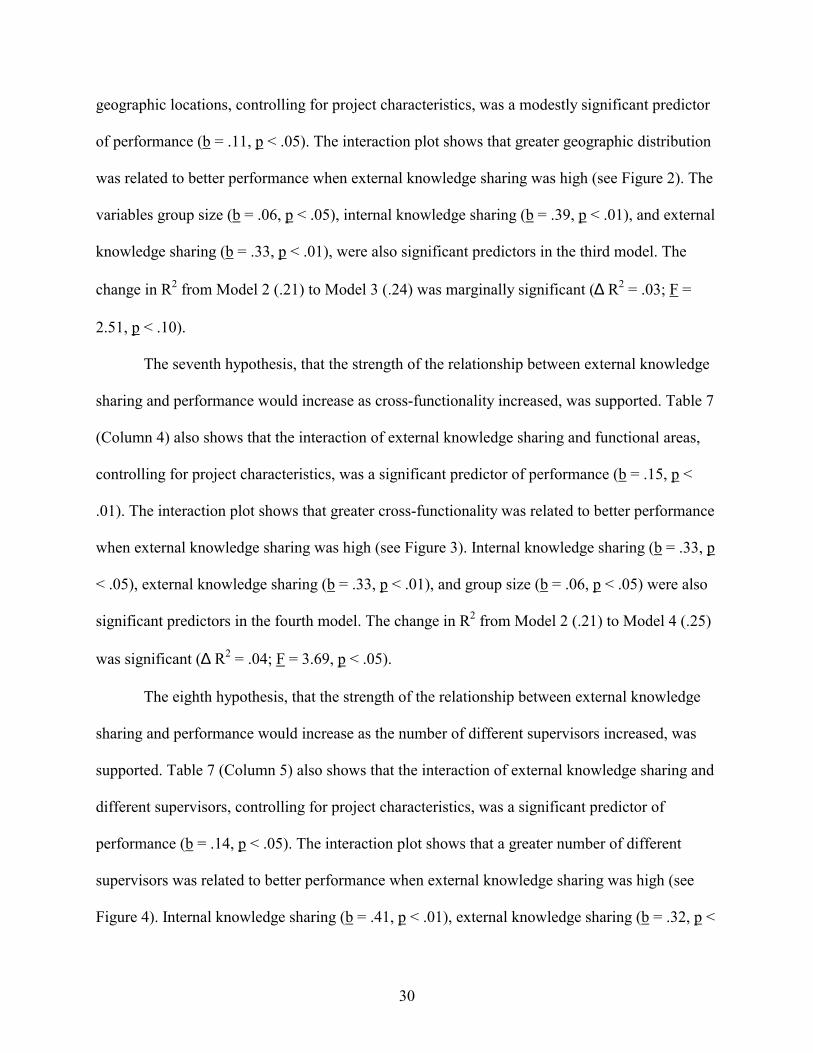
30
geographic locations, controlling for project characteristics, was a modestly significant predictor
of performance (b = .11, p < .05). The interaction plot shows that greater geographic distribution
was related to better performance when external knowledge sharing was high (see Figure 2). The
variables group size (b = .06, p < .05), internal knowledge sharing (b = .39, p < .01), and external
knowledge sharing (b = .33, p < .01), were also significant predictors in the third model. The
change in R2 from Model 2 (.21) to Model 3 (.24) was marginally significant (∆ R2 = .03; F =
2.51, p < .10).
The seventh hypothesis, that the strength of the relationship between external knowledge
sharing and performance would increase as cross-functionality increased, was supported. Table 7
(Column 4) also shows that the interaction of external knowledge sharing and functional areas,
controlling for project characteristics, was a significant predictor of performance (b = .15, p <
.01). The interaction plot shows that greater cross-functionality was related to better performance
when external knowledge sharing was high (see Figure 3). Internal knowledge sharing (b = .33, p
< .05), external knowledge sharing (b = .33, p < .01), and group size (b = .06, p < .05) were also
significant predictors in the fourth model. The change in R2 from Model 2 (.21) to Model 4 (.25)
was significant (∆ R2 = .04; F = 3.69, p < .05).
The eighth hypothesis, that the strength of the relationship between external knowledge
sharing and performance would increase as the number of different supervisors increased, was
supported. Table 7 (Column 5) also shows that the interaction of external knowledge sharing and
different supervisors, controlling for project characteristics, was a significant predictor of
performance (b = .14, p < .05). The interaction plot shows that a greater number of different
supervisors was related to better performance when external knowledge sharing was high (see
Figure 4). Internal knowledge sharing (b = .41, p < .01), external knowledge sharing (b = .32, p <

31
.01), and group size (b = .06, p < .05) were also significant predictors in the fourth model. The
change in R2 from Model 2 (.21) to Model 5 (.25) was significant (∆ R2 = .04; F = 4.41, p < .05).
When all main effects and interactions are entered into the model, none of the
interactions are significant. Similarly, the three-way interaction of external knowledge sharing X
geographic distribution X cross-functionality was also not significant.
Comparison with communication measures
To test the discriminate validity of knowledge sharing, internal knowledge sharing was
significantly correlated with internal overall communication r = .48 (p < .01) and with internal
functional discussion r = .44 (p < .01) (overall communication and functional discussion were
significantly correlated r = .31, p < .01). This suggests that even though the variables are related,
knowledge sharing within the group captures something different than overall communication or
functional discussion. For example, overall communication includes social communication and
functional discussion includes specific personal expertise not necessarily related to the task.
However, a different pattern arises for external knowledge sharing. External knowledge sharing
was significantly correlated with external overall communication r = .77 (p < .01) and with
external functional discussion r = .67 (p < .01) (overall communication and functional discussion
were significantly correlated r = .66, p < .01). This indicates that when group members share
knowledge, communicate, or have discussions outside of the group, it is likely to be task-related.
Two supplementary analyses were conducted in which overall communication and
functional discussion were substituted for knowledge sharing. First, when comparing knowledge
sharing with overall communication, in terms of the relationship with performance, we see a
slightly different pattern of results (see Table 8). The main effects of internal and external overall
communication on performance are significant, though the magnitude of strength is larger for

32
internal compared with external. Moreover, the interactions of external overall communication
with diversity are much weaker. Second, when comparing knowledge sharing with functional
discussion, in terms of its relationship with performance, we again see a different pattern of
results (see Table 9). The main effect of external (though not internal) functional discussion on
performance was significant, and the interactions of external functional discussion with diversity
are somewhat weaker (with the exception of cross-functionality).
Discussion
This paper began with examples of distributed or cross-functional groups that shared
different kinds of knowledge through different relations. Based on the results of this study, I
argue that groups perform effectively if they share critical knowledge about the task with the
customer and other non-group employees in the company. Members in different locations who
represent different functions can capitalize on diverse external networks, thus accessing diverse
sources of task information, know-how, and feedback. While research has focused on the internal
challenges that distributed or cross-functional work groups face, there appear to be great external
opportunities for improving performance.
There are three themes that characterize the findings of this dissertation. First, knowledge
sharing is similar to, yet different than overall communication and functional discussion.
Contrary to the first three hypotheses, geographic distribution, cross-functionality, and having
different supervisors did not significantly negatively influence knowledge sharing to the extent
that they influenced overall communication and functional discussion. Second, in support of the
fourth and fifth hypotheses, both internal and external knowledge sharing are important for
performance in work groups. Third, in support of the sixth, seventh, and eight hypotheses,
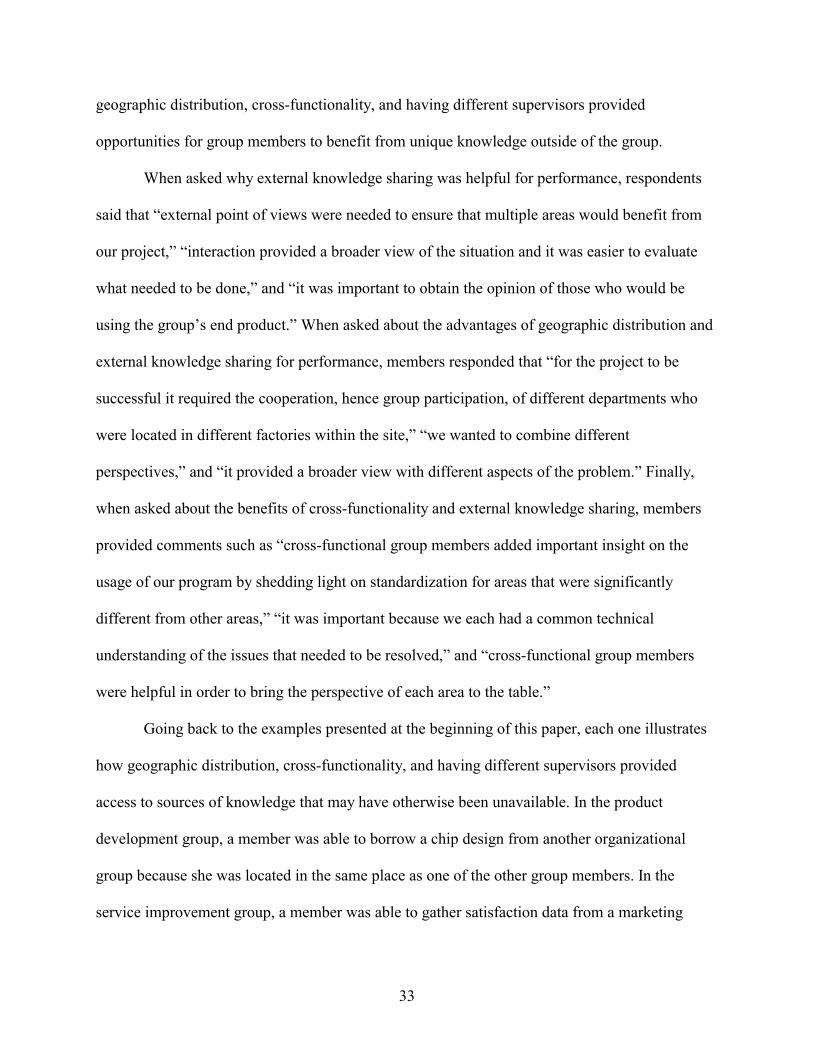
33
geographic distribution, cross-functionality, and having different supervisors provided
opportunities for group members to benefit from unique knowledge outside of the group.
When asked why external knowledge sharing was helpful for performance, respondents
said that “external point of views were needed to ensure that multiple areas would benefit from
our project,” “interaction provided a broader view of the situation and it was easier to evaluate
what needed to be done,” and “it was important to obtain the opinion of those who would be
using the group’s end product.” When asked about the advantages of geographic distribution and
external knowledge sharing for performance, members responded that “for the project to be
successful it required the cooperation, hence group participation, of different departments who
were located in different factories within the site,” “we wanted to combine different
perspectives,” and “it provided a broader view with different aspects of the problem.” Finally,
when asked about the benefits of cross-functionality and external knowledge sharing, members
provided comments such as “cross-functional group members added important insight on the
usage of our program by shedding light on standardization for areas that were significantly
different from other areas,” “it was important because we each had a common technical
understanding of the issues that needed to be resolved,” and “cross-functional group members
were helpful in order to bring the perspective of each area to the table.”
Going back to the examples presented at the beginning of this paper, each one illustrates
how geographic distribution, cross-functionality, and having different supervisors provided
access to sources of knowledge that may have otherwise been unavailable. In the product
development group, a member was able to borrow a chip design from another organizational
group because she was located in the same place as one of the other group members. In the
service improvement group, a member was able to gather satisfaction data from a marketing

34
employee because they were in the same division. Lastly, in the manufacturing operations group,
they were able to use another factory in Scotland for benchmarking because one of the
supervisors was familiar with this operation.
Previous work has found that geographic distribution and cross-functionality are related
to more external task communication (e.g., Ancona & Caldwell, 1992b). However, on average,
members of distributed or cross-functional groups in this study did not share more external
knowledge than members of co-located or functionally homogeneous groups. Even though
members were in different locations or represented different functions, this did not guarantee that
they would share more knowledge outside of the group. As alluded to earlier, it may be that
knowledge sharing is purposeful and therefore less likely to occur spontaneously or informally as
does task communication. Moreover, distributed groups did not perform better than co-located
groups, and cross-functional groups did not perform better than functionally homogeneous
groups. This finding reinforces the importance of group process for effectiveness. In other words,
when designing groups, managers are not ensured better performance by employing distributed
or cross-functional work groups. The chances of better performance increase by encouraging
knowledge sharing between those group members and others in their external social networks.
Alternative Explanations
There are several alternative explanations for why external knowledge sharing was
beneficial for performance when groups were diverse. First, one might expect that sharing some
kinds of knowledge externally would be better than sharing others. Rather, it was sharing a
combination of the general overview, specific requirements, analytical techniques, progress
reports, and project results that predicted performance. Individually, each type of knowledge was
not a significant factor, suggesting that the measurement of knowledge sharing likely did not
35
allow for fine distinctions among content. Future research should explore different measures of
knowledge sharing activities. Second, one might also expect that sharing knowledge through
some external networks would be more effective than sharing through others. However, analyses
with the sum were more strongly related to performance than any of the individual targets of
external knowledge sharing alone. Future research should also examine different measures of
knowledge sharing networks.
Finally, performance was rated at each of the regional, division, and corporate events
roughly six months before group members completed the surveys. Although managers did not
give detailed feedback to groups regarding their performance, all groups knew whether or not
they advanced to the next level. Participants could have responded to the survey in a way that
conformed to their intuitions about performance, hence their reports of knowledge sharing could
have been a result of their performance. Similarly, work groups with better performing members
may have shared more knowledge because of opportunities they created for themselves, thus it
may not have been that knowledge sharing resulted in better performance but rather that better
performance resulted in more knowledge sharing. However, in either case, the data reported here
are cross-sectional, and claims about causality cannot be substantiated.
Limitations
There are also several limitations of this field study. The sample was chosen
opportunistically; there is no documented information on how representative the work groups are
in size, membership, or capabilities. One reason for the low R2 in the regression analyses (which
ranged from .09 and .25, see Table 7) may be that variance was restricted on the dependent
variable because only moderately to highly successful groups were examined. The next concern
involves the measurement of knowledge sharing. The self-report survey raises concerns about

36
measurement error. Because surveys were administered an average of six months after the
projects, members were unable to distinguish between time periods, kinds of activities, and types
of external networks. The development of better metrics for capturing knowledge sharing are
needed, such as ways for members to count actual conversations, documents, or transfers of
information. Similarly, this study only examined one aspect of the many kinds of interactions
people can have in the workplace. Interactions other than task communication and knowledge
sharing are unaccounted for here. Evidence is also missing on the quality of the knowledge being
shared. It is likely that diverse external networks matter more when the knowledge is timely,
scarce, or relevant.
In addition, it remains indeterminate under what conditions it is better to be the source or
recipient of knowledge, and which kinds of knowledge-sharing behaviors can have a negative
impact on performance. Surely all knowledge is not critical to have, and sometimes it is better to
give than to receive. It is also uncertain how knowledge sharing would occur under conditions of
competition or hostility among groups in the corporation. The culture of this organization may
also be unique in that it encouraged diversity and knowledge sharing in work groups, whereas
other companies may not be as forward-thinking. Replicating these findings in other
organizations is certainly recommended to assess the generalizability of the results. Future
research will need to address these concerns to fully understand the role of knowledge sharing in
global organizations.
Next Steps
There are several next steps which would enhance our understanding of why diversity is
particularly beneficial for work groups when knowledge is shared externally. First, it remains
unclear what role social or non-task communication plays in knowledge sharing outside of work

37
groups. It may be the case that ties outside of work groups need to be nurtured and fostered
through extracurricular activities before knowledge sharing is possible. Surveying work group
members about non-task communication is an important extension of this work. Second, it is not
known whether the most qualified group members in terms of functional expertise also have the
strongest ties outside of the group. Group interviews as well as supplementary analyses suggest
that external knowledge sharing is maintained by a small number of successful group members,
though more data are needed about whether these group members are also the experts.
Manager’s ratings of member expertise would be a necessary addendum to the surveys. Third,
better means for assessing external knowledge sharing during different stages of the work group
life-cycle will help to determine when members benefit from diverse information and resources.
In this survey, group members did not distinguish very well between early and late in the project,
thus external knowledge sharing appeared to equally important at both stages. Finally, group
satisfaction and other non-performance consequences of external knowledge sharing may
reinforce this behavior. There may be other personal benefits for members who share knowledge
externally that were not measured here, such as education or learning.
Conclusion
A theoretical goal for this paper was to identify a more precise mechanism for how
knowledge should be shared outside of work groups to improve performance. Knowledge
sharing seems to be particularly vital for group members in large firms because the coordination
of work requires task information, know-how, and feedback that a single individual does not
often have. It is also clear that knowledge sharing both within and outside of work groups is
important for performance. This paper found that external knowledge sharing is more important
for distributed or cross-functional groups. Because group members are not located near one
38
another or represent dissimilar functions, it is necessary to communicate about the work with
non-group employees or customers who are located nearby or who represent similar functions.
A managerial goal of designing groups to include members with external social networks
to improve performance is also important for managers who have to make choices about the
design of work groups. The implications of these findings are wide-ranging, given that having a
diverse group only makes a difference for performance when members have external ties. The
power of this study is not the main effect of external knowledge sharing on performance, but in
the significance of two interactions between external knowledge sharing and groups with
members (1) who are in different geographic locations and (2) who represent different functional
areas. These different sources provided members with access, much like a portal, to unique
knowledge outside of the group. Managers who design work groups should take advantage of
these opportunities.
There is still a lot to learn about knowledge sharing and work groups in a global
organization. This paper extends a long tradition of basic and applied research on the factors
related to group performance. On the one hand, the statistical analyses suggest that many of the
variables that scholars and managers care about, such as task type, project length, and
availability of resources, were unrelated to group performance in this field study. On the other
hand, despite growing challenges to effective teamwork such as globalization and specialization,
the importance of task communication and knowledge sharing remains fundamental. Not only is
sharing knowledge about the task critical within the group, but work-related communication
outside of the group is also essential. For multinational corporations that want to have successful
work groups well into the 21st century, external knowledge sharing through distributed or cross-
functional group members is a fruitful possibility.

39
References
Alderfer, C., & Smith, K. (1982). Studying intergroup relations embedded in organizations.
Administrative Science Quarterly, 37, 634-665.
Allen, T. (1977). Managing the flow of technology. Cambridge, MA: MIT Press.
Ancona, D. (1990). Outward bound: Strategies for team survival in an organization. Academy of
Management Journal, 33, 334-365.
Ancona, D., & Caldwell, D. (1992a). Bridging the boundary: External activity and performance
in organizational teams. Administrative Science Quarterly, 37, 634-665.
Ancona, D., & Caldwell, D. (1992b). Demography and design: Predictors of new product team
performance. Organization Science, 3(3), 321-341.
Ancona, D., & Caldwell, D. (2000). Compose teams to assure successful boundary activity. In E.
Locke (Ed.), The Blackwell handbook of principles of organizational behavior. New
York: Blackwell Press.
Argote, L., Ingram, P., Levine, J., & Moreland, R. (2000). Knowledge transfer in organizations.
Organizational Behavior and Human Decision Processes, 82(1), 1-8.
Bales, R. (1950). Interaction process analysis: A method for the study of small groups.
Cambridge, MA: Addison-Wesley.
Brown, J., & Utterback, J. (1985). Uncertainty and technical communication patterns.
Management Science, 31(3), 301-311.
Burns, L. (1989). Matrix management in hospitals: Testing theories of matrix structure and
development. Administrative Science Quarterly, 34, 349-368.
Burt, R. (1992). Structural holes: The structure of competition. Cambridge, MA: Harvard
University Press.

40
Cohen, S., & Bailey, D. (1997). What makes teams work: group effectiveness research from the
shop floor to the executive suite. Journal of Management Information Systems, 23(3),
239-264.
Cohen, W., & Levinthal, D. (1990). Absorptive capacity: A new perspective on learning and
innovation. Administrative Science Quarterly, 35, 128-152.
Conrath, D. (1973). Communication environment and its relationship to organizational structure.
Management Science, 20, 586-603.
Cramton, C. (in press). The mutual knowledge problem and its consequences in dispersed
collaboration. Organization Science.
Davis, S., & Lawrence, P. (1977). Matrix. Reading, MA: Addison-Wesley.
Denison, D., Hart, S., & Kahn, J. (1996). From chimneys to cross-functional teams: Developing
and validating a diagnostic model. Academy of Management Journal, 39, 1005-1023.
DeSanctis, G., & Monge, P. (1999). Communication processes for virtual organizations.
Organization Science, 10(6), 693-703.
Dougherty, D. (1992). Interpretive barriers to successful product innovation in large firms.
Organization Science, 3(2), 179-202.
Ebadi, Y., & Utterback, J. (1984). The effects of communication on technological innovation.
Management Science, 30(5), 572-585.
Eisenhardt, K., & Tabrizi, B. (1995). Accelerating adaptive processes: Product innovation in the
global computer industry. Administrative Science Quarterly, 40, 84-110.
Ford, R., & Randolph, W. (1992). Cross-functional structures: A review and integration of
matrix organization and project management. Journal of Management, 18(2), 267-294.

41
Friedkin, N. (1982). Information flow through strong and weak ties in intraorganizational social
networks. Social Networks, 3, 273-285.
Gladstein, D. (1984). Groups in context: A model of task group effectiveness. Administrative
Science Quarterly, 29, 499-517.
Granovetter, M. (1973). The strength of weak ties. American Journal of Sociology, 78, 1360-
1380.
Griffin, A., & Hauser, J. (1992). Patterns of communication among marketing, engineering, and
manufacturing. Management Science, 38(3), 360-373.
Guetzkow, H. (1965). Communication in organizations. In J. March (Ed.), Handbook of
Organizations (pp. 534-573). Chicago, IL: Rand McNally & Company.
Guzzo, R., & Dickson, M. (1996). Teams in organizations: Recent research on performance and
effectiveness. Annual Review of Psychology, 47, 307-338.
Hackman, R. (1987). The design of work teams. In J. Lorsch (Ed.), Handbook of Organizational
Behavior. Englewood Cliffs, NJ: Prentice-Hall.
Hansen, M. (1999). The search-transfer problem: The role of weak ties in sharing knowledge
across organization subunits. Administrative Science Quarterly, 44, 82-111.
Jarvenpaa, S., & Leidner, D. (1999). Communication and trust in global virtual teams.
Organization Science, 10(6), 791-815.
Jehn, K., Northcraft, G., & Neale, M. (1999). Why differences make a difference: A field study
of diversity, conflict, and performance in workgroups. Administrative Science Quarterly,
44, 741-763.
Katz, D., & Kahn, R. (1978). The social psychology of organizations. New York: Wiley.
42
Katz, R., & Allen, T. (1982). Investigating the Not Invented Here (NIH) syndrome: A look at the
performance, tenure, and communication patterns of 50 R&D project groups. R&D
Management, 12(1), 7-19.
Katz, R., & Tushman, M. (1979). Communication patterns, project performance, and task
characteristics: An empirical evaluation and integration in an R&D setting.
Organizational Behavior and Human Decision Processes, 23, 139-162.
Kiesler, S., & Cummings, J. (in press). What do we know about proximity and distance in work
groups? A legacy of research. In P. Hinds, & Kiesler, S. (Ed.), Distributed work.
Cambridge, MA: MIT Press.
Krackhardt, D. (1992). The strength of strong ties: The importance of philos in organizations. In
N. Nohria, & Eccles, R. (Ed.), Networks and organizations: Structure, form, and action
(pp. 216-239). Boston: Harvard Business School Press.
Liang, D., Moreland, R., & Argote, L. (1995). Group versus individual training and group
performance: The mediating role of transactive memory. Personality and Social
Psychology Bulletin, 21, 384-393.
Lin, N., Ensel, W., & Vaughn, J. (1981). Social resources and strength of ties: Structural factors
in occupational status attainment. American Sociological Review, 46, 393-405.
Lipnack, J., & Stamps, J. (1997). Virtual teams: Reaching across space, time, and organizations
with technology. New York: John Wiley & Sons.
March, J., & Simon, H. (1958). Organizations. New York: Wiley.
Maznevski, M., & Chudoba, C. (2000). Bridging space over time: Global virtual team dynamics
and effectiveness. Organization Science, 11(5), 473-492.
McGrath, J. (1984). Groups: Interaction and performance. Englewood Cliffs, NJ: Prentice Hall.

43
McGrath, J., Berdahl, J., & Arrow, H. (1996). No one has it but all groups do: Diversity as a
collective, complex, and dynamic property of groups. In S. Jackson, & Ruderman, M.
(Ed.), Diversity in work teams: Research paradigms for a changing world (pp. 42-66).
Washington, DC: APA Publications.
Monge, P., Rothman, L., Eisenberg, E., Miller, K., & Kirste, K. (1985). The dynamics of
organizational proximity. Management Science, 31(9), 1129-1141.
Moreland, R. L., & Myaskovsky, L. (2000). Exploring the performance benefits of group
training: Transactive memory or improved communication? Organizational Behavior &
Human Decision Processes, 82, 117-133.
Nelson, R., & Winter, S. (1982). An evolutionary theory of economic change. Cambridge, MA:
Harvard University Press.
O'Hara-Devereaux, M., & Johansen, R. (1994). GlobalWork: Bridging distance, culture, and
time. San Francisco: Jossey-Bass.
Pelled, L., Eisenhardt, K., & Xin, K. (1999). Exploring the black box: An analysis of work group
diversity, conflict, and performance. Administrative Science Quarterly, 44, 1-28.
Pelz, D., & Andrews, F. (1966). Scientists in organizations: Productive climates for research
and development. New York: Wiley.
Pfeffer, J., & Salancik, G. (1978). The external control of organizations: A resource dependence
perspective. New York: Harper & Row.
Polanyi, M. (1966). The tacit dimension. New York: Doubleday.
Spender, J., & Grant, R. (1996). Knowledge and the firm: Overview. Strategic Management
Journal, 17(Winter), 5-9.
Steiner, I. (1972). Group process and productivity. New York: Academic Press.

44
Stohl, C., & Redding, C. (1987). Messages and message exchange processes. In F. Jablin,
Putnam, L., Roberts, K., & Porter, L. (Ed.), Handbook of organizational communication
(pp. 451-502). Newbury Park: Sage.
Sundstrom, E., De Meuse, K., & Futrell, D. (1990). Work teams: Applications and effectiveness.
American Psychologist, 45, 120-133.
Sundstrom, E. A. (1999). Supporting work team effectiveness. San Francisco: Jossey-Bass.
Szulanski, G. (1996). Exploring internal stickiness: Impediments to the transfer of best practice
within the firm. Strategic Management Journal, 17(Winter), 27-43.
Teachman, J. (1980). Analysis of population diversity. Sociological Methods and Research, 5,
341-362.
Teece, D. (1977). Technology transfer by multinational firms: The resource cost of transferring
technological know-how. Economic Journal, 87, 242-261.
Thompson, J. (1967). Organizations in action. New York: McGraw-Hill.
Townsend, A., DeMarie, S., & Hendrickson, A. (1998). Virtual teams: Technology and the
workplace of the future. Academy of Management Executive, 12(3), 17-29.
Tushman, M. (1978). Technical communication in R&D laboratories: The impact of project
work characteristics. Academy of Management Journal, 21(4), 624-645.
Tushman, M. (1979). Impacts of perceived environmental variability on patterns of work related
communication. Academy of Management Journal, 22(1), 482-500.
Tushman, M., & Katz, R. (1980). External communication and project performance: An
investigation into the role of gatekeepers. Management Science, 26(11), 1071-1085.

45
Van den Bulte, C., & Moenaert, R. (1998). The effects of R&D team co-location on
communication patterns among R&D, marketing, and manufacturing. Management
Science, 44(11), S1-S18.
von Hippel, E. (1988). The sources of innovation. New York: Oxford University Press.
Williams, K., & O'Reilly, C. (1998). Demography and diversity in organizations: A review of 40
years of research. Research in Organizational Behavior, 20, 77-140.
Winter, S. (1987). Knowledge and competence as strategic assets. In D. Teece (Ed.), The
competitive challenge. Cambridge, MA: Ballinger.
Zander, U., & Kogut, B. (1995). Knowledge and the speed of the transfer and imitation of
organizational capabilities: An empirical test. Organization Science, 6(1), 76-92.

46
Table 1. Project descriptions from six work groups, including (fictitious) work group name, group size, number of geographic
locations and buildings in each location, the distribution index value, number of functional areas and members in each function, the
cross-functional index value, number of different supervisors, the different supervisors index value, and project length in months.
# Work Group Name Size Locations
(buildings) GeogDist
Index Functions (members)
CrosFunc Index
Supervisors(number)
DifSuper Index
Project description
Length (mo.)
1 Error Detection 4 Israel(1) 2.67 Engineer(3)
Support(1) 0.56 4 1.39 Developed utility for
detecting wiring errors on electrical boards
10
2 Handheld Design 10
Georgia(1) Tennessee(1)
Illinois(2) Israel(3)
Arizona(1)
6.29
Engineering(1)Manufacture(1)
Quality(1) Proj. Mgmt(4) Cust. Srvc(1) Marketing(1)
Sales(1)
1.75 10 2.30 Designed handheld scanning device for shipping company
25
3 Platform Conversion 9 Illinois(3) 3.67
Engineer(1) Quality(2)
Proj. Mgmt(2) Marketing(2) Finance(1)
Sales(1)
1.89 8 2.04 Converted client
platform for car phones from analog to digital
9
4 Subscriber Requirements 6 China(3) 4.37
Engineer(3) Quality(1)
Proj. Mgmt(2) 1.01 6 1.79
Enhanced phone system performance to meet
subscriber requirements 7
5 Business Separation 8 Arizona(4) 4.54
Tech. Ops(1) Info Tech(6)
HR(1) 0.74 7 1.91
Executed separation/ sale of business unit to
another stakeholder 4
6 Factory Modification 9 Ireland(1)
England(1) 4.74 Engineer(3)
Manufacture(5)Quality(1)
1.21 9 2.20 Modified existing
factory to support new production of pager
8
Note: Work groups #1,#2-product development; #3,#4-service improvement; #5-process management; #6-manufacturing operations

47
Table 2. Examples of internal and external knowledge sharing in five different work groups by activity.
# Activity Work Group Name Project Description Internal Knowledge Sharing External Knowledge Sharing
1 General Overviews
Material Bonding
Invented material with more reliable bonding during production
Created a planning document with timeline
Made presentations to other units in division with need for material
2 Specific Requirements
Circuit Cost
Cut cost of circuit wafers used in radios and base stations
Assessed availability of supplies for use in circuit
Consulted customer about appropriate size of circuit wafers
3 Analytical Techniques
Capacity Expansion
Expanded capacity of production line using modified equipment
Established a procedure for testing the equipment
Evaluated performance metrics with other work groups in facility
4 Progress Reports
Process Integration
Re-designed fabrication process by integrating less costly materials
Had weekly update through telephone conference
Reported to general manager to help stay on schedule
5 Project Results
Mobile Manufacturing
Built, tested, and manufactured mobile product in short time
Wrote a white paper describing the process
Presented preliminary findings at company conference on mobility

48
Table 3. Means and standard deviations for amount of knowledge sharing (general overviews, specific requirements, analytical
techniques, progress reports, and project results) by network (within group, with non-group employees inside the division, with non-
group employees outside the division, and with the customer) (N=182 work groups).
Network Amount
Within Group (Internal)
Within Division (External)
Outside Division (External)
Customer (External)
Average (External)
Mean (SD) Mean (SD) Mean (SD) Mean (SD) Mean (SD) Knowledge Sharing
General Overviews 4.15 (.47) 3.04 (.57) 2.10 (.75) 2.47 (.92) 2.60 (.68) Specific Requirements 3.70 (.59) 2.71 (.58) 1.94 (.66) 2.19 (.85) 2.33 (.64)
Analytical Techniques 3.81 (.66) 2.72 (.64) 1.93 (.64) 2.08 (.82) 2.29 (.62)
Progress Reports 4.00 (.51) 2.85 (.65) 1.97 (.51) 2.25 (.91) 2.41 (.67) Project Results 4.09 (.48) 2.94 (.65) 2.04 (.71) 2.36 (.89) 2.53 (.66)
Average 3.95 (.42) 2.86 (.54) 2.00 (.66) 2.27 (.84) 2.43 (.62) Note: 5-point scale for knowledge sharing is 1:never, 2:rarely, 3:sometimes, 4:regularly, 5:a lot.

49
Table 4. Correlation matrix with main study variables (N = 182 work groups).
Variable 1 2 3 4 5 6 7 8 9 10 11 12 13 14 15 16 17 18 19 1. Product --- 2. Service -.33 --- 3. Process -.33 -.33 --- 4. Operations -.34 -.34 -.34 --- 5. Size -.10 -.03 .02 .11 --- 6. Length .10 -.01 .02 -.11 -.05 --- 7. Resources .22 .02 -.18 -.06 -.08 .01 --- 8. Uncertainty .07 .16 -.16 -.08 .06 -.05 .08 --- 9. Closeness .00 .02 -.15 .13 -.14 -.02 .09 .05 --- 10. Difficulty -.12 .02 -.08 .17 .10 .06 -.21 -.03 .06 --- 11. Geog.Dist. -.02 .11 .12 -.21 .15 -.08 -.09 .14 -.08 -.11 --- 12. Cros.Func. -.20 .25 .02 -.07 .26 .04 -.02 .02 -.03 -.06 .20 --- 13. Diff.Super. -.04 -.05 .10 -.01 .54 -.14 -.04 .04 -.23 .07 .34 .35 --- 14. Int. OC .02 .02 -.16 .12 -.20 -.09 .20 .08 .43 -.10 -.41 -.11 -.31 --- 15. Ext. OC .08 .11 -.12 -.06 .04 -.11 .22 .12 .24 -.13 .00 .05 .03 .40 --- 16. Int. FD .04 -.08 .01 .03 -.12 -.08 .09 .13 .26 -.03 -.08 -.37 -.13 .31 .18 --- 17. Ext. FD .02 .00 -.07 .04 .08 -.11 .20 .01 .23 -.09 .08 .00 .11 .28 .66 .38 --- 18. Int. KS .04 -.02 -.06 .03 -.13 -.01 .12 -.06 .40 -.05 -.08 -.11 -.10 .48 .28 .44 .31 --- 19. Ext. KS .04 -.05 -.10 .11 .06 -.09 .16 .00 .30 -.18 .02 .07 .05 .35 .77 .24 .67 .41 --- 20. Perform .07 -.05 -.05 .02 .19 -.04 .11 .06 .08 -.04 .06 .14 .13 .21 .28 .11 .25 .27 .36 Note: r > .12, p < .10; r > .15, p < .05; r > .18, p < .01; OC–overall communication, FD–functional discussion, KS–knowledge sharing

50
Table 5. Regression analyses predicting geographic distribution (GEOGDIST), cross-
functionality (CROSFUNC), and different supervisors (DIFSUPER) (N = 182 work groups).
Model (DV) 1 (GEOGDIST) 2 (CROSFUNC) 3 (DIFSUPER) Variables B SE B SE B SE Constant 3.14 0.89 0.05 0.38 0.66 0.27
Product -0.15 0.23 -0.14 0.09 0.01 0.07
Service 0.04 0.23 0.24* 0.09 -0.12 t 0.07
Process --- --- --- --- --- ---
Operations -0.51* 0.23 -0.01 0.09 -0.04 0.07
Size -0.02 0.05 0.02 0.02 0.09** 0.01
Length -0.06 0.12 0.08 0.05 -0.08* 0.04
Resources -0.06 0.04 0.00 0.02 0.01 0.01
Uncertain 0.05 0.03 -0.01 0.01 0.00 0.01
Closeness 0.07 0.18 0.07 0.07 -0.14 0.05
Difficulty -0.38 0.22 -0.15 0.09 0.12 t 0.07
GeogDist 0.02 0.03 0.09** 0.02
CrosFunc 0.13 0.19 0.21** 0.05
DifSuper 0.95** 0.25 0.38 0.10
df 11 11 11 R2 .17 .20 .36
Note: tp < .10, *p < .05, **p < .01

51
Table 6. Regression analyses predicting internal knowledge sharing (INT KS), and external
knowledge sharing (EXT KS) (N = 182 work groups).
Model (DV) 1 (INT KS) 2 (EXT KS) Variables B SE B SE Constant 2.68 0.35 0.26 0.64
Product 0.04 0.08 0.04 0.12
Service 0.02 0.07 -0.01 0.12
Process --- --- --- ---
Operations -0.03 0.07 0.16 0.11
Size -0.01 0.01 0.03 0.02
Length 0.01 0.04 -0.06 0.06
Resources 0.00 0.01 0.02 0.02
Uncertain -0.01 0.01 0.00 0.02
Closeness 0.18** 0.06 0.23* 0.10
Difficulty 0.03 0.07 -0.27* 0.11
GeogDist 0.01 0.02 0.02 0.04
CrosFunc 0.22 0.22 0.22 0.22
DifSuper 0.06 0.06 0.09 0.09
Int. KS 0.56** 0.12
Ext. KS 0.22** 0.05
df 13 13 R2 .36 .28
Note: tp < .10, *p < .05, **p < .01
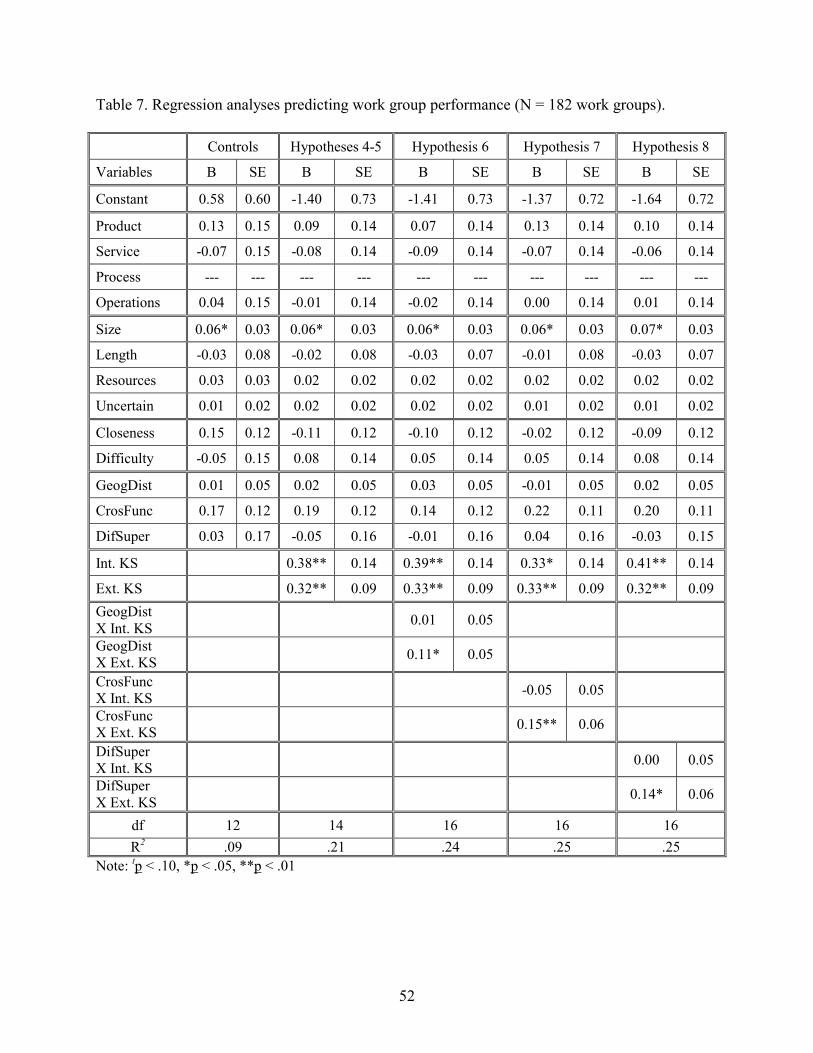
52
Table 7. Regression analyses predicting work group performance (N = 182 work groups).
Controls Hypotheses 4-5 Hypothesis 6 Hypothesis 7 Hypothesis 8
Variables B SE B SE B SE B SE B SE
Constant 0.58 0.60 -1.40 0.73 -1.41 0.73 -1.37 0.72 -1.64 0.72
Product 0.13 0.15 0.09 0.14 0.07 0.14 0.13 0.14 0.10 0.14
Service -0.07 0.15 -0.08 0.14 -0.09 0.14 -0.07 0.14 -0.06 0.14
Process --- --- --- --- --- --- --- --- --- ---
Operations 0.04 0.15 -0.01 0.14 -0.02 0.14 0.00 0.14 0.01 0.14
Size 0.06* 0.03 0.06* 0.03 0.06* 0.03 0.06* 0.03 0.07* 0.03
Length -0.03 0.08 -0.02 0.08 -0.03 0.07 -0.01 0.08 -0.03 0.07
Resources 0.03 0.03 0.02 0.02 0.02 0.02 0.02 0.02 0.02 0.02
Uncertain 0.01 0.02 0.02 0.02 0.02 0.02 0.01 0.02 0.01 0.02
Closeness 0.15 0.12 -0.11 0.12 -0.10 0.12 -0.02 0.12 -0.09 0.12
Difficulty -0.05 0.15 0.08 0.14 0.05 0.14 0.05 0.14 0.08 0.14
GeogDist 0.01 0.05 0.02 0.05 0.03 0.05 -0.01 0.05 0.02 0.05
CrosFunc 0.17 0.12 0.19 0.12 0.14 0.12 0.22 0.11 0.20 0.11
DifSuper 0.03 0.17 -0.05 0.16 -0.01 0.16 0.04 0.16 -0.03 0.15
Int. KS 0.38** 0.14 0.39** 0.14 0.33* 0.14 0.41** 0.14
Ext. KS 0.32** 0.09 0.33** 0.09 0.33** 0.09 0.32** 0.09 GeogDist X Int. KS 0.01 0.05
GeogDist X Ext. KS 0.11* 0.05
CrosFunc X Int. KS -0.05 0.05
CrosFunc X Ext. KS 0.15** 0.06
DifSuper X Int. KS 0.00 0.05
DifSuper X Ext. KS 0.14* 0.06
df 12 14 16 16 16 R2 .09 .21 .24 .25 .25
Note: tp < .10, *p < .05, **p < .01

53
Table 8. Regression analyses predicting work group performance (With overall communication
instead of knowledge sharing) (N = 182 work groups).
Controls Hypotheses 4-5 Hypothesis 6 Hypothesis 7 Hypothesis 8
Variables B SE B SE B SE B SE B SE
Constant 0.58 0.60 -1.25 0.76 -1.36 0.77 -1.24 0.75 -1.46 0.76
Product 0.13 0.15 0.10 0.14 0.08 0.14 0.12 0.14 0.09 0.14
Service -0.07 0.15 -0.12 0.14 -0.12 0.14 -0.13 0.14 -0.10 0.14
Process --- --- --- --- --- --- --- --- --- ---
Operations 0.04 0.15 0.03 0.14 0.02 0.14 0.03 0.14 0.06 0.14
Size 0.06* 0.03 0.06* 0.03 0.06* 0.03 0.06* 0.03 0.07* 0.03
Length -0.03 0.08 0.02 0.08 0.01 0.08 0.02 0.08 0.03 0.08
Resources 0.03 0.03 0.01 0.03 0.02 0.03 0.01 0.02 0.01 0.02
Uncertain 0.01 0.02 0.00 0.02 0.00 0.02 -0.01 0.02 -0.01 0.02
Closeness 0.15 0.12 -0.05 0.12 -0.05 0.12 0.02 0.12 0.01 0.12
Difficulty -0.05 0.15 0.05 0.14 0.05 0.14 0.03 0.14 0.02 0.14
GeogDist 0.01 0.05 0.08 0.05 0.10 0.05 0.06 0.05 0.09 0.05
CrosFunc 0.17 0.12 0.16 0.12 0.13 0.12 0.17 0.12 0.13 0.12
DifSuper 0.03 0.17 0.05 0.16 0.05 0.16 0.06 0.16 0.07 0.16
Int. OC 0.41** 0.15 0.43** 0.16 0.39** 0.15 0.43** 0.15
Ext. OC 0.26* 0.12 0.26* 0.12 0.26* 0.12 0.26* 0.12 GeogDist X Int. OC 0.05 0.05
GeogDist X Ext. OC 0.03 0.06
CrosFunc X Int. OC 0.05 0.05
CrosFunc X Ext. OC 0.11* 0.05
DifSuper X Int. OC 0.05 0.05
DifSuper X Ext. OC 0.12* 0.06
df 12 14 16 16 16 R2 .09 .17 .18 .21 .21
Note: tp < .10, *p < .05, **p < .01

54
Table 9. Regression analyses predicting work group performance (With functional discussion
instead of knowledge sharing) (N = 182 work groups).
Controls Hypotheses 4-5 Hypothesis 6 Hypothesis 7 Hypothesis 8
Variables B SE B SE B SE B SE B SE
Constant 0.58 0.60 -0.25 0.76 -0.27 0.76 0.01 0.75 -0.46 0.77
Product 0.13 0.15 0.14 0.15 0.13 0.15 0.18 0.15 0.16 0.15
Service -0.07 0.15 -0.07 0.15 -0.09 0.15 -0.07 0.14 -0.06 0.15
Process --- --- --- --- --- --- --- --- --- ---
Operations 0.04 0.15 0.04 0.15 0.04 0.15 0.06 0.14 0.04 0.15
Size 0.06* 0.03 0.06* 0.03 0.06* 0.03 0.05* 0.03 0.06* 0.03
Length -0.03 0.08 -0.01 0.08 -0.02 0.08 -0.04 0.08 -0.02 0.08
Resources 0.03 0.03 0.02 0.03 0.02 0.03 0.02 0.03 0.02 0.03
Uncertain 0.01 0.02 0.01 0.02 0.01 0.02 -0.01 0.02 0.01 0.02
Closeness 0.15 0.12 0.04 0.12 0.06 0.12 0.17 0.12 0.08 0.12
Difficulty -0.05 0.15 -0.01 0.14 -0.02 0.14 0.00 0.14 0.01 0.14
GeogDist 0.01 0.05 0.01 0.05 0.01 0.05 -0.01 0.05 0.01 0.05
CrosFunc 0.17 0.12 0.24t 0.13 0.22t 0.13 0.25t 0.13 0.24t 0.13
DifSuper 0.03 0.17 -0.03 0.16 -0.02 0.16 0.03 0.16 0.00 0.17
Int. FD 0.15 0.14 0.15 0.14 0.04 0.14 0.15 0.14
Ext. FD 0.18* 0.09 0.18* 0.09 0.20* 0.08 0.19* 0.09 GeogDist X Int. FD 0.05 0.05
GeogDist X Ext. FD 0.05 0.06
CrosFunc X Int. FD 0.01 0.05
CrosFunc X Ext. FD 0.20** 0.06
DifSuper X Int. FD -0.02 0.05
DifSuper X Ext. FD 0.10 t 0.06
Df 12 14 16 16 16 R2 .09 .13 .14 .19 .15
Note: tp < .10, *p < .05, **p < .01

55
Figure 1. Model of knowledge sharing within and outside of work groups.
Internal Knowledge Sharing
Share general overviews, specific requirements, analytical techniques,
progress reports, and results among group members
External Knowledge Sharing
Share general overviews, specific requirements, analytical techniques,
progress reports, and results with other division members, non-division members, and
the customer
Geographic Distribution
Average distance between group members, such as
different building, different city, or different country
Cross-Functionality
Entropy-based diversity index with the number of different functional areas that group
members represented
Performance
Senior manager ratings of teamwork, clearly defined
problem selection, appropriateness of method
used to solve problem, innovativeness of remedies
used to solve problem, quality of impact from results,
institutionalism of solution, and clarity of presentation
Different Supervisors
Entropy-based diversity index with the number of different
supervisors that group members reported to
+
+
-
+

56
Figure 2. Interaction plot of external knowledge sharing and geographic distribution.
External Knowledge Sharing
HighLow
Wor
k G
roup
Per
form
ance
(mea
n)
2.2
2.0
1.8
1.6
1.4
Distributed
Low
High

57
Figure 3. Interaction plot of external knowledge sharing and cross-functionality.
External Knowledge Sharing
HighLow
Wor
k G
roup
Per
form
ance
(mea
n)2.2
2.0
1.8
1.6
1.4
Cross-Functional
Low
High

58
Figure 4. Interaction plot of external knowledge sharing and different supervisors.
External Knowledge Sharing
HighLow
Wor
k G
roup
Per
form
ance
(mea
n)2.2
2.0
1.8
1.6
1.4
Different Supervisor
Low
High

59
Appendix A. Ordered logit analyses predicting work group performance (N = 182 work groups).
Controls Hypotheses 4-5 Hypothesis 6 Hypothesis 7 Hypothesis 8
Variable B SE B SE B SE B SE B SE
Intercept 1 -2.76 1.76 -9.85 2.53 -9.90 2.53 -10.14 2.56 -10.97 2.57
Intercept 2 -5.10 1.79 -12.45 2.60 -12.58 2.60 -12.86 2.64 -13.72 2.66
Product .41 .44 .36 .46 .27 .46 .47 .46 .37 .46
Service -.19 .44 -.23 .46 -.30 .46 -.20 .46 -.14 .46
Process --- --- --- --- --- --- --- --- --- ---
Operations .19 .43 .05 .45 .02 .45 .08 .45 .10 .46
Size .19* .09 .21* .10 .20* .10 .21* .10 .25* .10
Length -.11 .23 -.10 .24 -.15 .25 -.07 .25 -.11 .25
Resources .11 .08 .08 .08 .09 .08 .09 .08 .07 .08
Uncertainty .02 .06 .04 .06 .04 .06 .03 .06 .03 .06
Closeness .41 .34 -.34 .40 -.36 .40 -.06 .42 -.27 .40
Difficulty -.25 .43 .16 .46 .11 .46 .09 .45 .18 .46
Geog.Dist. .05 .15 .09 .15 .10 .15 .01 .15 .13 .15
Cros.Func. .44 .36 .53 .38 .38 .39 .60 .38 .56 .38
Diff.Super. .11 .48 .13 .51 .01 .51 .14 .52 .10 .51
Int. KS 1.32** .48 1.36** .48 1.21* .49 1.45** .48
Ext. KS .97** .31 1.02** .31 1.00** .32 1.00** .32 Geog.Dist. X Int. KS .02 .18
Geog.Dist. X Ext. KS .38* .19
Cros.Func. X Int. KS -.16 .17
Cros.Func. X Ext. KS .51** .19
Diff.Super. X Int. KS -.02 .18
Diff.Super. X Ext. KS .52** .20
df 12 14 16 16 16 X2 16.20 42.34** 47.18** 49.53** 51.88**
Note: tp < .10, *p < .05, **p < .01