Wireless Telecommunications Industry Matthew Cohen, Andrew Pike, Michael Nolan, Michael...
59
Wireless Telecommunications Industry Matthew Cohen, Andrew Pike, Michael Nolan, Michael Dell’Amico
-
Upload
frank-robbins -
Category
Documents
-
view
221 -
download
0
Transcript of Wireless Telecommunications Industry Matthew Cohen, Andrew Pike, Michael Nolan, Michael...

Wireless Telecommunications
IndustryMatthew Cohen, Andrew Pike, Michael Nolan, Michael
Dell’Amico
Our Project
Introduction US Structure US Strategies EU Structure EU StrategiesConclusion
s
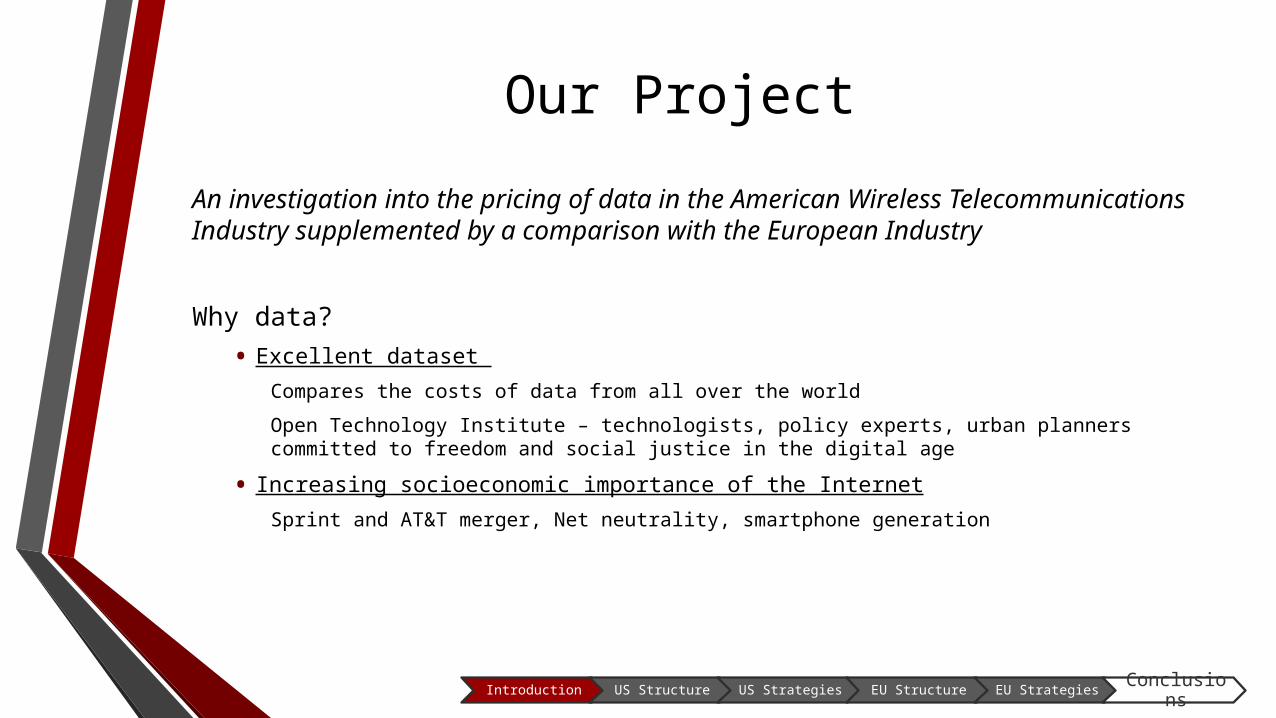
An investigation into the pricing of data in the American Wireless Telecommunications Industry supplemented by a comparison with the European Industry
Why data?
• Excellent dataset
Compares the costs of data from all over the world
Open Technology Institute – technologists, policy experts, urban planners committed to freedom and social justice in the digital age
• Increasing socioeconomic importance of the Internet
Sprint and AT&T merger, Net neutrality, smartphone generation
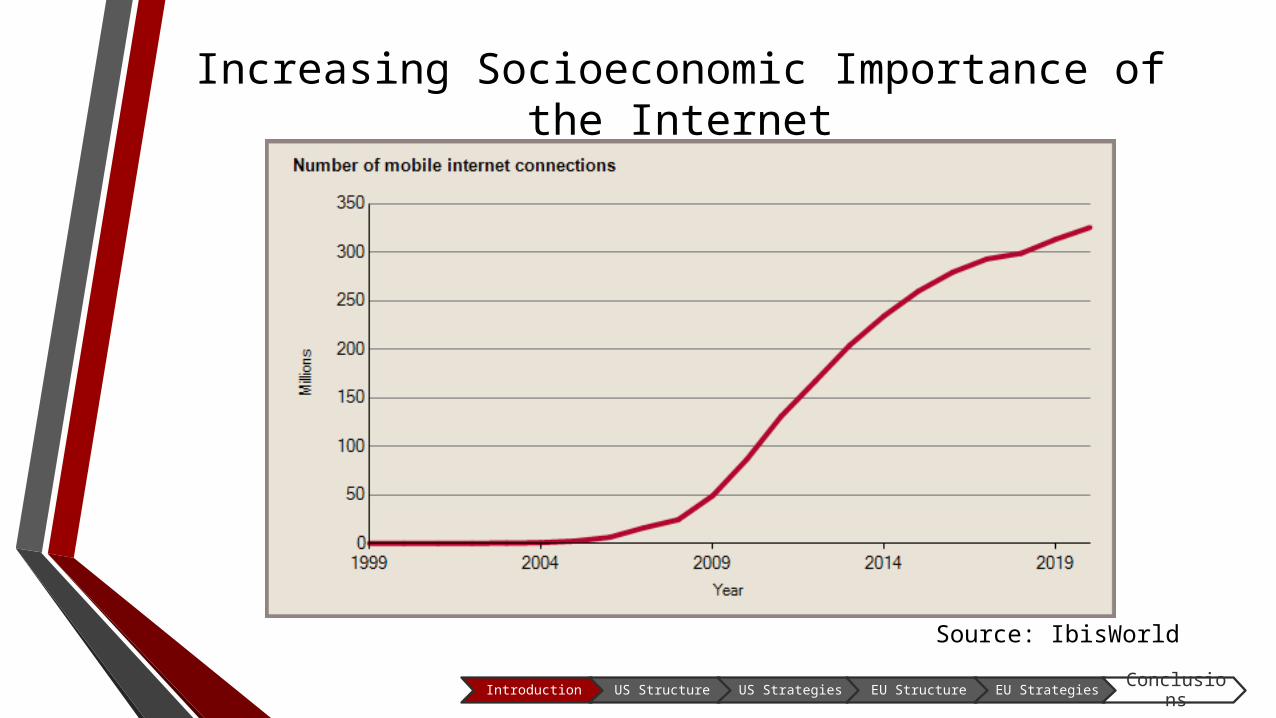
Source: IbisWorld
Increasing Socioeconomic Importance of the Internet
Introduction US Structure US Strategies EU Structure EU StrategiesConclusion
s

US Industry Structure

Industry Overview
• 2014 Key Figures
• Revenue: $242.1bn
• Profit: $61bn
• Annual Growth 10-15: 2.2%
• Projected Annual Growth 2015-2020: 2.2%
• # Businesses: 596
• Key Demand Drivers
• Price
• Connectivity
• Business cycles and profit margins
• Changes in technology
Introduction US Structure US Strategies EU Structure EU StrategiesConclusion
s
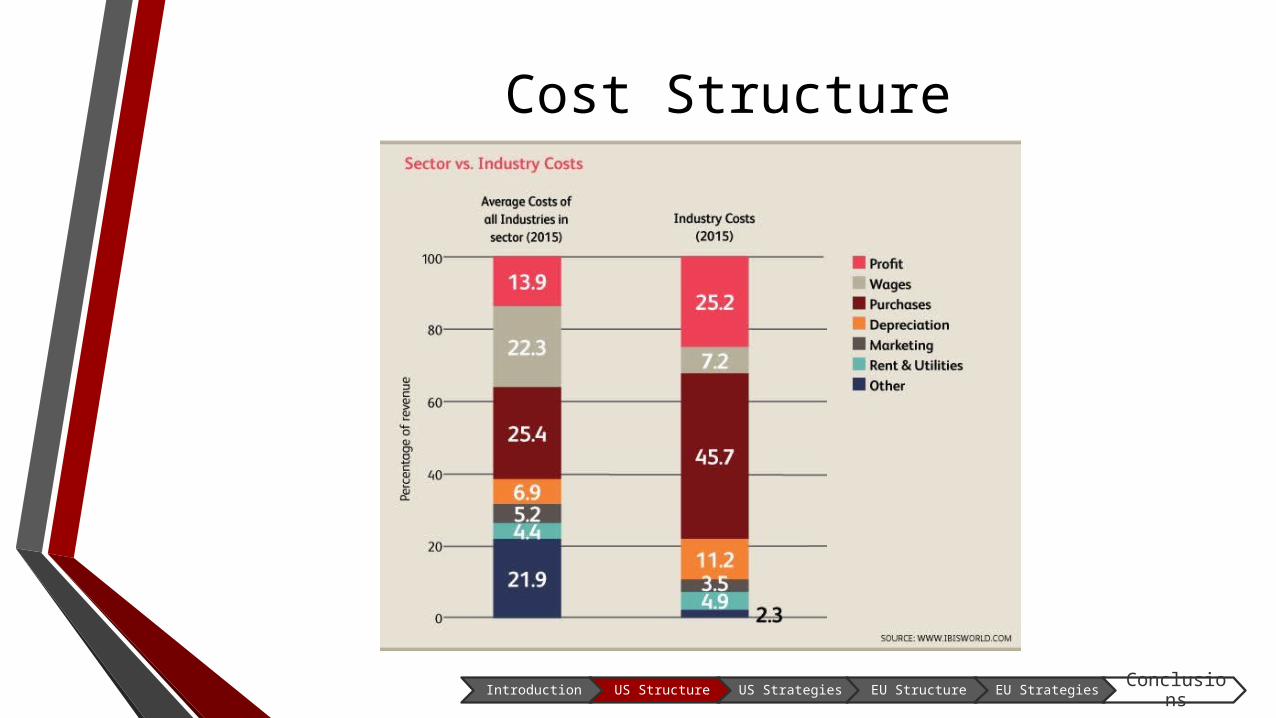
Cost Structure
Introduction US Structure US Strategies EU Structure EU StrategiesConclusion
s

Market Value
2010 2011 2012 2013 2014 (Expected) $-
$50
$100
$150
$200
$250
-2
-1
0
1
2
3
4
5
6
7
Year
USD
(in
billions)
Gro
wth
Rate
(%
)
Introduction US Structure US Strategies EU Structure EU StrategiesConclusion
s
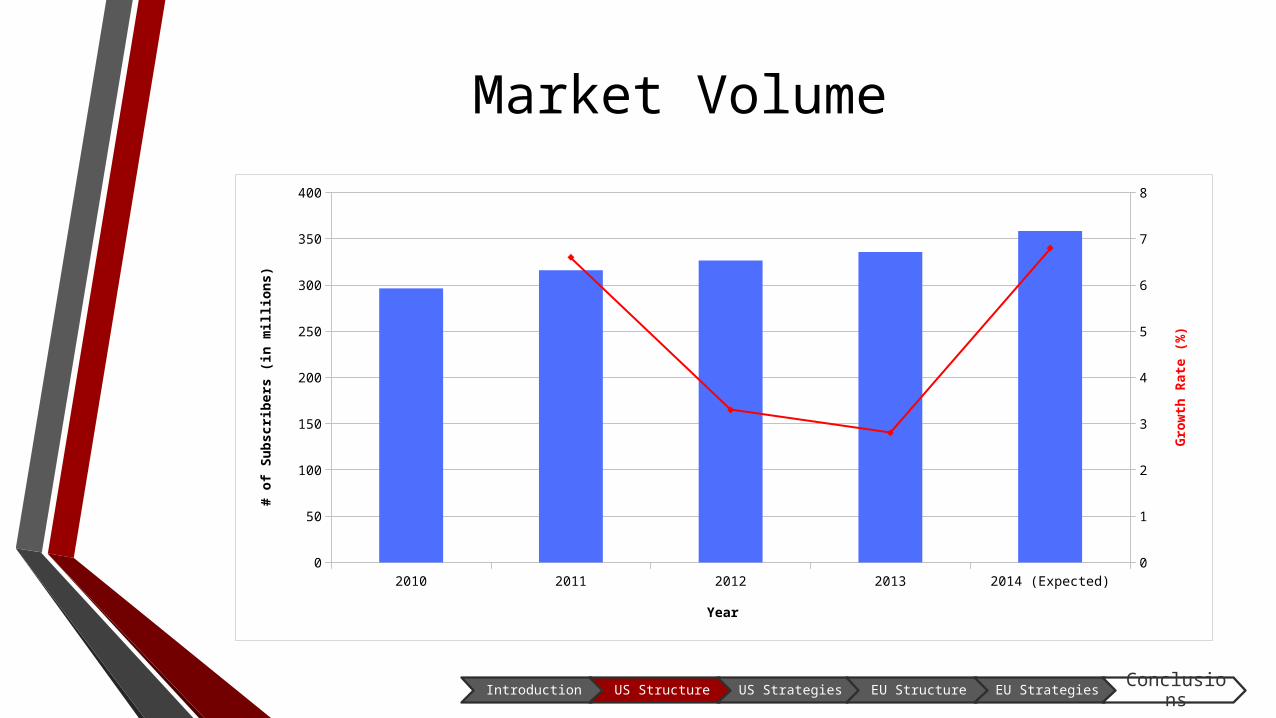
Market Volume
2010 2011 2012 2013 2014 (Expected)0
50
100
150
200
250
300
350
400
0
1
2
3
4
5
6
7
8
Year
# o
f Subscri
bers
(in
millions)
Gro
wth
Rate
(%
)
Introduction US Structure US Strategies EU Structure EU StrategiesConclusion
s
Key Players
Introduction US Structure US Strategies EU Structure EU StrategiesConclusion
s
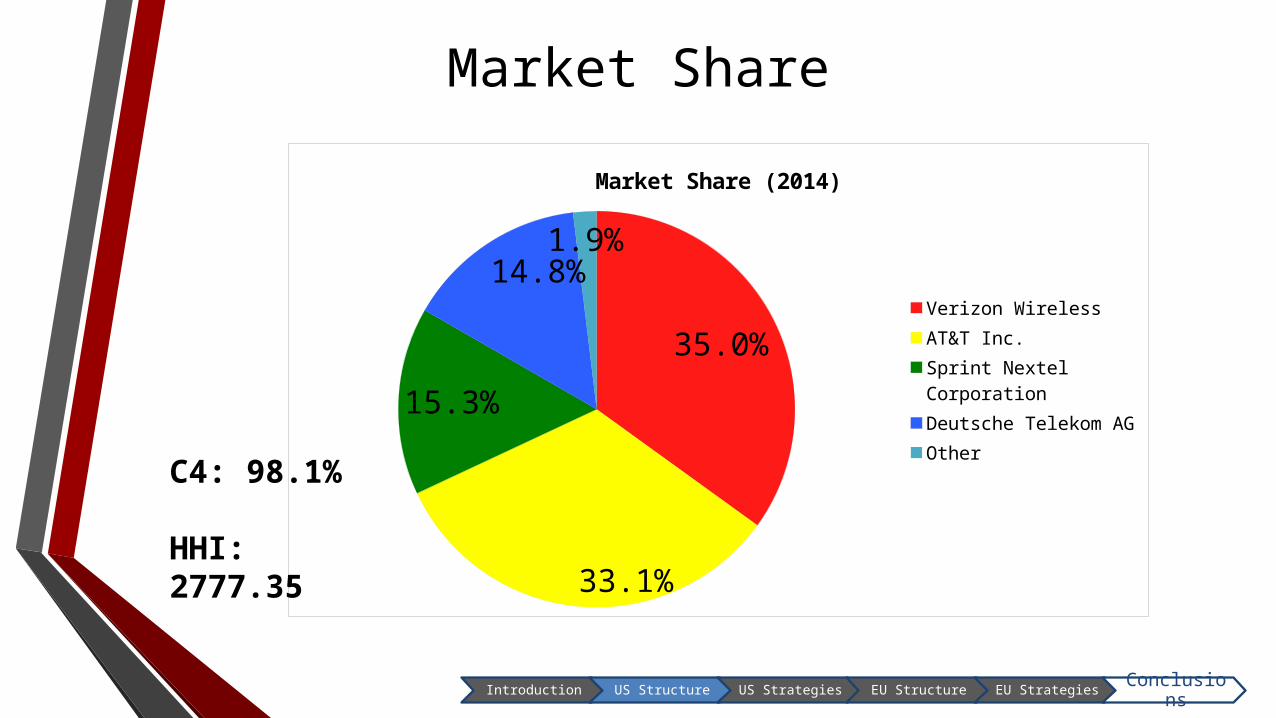
35.0%
33.1%
15.3%
14.8%1.9%
Market Share (2014)
Verizon WirelessAT&T Inc.Sprint Nextel CorporationDeutsche Telekom AGOther
Market Share
Introduction US Structure US Strategies EU Structure EU StrategiesConclusion
s
C4: 98.1%
HHI: 2777.35
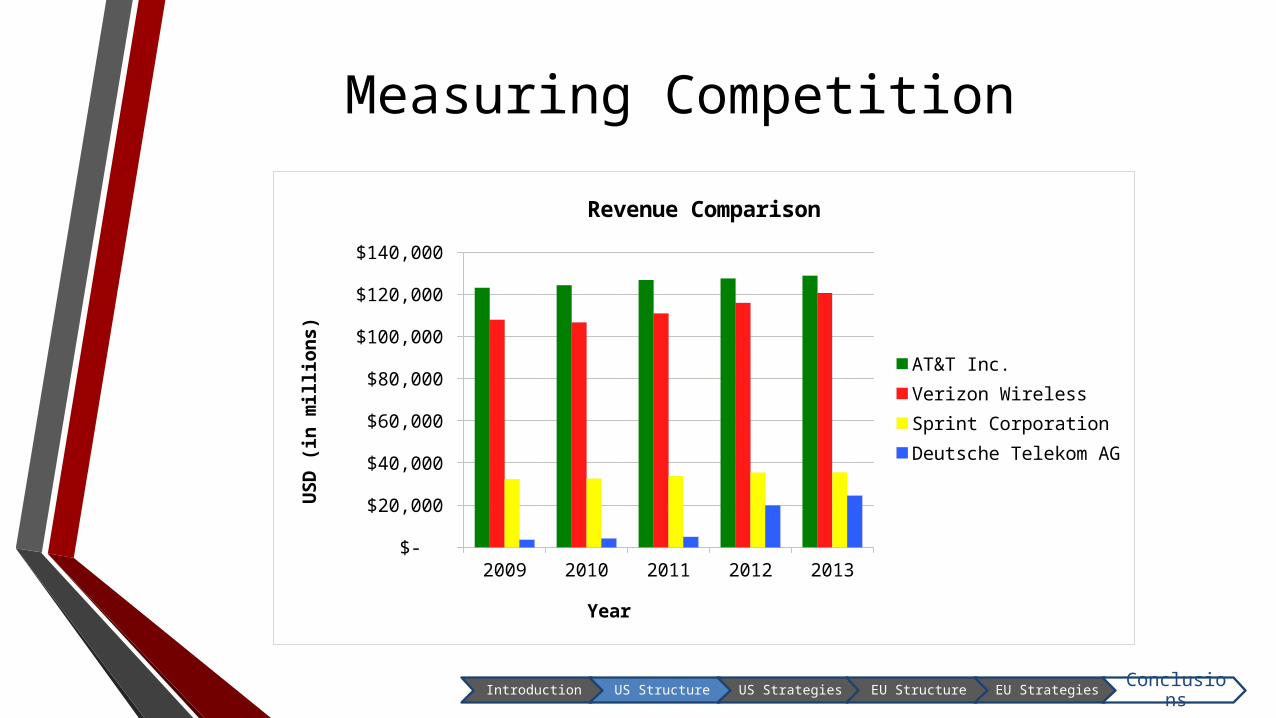
Measuring Competition
2009 2010 2011 2012 2013 $-
$20,000
$40,000
$60,000
$80,000
$100,000
$120,000
$140,000
Revenue Comparison
AT&T Inc.Verizon WirelessSprint CorporationDeutsche Telekom AG
Year
USD
(in
mill
ions
)
Introduction US Structure US Strategies EU Structure EU StrategiesConclusion
s
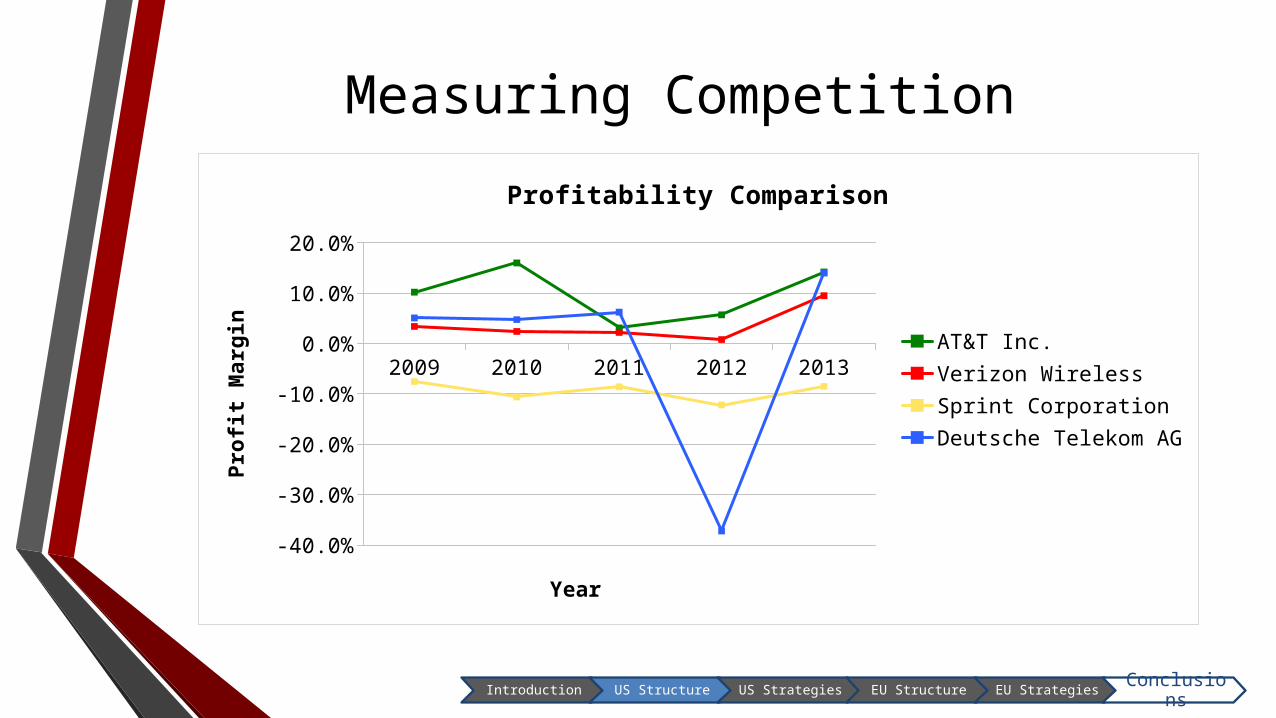
Measuring Competition
2009 2010 2011 2012 2013
-40.0%
-30.0%
-20.0%
-10.0%
0.0%
10.0%
20.0%
Profitability Comparison
AT&T Inc.Verizon WirelessSprint CorporationDeutsche Telekom AG
Year
Profi
t Mar
gin
Introduction US Structure US Strategies EU Structure EU StrategiesConclusion
s
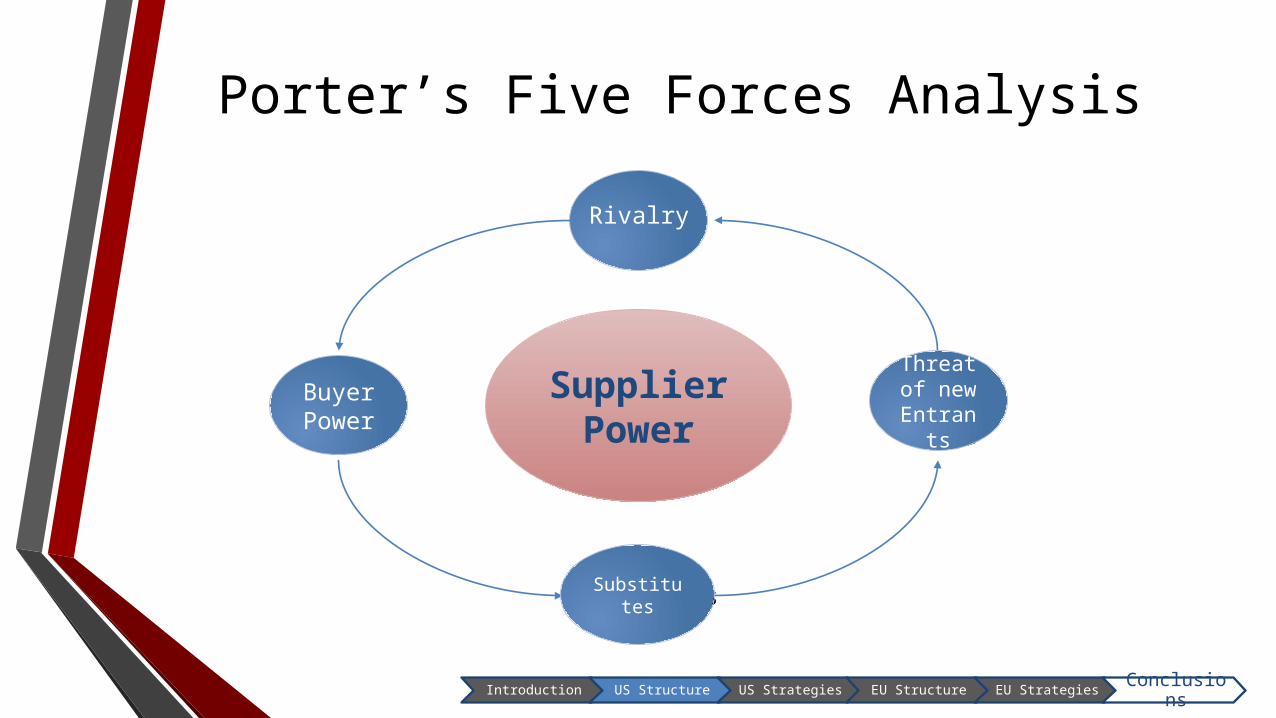
Porter’s Five Forces Analysis
Supplier Power
Rivalry
Buyer Power
Substitutes
Introduction US Structure US Strategies EU Structure EU StrategiesConclusion
s
Buyer Power
Substitutes
Threat of new Entrant
s

Porter’s Five Forces Analysis
• Threat of New Entrants
• Significant capital requirement
• MVNO – Low cost option
• Government regulation increasing barriers
• Threat of Substitutes
• Fixed-line telephony, data communication, VoIP
• Major players protected through bundling services
Introduction US Structure US Strategies EU Structure EU StrategiesConclusion
s
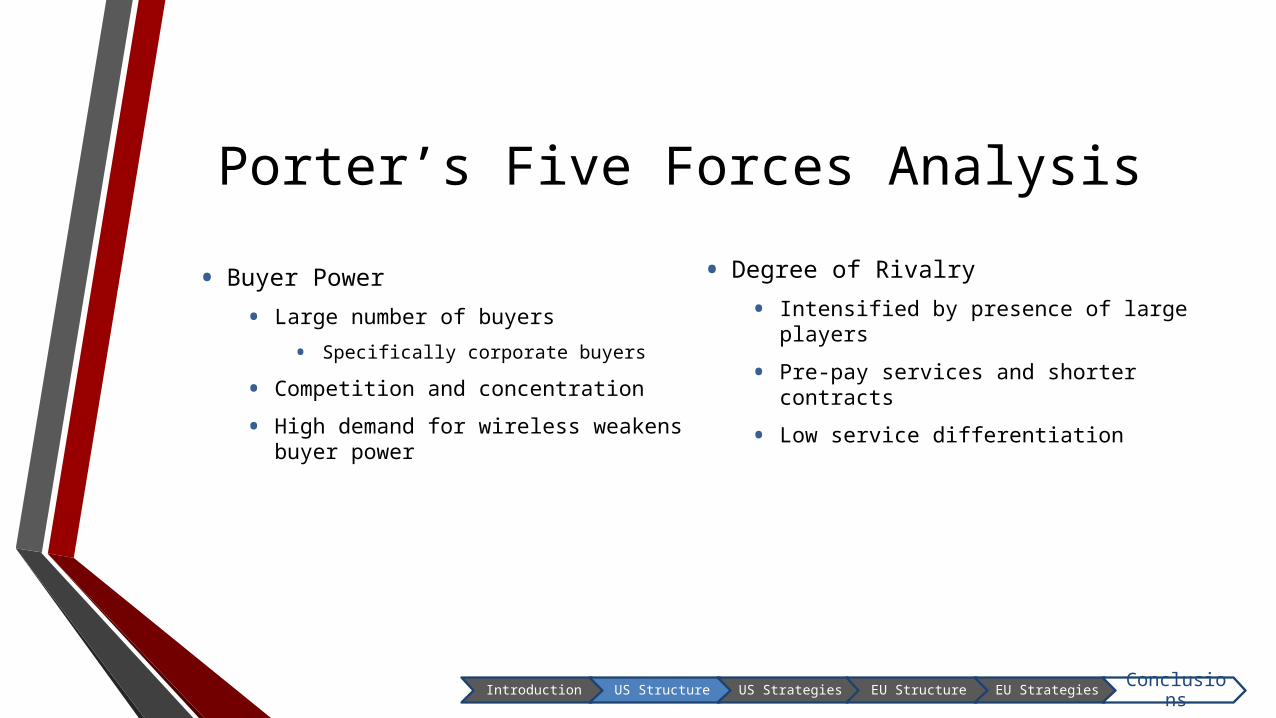
Porter’s Five Forces Analysis
• Buyer Power
• Large number of buyers
• Specifically corporate buyers
• Competition and concentration
• High demand for wireless weakens buyer power
• Degree of Rivalry
• Intensified by presence of large players
• Pre-pay services and shorter contracts
• Low service differentiation
Introduction US Structure US Strategies EU Structure EU StrategiesConclusion
s

Porter’s Five Forces Analysis
Supplier Power
Rivalry
Buyer Power
Substitutes
Introduction US Structure US Strategies EU Structure EU StrategiesConclusion
s
Buyer Power
Substitutes
Threat of new Entrant
s

US Pricing Strategies
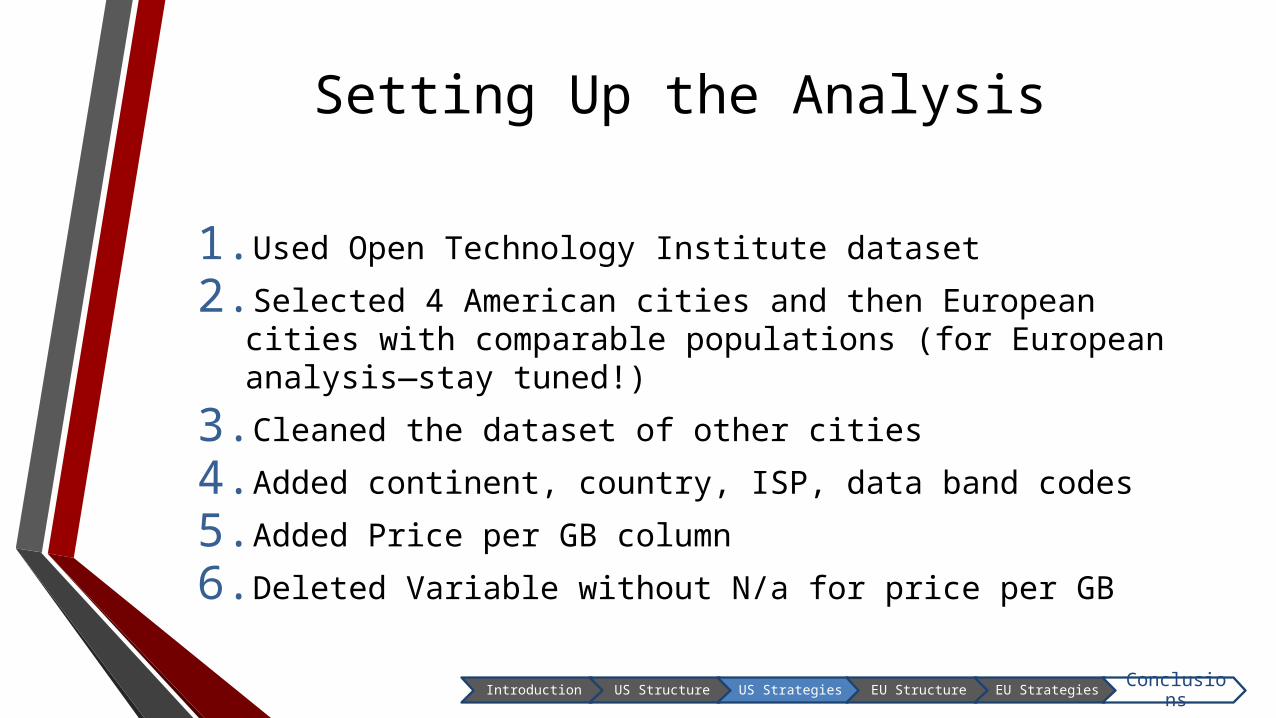
Setting Up the Analysis
1.Used Open Technology Institute dataset
2.Selected 4 American cities and then European cities with comparable populations (for European analysis—stay tuned!)
3.Cleaned the dataset of other cities
4.Added continent, country, ISP, data band codes
5.Added Price per GB column
6.Deleted Variable without N/a for price per GB
Introduction US Structure US Strategies EU Structure EU StrategiesConclusion
s
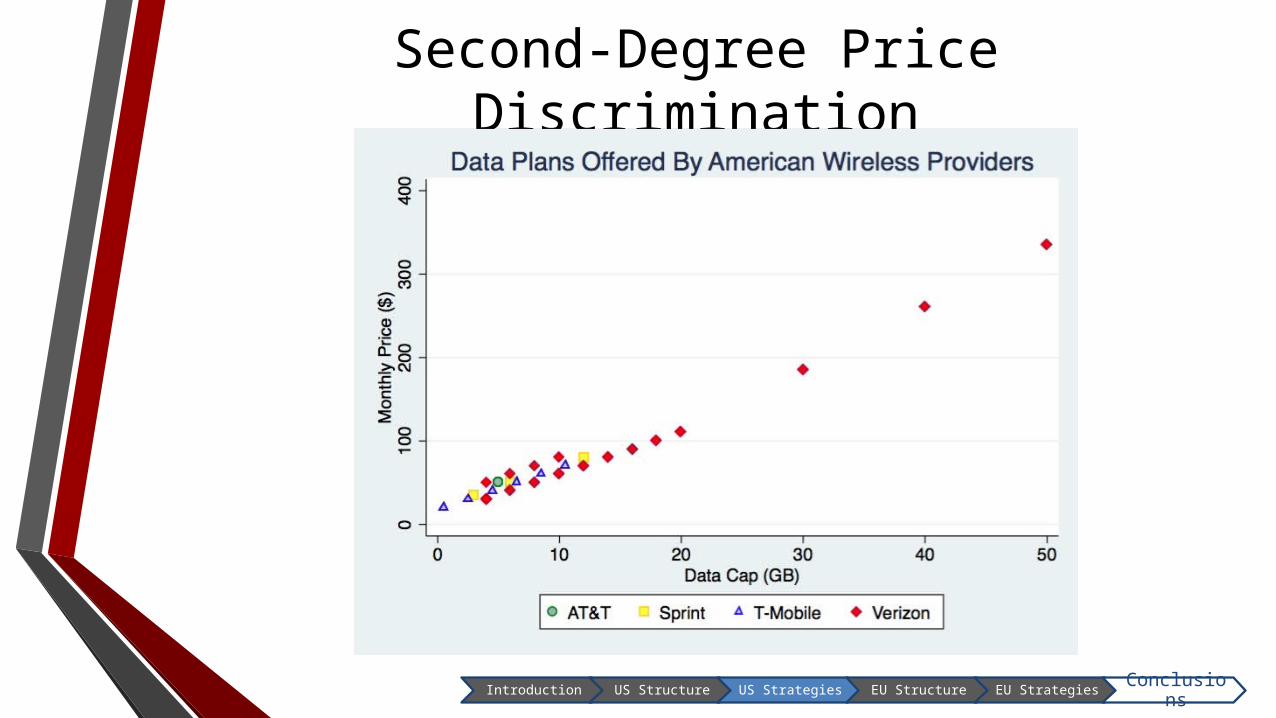
Second-Degree Price Discrimination
Introduction US Structure US Strategies EU Structure EU StrategiesConclusion
s
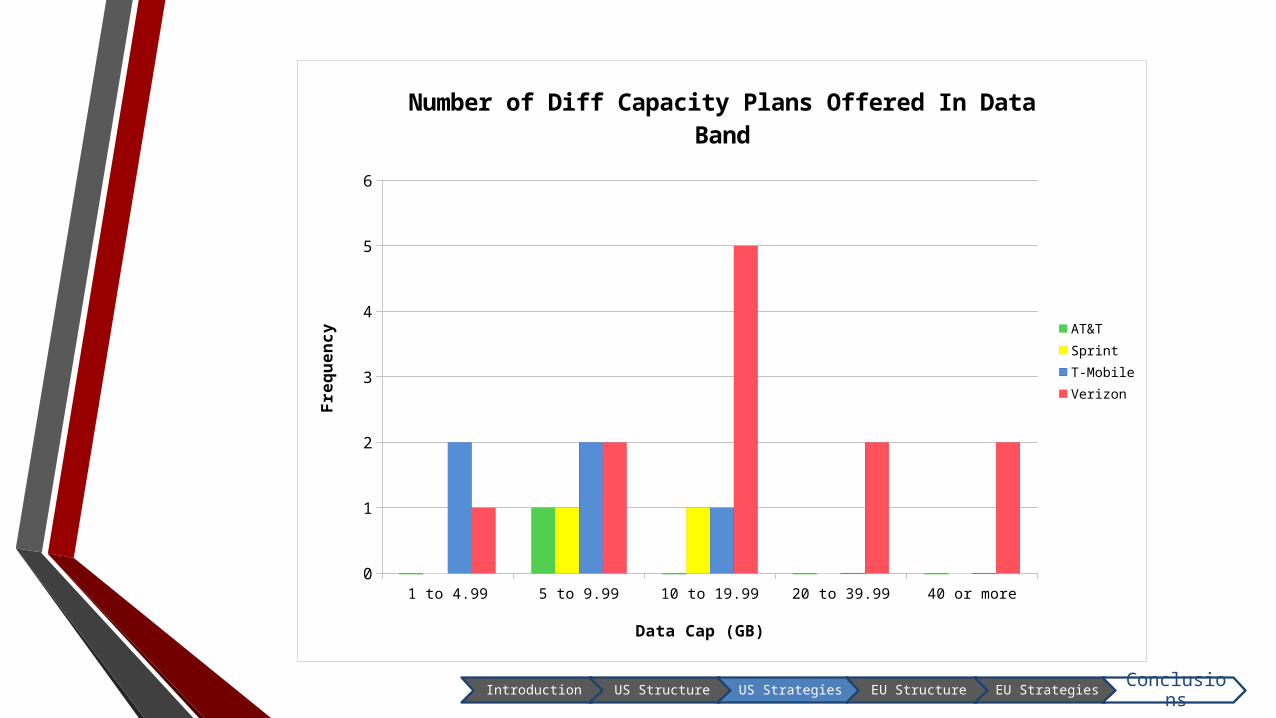
1 to 4.99 5 to 9.99 10 to 19.99 20 to 39.99 40 or more0
1
2
3
4
5
6
Number of Diff Capacity Plans Offered In Data Band
AT&TSprintT-MobileVerizon
Data Cap (GB)
Freq
uenc
y
Introduction US Structure US Strategies EU Structure EU StrategiesConclusion
s
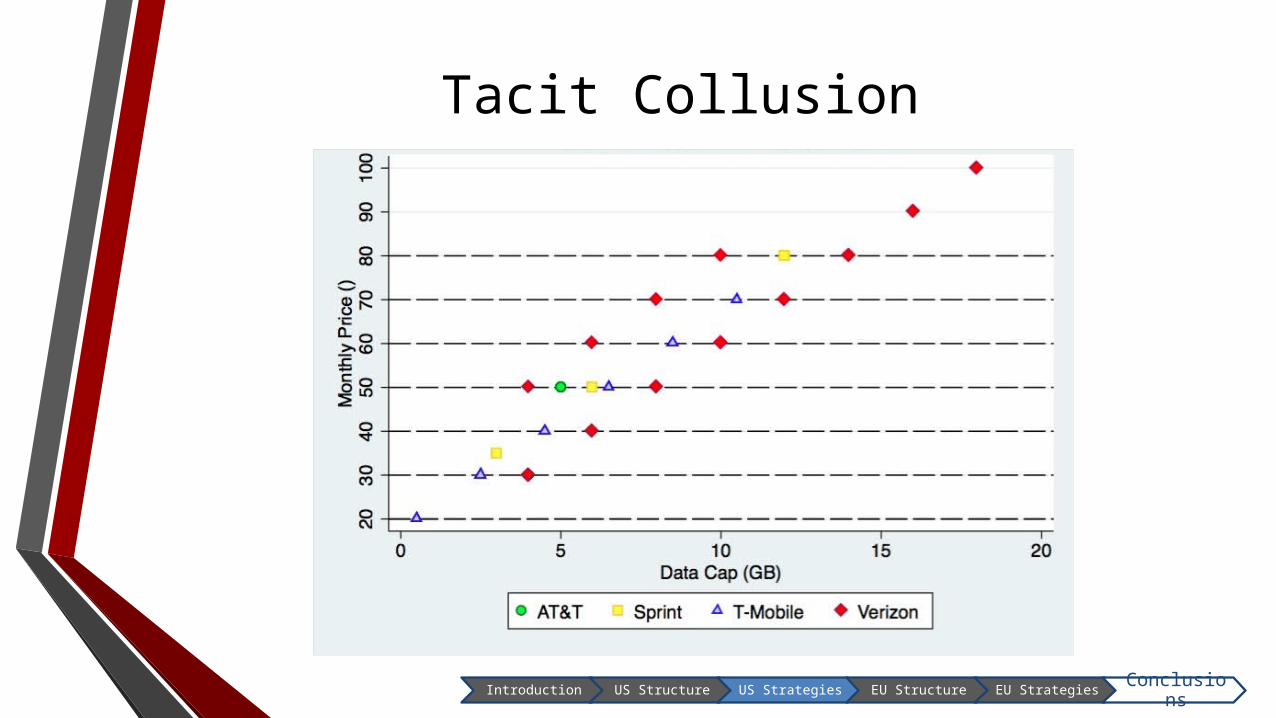
Tacit Collusion
Introduction US Structure US Strategies EU Structure EU StrategiesConclusion
s
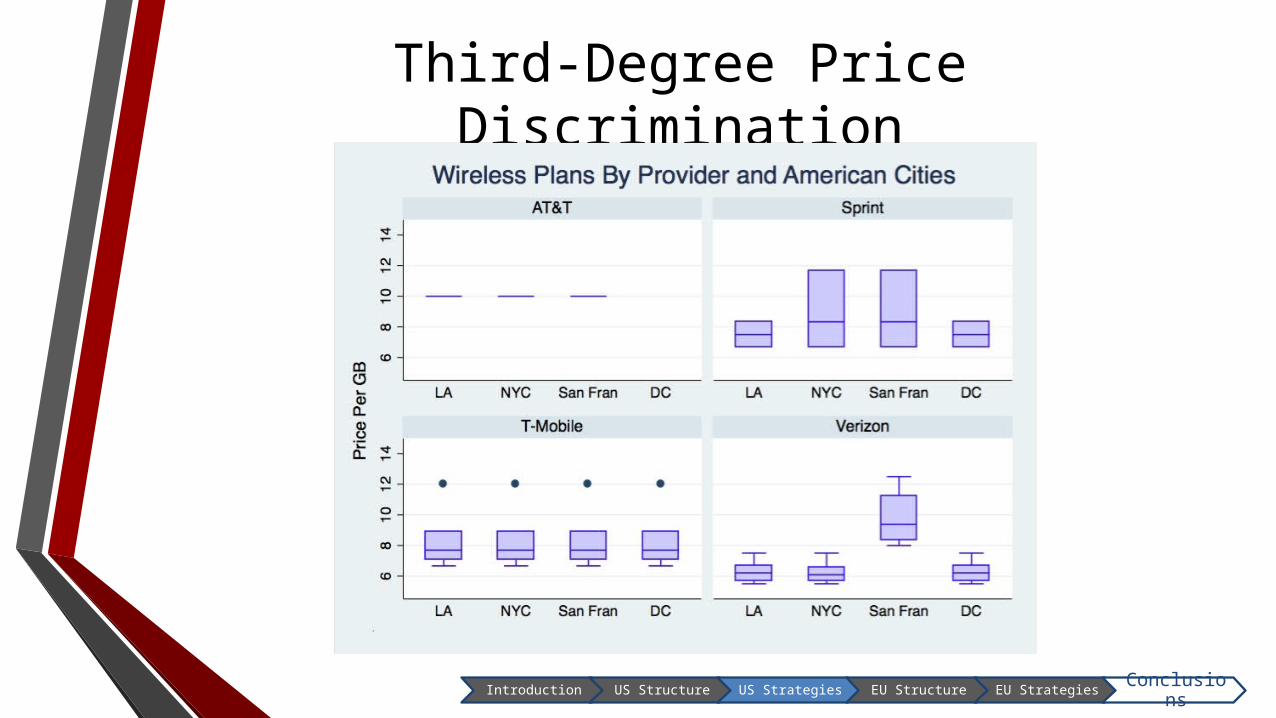
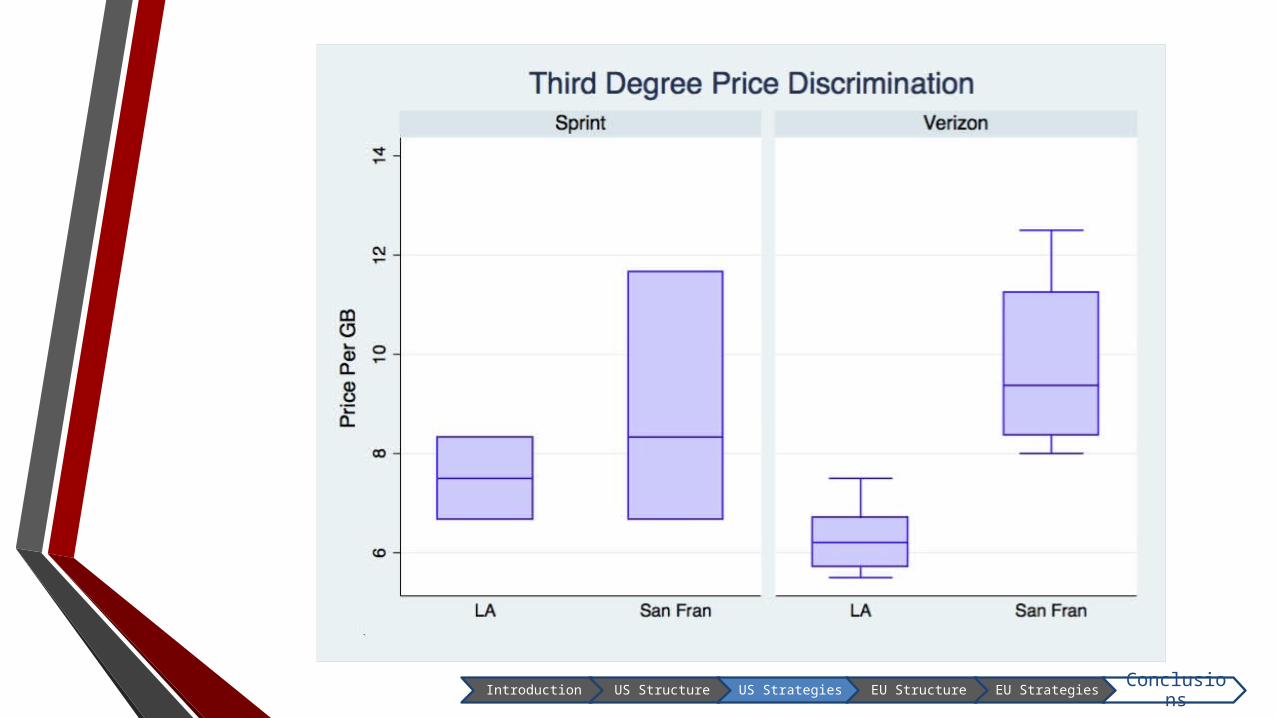
Third-Degree Price Discrimination
Introduction US Structure US Strategies EU Structure EU StrategiesConclusion
s
Introduction US Structure US Strategies EU Structure EU StrategiesConclusion
s
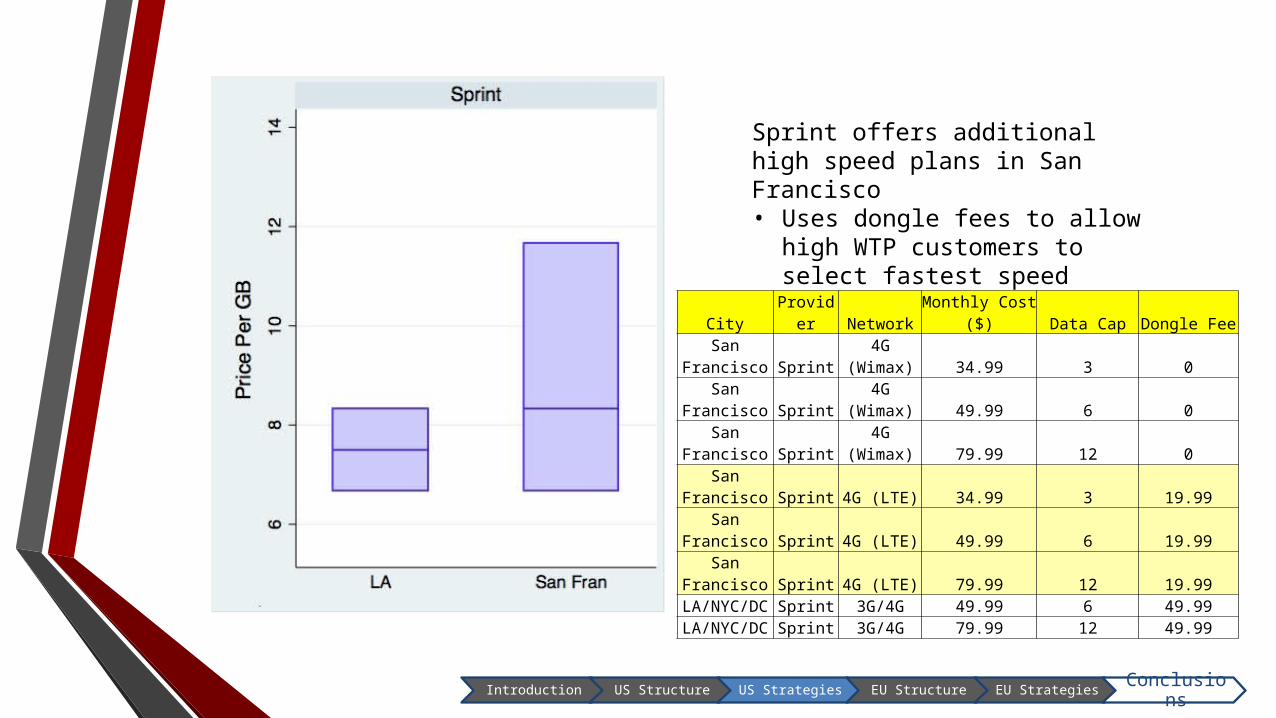
City Provider Network Monthly Cost ($) Data Cap Dongle FeeSan Francisco Sprint 4G (Wimax) 34.99 3 0San Francisco Sprint 4G (Wimax) 49.99 6 0San Francisco Sprint 4G (Wimax) 79.99 12 0San Francisco Sprint 4G (LTE) 34.99 3 19.99San Francisco Sprint 4G (LTE) 49.99 6 19.99San Francisco Sprint 4G (LTE) 79.99 12 19.99
LA/NYC/DC Sprint 3G/4G 49.99 6 49.99LA/NYC/DC Sprint 3G/4G 79.99 12 49.99
Sprint offers additional high speed plans in San Francisco• Uses dongle fees to allow high
WTP customers to select fastest speed
Introduction US Structure US Strategies EU Structure EU StrategiesConclusion
s
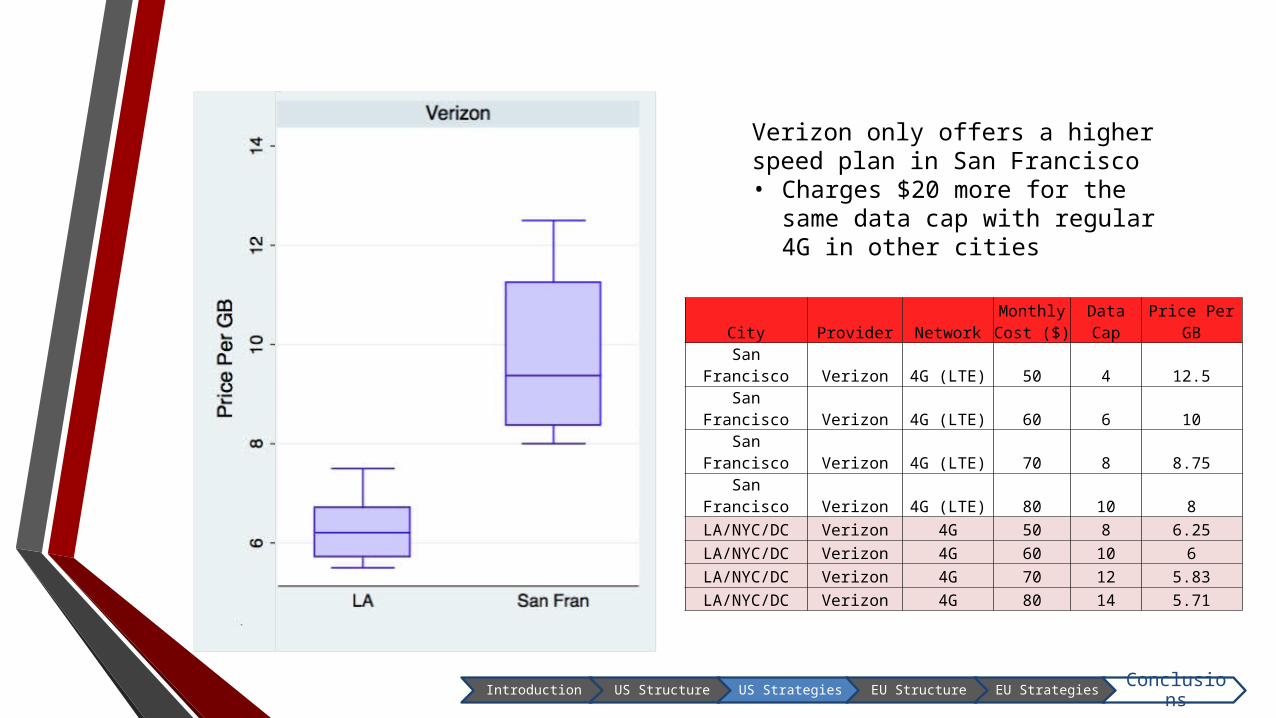
City Provider NetworkMonthly Cost ($) Data Cap Price Per GB
San Francisco Verizon 4G (LTE) 50 4 12.5San Francisco Verizon 4G (LTE) 60 6 10San Francisco Verizon 4G (LTE) 70 8 8.75San Francisco Verizon 4G (LTE) 80 10 8
LA/NYC/DC Verizon 4G 50 8 6.25LA/NYC/DC Verizon 4G 60 10 6LA/NYC/DC Verizon 4G 70 12 5.83LA/NYC/DC Verizon 4G 80 14 5.71
Verizon only offers a higher speed plan in San Francisco• Charges $20 more for the
same data cap with regular 4G in other cities
Introduction US Structure US Strategies EU Structure EU StrategiesConclusion
s
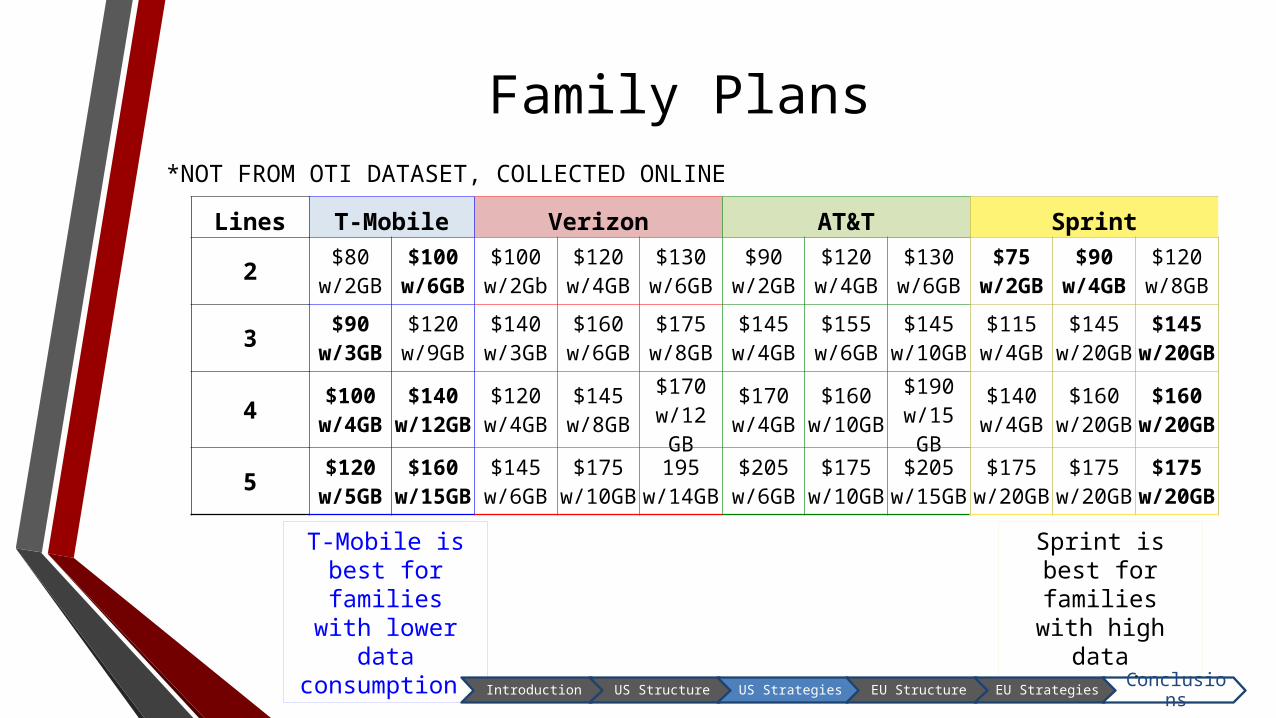
Family Plans
T-Mobile is best for
families with lower data
consumption
Sprint is best for families
with high data consumption
Introduction US Structure US Strategies EU Structure EU StrategiesConclusion
s
Lines T-Mobile Verizon AT&T Sprint
2 $80 w/2GB
$100 w/6GB
$100 w/2Gb
$120 w/4GB
$130 w/6GB
$90 w/2GB
$120 w/4GB
$130 w/6GB
$75 w/2GB
$90 w/4GB
$120 w/8GB
3 $90 w/3GB
$120 w/9GB
$140 w/3GB
$160 w/6GB
$175 w/8GB
$145 w/4GB
$155 w/6GB
$145 w/10GB
$115 w/4GB
$145 w/20GB
$145 w/20GB
4 $100 w/4GB
$140 w/12GB
$120 w/4GB
$145 w/8GB
$170 w/12 GB
$170 w/4GB
$160 w/10GB
$190 w/15 GB
$140 w/4GB
$160 w/20GB
$160 w/20GB
5 $120 w/5GB
$160 w/15GB
$145 w/6GB
$175 w/10GB
195 w/14GB
$205 w/6GB
$175 w/10GB
$205 w/15GB
$175 w/20GB
$175 w/20GB
$175 w/20GB
*NOT FROM OTI DATASET, COLLECTED ONLINE
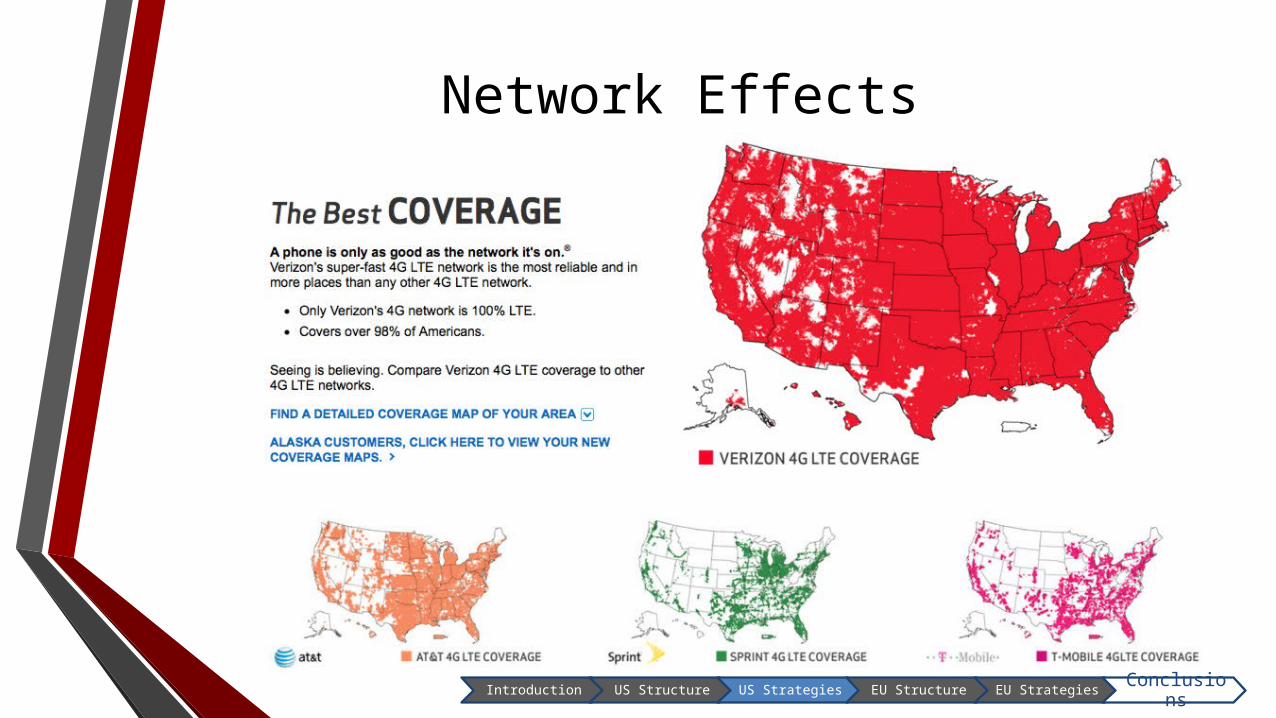
Network Effects
Introduction US Structure US Strategies EU Structure EU StrategiesConclusion
s
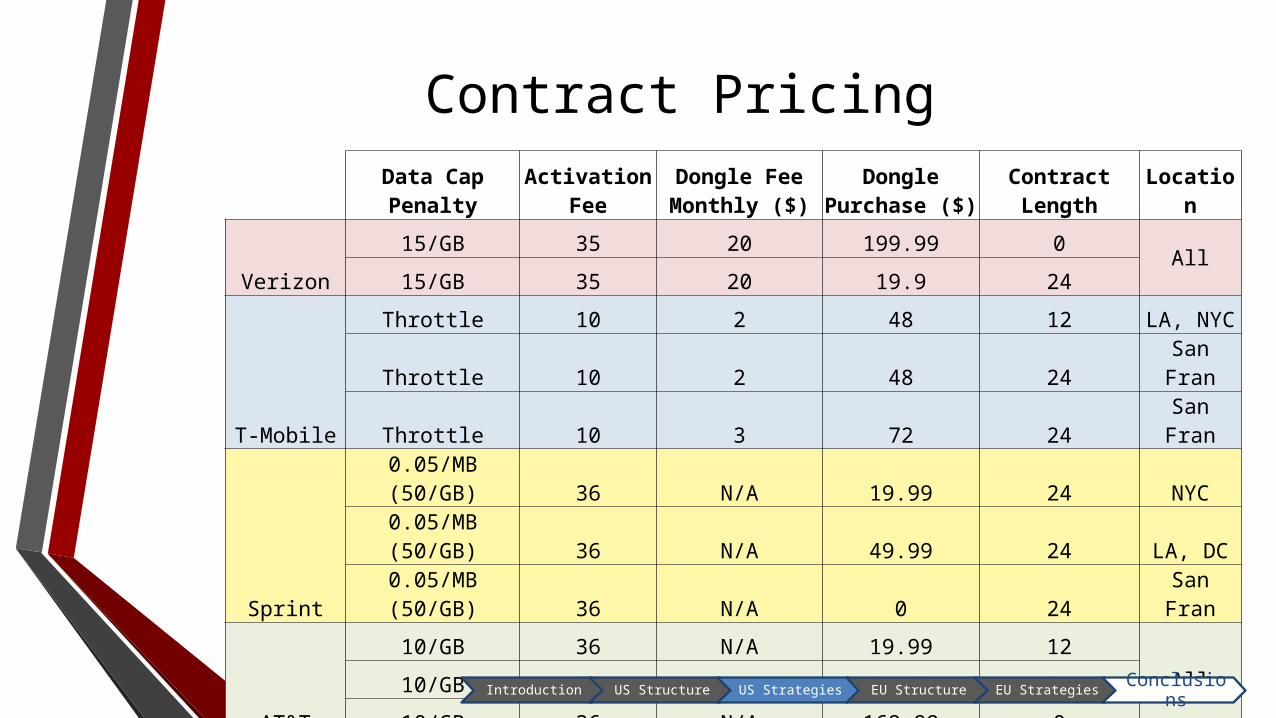
Data CapPenalty
Activation Fee
Dongle Fee Monthly ($)
Dongle Purchase ($)
Contract Length
Location
Verizon
15/GB 35 20 199.99 0 All15/GB 35 20 19.9 24
T-Mobile
Throttle 10 2 48 12 LA, NYC
Throttle 10 2 48 24 San Fran
Throttle 10 3 72 24 San Fran
Sprint
0.05/MB (50/GB) 36 N/A 19.99 24 NYC0.05/MB (50/GB) 36 N/A 49.99 24 LA, DC0.05/MB (50/GB) 36 N/A 0 24 San Fran
AT&T
10/GB 36 N/A 19.99 12
All10/GB 36 N/A 94.99 24
10/GB 36 N/A 169.99 0
Contract Pricing
Introduction US Structure US Strategies EU Structure EU StrategiesConclusion
s
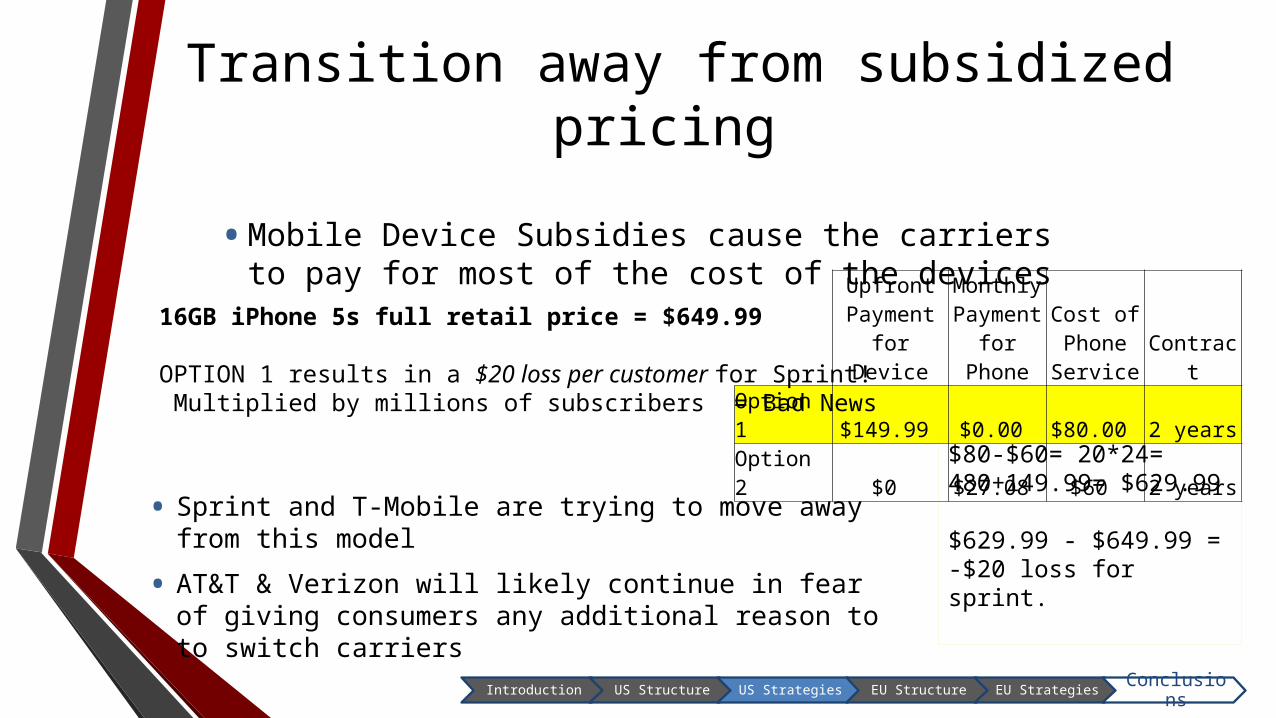
Transition away from subsidized pricing
• Mobile Device Subsidies cause the carriers to pay for most of the cost of the devices Upfront
Payment for Device
Monthly Payment for Phone
Cost of Phone Service Contract
Option 1 $149.99 $0.00 $80.00 2 yearsOption 2 $0 $27.08 $60 2 years
16GB iPhone 5s full retail price = $649.99
OPTION 1 results in a $20 loss per customer for Sprint! Multiplied by millions of subscribers = Bad News
$80-$60= 20*24= 480+149.99= $629.99
$629.99 - $649.99 = -$20 loss for sprint.
• Sprint and T-Mobile are trying to move away from this model
• AT&T & Verizon will likely continue in fear of giving consumers any additional reason to to switch carriers
Introduction US Structure US Strategies EU Structure EU StrategiesConclusion
s

Confusion Pricing
Providers offer different data capacities so that there is no direct comparison
Introduction US Structure US Strategies EU Structure EU StrategiesConclusion
s
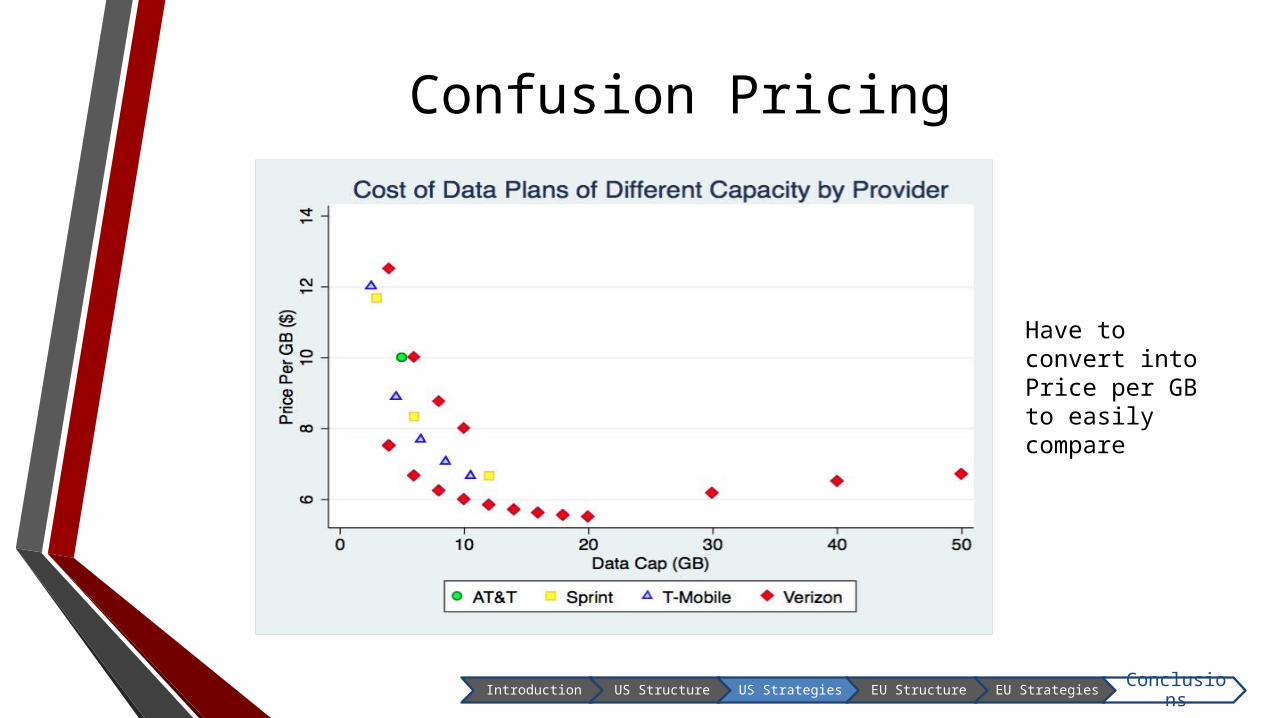
Have to convert into Price per GB to easily compare
Confusion Pricing
Introduction US Structure US Strategies EU Structure EU StrategiesConclusion
s
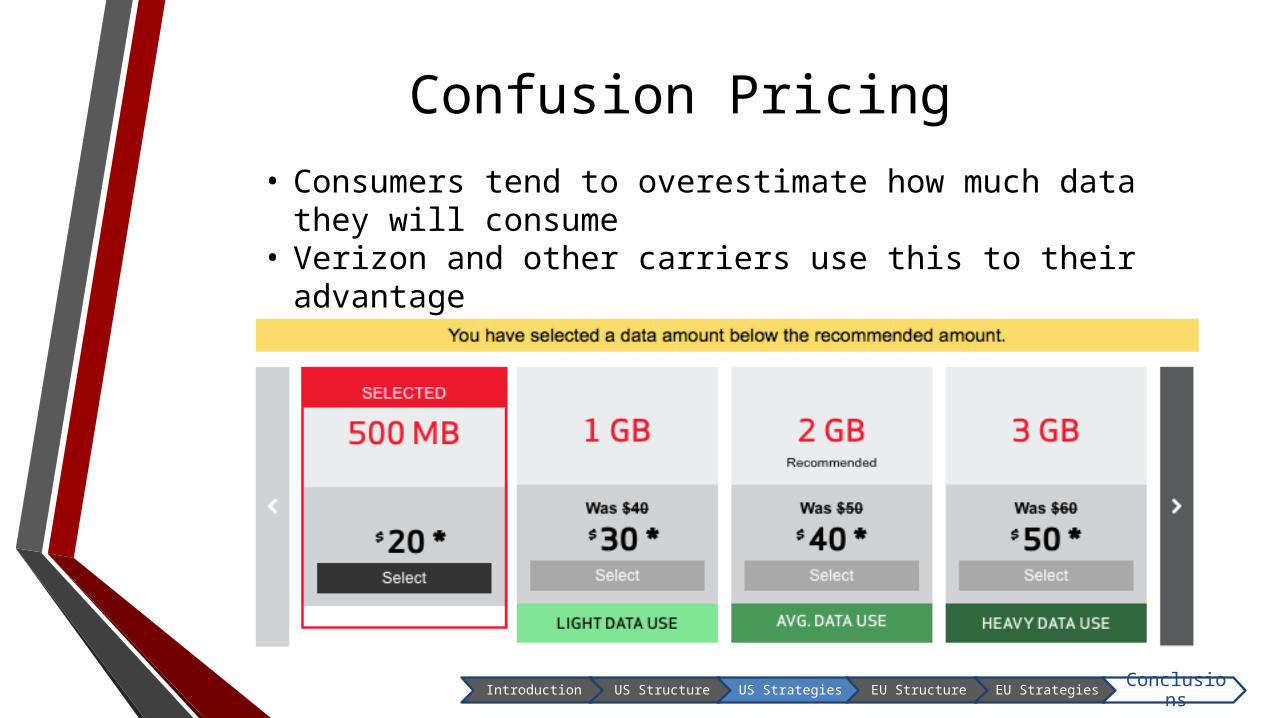
Confusion Pricing• Consumers tend to overestimate how much data
they will consume• Verizon and other carriers use this to their advantage
Introduction US Structure US Strategies EU Structure EU StrategiesConclusion
s
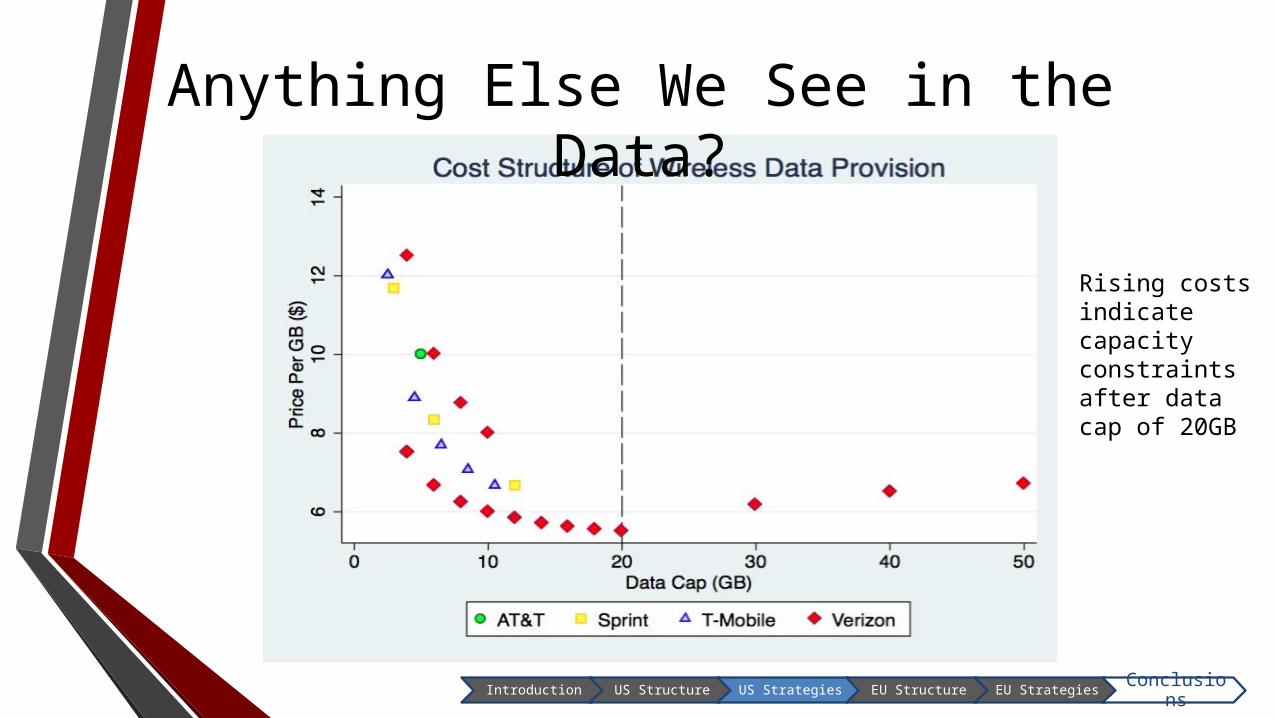
Anything Else We See in the Data?
Rising costs indicate capacity constraints after data cap of 20GB
Introduction US Structure US Strategies EU Structure EU StrategiesConclusion
s
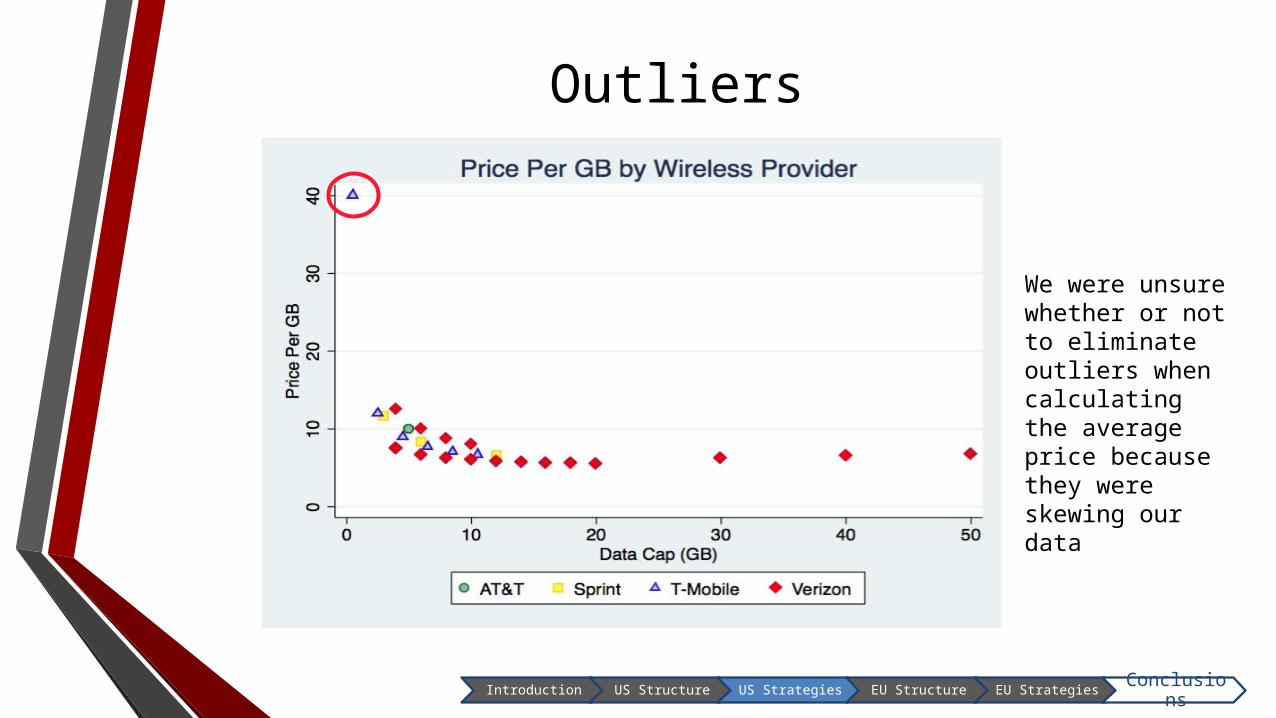
Outliers
We were unsure whether or not to eliminate outliers when calculating the average price because they were skewing our data
Introduction US Structure US Strategies EU Structure EU StrategiesConclusion
s

OutliersWe kept the data point because it was accurate and corresponded to the other price trends.The extremely high price per GB on the previous slide is due to the low data cap and fixed costs being evenly spread across plansInstead we created bands of data caps
Introduction US Structure US Strategies EU Structure EU StrategiesConclusion
s

European Industry Structure
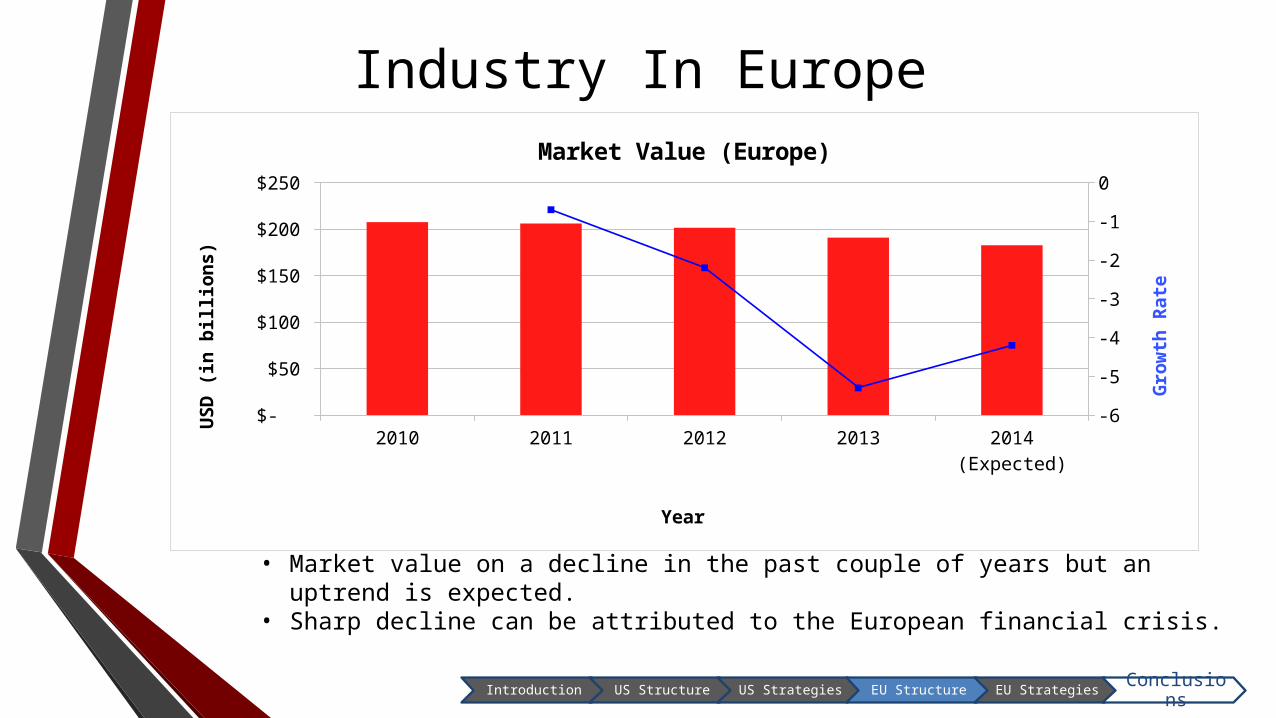
Industry In Europe
2010 2011 2012 2013 2014 (Expected) $-
$50
$100
$150
$200
$250
-6
-5
-4
-3
-2
-1
0
Market Value (Europe)
Year
US
D (
in b
illi
on
s)
Gro
wth
Ra
te
• Market value on a decline in the past couple of years but an uptrend is expected.
• Sharp decline can be attributed to the European financial crisis.
Introduction US Structure US Strategies EU Structure EU StrategiesConclusion
s
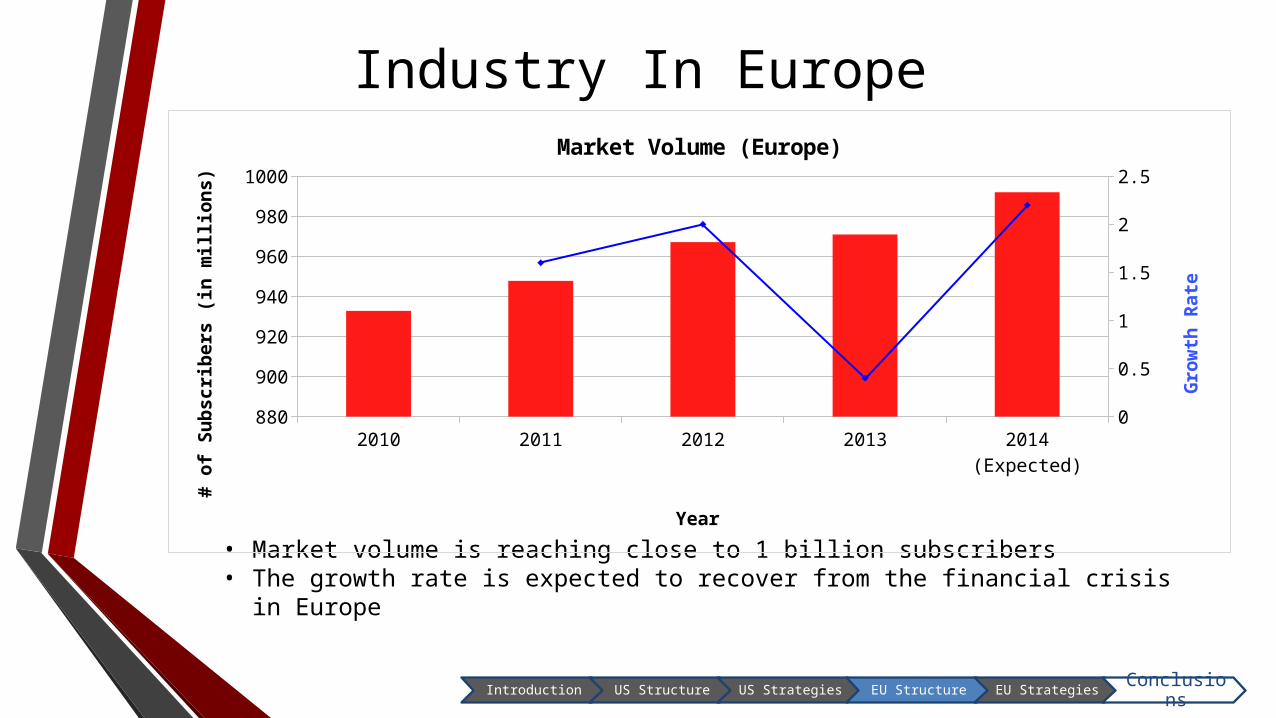
Industry In Europe
• Market volume is reaching close to 1 billion subscribers• The growth rate is expected to recover from the financial crisis in Europe
2010 2011 2012 2013 2014 (Expected)880
900
920
940
960
980
1000
0
0.5
1
1.5
2
2.5
Market Volume (Europe)
Year
# o
f S
ub
scri
be
rs (
in m
illi
on
s)
Gro
wth
Ra
te
Introduction US Structure US Strategies EU Structure EU StrategiesConclusion
s

INDUSTRY IN EUROPE
• Germany, United Kingdom, and Italy are the top three consumers of wireless telecommunication services
18.0%
13.7%
11.2%
9.6%5.1%
42.3%
Geographic Segmentation (2014)
GermanyUnited KingdomItalyFranceSpainRest of Europe
Introduction US Structure US Strategies EU Structure EU StrategiesConclusion
s
Major Players in Europe
Introduction US Structure US Strategies EU Structure EU StrategiesConclusion
s
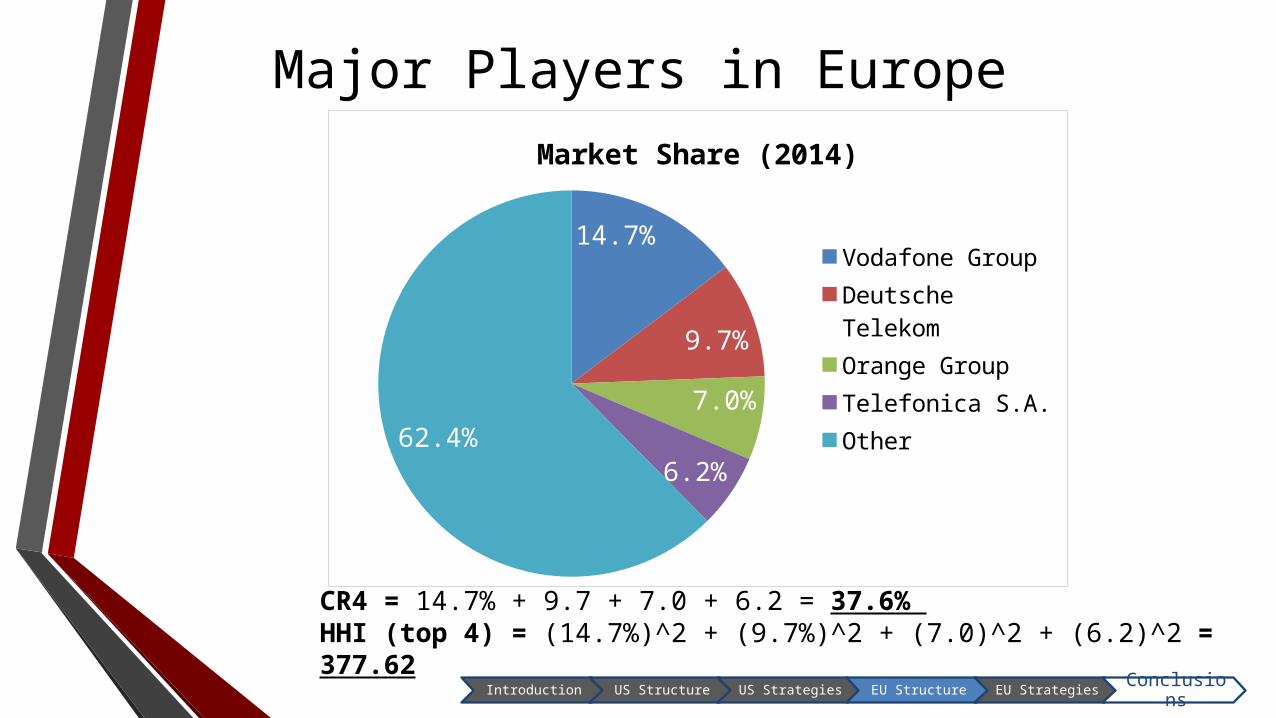
Major Players in Europe
CR4 = 14.7% + 9.7 + 7.0 + 6.2 = 37.6% HHI (top 4) = (14.7%)^2 + (9.7%)^2 + (7.0)^2 + (6.2)^2 = 377.62
14.7%
9.7%
7.0%
6.2%62.4%
Market Share (2014)
Vodafone GroupDeutsche TelekomOrange GroupTelefonica S.A.Other
Introduction US Structure US Strategies EU Structure EU StrategiesConclusion
s
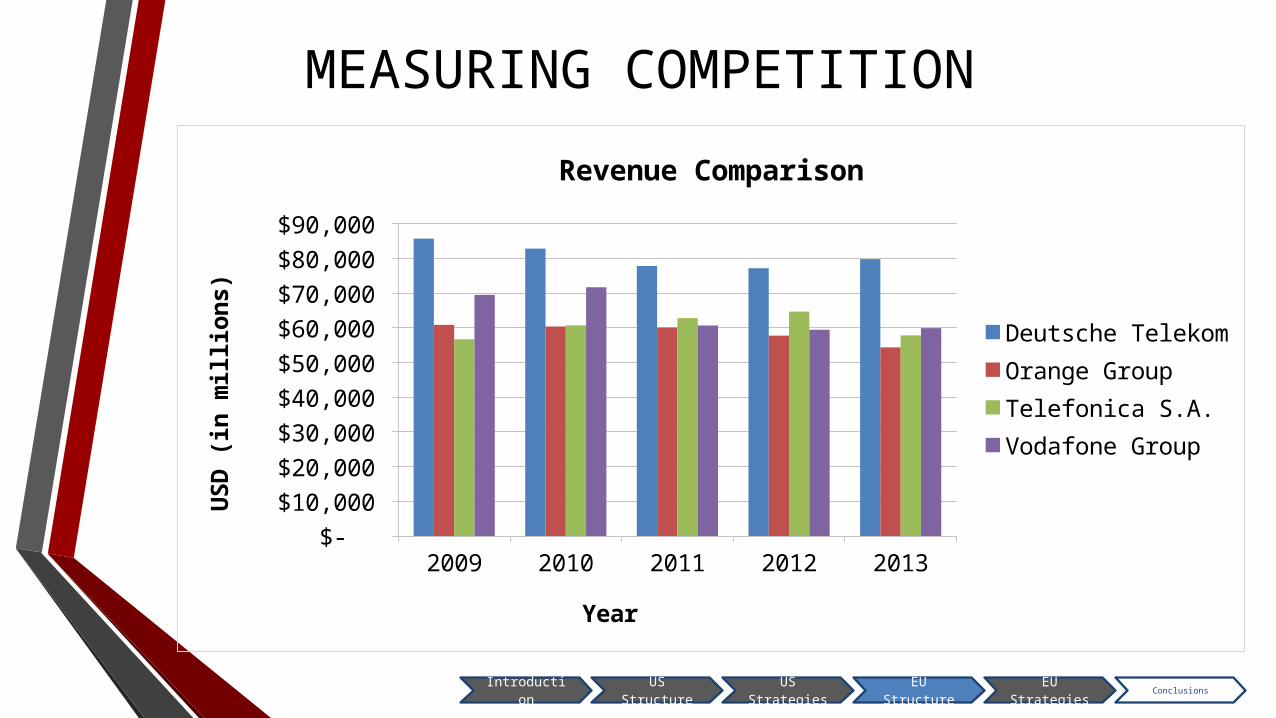
MEASURING COMPETITION
2009 2010 2011 2012 2013 $-
$10,000
$20,000
$30,000
$40,000
$50,000
$60,000
$70,000
$80,000
$90,000
Revenue Comparison
Deutsche TelekomOrange GroupTelefonica S.A.Vodafone Group
Year
US
D (
in m
illion
s)
Introduction US Structure US Strategies
EU Structure EU Strategies
Conclusions
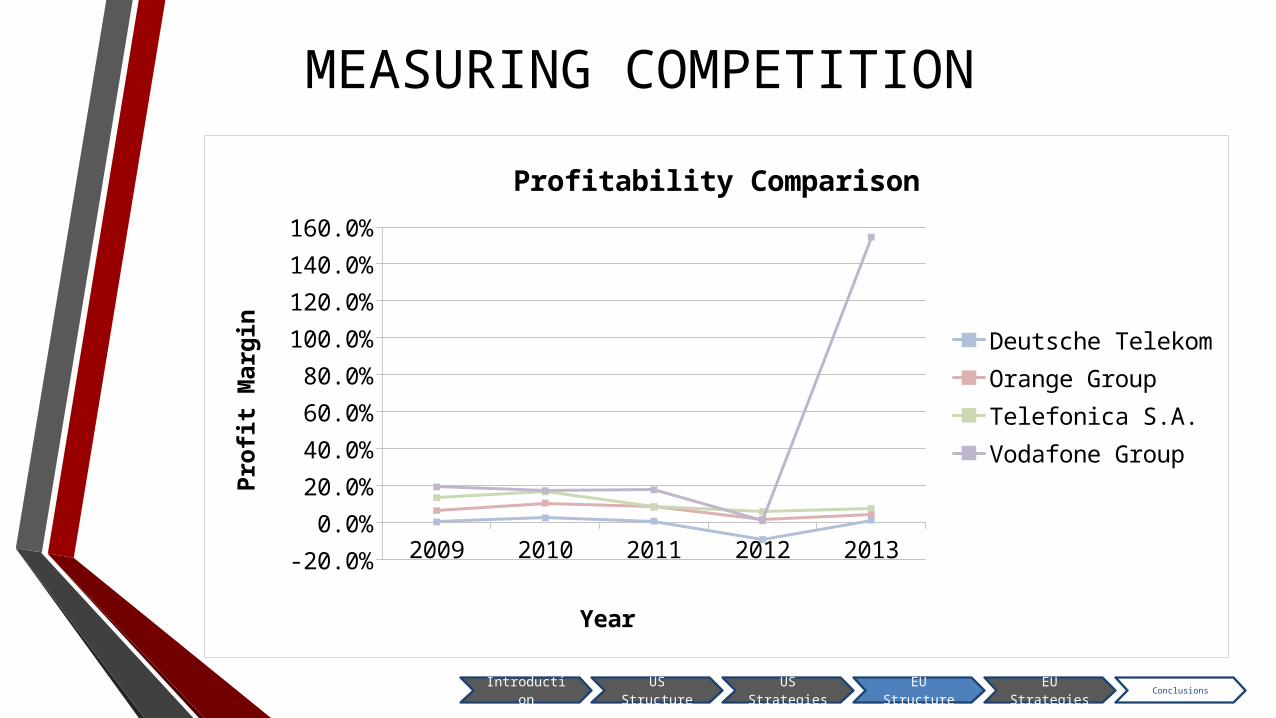
MEASURING COMPETITION
2009 2010 2011 2012 2013-20.0%
0.0%
20.0%
40.0%
60.0%
80.0%
100.0%
120.0%
140.0%
160.0%
Profitability Comparison
Deutsche TelekomOrange GroupTelefonica S.A.Vodafone Group
Year
Pro
fit
Marg
in
Introduction US Structure US Strategies
EU Structure EU Strategies
Conclusions
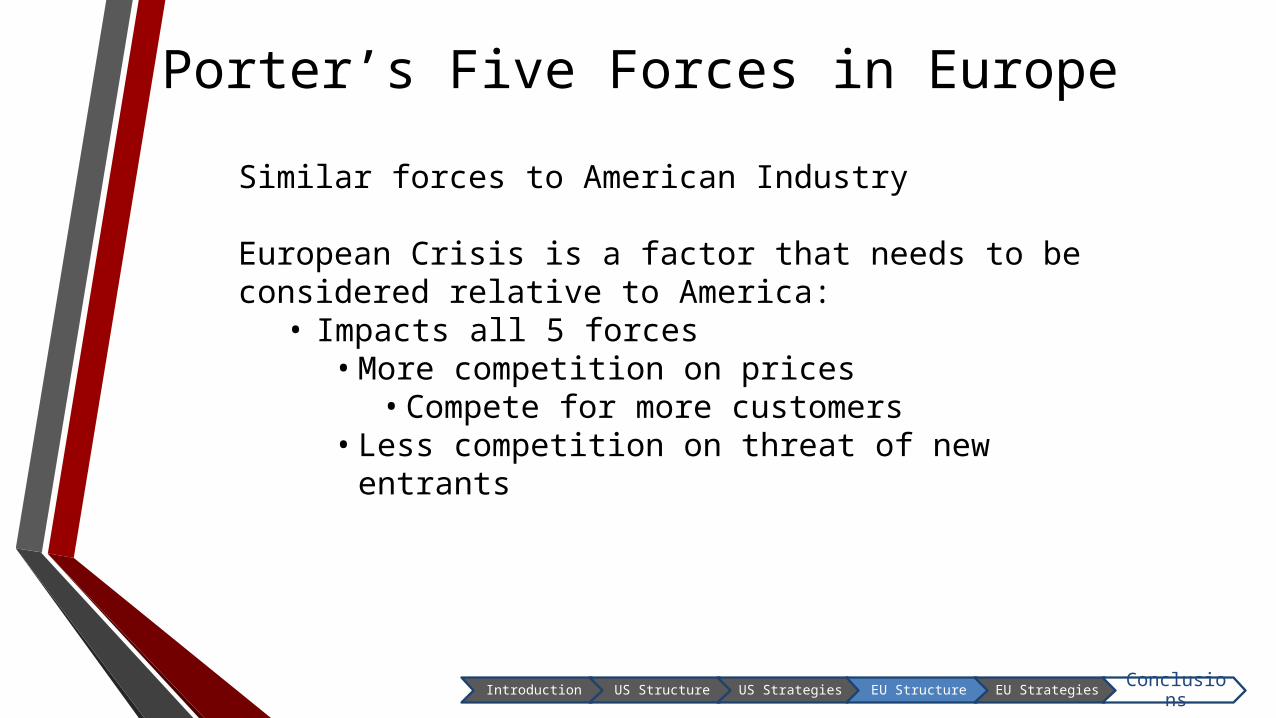
Porter’s Five Forces in Europe
Similar forces to American Industry
European Crisis is a factor that needs to be considered relative to America:• Impacts all 5 forces• More competition on prices• Compete for more customers
• Less competition on threat of new entrants
Introduction US Structure US Strategies EU Structure EU StrategiesConclusion
s

European Pricing Strategies
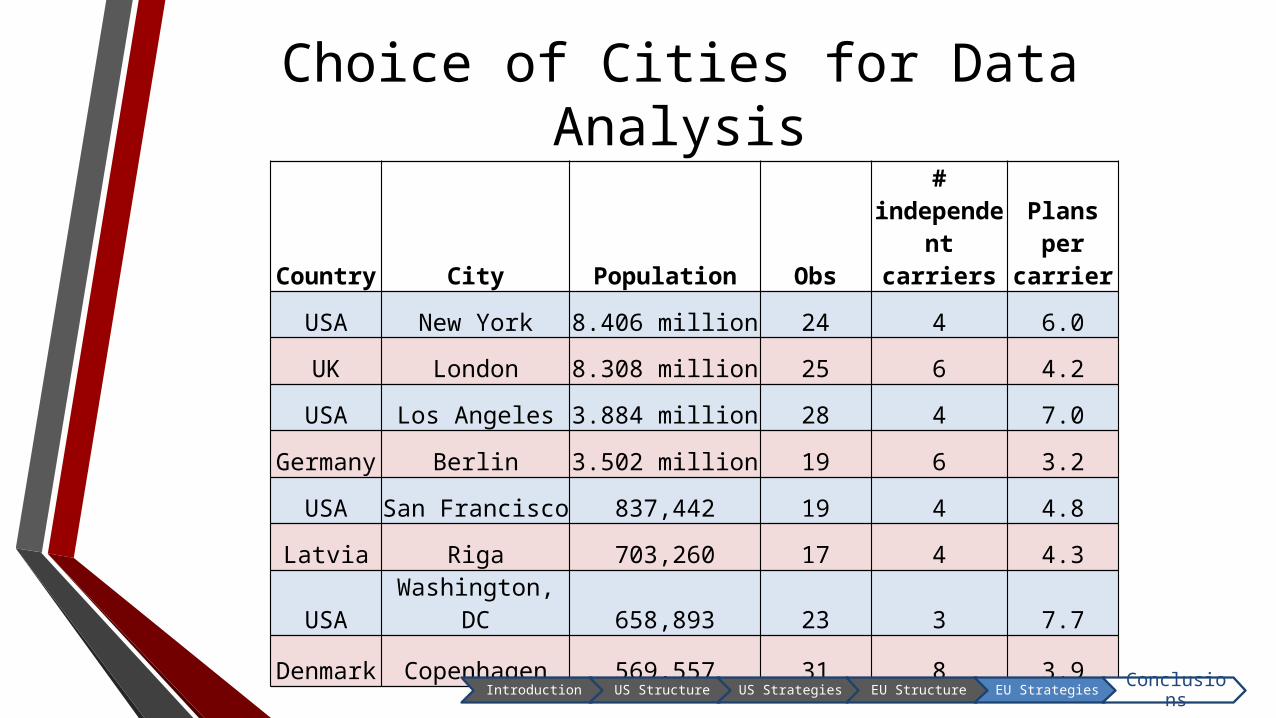
Choice of Cities for Data Analysis
Country City Population Obs
# independent
carriersPlans per
carrier
USA New York 8.406 million 24 4 6.0
UK London 8.308 million 25 6 4.2
USA Los Angeles 3.884 million 28 4 7.0
Germany Berlin 3.502 million 19 6 3.2
USA San Francisco 837,442 19 4 4.8
Latvia Riga 703,260 17 4 4.3
USA Washington, DC 658,893 23 3 7.7
Denmark Copenhagen 569,557 31 8 3.9
Introduction US Structure US Strategies EU Structure EU StrategiesConclusion
s
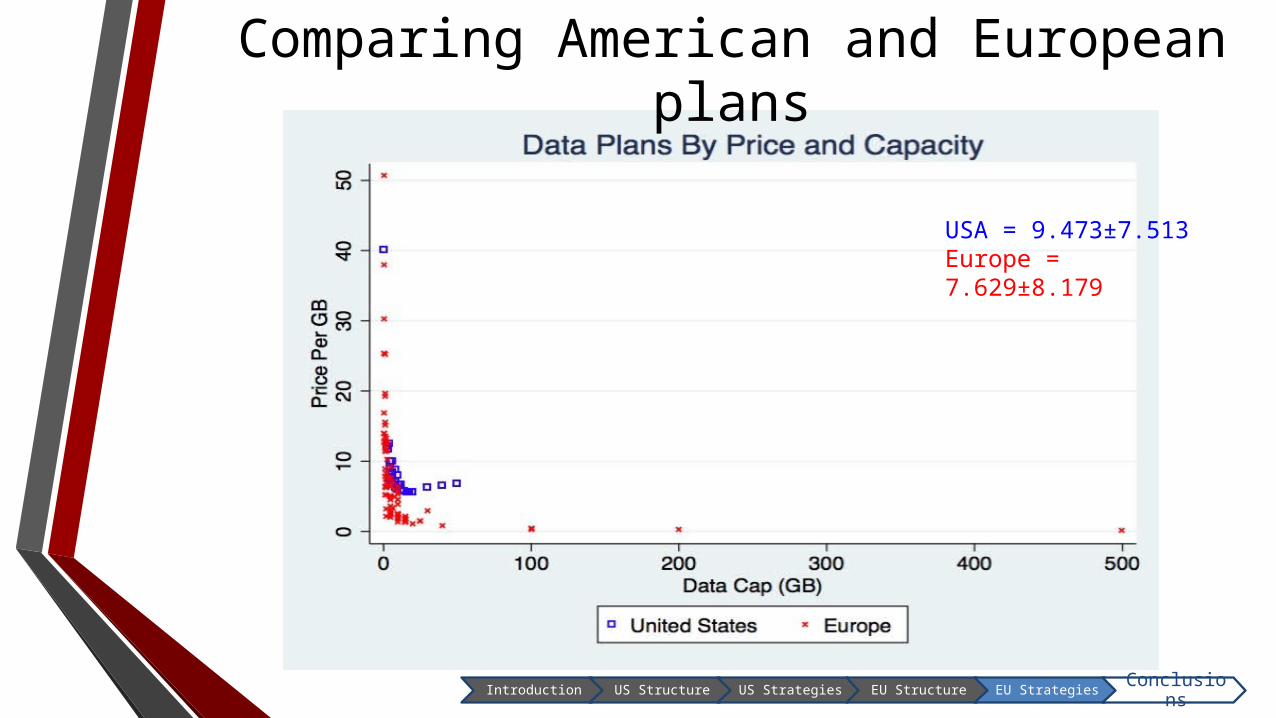
USA = 9.473±7.513Europe = 7.629±8.179
Comparing American and European plans
Introduction US Structure US Strategies EU Structure EU StrategiesConclusion
s

USA = 9.473±7.513Europe = 7.629±8.179
Frequency distribution of plans
Introduction US Structure US Strategies EU Structure EU StrategiesConclusion
s
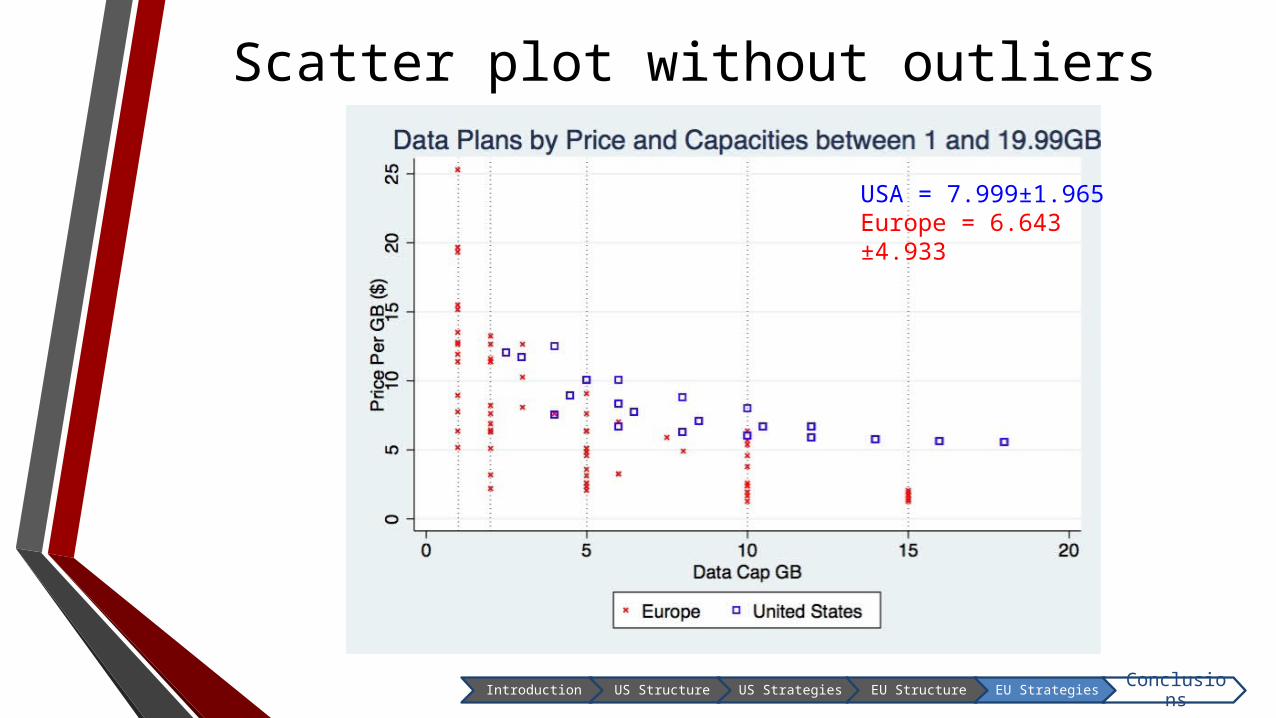
USA = 7.999±1.965Europe = 6.643 ±4.933
Introduction US Structure US Strategies EU Structure EU StrategiesConclusion
s
Scatter plot without outliers
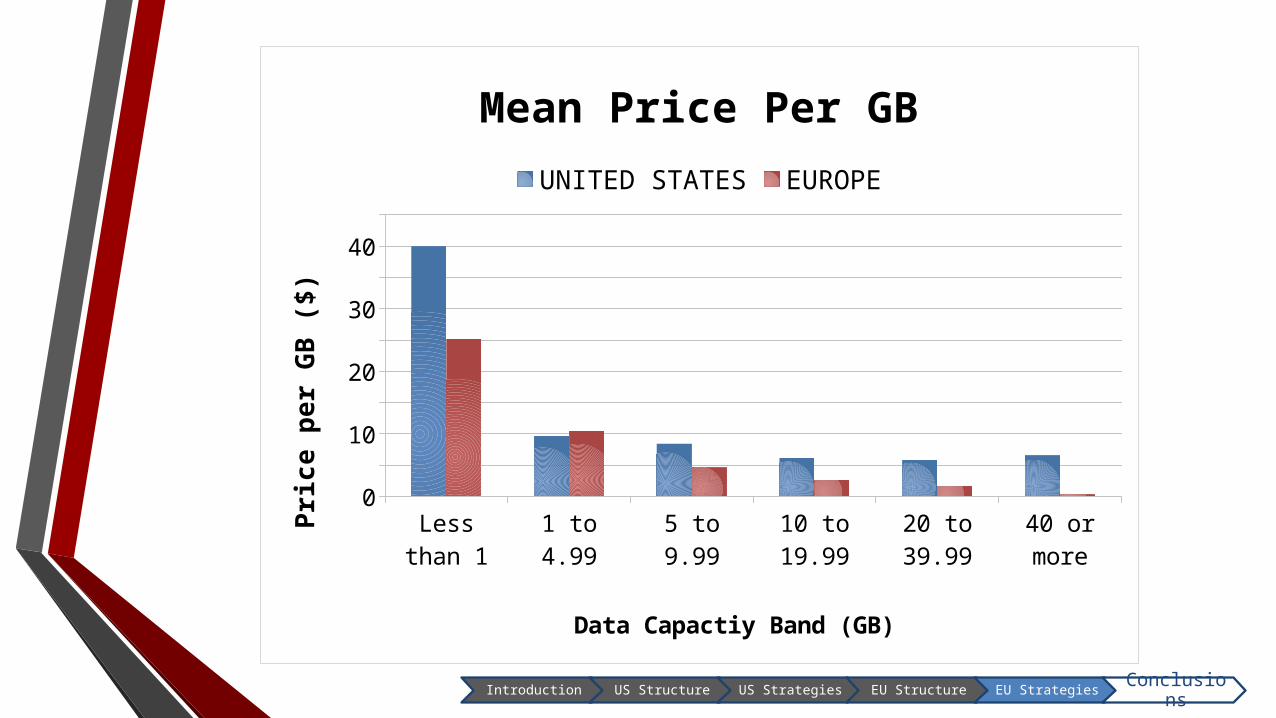
Less than 1 1 to 4.99 5 to 9.99 10 to 19.99 20 to 39.99 40 or more0
5
10
15
20
25
30
35
40
45
Mean Price Per GBUNITED STATES EUROPE
Data Capactiy Band (GB)
Pric
e pe
r GB
($)
Introduction US Structure US Strategies EU Structure EU StrategiesConclusion
s
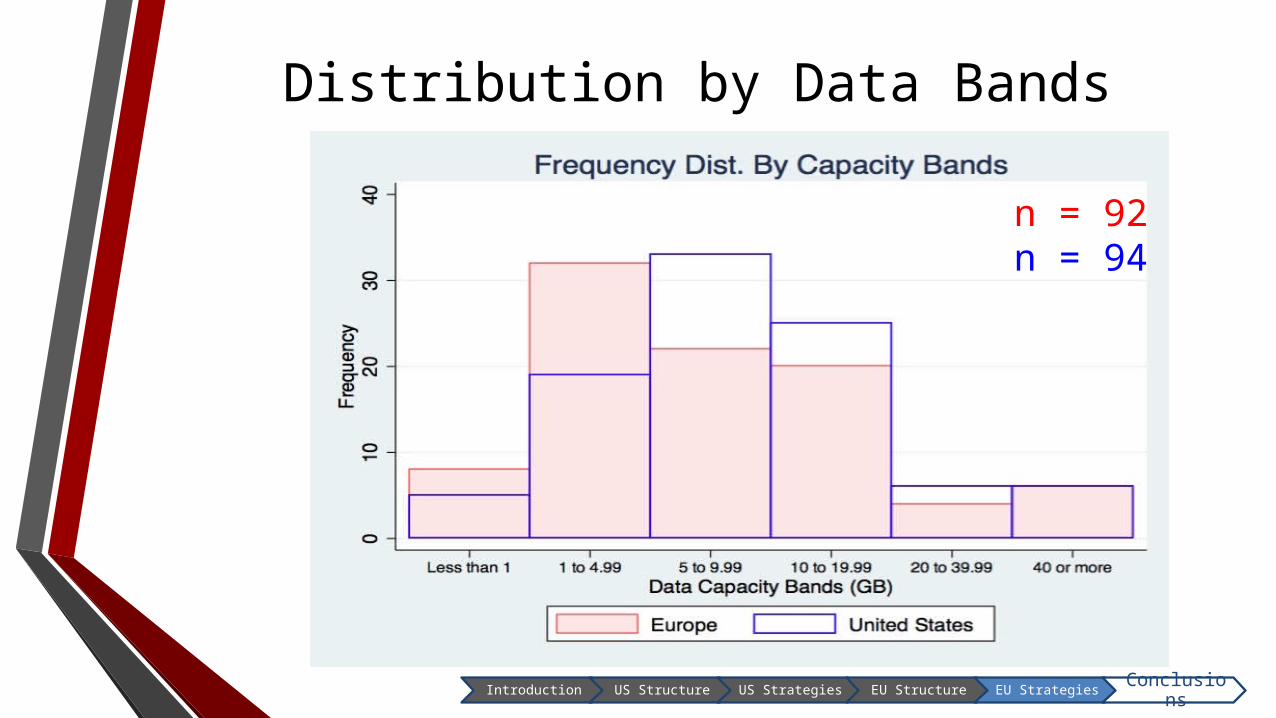
n = 92n = 94
Distribution by Data Bands
Introduction US Structure US Strategies EU Structure EU StrategiesConclusion
s
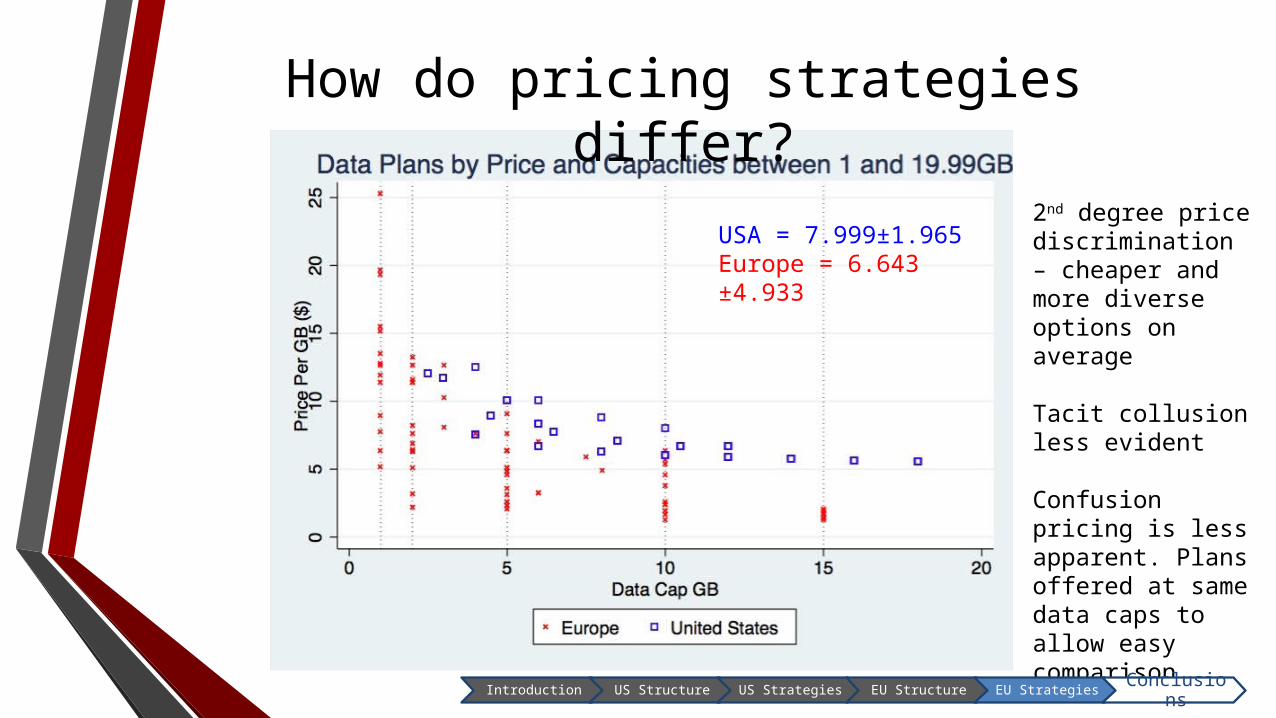
USA = 7.999±1.965Europe = 6.643 ±4.933
How do pricing strategies differ?
2nd degree price discrimination – cheaper and more diverse options on average
Tacit collusion less evident
Confusion pricing is less apparent. Plans offered at same data caps to allow easy comparison
Introduction US Structure US Strategies EU Structure EU StrategiesConclusion
s

Conclusions
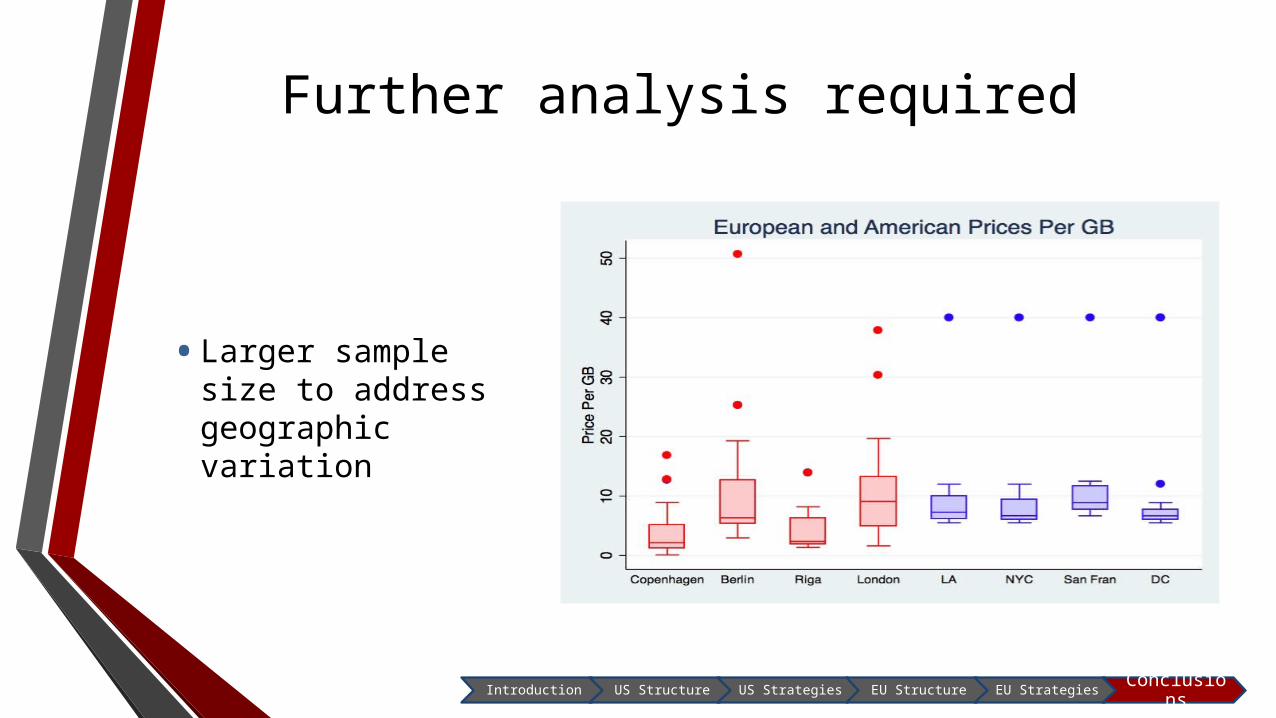
Further analysis required
• Larger sample size to address geographic variation
Introduction US Structure US Strategies EU Structure EU StrategiesConclusion
s
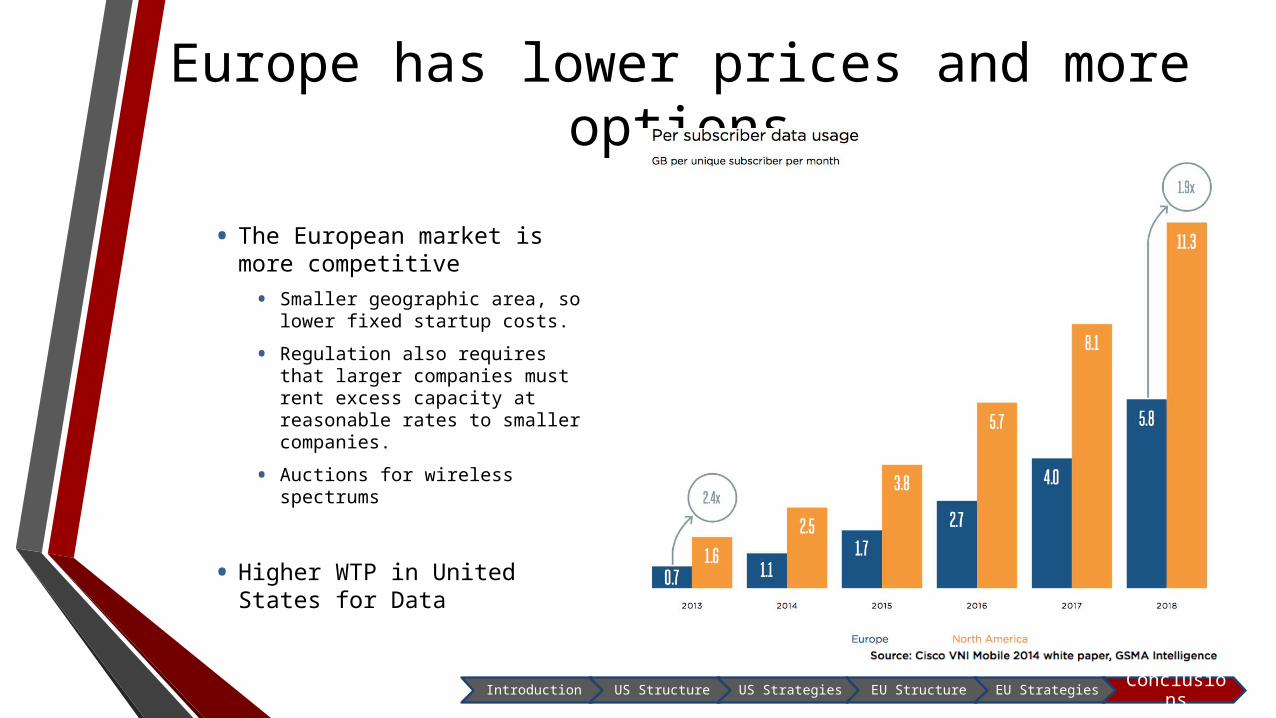
Europe has lower prices and more options
• The European market is more competitive
• Smaller geographic area, so lower fixed startup costs.
• Regulation also requires that larger companies must rent excess capacity at reasonable rates to smaller companies.
• Auctions for wireless spectrums
• Higher WTP in United States for Data
Introduction US Structure US Strategies EU Structure EU StrategiesConclusion
s
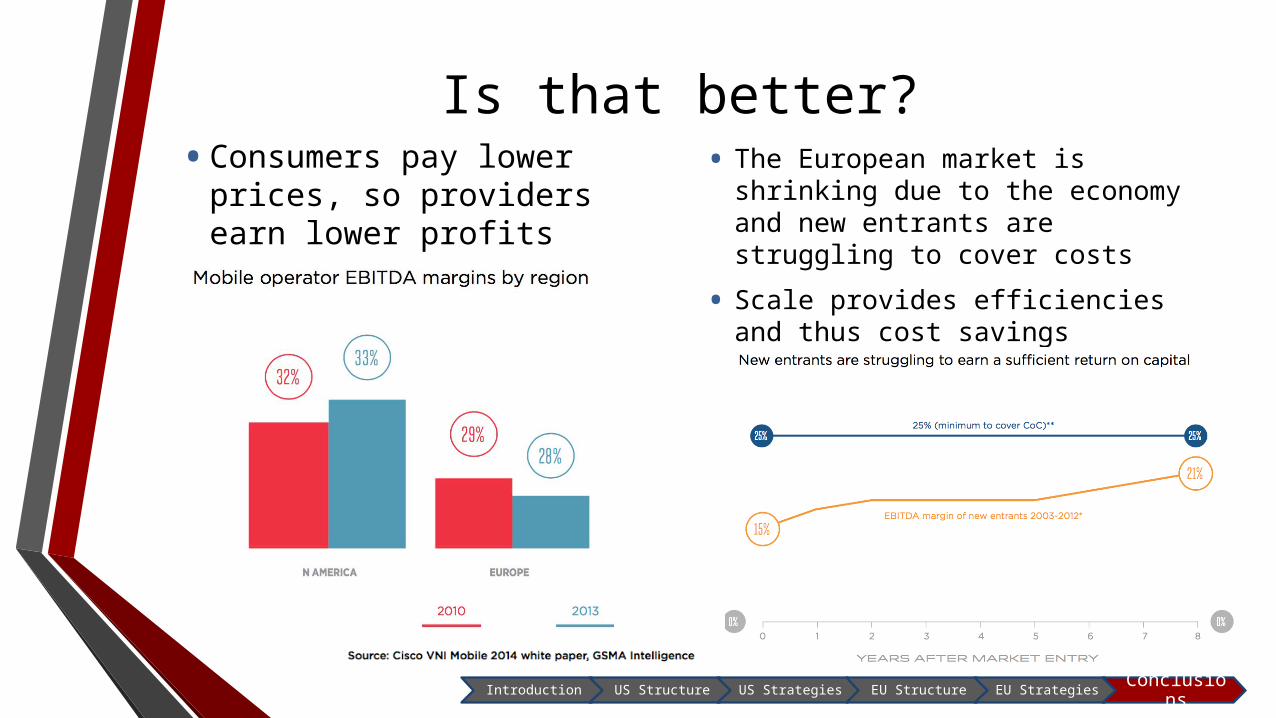
Is that better?• Consumers pay lower
prices, so providers earn lower profits
• The European market is shrinking due to the economy and new entrants are struggling to cover costs
• Scale provides efficiencies and thus cost savings
Introduction US Structure US Strategies EU Structure EU StrategiesConclusion
s
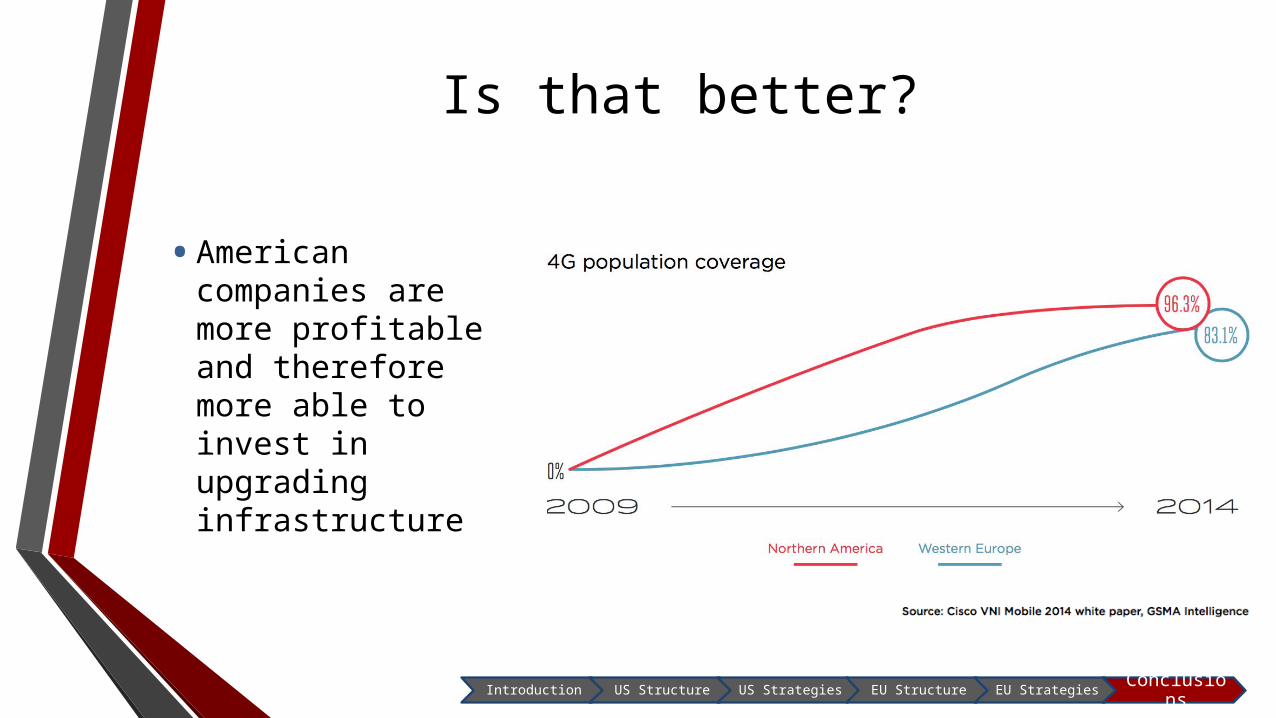
Is that better?
• American companies are more profitable and therefore more able to invest in upgrading infrastructure
Introduction US Structure US Strategies EU Structure EU StrategiesConclusion
s

How could the government improve things?
• Encourage competition through regulation to improve quality, reduce prices
• Mandatory affordable leasing of excess capacity
• Block mergers
• Commit to Net Neutrality!
Introduction US Structure US Strategies EU Structure EU StrategiesConclusion
s

Thanks for listening!Comments or Questions?