Winnipeg Transportation Master Plan
120
Transportation Master Plan Winnipeg
Transcript of Winnipeg Transportation Master Plan
TransportationMaster Plan
Winnipeg

October 2011
Transportation Master PlanWinnipeg
Acknowledgements
The Transportation Master Plan Team would like to acknowledge the contributions of many
individuals and groups who helped shape the directions presented in this plan.
Project Management Team
Luis Escobar PubLic Works DEParTMEnT
kenn rosin PubLic Works DEParTMEnT
Steering Committee
Public Works DePartment
brad sacher
kevin nixon
Doug Hurl
Planning, ProPerty anD DeveloPment DePartment
susanne Dewey-Povoledo
bryan Ward
transit DePartment
Dave Wardrop
bill Menzies
bjorn radstrom
Former DePuty cao
alex robinson
Advisory Committee
chris sobkowicz co-orDinaTor, ciTy of WinniPEg accEss aDvisory coMMiTTEE
randy Topolniski, coo, WinniPEg Parking auTHoriTy
chuck Davidson vicE-PrEsiDEnT of PoLicy, WinniPEg cHaMbEr of coMMErcE
beth Mckechnie WorkPLacE coMMuTEr oPTions, grEEn acTion cEnTrE
alan clayton ProfEssor EMEriTus, DEParTMEnT of civiL EnginEEring, univErsiTy of ManiToba
Other Public Service Contributors
Phil sheegl cHiEf aDMinisTraTivE officEr
Deepak Joshi cHiEf oPEraTing officEr
numerous members of the Public service who contributed
to specific areas or the overall development of the plan.
Stakeholders
Throughout the development of the plan, the TMP team
consulted with many stakeholder groups. The insights and
ideas of these individuals helped in many ways to enable
this plan to be tailored to the needs and aspirations of
Winnipeggers.
Consulting Team
ibi grouP
brian Hollingworth ProJEcT ManagEr
Lee sims ProJEcT DirEcTor
bruce Mori anna Mori
Laura cham Jesse coleman
scott Johnson Jiang Hao
Laurence Lui Marian saavedra
mmm grouP
David Jopling richard Tebinka
veronica Hicks
mrc
ian borsuk Helen gault
Ted gill
Transportation Master PlanWinnipeg
Table of Contents
Preface ........................................................................................................................................i
1. Introduction .................................................................................................................... 1
1.1 What is the Transportation Master Plan? 11.2 OurWinnipeg and the Transportation Master Plan 21.3 Study Area 41.4 How was the Plan Prepared? 51.5 Public and Stakeholder Input 61.6 Implementing Mechanisms 7
2. Key Strategic Goals ..................................................................................................... 9
3. Current and Future Conditions ...........................................................................13
3.1 Current Conditions 13Land Use 13
Roads 16
Transit 16
Active Transportation 17
Goods Movement 18
Travel Demand 18
3.2 Future Base Case Conditions 20Population, Employment and Demographics 20
Implications of Growth 21
3.3 Alternative Land Use and Transportation Scenarios 22Land Use Scenarios 22
Transportation Scenarios 24
Implications 25
3.4 Network Constraints and Opportunities 26
4. Integrating Transportation and Land Use ....................................................29
Table of Contents
5. Transportation Choice ............................................................................................ 33
5.1 General Applicability 345.1.1 Accessibility and Universal Design 34
5.1.2 Transportation Demand Management 36
5.1.3 Complete Streets 37
5.2 Active Transportation 395.2.1 Walking 42
5.2.2 Cycling 44
5.3 Transit 465.4.1 Base Transit Network 50
5.4.2 Rapid Transit 51
5.4 Road Network 595.5.1 Road Network Improvements 59
5.5.2 Road Network Classification System 64
6. Goods Movement ......................................................................................................65
7. Regional Connections ............................................................................................ 69
8. Parking .............................................................................................................................71
9. Asset Management ................................................................................................... 75
10. Implementation, Funding, and Plan Monitoring ...................................... 77
10.1 Implementation Strategy 77Enabling Strategies 77
Early Action Items 85
10.2 Funding 86Capital Expenditures 86
Operating Expenditures 87
10.3 Plan Review and Updates 89Plan Monitoring 89
Maps
Preface
Transportation is a Catalyst for Growth and Change
Winnipeg and the Manitoba capital region are growing at a pace we have not seen in several decades.
our economy is booming as businesses take advantage of Winnipeg’s unique trade position in north
america. consequently, we are welcoming more new Winnipeg residents, seeking the opportunities
the region is presenting. once here, residents are discovering a range of housing choices, livable
communities and opportunities to be civically engaged – all things that have always brought great pride
to Winnipeggers. by 2031, it is projected that Winnipeg and the surrounding areas will be approaching
one million people.
With growth comes greater opportunities and challenges for transportation. from a transportation
planning perspective, Winnipeg has been relatively fortunate in that growth in the recent past has been
stable and predictable. However, the higher level of growth projected over the next two decades will
require innovative and proactive transportation solutions in order to ensure the transportation system
delivers the necessary performance to nurture Winnipeg’s current and future economic prosperity.
fortunately, growth and economic development also provides an opportunity to invest and shape our
transportation system to improve the efficiency of the movement of people and goods by road. it will
also require us to encourage more sustainable forms of travel including walking, cycling and transit.
The Transportation Plan Supports Winnipeg’s Vision for Land Use Development
The integration of transportation and land use planning ensures that the vision for land use
development for Winnipeg, as articulated in ourWinnipeg and complete communities, is achieved
by providing a transportation network that supports the approved urban structure and the concept
of complete communities. This includes creating a network of rapid transit routes and quality transit
corridors that can become the focal points for new development and redevelopment. it also includes
providing complete, safe, and accessible transportation options for all residents of all abilities from
young to old.
as part of this plan, a great deal of work was done to test different land use and transportation
scenarios. The way we build our city today is simply not sustainable. The path forward is to concentrate
and intensify development in order to support and encourage alternatives to driving. it is clear from the
scenario testing that these efforts would create significant dividends in terms of reduced congestion,
increased transit ridership, reduced emissions and reduced personal transportation costs.
Transportation Master PlanWinnipeg
ii
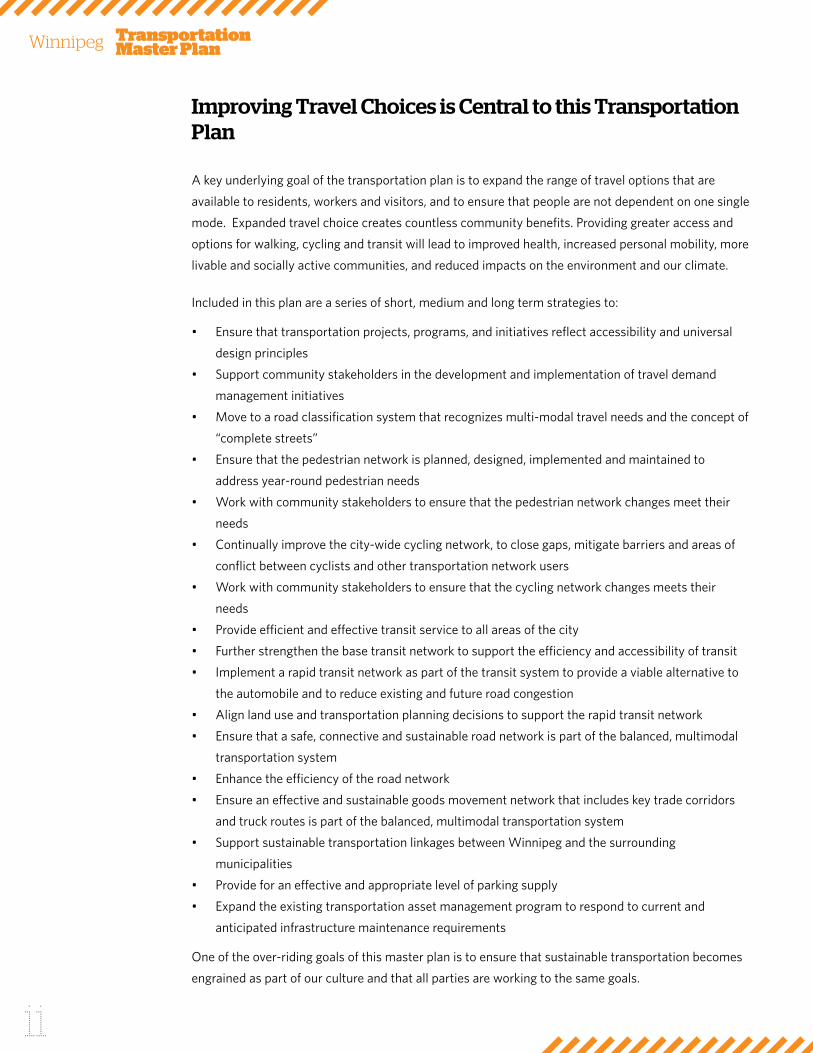
Improving Travel Choices is Central to this Transportation Plan
a key underlying goal of the transportation plan is to expand the range of travel options that are
available to residents, workers and visitors, and to ensure that people are not dependent on one single
mode. Expanded travel choice creates countless community benefits. Providing greater access and
options for walking, cycling and transit will lead to improved health, increased personal mobility, more
livable and socially active communities, and reduced impacts on the environment and our climate.
included in this plan are a series of short, medium and long term strategies to:
• Ensure that transportation projects, programs, and initiatives reflect accessibility and universal
design principles
• support community stakeholders in the development and implementation of travel demand
management initiatives
• Move to a road classification system that recognizes multi-modal travel needs and the concept of
“complete streets”
• Ensure that the pedestrian network is planned, designed, implemented and maintained to
address year-round pedestrian needs
• Work with community stakeholders to ensure that the pedestrian network changes meet their
needs
• continually improve the city-wide cycling network, to close gaps, mitigate barriers and areas of
conflict between cyclists and other transportation network users
• Work with community stakeholders to ensure that the cycling network changes meets their
needs
• Provide efficient and effective transit service to all areas of the city
• further strengthen the base transit network to support the efficiency and accessibility of transit
• implement a rapid transit network as part of the transit system to provide a viable alternative to
the automobile and to reduce existing and future road congestion
• align land use and transportation planning decisions to support the rapid transit network
• Ensure that a safe, connective and sustainable road network is part of the balanced, multimodal
transportation system
• Enhance the efficiency of the road network
• Ensure an effective and sustainable goods movement network that includes key trade corridors
and truck routes is part of the balanced, multimodal transportation system
• support sustainable transportation linkages between Winnipeg and the surrounding
municipalities
• Provide for an effective and appropriate level of parking supply
• Expand the existing transportation asset management program to respond to current and
anticipated infrastructure maintenance requirements
one of the over-riding goals of this master plan is to ensure that sustainable transportation becomes
engrained as part of our culture and that all parties are working to the same goals.
Rapid Transit the Key to a Sustainable Winnipeg
our city needs rapid transit, not just because of what other cities are doing, but because of the
power of rapid transit to shape growth and contribute to a more sustainable transportation system.
unlike road widening, building rapid transit provides capacity for the city to grow efficiently and to
accommodate transportation demands for generations to come. rapid transit is also needed to
ensure viable choices to automobiles, so that road space can be freed up for essential needs including
economic trade.
This report has confirmed the viability of rapid transit in multiple corridors. initial priorities include
the southwest corridor (stage one is under construction), a western corridor along Portage avenue,
and an easterly corridor, with a possible extension north on Main street. corridors in the northeast
and southeast could be implemented as extensions to the primary corridors using staged and less
expensive approaches and then converted to full rapid transit in the longer term.
following the adoption of this master plan, the next steps will be to carry out detailed studies on
specific alignments and to develop a funding and delivery strategy.
Now is the Time to Act
Many previous reports have helped to shape the recommendations in this Transportation Master
Plan, including the Mayor’s Trade council report entitled “Winnipeg – canada’s centre for global
Trade”, the recent infrastructure council report on funding municipal infrastructure and most
importantly, ourWinnipeg. all of these reports point to the urgency of addressing existing
transportation needs while building for the future. indeed, if our city is to become the city we
envision, there is much work to do.
01 Introduction
1. Introduction
1.1 What is the Transportation Master Plan?
The purpose of this Transportation Master Plan (TMP) is to present a long-term strategy to guide the planning, development, renewal and maintenance of a multi-modal transportation system in a manner that is consistent with projected needs, and aligned with the City’s growth and the overall vision for a sustainable Winnipeg and region.
in the introduction section of ourWinnipeg, the city’s long term development plan, it states:
“More than ever before, cities are the leading production centres for culture and innovation,
are the leaders on global issues like climate change, and, if they are to compete successfully for
sustainable growth, are required to deliver a high quality of life. Winnipeg is no exception to this
dynamic. We are now competing, on a global scale, for economic development and to create a
city that offers the sustainability advantages and the quality of life that current citizens expect
and that prospective citizens will value. We are early in a cycle of strong growth, the pace of
which we haven’t seen for decades. We’re welcoming new citizens and businesses, and embracing
opportunities to make our city sustainable.”
one of the key components to providing the quality of life that all citizens value is a well
planned transportation system that accommodates growth in a sustainable manner.
between 2006 and 2031, the city of Winnipeg is expected to grow by 200,000 persons
and 78,000 jobs. similarly, the surrounding areas in the rest of the Winnipeg census
Metropolitan area (cMa) are expected to grow by 45,100 people and 10,000 jobs. This
growth will mean that the city of Winnipeg and surrounding area will be home to close to
one million people by 2031.
With this growth comes both opportunities and challenges. growth fuels changes -
changes that provide opportunities such as the creation of more compact and vibrant
communities, greater opportunities for economic development and increased justification
for infrastructure renewal and expansion. However, rapid growth also presents challenges in
that policies and infrastructure need to be in place to support growth and must be delivered
in a manner that is sustainable economically, socially and environmentally.
Transportation Master PlanWinnipeg
2
The Winnipeg Transportation Master Plan (TMP) is intended to set out a strategic vision for
transportation in Winnipeg over the next two decades. it will ensure that future transportation
needs for an integrated network of highways, roads, rapid and conventional transit, cycling
and pedestrian facilities can be planned and budgeted for as the city implements its future
growth plan outlined in ourWinnipeg. The TMP also provides an updated and expanded set of
policies to guide future transportation and land development decisions.
it should be recognized that the TMP is a long-term, strategic planning document and as
such is not intended to address site-specific or corridor-specific issues. rather, it is intended
to present a package of actions that, when implemented over time, will help the city achieve
its strategic vision. The TMP is also intended to be a dynamic document that is responsive to
changing conditions over time.
1.2 OurWinnipeg and the Transportation Master Plan
The TMP was built on the strength of the vision and directions established through the
development of ourWinnipeg and its supporting Direction strategies.
The city is required by the city of Winnipeg charter to adopt, by by-law, a development
plan “which must set out the city’s long-term plans and policies respecting its purposes,
its physical, social and environmental and economic objectives, and sustainable land uses
and development.” created with the input of more than 42,000 Winnipeggers through the
innovative speakupWinnipeg process, ourWinnipeg represents a collective vision that will
guide the physical, social, environmental and economic development of our city for the next 25
years.
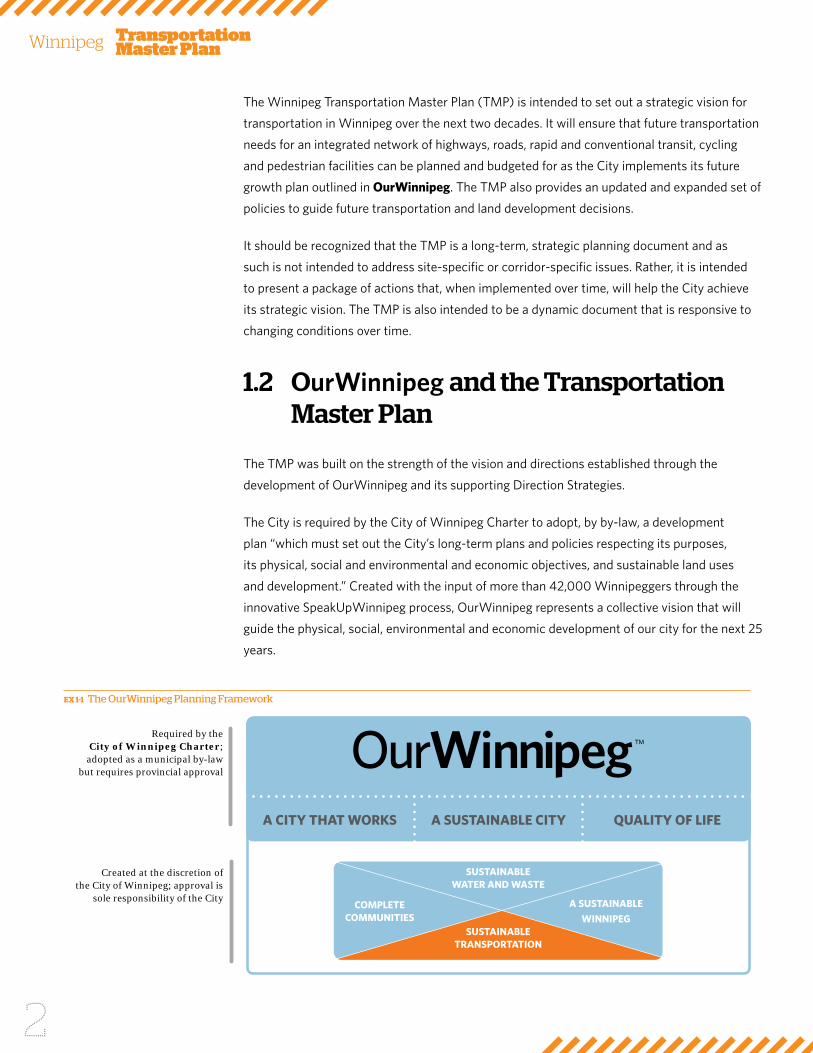
Required by the City of Winnipeg Charter;
adopted as a municipal by-law but requires provincial approval
Created at the discretion of the City of Winnipeg; approval is
sole responsibility of the City
A CITY THAT WORKS A SUSTAINABLE CITY QUALITY OF LIFE
A SUSTAINABLE
WINNIPEG
SUSTAINABLE WATER AND WASTE
COMPLETE COMMUNITIES
SUSTAINABLE TRANSPORTATION
EX 1-1 The OurWinnipeg Planning Framework
01 Introduction
ourWinnipeg is the highest-level strategy document that the city has and it includes policies and
action-oriented strategies in areas including: land use; transportation; water and waste; safety;
prosperity; housing; recreation; libraries; the environment; heritage conservation; opportunity;
vitality; and creativity. it is supported by four direction strategies - complete communities,
sustainable Transportation, sustainable Water and Waste and a sustainable Winnipeg – each of
which provides additional detail in key planning areas.
complete communities Direction strategy serves as a practical and innovative “playbook” to
guide land use and development in Winnipeg over the next 25 years. The strategic direction set
through this strategy, along with sustainable Transportation served as two of the key inputs into
the development of the TMP. Linking how we grow with how we move is critical in building a
sustainable city.
complete communities is based on two key pillars, each of which has considerable implications
for transportation planning going forward – the creation of complete communities and the
articulation of an urban structure.
complete communities
complete communities are places that offer and support a variety of lifestyle choices, providing
opportunities for people of all ages and abilities to live, work, shop, learn and play in close
proximity to one another.
05
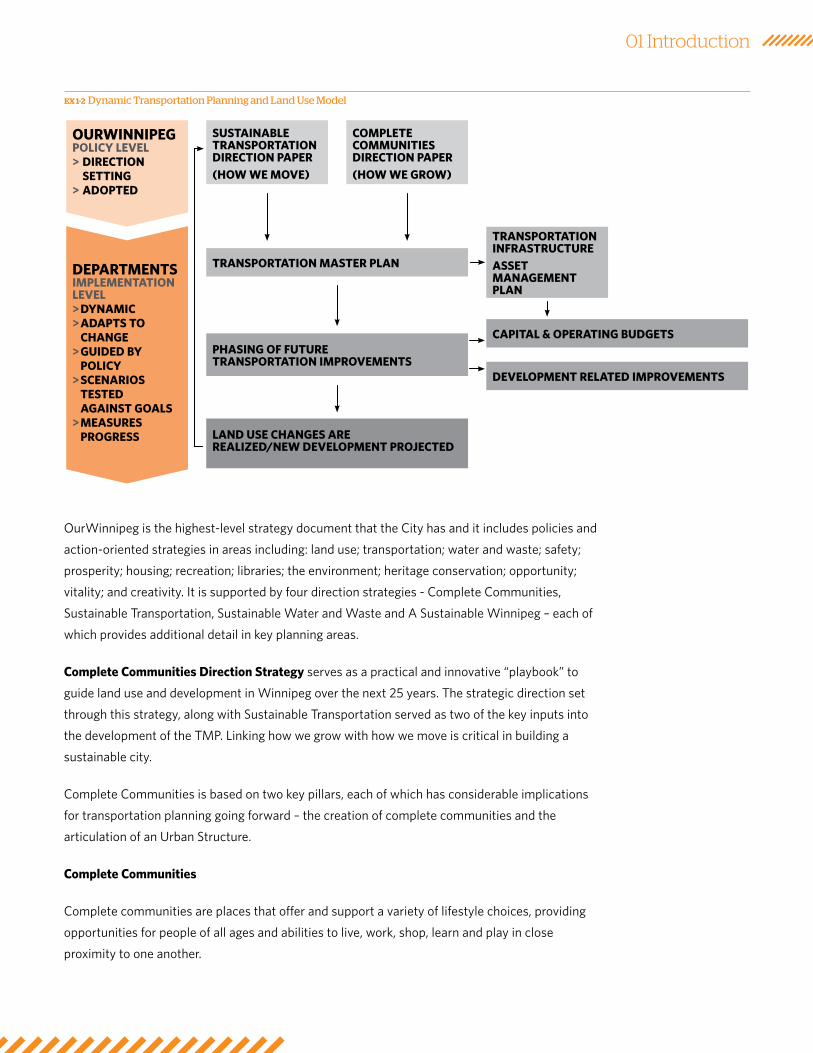
figure 01a
01 introduction
sustainable transportation > introduction
DynamiC tranSportation planning anD lanD uSe moDel
ourWinnipegpoliCy level> DireCtion Setting> aDopteD
DepartmentSimplementationlevel> DynamiC> aDaptS to
Change> guiDeD by
poliCy> SCenarioS
teSteD againSt goalS
> meaSureS progreSS
SuStainable tranSportation DireCtion paper(hoW We move)
Complete CommunitieS DireCtion paper(hoW We groW)
tranSportation infraStruCtureaSSet management plan
tranSportation maSter plan
phaSing of future tranSportation improvementS
Capital & operating buDgetS
Development relateD improvementS
lanD uSe ChangeS are realizeD/neW Development projeCteD
EX 1-2 Dynamic Transportation Planning and Land Use Model
Transportation Master PlanWinnipeg
4
characteristics of complete communities:
• celebrate diversity and provide housing options that accommodate a range of income
abilities and household types for all stages of life.
• Provide options for accessing services, amenities and community resources by ensuring
that most of the daily necessities of life- services, facilities, and amenities- are readily
accessible.
• Enable a range of sustainable transportation options.
• Provide options for local employment while recognizing that the Downtown, airport
lands and designated employment zones will continue to be major centres of
employment in the city.
• Will be a living, dynamic concept that recognizes the unique aspects that differentiate
one community from another.
This overarching theme forms the backbone of the complete communities Direction
strategy and its characteristics serve as key principles guiding the TMP process.
urban structure
The second pillar of the complete communities Direction strategy is the articulation of an
urban structure. as part of the ourWinnipeg process, an urban structure was delineated,
which provides a vision for how land uses are arranged within the city. The urban structure
identifies specific areas of the city that provide the best opportunity to accommodate
significant growth and development (Transformative areas) and conversely areas that are
better suited to accommodate more moderate levels of growth (areas of stability).
The urban structure was a fundamental element in the TMP process, as it proactively
identifies future areas of growth and change. The TMP will dynamically analyze the needs of
the urban structure as it evolves over time, resulting in the ability to integrate land use and
transportation in a more holistic manner.
1.3 Study Area
The primary focus of this TMP is on the city of Winnipeg (Map 1). However, the surrounding
regional Municipalities within the capital region (see Map 2) also play a major role in
influencing travel patterns in and around the city and associated infrastructure needs.
Therefore, several regional transportation elements are identified in this plan.
01 Introduction
1.4 How was the Plan Prepared?
This TMP was prepared by ibi group in association with MMM group Limited and
Mccormick rankin corporation. The development of the TMP was guided by a
steering committee and an advisory committee. The steering committee consisted of
representatives from the city’s Public Works, Planning, Property and Development, and
Winnipeg Transit departments. The advisory committee consisted of representatives
from the green action centre, Winnipeg access advisory committee, the Mayor’s
Environmental advisory committee, Winnipeg chamber of commerce, Winnipeg Parking
authority and a local transportation academic.
The preparation of the TMP consisted of the following major components:
• confirmation of the vision for sustainable transportation;
• Development of a state-of-the-art transportation model;
• assessment of strategic transportation and land use alternatives based on
ourWinnipeg and the complete communities Direction strategy;
• identification and assessment of directions and strategies to support integrated
planning and transportation choice;
• identification and assessment of specific directions and strategies related to pedestrian,
cycling, transit, and road networks, integrated planning, transportation demand
management (TDM), accessibility, parking and goods movement; and,
• Development of :
» options for funding the transportation network,
» recommendations for implementation, and
» a performance measurement plan.
To support the noted tasks, research was conducted in the following areas:
• Transportation Trends, issues and opportunities
• requirements related to the road, transit, active transportation and goods movement
networks
• Parking and Travel Demand Management
• financing and implementation
• Measuring and Monitoring Performance
Transportation Master PlanWinnipeg
6
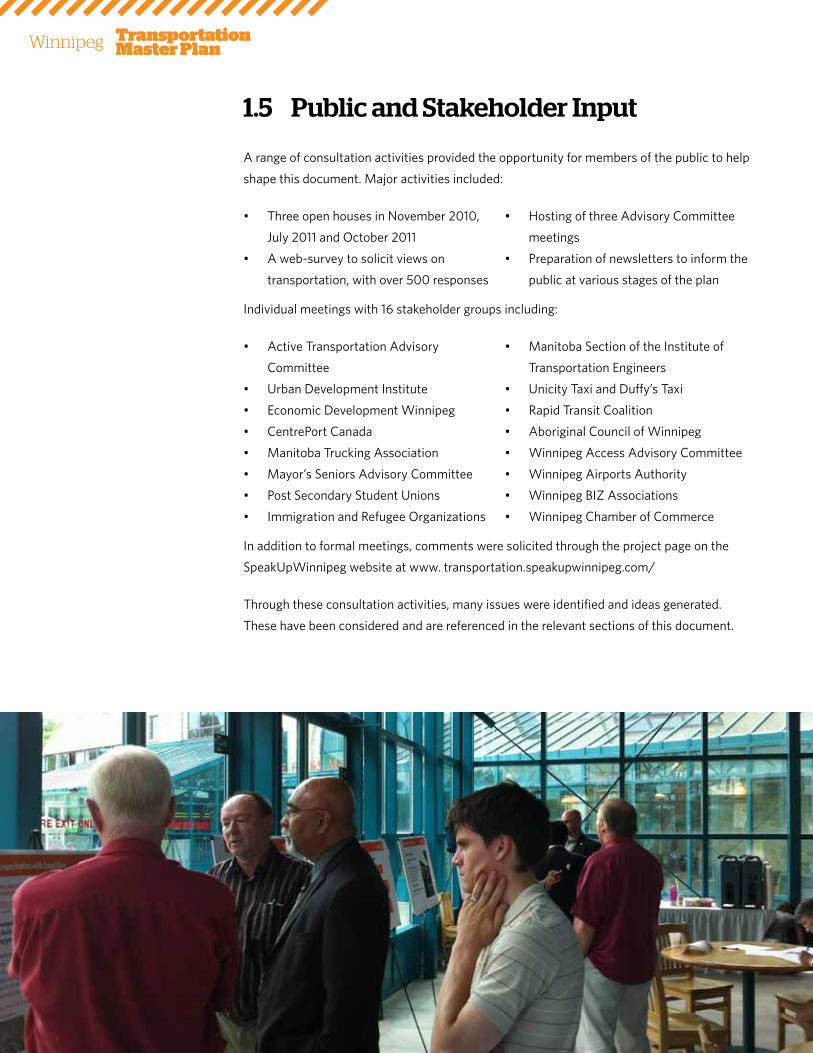
1.5 Public and Stakeholder Input
a range of consultation activities provided the opportunity for members of the public to help
shape this document. Major activities included:
• Three open houses in november 2010,
July 2011 and october 2011
• a web-survey to solicit views on
transportation, with over 500 responses
• Hosting of three advisory committee
meetings
• Preparation of newsletters to inform the
public at various stages of the plan
individual meetings with 16 stakeholder groups including:
• active Transportation advisory
committee
• urban Development institute
• Economic Development Winnipeg
• centrePort canada
• Manitoba Trucking association
• Mayor’s seniors advisory committee
• Post secondary student unions
• immigration and refugee organizations
• Manitoba section of the institute of
Transportation Engineers
• unicity Taxi and Duffy’s Taxi
• rapid Transit coalition
• aboriginal council of Winnipeg
• Winnipeg access advisory committee
• Winnipeg airports authority
• Winnipeg biZ associations
• Winnipeg chamber of commerce
in addition to formal meetings, comments were solicited through the project page on the
speakupWinnipeg website at www. transportation.speakupwinnipeg.com/
Through these consultation activities, many issues were identified and ideas generated.
These have been considered and are referenced in the relevant sections of this document.
01 Introduction
1.6 Implementing Mechanisms
The Transportation Master Plan will be implemented through:
• The city’s short-, medium- and long-range financial plans including annual budgets, the
five-year capital forecast and strategic financial plans;
• various transportation and land use plans, projects, and initiatives;
• strategic internal and external partnerships; and,
• The ourWinnipeg implementation strategy.
To ensure the successful implementation of this long-range transportation plan, the city
will monitor relevant external conditions, progress on achievements and actions taken to
identify if the goals and objectives are being met, and whether changes to the plan are
required.
HOW THIS DOCUMENT IS ORGANIZEDWhere applicable, each section of the Transportation Master Plan (TMP) begins with a high-level description of the relevant
component and continues with details of how they are to be implemented. The sections are organized as follows:
KEy DIRECTION
Each section has a key Direction. it is meant to summarize the main thrust of the section and like a goal, it provides a
description of the results that the city is hoping to achieve. The rest of each section is based on this key Direction.
DIRECTIONS
under each key Direction are a number of supporting Directions that describe the city’s objectives concerning the specific
component of the TMP in more detail.
ENAbLING STRATEGIES
The enabling strategies come from each Direction. They are the strategies that will guide the city to fulfilling the Directions
for each component of the TMP.

Transportation Master PlanWinnipeg
8Flickr: davE.cOurnOyEr

02 Key Strategic Goals
2. Key Strategic Goals
as described in section 1.2, the sustainable Transportation Direction strategy was
developed as part of ourWinnipeg. sustainable Transportation identified a vision and five
key strategic goals which are critical to achieving a balanced and sustainable transportation
system for Winnipeg. in addition to the five key strategic goals identified in the sustainable
Transportation Direction strategy, a sixth strategic goal was developed during the final
preparation of the Transportation Master Plan (TMP) to support council’s sustainability
objectives. These six goals form the basis for this TMP and the directions and strategies
contained within it.
KEy STRATEGIC GOAL ONE:
A transportation system that is dynamically integrated with land use
an integrated approach to land use and transportation maximizes the efficiency and
effectiveness of its transportation infrastructure, creating an efficient, sustainable and
vibrant city. an important component of integrated transportation and land use is that it
minimizes both the number and length of trips people need to make.
KEy STRATEGIC GOAL TWO:
A transportation system that supports active, accessible and healthy lifestyle options
Provision of adequately maintained walking, cycling and other forms of active transportation
facilities are all part of achieving this goal. a safe and secure transportation system in which
pedestrians, cyclists and motorists coexist is also essential. in addition, ensuring equitable
access to mobility and a high quality of life for all citizens, regardless of their personal ability
level, requires universal access to the transportation system.

Transportation Master PlanWinnipeg
10
KEy STRATEGIC GOAL THREE:
A safe, efficient and equitable transportation system for people, goods and services
in order to ensure sustainable economic growth that supports Winnipeg as the region’s
economic engine, an efficient, cost-effective transportation system for the timely and
equitable movement of goods, services and people must be an essential element. To achieve
this goal, we will need to utilize technology such as iTs (intelligent Transportation systems)
and other transportation systems management tools, transportation demand management,
strategic major street network improvements, rapid transit, and other innovative ways to
move people, goods and services.
KEy STRATEGIC GOAL FOUR:
Transportation infrastructure that is well maintained
a well-maintained transportation system promotes economic vitality and a positive city
image. it is an essential part of any truly sustainable transportation plan that the major
assets, the transportation infrastructure and the transit system, be managed to enable
future generations to continue to enjoy a high of level of mobility and accessibility. investing
in a measurable approach in the maintenance of the street, transit, pedestrian and cycling
infrastructure will ensure the continued economic and social viability of the city.
KEy STRATEGIC GOAL FIVE:
A transportation system that is financially sustainable
financial sustainability is an essential goal in the development of the Transportation Master
Plan for the next 20 years. This requires a review of the cost and benefits of each component
of the Transportation Master Plan as they are developed and an assessment of potential
additional sources of funding and program delivery to ensure financial sustainability for
future generations.
02 Key Strategic Goals
KEy STRATEGIC GOAL SIx:
A transportation system that reduces its greenhouse gas emissions footprint and meets or surpasses climate change and emissions reduction goals set by the City and the Province
The sustainability of our city and fulfillment of council’s commitments through the
Partners for climate Protection program for action on climate change depend on reducing
greenhouse gas (gHg) emissions. achieving this goal will involve providing competitive
mode choices, strategic integration of transportation and land use planning and other
initiatives that result in fewer and shorter motorized trips. as well, recognizing that many
opportunities for transportation-related gHg reductions are outside of the authority of the
city, collaboration with other levels of government and other partners will be required.
Transportation Master PlanWinnipeg
12
03 Current and Future Conditions
3. Current and Future Conditions
3.1 Current Conditions
Land Use
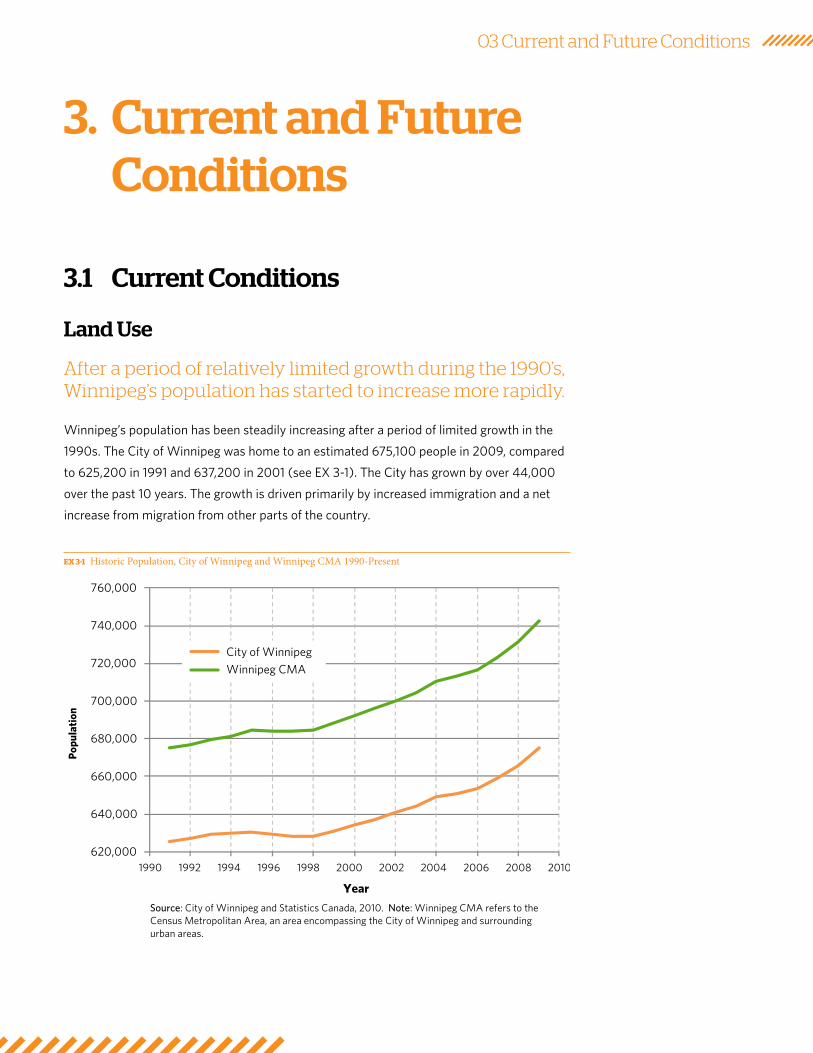
After a period of relatively limited growth during the 1990’s, Winnipeg’s population has started to increase more rapidly.
Winnipeg’s population has been steadily increasing after a period of limited growth in the
1990s. The city of Winnipeg was home to an estimated 675,100 people in 2009, compared
to 625,200 in 1991 and 637,200 in 2001 (see EX 3-1). The city has grown by over 44,000
over the past 10 years. The growth is driven primarily by increased immigration and a net
increase from migration from other parts of the country.
Source: City of Winnipeg and Statistics Canada, 2010. Note: Winnipeg CMA refers to the Census Metropolitan Area, an area encompassing the City of Winnipeg and surrounding urban areas.
620,000
640,000
660,000
680,000
700,000
720,000
740,000
760,000
Popu
lati
on
Year
City of Winnipeg
Winnipeg CMA
EX 3-1 Historic Population, City of Winnipeg and Winnipeg CMA 1990-Present
Transportation Master PlanWinnipeg
14
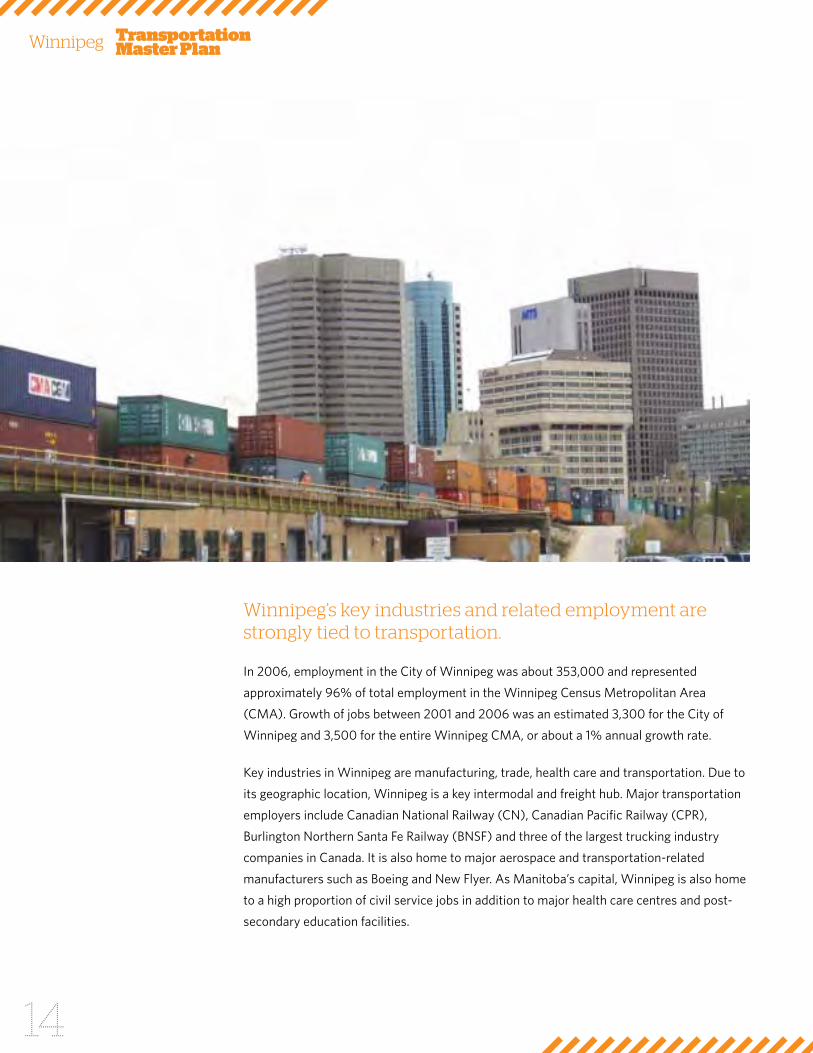
Winnipeg’s key industries and related employment are strongly tied to transportation.
in 2006, employment in the city of Winnipeg was about 353,000 and represented
approximately 96% of total employment in the Winnipeg census Metropolitan area
(cMa). growth of jobs between 2001 and 2006 was an estimated 3,300 for the city of
Winnipeg and 3,500 for the entire Winnipeg cMa, or about a 1% annual growth rate.
key industries in Winnipeg are manufacturing, trade, health care and transportation. Due to
its geographic location, Winnipeg is a key intermodal and freight hub. Major transportation
employers include canadian national railway (cn), canadian Pacific railway (cPr),
burlington northern santa fe railway (bnsf) and three of the largest trucking industry
companies in canada. it is also home to major aerospace and transportation-related
manufacturers such as boeing and new flyer. as Manitoba’s capital, Winnipeg is also home
to a high proportion of civil service jobs in addition to major health care centres and post-
secondary education facilities.
03 Current and Future Conditions
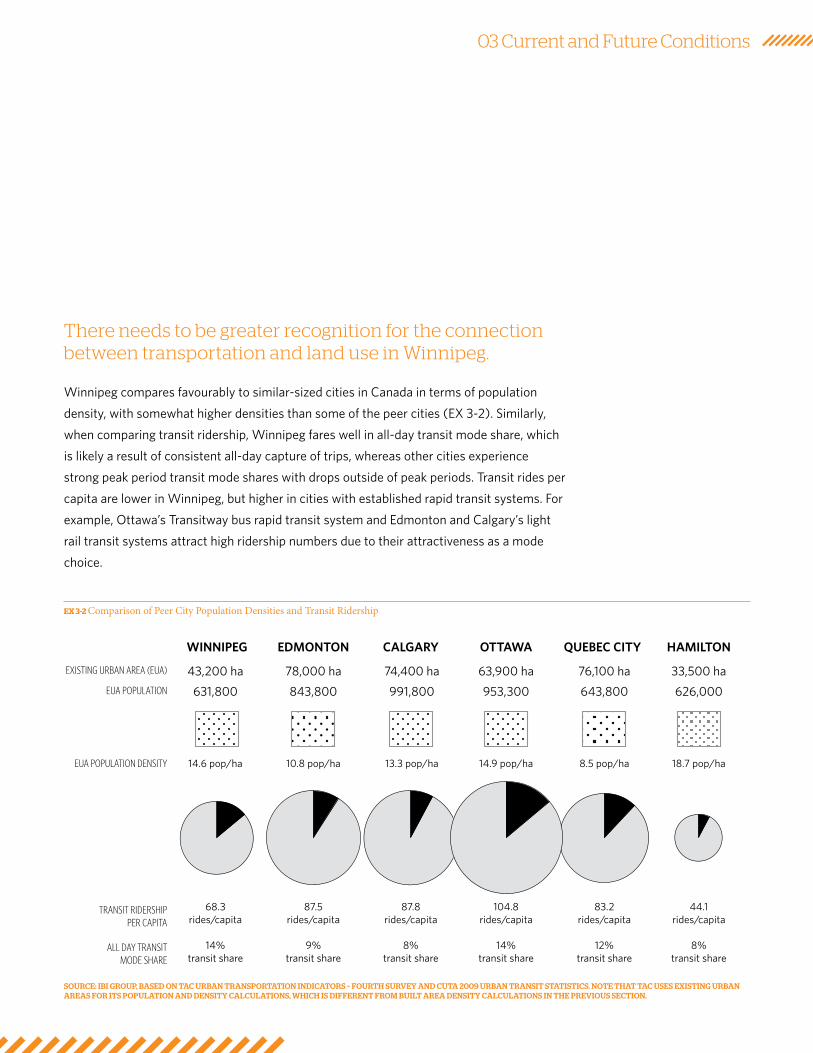
There needs to be greater recognition for the connection between transportation and land use in Winnipeg.
Winnipeg compares favourably to similar-sized cities in canada in terms of population
density, with somewhat higher densities than some of the peer cities (EX 3-2). similarly,
when comparing transit ridership, Winnipeg fares well in all-day transit mode share, which
is likely a result of consistent all-day capture of trips, whereas other cities experience
strong peak period transit mode shares with drops outside of peak periods. Transit rides per
capita are lower in Winnipeg, but higher in cities with established rapid transit systems. for
example, ottawa’s Transitway bus rapid transit system and Edmonton and calgary’s light
rail transit systems attract high ridership numbers due to their attractiveness as a mode
choice.
WINNIPEG EDMONTON CALGARY OTTAWA QUEBEC CITY HAMILTON
14.6 pop/ha 10.8 pop/ha 13.3 pop/ha 14.9 pop/ha 8.5 pop/ha 18.7 pop/ha
43,200 haEXISTING URBAN AREA (EUA)
EUA POPULATION DENSITY
TRANSIT RIDERSHIP PER CAPITA
ALL DAY TRANSIT MODE SHARE
78,000 ha 74,400 ha 63,900 ha 76,100 ha 33,500 ha
631,800EUA POPULATION 843,800 991,800 953,300 643,800 626,000
68.3rides/capita
14%transit share
87.5rides/capita
9%transit share
87.8rides/capita
8%transit share
104.8rides/capita
14%transit share
83.2rides/capita
12%transit share
44.1rides/capita
8%transit share
EX 3-2 Comparison of Peer City Population Densities and Transit Ridership
SOURCE: IbI GROUP, bASED ON TAC URbAN TRANSPORTATION INDICATORS – FOURTH SURVEy AND CUTA 2009 URbAN TRANSIT STATISTICS. NOTE THAT TAC USES ExISTING URbAN AREAS FOR ITS POPULATION AND DENSITy CALCULATIONS, WHICH IS DIFFERENT FROM bUILT AREA DENSITy CALCULATIONS IN THE PREVIOUS SECTION.
Transportation Master PlanWinnipeg
16
Roads
Winnipeg is unique in that there are no major expressways through the City.
Winnipeg’s road network (Map 1) is intended to accommodate pedestrians, cyclists,
transit, motorists and goods movement. it consists of local streets that primarily provide
access to individual properties, collector roads that primarily connect adjacent land use
and secondarily provide through traffic movement for shorter distance trips, and arterial
roads that primarily provide traffic movement across the city. This is advantageous in that
the “barrier effect” created by expressways in some other cities has been avoided to a large
extent; on the other hand, it can significantly limit the efficiency of the network for longer
distance trips and goods movement.
a number of strategic road network projects have allocations included in the city’s
2012-2016 five-year capital forecast, such as the Louise bridge, Pembina Highway cn
underpass, and Waverley street cn rail grade separation. other roadway infrastructure
projects, such as the Plessis road cn rail grade separation (north of Dugald road), William
r. clement Parkway Extension to bishop grandin boulevard, the bishop grandin boulevard
Extension Easterly from Lagimodiere boulevard, and an additional road link to East st. Paul
(an initiative by the rural municipality of East st. Paul), have been contemplated but do
not have allocations in the 2012-2016 five-year capital forecast for further conceptual or
preliminary design.
The primary system of movement for vehicles to and from surrounding regional
Municipalities and beyond the capital region is the provincial highway system.
Transit
Since 2002, Winnipeg Transit ridership has increased at annual levels of 1% to 3% but costs per capita have remained stable. This is in part a reflection of efforts to improve the efficiency and attractiveness of transit.
The city of Winnipeg is served by Winnipeg Transit, providing a network of 89 routes
throughout the city: 54 conventional routes, 28 express routes, 3 downtown shuttles,
and 4 demand-response suburban routes. in 2009, Winnipeg Transit served 43,870,050
(canadian urban Transit association, 2009) transit trips with a fleet of 545 vehicles. in
addition, Winnipeg’s Handi-Transit provides services for those with physical disabilities and,
in future, those with cognitive disabilities. The Handi-Transit service performs registration,
scheduling, and trip confirmation functions. service delivery is contracted out to 11
contractors operating accessible sedans and vans.
In total, Winnipeg has approximately 6,500 lane-kms of roadway, or an estimated 9.7 lane-kms per thousand residents. More than half, 3,710 lane-kms, are local roads, with 1,050 and 1,762 lane-kms of collector roads and arterial and multi-lane streets, respectively, making up the rest of the roadway network.

03 Current and Future Conditions
While the annual number of transit trips has been increasing, the market penetration of
transit in Winnipeg, as measured by trips per capita, is still low in comparison with peer
transit systems – 77% of that achieved in calgary and Edmonton and 57% of that in ottawa.
However, it should be noted that the way in which ridership is measured varies from city to
city and service area population is sometimes difficult to define, especially when there are
large park-and-ride lots serving rural populations outside the service area.
The cost-recovery rate of Winnipeg Transit is high in comparison with other transit systems,
although average fares are similar. for many years Winnipeg’s revenue/cost ratio has
been around 60%, compared with ottawa (43%), Edmonton (44%) and calgary (52%).
However, while a high cost-recovery factor is beneficial in terms of municipal finances,
there can be unintended consequences in terms of overall service provision. While in the
case of Winnipeg, the high revenue/cost ratio is attributable in part to the efficiency of the
operation, it may also be attributable to the lack of investment in off-peak services (peak
services in general have a higher cost-recovery than off-peak services). in some suburban
parts of Winnipeg, headways are quite long (30 to 60 minutes) during off-peak periods,
which makes it difficult to attract new riders.
one of the most significant enhancements to the transit system over the past few years has
been the development of “Transit Quality corridors”. Quality corridors essentially utilize
a combination of traffic signal optimization, geometric improvements at intersections,
diamond lanes, queue jump lanes, transit priority signals, and queue bypass lanes to
improve bus travel times. Major stops in these corridors have been upgraded with new
shelters (many heated), benches, posted route and schedule information, and new signage.
Quality corridors implemented to date include Pembina Highway, st. Mary’s road, st.
anne’s road, Henderson Highway, regent/nairn, McPhillips street, Portage avenue, Main
street and Marion/goulet.
Winnipeg Transit is also a leader in the use of modern technology to provide passenger
information. a new automatic vehicle location (avL) system, called “ibus” has been
installed on all transit vehicles. With this gPs-based system in place, a suite of passenger
information tools, marketed as “TransitTooLs”, has been implemented to provide real-time
passenger information.
Active Transportation
Winnipeg has been expanding its active transportation network.
active Transportation (aT) refers to any human-powered mode, which mainly includes
walking, cycling and rolling. The first major stride towards implementing active
transportation policy in the city of Winnipeg was the council approval of the active
Transportation study in 2006. The approved study served as a resource in formulating
Transportation Master PlanWinnipeg
18
future active transportation policies and programs for the city of Winnipeg. along with
the approval of the study was a directive to develop an implementation Plan based on
the guiding principles of the active Transportation study. The implementation Plan was
prepared by the Department of Public Works and adopted by council in april 2007.
since 2007, the city has been expanding the aT network significantly. for example, funding
for aT capital projects in 2009 was more than $3 million, compared to $300,000 in 2006.
Existing and funded aT network includes about 150 kilometres of multi-use pathways, 61
kilometres of neighbourhood pathways and 64 kilometres of bike lanes, sharrows and bike
boulevards, for a total of 274 kilometres of aT facilities.
The tri-level government stimulus program announced in late 2009 resulted in $20.4 million
to expand the network to 375 kilometres in 2010/2011.
Despite these investments, there are still many gaps and deficiencies in the aT network
that need to be addressed including ensuring that the sidewalk network is complete and
accessible for all residents.
Goods Movement
Winnipeg is a key intermodal and freight hub due to its geographical location.
Winnipeg is a destination on the main lines of the cPr, cn and bnsf railway networks,
and provides direct connections to u.s. rail corridors. cn’s symington yard is one of the
largest in the world, with a capacity of over 3,500 rail cars. Winnipeg is also home to large,
key cPr facilities and over 2,000 cPr employees. There are over 1,800 lane-kilometres of
designated truck routes and more than 40 million goods movement trips are made within
and through the city on an annual basis.
Travel Demand
Over 2 million daily trips are made in Winnipeg.
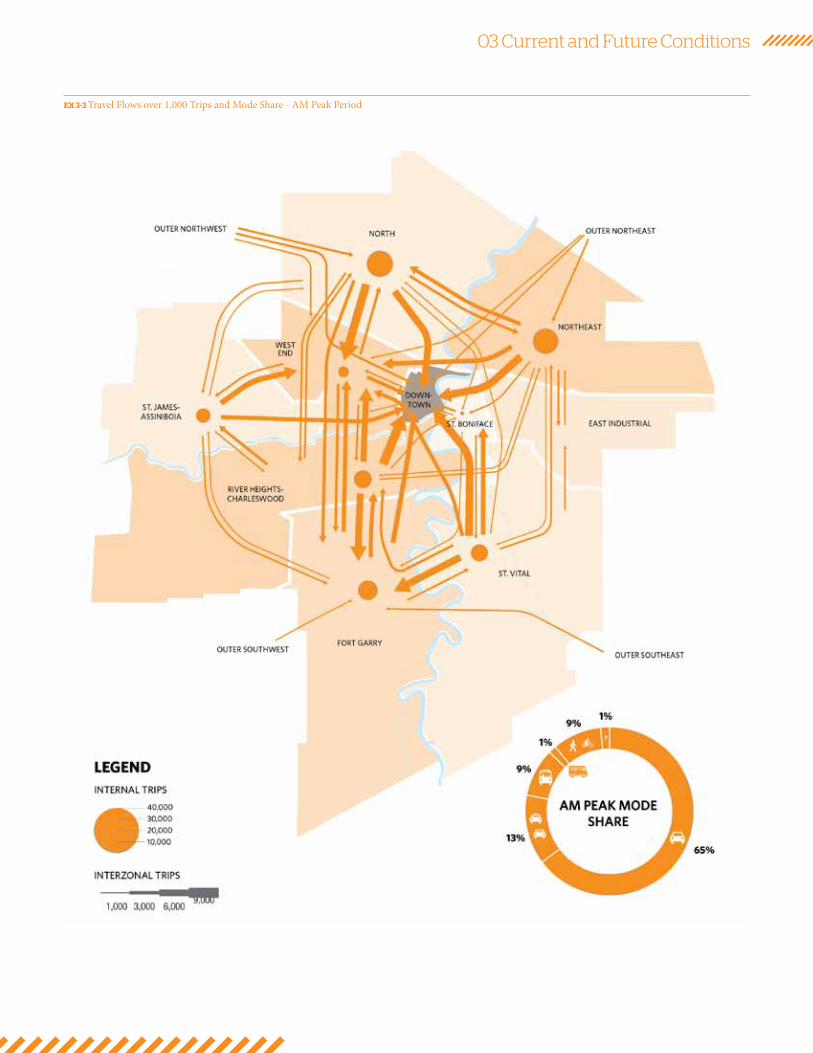
about 310,000 trips, or 15%, are made between 7:00 a.m. and 9:00 a.m. (aM peak
period); with 88% of morning trips remaining in the city. key travel patterns in the aM
peak period over a ten-zone system are summarized in EX 3-3. Major destinations include
Downtown Winnipeg and industrial and commercial areas in the vicinity of the airport. Large
proportions of aM peak period trips are internal to each zone include school trips and other
potential short trips.
Data from the Winnipeg area Transportation study show auto drivers hold a 65% share of
morning peak period trips with an additional 13% share for car passengers and taxis (EX
3-3). Transit and non-motorized trips account for 9% each of morning trips.
03 Current and Future Conditions
EX 3-3 Travel Flows over 1,000 Trips and Mode Share - AM Peak Period
Transportation Master PlanWinnipeg
20
3.2 Future base Case Conditions
Population, Employment and Demographics
Including surrounding areas, the Winnipeg Census Metropolitan Area (CMA) is forecast to be home to nearly a million people by 2031.
The population of the city of Winnipeg is expected to grow to approximately 850,000 by
2031, an increase of 31% from 2006. similarly, the population in the rest of the Winnipeg
census Metropolitan area (cMa) is expected to grow to approximately 103,000, an
increase of 78% from 2006. This rate of growth is unprecedented and it will present a
significant challenge for decision makers on where the growth is accommodated and what
the growth will look like. Most of this growth is expected to be realized through international
immigration, with a net rate of approximately 10,000 new residents per year toward the end
of the planning horizon .
in terms of economic growth, Winnipeg’s gross domestic product (gDP) is projected to
grow at an average of 2.5% compounded annually to 2031. The unemployment rate is
expected to fall to 4.2% by 2031, compared to 4.4% in 2006, with a slight decrease in
participation rate due to an aging population and early retirement.
it is forecasted that 88,000 new jobs will be created in the city of Winnipeg and
surrounding areas by 2031. The majority of these jobs will be in the service industry or
targeted to key strategic sectors including manufacturing and financial services.
Like other Canadian cities, Winnipeg will experience large changes in the age distribution of the population over the next 20 years.
by 2031, the number of people of 60 and over is forecast to increase from 18% of the
population to 23%. This shift will have implications for accessibility to transit. More focus
will be required on providing services for people with special needs and to achieve this
within a manageable budget.
Two other demographic trends that should be noted are the increases in immigrants and
of the aboriginal community in Winnipeg. The city must shape and market itself to be
attractive to migration and immigration to draw and maintain highly skilled and desirable
workforce and employers. a balanced transportation system with a high degree of mobility
choice is a key determinant to locational decisions by immigrants and migrants.

03 Current and Future Conditions
Implications of Growth
If current trends in household size and vehicle ownership continue through 2031, there will be over 100,000 new households and over 120,000 additional cars.
forecasts of population and employment growth based on current development trends
show that there will be continued pressure to grow outward. This will result in travel flows
becoming more dispersed in the future.
Major employment developments and continued expansion of industrial areas in the outer
areas will shift travel from traditional destinations such as Downtown. shifting employment
patterns will draw a portion of transit commuters away from areas that currently enjoy
high levels of transit use from commuter traffic such as Downtown and areas near the
Downtown. To maintain transit mode shares and maintain a vibrant Downtown and near-
downtown areas, attention must be paid to transit service provision and enhancements to/
from these areas.
increased population and employment will also result in increased auto trips and increased
congestion on Winnipeg streets. an increase of 50% in vehicle-kilometres traveled in
the morning peak hour is anticipated. although in general, the planned road network can
accommodate trip growth without significant congestion, there will be choke points where
travel demand will exceed capacity, particularly at limited access locations such as river
and railway corridor crossings. However, these locations also present an opportunity for
solutions such as transit lanes to allow buses to have priority access through these choke
points, which would provide travel time savings for transit users. These choke points also
provide an opportunity for applications that advise motorists on how to modify their travel.
Transportation Master PlanWinnipeg
22
3.3 Alternative Land Use and Transportation Scenarios
Land Use Scenarios
Winnipeg has a unique opportunity over the next 20 years to shape how and where the city
grows. The ourWinnipeg process articulates a vision which defines an urban structure and
establishes a framework to enable development that supports this vision. This vision is based
on the concept that the city is made up of transformative areas and areas of stability, both
of which will accommodate growth, albeit different types of growth. To achieve this vision,
much work will have to be done to fully implement the plan, including the development of
a supportive transportation network that provides sustainable transportation choices to all
areas of the city.
as part of the TMP, several combinations of land use and transportation scenarios were
examined and tested using a state of the art travel demand model developed for this purpose.
The objective of this exercise was not to recommend a preferred land use scenario, but to
examine how various sustainability indicators respond to different land use and transportation
inputs, and to use these to guide the development of transportation networks and policies.
four land use scenarios involving increasingly concentrated growth forms were examined.
all of the land use scenarios are based on a supply and demand forecast. The demand for
housing and jobs is a constant across all of the scenarios and is based on conference board
of canada population and housing projections to 2031. The supply of dwelling units and jobs
varies across the scenarios, in both quantity and location.
SCENARIO 1 - PLAN WINNIPEG SCENARIO
This scenario is a business as usual scenario of growth for the city of Winnipeg. The former
development plan, Plan Winnipeg 2020 vision, is assumed to be in force and that Policy
Plate a remains as the land use strategy. The scenario does assume that some of the lands
identified on Plate a as rural will be redesignated to neighbourhood over time as the existing
neighbourhood lands develop. The development densities used in this scenario are based on
the low end of densities identified in background research completed for the city of Winnipeg
and on recent applications for development within the city. in this scenario, the city’s supply
of dwelling units falls short of the projected demand by approximately 20,000 dwelling units.
This shortfall consists primarily of multi-family units which the conference board projections
identify as a dwelling type for which demand will continue to grow. This demand for housing
units would not disappear and people would have to find substitute housing options. options
could be other forms of housing within the city such as single family homes or perhaps
housing outside the city. This scenario results in the development of the majority of land
available within the city without providing dwellings for the projected population.
03 Current and Future Conditions
SCENARIO 2 – OURWINNIPEG ADOPTION
This scenario illustrates a possible growth for the city following the guidance of the urban
structure identified in ourWinnipeg and complete communities. in this scenario, the
complete communities urban structure map replaces Plan Winnipeg 2020 vision Plate a
as the land use strategy for the city. Development densities consistent with the low end of
densities identified in the city’s background research and recent development applications
are applied to new communities. This scenario also adds residential capacity to a number
of transformative areas identified in complete communities. The supply of dwelling units in
this scenario falls short of the projected demand for multi-family units. There is remaining
capacity in the scenario but the dwelling types do not match the demand. This leaves some
areas vacant and available for development or only partially developed in 2031.
SCENARIO 3 – OURWINNIPEG ADOPTION AND IMPLEMENTATION
scenario 3 illustrates a possible development scenario for the city if the vision of
ourWinnipeg and complete communities are pursued with the tools and strategies
that they describe. This scenario follows the same urban structure as scenario 2 but
development densities are generally increased across the board. The densities used in this
scenario are based on the high end of densities identified in the city’s background research,
recent development applications, and Winnipeg’s Transit oriented Development Handbook,
as well as targets from other cities in canada. The supply of dwellings exceeds the projected
demand for all dwelling types and a significant capacity for development remains in 2031.
SCENARIO 4 – OUR WINNIPEG ADOPTION AND FOCUSED IMPLEMENTATION
scenario 4 illustrates another possible development scenario for the city if the vision of
the new development plan and complete communities are pursued with the tools and
strategies that they describe in a more focused way. This scenario focuses the development
of multi-family dwellings in the downtown, in mixed-use centres, along arterial corridors,
and in major redevelopment sites. This scenario follows the same urban structure as
scenario 2 and 3 and development densities are the same as scenario 3. identifying areas
in which to focus development changes the distribution of growth within the city for the
next 20 years and in turn will influence the delivery of city services and the expansion or
enhancement of city networks. The supply of dwellings exceeds the projected demand for all
dwelling types and a significant capacity for development remains in 2031.
Transportation Master PlanWinnipeg
24
Transportation Scenarios
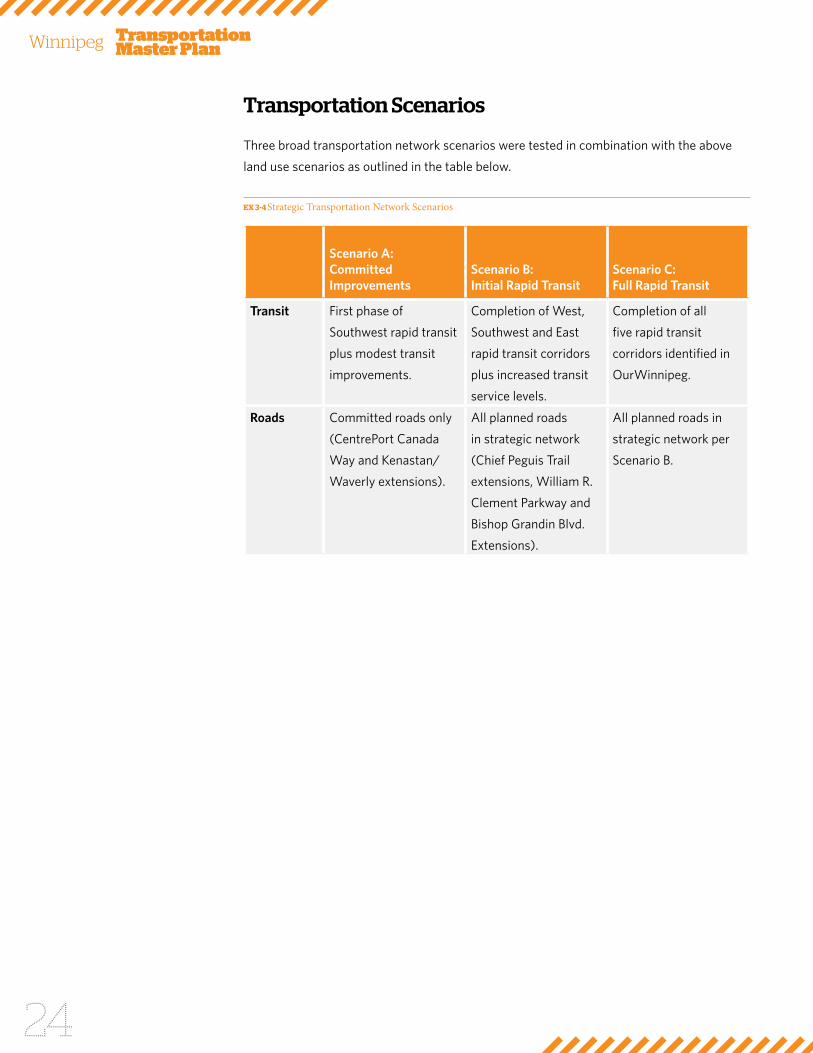
Three broad transportation network scenarios were tested in combination with the above
land use scenarios as outlined in the table below.
EX 3-4 Strategic Transportation Network Scenarios
Scenario A: Committed Improvements
Scenario B: Initial Rapid Transit
Scenario C: Full Rapid Transit
Transit first phase of
southwest rapid transit
plus modest transit
improvements.
completion of West,
southwest and East
rapid transit corridors
plus increased transit
service levels.
completion of all
five rapid transit
corridors identified in
ourWinnipeg.
Roads committed roads only
(centrePort canada
Way and kenastan/
Waverly extensions).
all planned roads
in strategic network
(chief Peguis Trail
extensions, William r.
clement Parkway and
bishop grandin blvd.
Extensions).
all planned roads in
strategic network per
scenario b.
03 Current and Future Conditions
Implications
The general conclusions of the assessment of integrated land use and transportation
scenarios are as follows:
• in order to support rapid transit, densities in the mixed-use corridors, mixed-use
centres, and major redevelopment sites will need to be increased. This can be achieved
through the application of policies and tools under ourWinnipeg and complete
communities.
• The land use scenario involving significantly higher concentration of land use (scenario
4) would further support rapid transit and other sustainable transportation objectives.
• The completion of the strategic road network is required to maintain the integrity of
Winnipeg’s transportation system for goods movement, and does not undermine the
goals of sustainable transportation.
• it is appropriate to plan for rapid transit in multiple corridors.
The land use and transportation scenarios included in the modeling all show a growth
in automobile use, associated congestion, as well as increased greenhouse gas (gHg)
emissions. given the status quo assumptions for car ownership, household size, and the
forecasted growth in population this is to be expected. While reductions in the energy
intensity of Winnipeg’s transportation system and per capita gHg emissions are possible
outcomes of some of the modeled land use and transportation scenarios, the anticipated
significant population growth will challenge Winnipeg to achieve an overall reduction in
gHg emissions. This emphasizes the importance of implementing the holistic approach to
transportation choice described in section 5.0.
Transportation Master PlanWinnipeg
26
3.4 Network Constraints and Opportunities
Winnipeg’s transportation system is functioning reasonably well, accommodating peak
demand, although congestion levels are high in some specific areas during weekday peak
periods. This can be attributed to the city’s early planners, who laid out wide rights-of-way
that have been expanded in response to growth. in addition, the city’s period of slow growth
in the 1990s meant that travel demand growth was not as great as predicted when the road
network was planned in the 1960s and 1970s. There are, however, constraints to the city’s
transportation system that must be considered when developing long-term transportation
policy, which are illustrated on Map 3.
With two major rivers, the assiniboine and red, and both the cn and cPr mainlines passing
through the city, congestion in Winnipeg is generally isolated to river and railway crossings
and the downtown. The limited number of river crossings result in recurrent congestion at
some bridges, but usually only during peak periods.
in addition, while several railway-road crossings are grade separated, others remain at-
grade. rail traffic is expected to increase as Winnipeg grows its freight transportation sector,
which will lead to more frequent blockages of roadways at at-grade crossings. as travel
demand on the roads increase, bottlenecks may also form at existing at-grade crossings,
leading to congestion. again, these delays will occur mainly during peak periods.
as grade separations of both waterways and railways are capital intensive, crossings
will remain a major network constraint in Winnipeg. in addition, some structures are
approaching the end of their life cycles, raising the need to rehabilitate, reuse, or replace.
gaps in the active transportation network are also seen as a present network constraint,
making it difficult for those on foot or bicycle to efficiently travel to their destination.
Dedicating road space at existing river and rail crossings, new aT-only crossings, or adaptive
reuse of structures are all approaches that could be taken to improve active transportation
connectivity. bridging gaps with the regional trail network can also increase access to
surrounding communities and recreational opportunities.
Refer to MAP 3
03 Current and Future Conditions
forecasted congestion in Winnipeg, also shown on Map 3, will introduce new constraints
on the transportation system. Most of this new congestion is expected in the periphery of
the city, predominantly resulting from the growth of freight traffic bypassing the city core,
development of new communities within Winnipeg, and increased flow of commuters from
communities outside of Winnipeg. Much of this congestion could be mitigated if action
is taken today to plan for providing attractive, competitive transportation alternatives to
reduce the reliance on single-occupant vehicle travel in these areas. new communities must
be built to support and encourage walking, cycling, and transit. as well, implementation of
intelligent Transportation systems (iTs) could improve the efficiency of the existing road
network.
The recommendations contained in the remainder of this TMP aim not only to address the
observed and predicted constraints to how we move around Winnipeg, but also to achieve
the sustainable vision of ourWinnipeg and provide the greatest quality of life for all citizens.
04 Integrating Transportation and Land Use
4. Integrating Transportation and Land Use
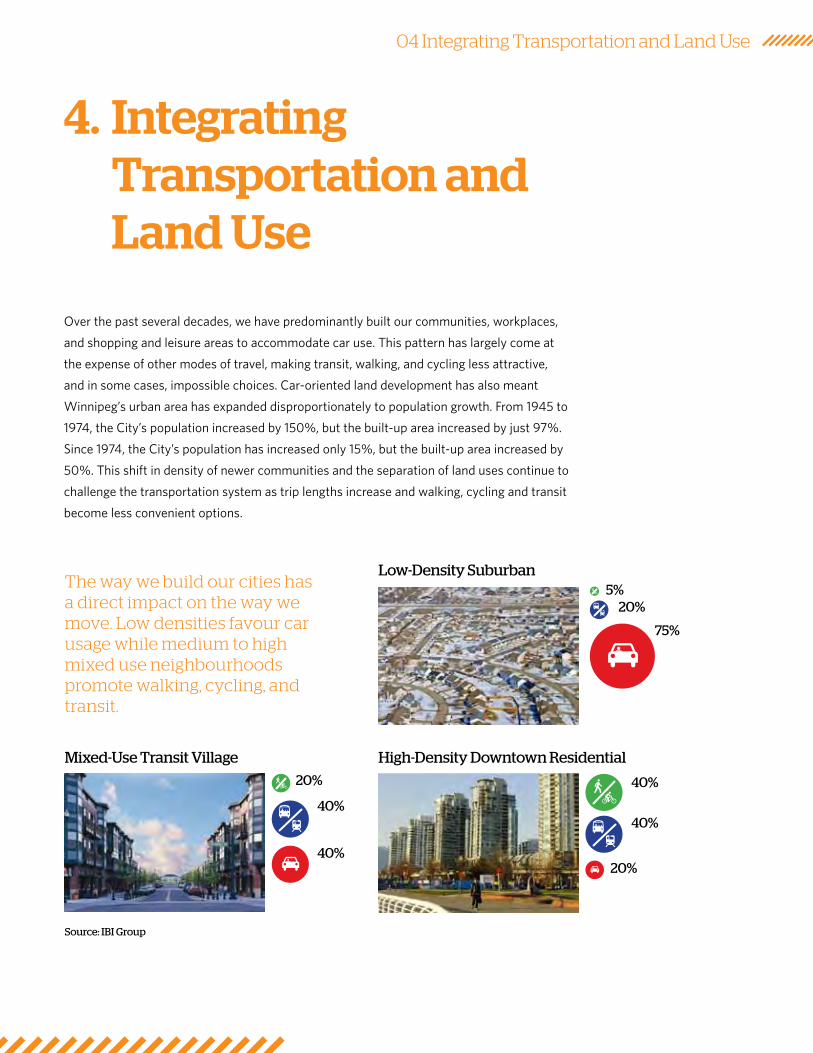
over the past several decades, we have predominantly built our communities, workplaces,
and shopping and leisure areas to accommodate car use. This pattern has largely come at
the expense of other modes of travel, making transit, walking, and cycling less attractive,
and in some cases, impossible choices. car-oriented land development has also meant
Winnipeg’s urban area has expanded disproportionately to population growth. from 1945 to
1974, the city’s population increased by 150%, but the built-up area increased by just 97%.
since 1974, the city’s population has increased only 15%, but the built-up area increased by
50%. This shift in density of newer communities and the separation of land uses continue to
challenge the transportation system as trip lengths increase and walking, cycling and transit
become less convenient options.
Low-Density Suburban5%
20%
75%
20%
40%
40%
Mixed-Use Transit Village
20%
40%
40%
High-Density Downtown Residential
The way we build our cities has a direct impact on the way we move. Low densities favour car usage while medium to high mixed use neighbourhoods promote walking, cycling, and transit.
Source: IBI Group
Transportation Master PlanWinnipeg
30
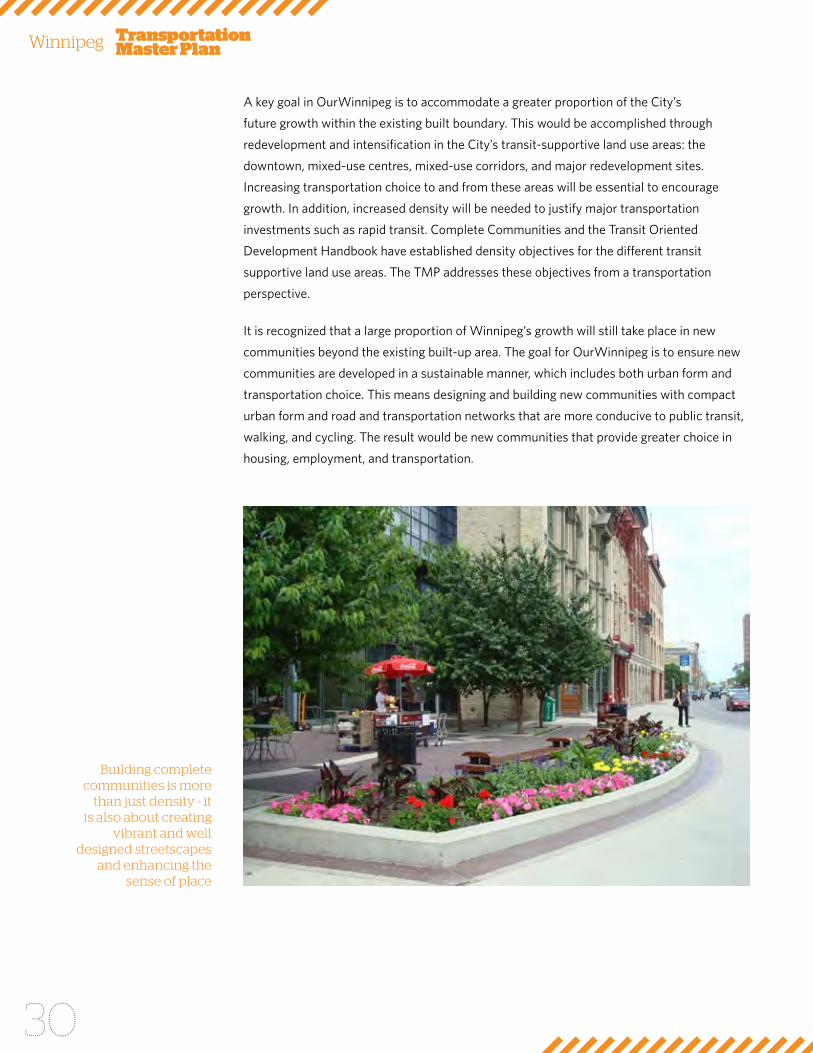
a key goal in ourWinnipeg is to accommodate a greater proportion of the city’s
future growth within the existing built boundary. This would be accomplished through
redevelopment and intensification in the city’s transit-supportive land use areas: the
downtown, mixed-use centres, mixed-use corridors, and major redevelopment sites.
increasing transportation choice to and from these areas will be essential to encourage
growth. in addition, increased density will be needed to justify major transportation
investments such as rapid transit. complete communities and the Transit oriented
Development Handbook have established density objectives for the different transit
supportive land use areas. The TMP addresses these objectives from a transportation
perspective.
it is recognized that a large proportion of Winnipeg’s growth will still take place in new
communities beyond the existing built-up area. The goal for ourWinnipeg is to ensure new
communities are developed in a sustainable manner, which includes both urban form and
transportation choice. This means designing and building new communities with compact
urban form and road and transportation networks that are more conducive to public transit,
walking, and cycling. The result would be new communities that provide greater choice in
housing, employment, and transportation.
Building complete communities is more
than just density - it is also about creating
vibrant and well designed streetscapes
and enhancing the sense of place
04 Integrating Transportation and Land Use
KEy DIRECTION The integration of transportation and land use planning ensures that
the vision for land use development for Winnipeg, as articulated in
OurWinnipeg and Complete Communities is achieved by providing a
transportation network that supports the urban structure and the concept
of complete communities.
DIRECTION ONE
Ensure that land use and transportation decision making tools, including
procedures, standards, and guidelines, are structured to reflect an integrated
consideration of land use and transportation issues.
ENAbLING STRATEGIES
a) review current processes undertaken to coordinate land use, economic development,
and transportation planning, and update as required to reflect a more integrated
approach.
b) finalize and adopt new guidelines for the preparation of transportation impact studies.
c) review proposed transportation projects and programs to ensure they support the
concept of complete communities and the urban structure.
d) Explore opportunities to utilize transportation investments to leverage development
potential in transformative areas.

05 Transportation Choice
5. Transportation Choice
Today, the predominant mode of travel in the city of Winnipeg is by private automobile,
a trend that began in the 1960s as development patterns became more auto-oriented.
relatively slow growth in the recent past has spared Winnipeg from the congestion being
experienced in fast growing urban centres; however, with forecasted increases in growth,
Winnipeg has the opportunity to find a different means of accommodating more people and
more travel demand.
Providing greater transportation choice will be the key to reducing Winnipeg’s reliance on
automobile travel. The city has already moved toward increased choice by investing in
quality transit corridors, taking the first steps toward rapid transit, and pursuing significant
improvements to the active transportation network. by increasing transportation choice, the
quality of life, economic vitality, and system efficiency can be significantly improved.
KEy DIRECTION Providing opportunities to access multiple modes of transportation to
people of all ages and abilities will improve the quality of life, economic
vitality, and system efficiency.
The following sections outline several opportunities to enhance and improve travel choice.
section 5.1 has general applicability to the transportation system, while sections 5.2 to 5.4
discuss mode-specific initiatives.
Transportation Master PlanWinnipeg
34
5.1 General Applicability
5.1.1 Accessibility and Universal Design
according to statistics canada’s Participation and activity Limitation survey, approximately
16% of Manitoba’s population has some form of disability, a rate that increases to 48%
when factoring in only the population over the age of 65. rates of disability are expected
to increase dramatically in the future, presenting significant challenges for ensuring the
transportation system remains equally accessible to everyone.
Winnipeg’s infrastructure was predominantly constructed in a period when universal design
and accessibility were not broadly recognized. in recent years, increased attention to the
needs of persons with disabilities has led to advances in ensuring new construction is
universally accessible and developing programs to retrofit existing infrastructure.
in 2001, Winnipeg city council passed a universal Design Policy, which requires all new
and substantial renovations of civic buildings and infrastructure to follow universal Design
criteria. from this policy, the city also developed the universal Design guiding Principles
and subsequently accessible Design standards which provide guidance to create an
accessible built environment.
The city’s policy on universal Design builds on the following ideas:
• That all people in a community must be considered and understood when providing
an integrated public service. Diverse and inclusive communities are what make us an
exciting and vibrant community.
• That providing people with choices that help them use their environment in a functional
and respectful way creates an inclusive city.
• That ensuring our environment is easy to navigate and clearly understood creates a
welcoming city.
• That safety is integral in an accessible city.
• That Winnipeg is a comfortable place for everyone to live, visit, do business and play in.
Through consultation with persons with disabilities and advocacy groups, many issues
still persist in creating a barrier-free transportation system. accessibility of public transit
continues to improve with continued expansion of the Easy access route network and
introduction of new features such as automatic stop announcements. nevertheless, public
transit is still seen as a key issue in creating a universally accessible transportation network.
05 Transportation Choice
DIRECTION ONE
Ensure that transportation projects, programs, and initiatives reflect
accessibility and universal design principles.
ENAbLING STRATEGIES
a) include accessibility and universal design implications in project scoping, to ensure
adequate budget and design requirements are considered at all stages – planning,
design, implementation and maintenance.
b) Demonstrate leadership in transportation projects by incorporating barrier-free and
universal design principles.
c) continue to provide capital funding to retrofit existing infrastructure to remove barriers
to access in the transportation network.
d) identify accessibility barriers in the transportation network as part of integrated
planning processes.
e) Ensure that transportation policies and implementation tools (procedures, guidelines,
standards, etc.) related to universal design and accessibility are monitored and updated
to ensure consistency with current understanding of accessibility needs.
Transportation Master PlanWinnipeg
36
5.1.2 Transportation Demand Management
Transportation demand management (TDM) policies and programs work to influence
whether, why, when, where and how people travel. implementation of TDM can focus
on marketing, education, or improvements to infrastructure that support a reduction in
travel demand (overall or at specific times of the day) or a shift of that demand to other
modes such as walking, cycling or transit. TDM can provide economic, environmental and
social benefits, in that it can help to reduce or defer the need for major road infrastructure
improvements, reduce emissions and congestions, and improve public health and
accessibility of employment opportunities.
DIRECTION ONE
Develop and implement a series of TDM policies and programs.
ENAbLING STRATEGIES
f) require TDM plans as part of transportation impact studies.
g) Prepare TDM plans for major transportation projects.
h) Develop an internal TDM strategy.
i) support innovative parking strategies that allow for reductions in parking space
requirements.
DIRECTION TWO
support community stakeholders in the development and implementation of
TDM initiatives.
ENAbLING STRATEGIES
j) Provide multi-modal network information, directions, alerts, and assistance to enable
efficient use of the transportation system.
k) support an integrated approach to marketing sustainable travel to optimize the value of
investments in transit and active transportation.
l) Partner with transportation-sharing programs (e.g. car sharing, bike sharing) to promote
these services to residents and visitors, and facilitate their growth and long-term
viability.
m) Encourage carpooling and high-occupancy vehicle travel.
05 Transportation Choice
n) continue to support existing sustainability programs in school transportation.
o) collaborate with the neighbourhoods to develop a local approach to traffic calming.
p) continue to partner with organizers of large events to provide a broad range of travel
options to attendees.
5.1.3 Complete Streets
complete streets are designed and operated to balance the safety and mobility needs of all
users, respecting the relative regional and localized context of the street within the urban
structure. Determining how any given street (or portion thereof) can become a complete
street requires a good understanding of each mode’s functional requirements related to that
street in it’s local context and in each mode’s broader network context. Pedestrians, cyclists,
transit users, and motorists of all ages and abilities are able to safely move along and across
a complete street. by improving opportunities for other modes of travel, complete streets
can also reduce dependence on automobiles and enhance economic and urban development
opportunities.
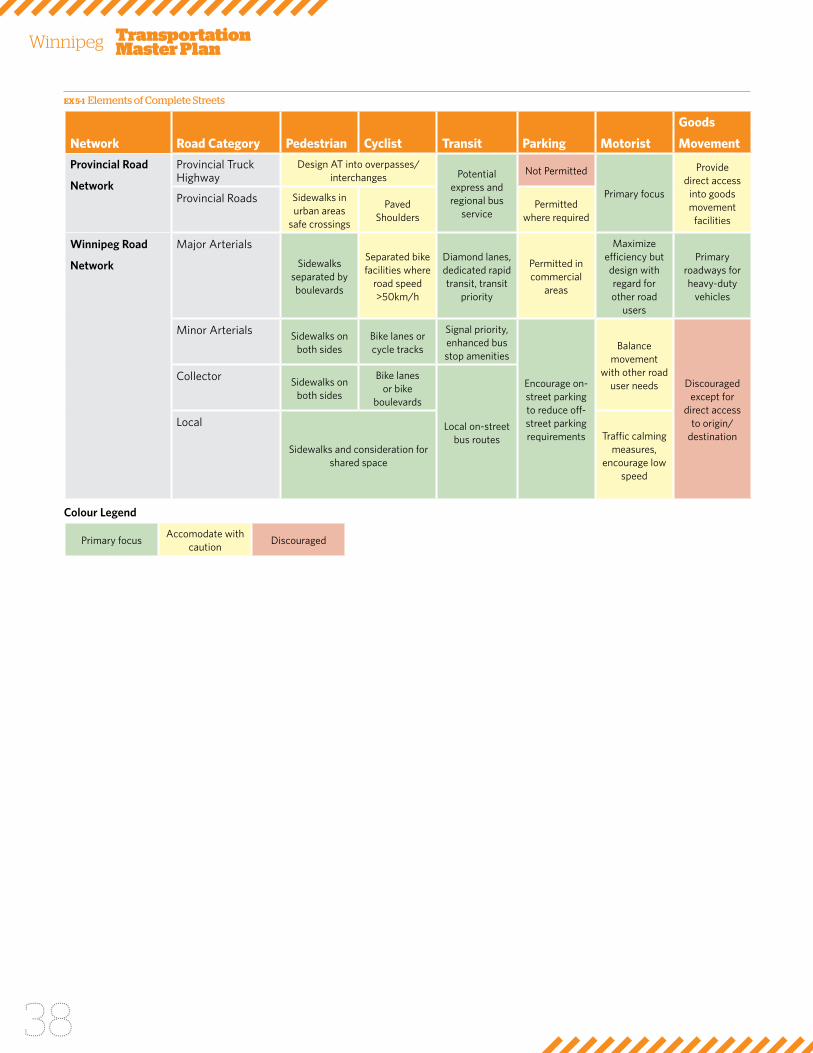
complete streets can include a variety of features: road narrowing, on-street parking,
bicycle lanes, bus lanes, sidewalk expansion, streetscape, speed limit reductions. EX 5-1
demonstrates potential approaches to accomodate different modes and develop complete
streets within a traditional road classification framework.
To expand the range of mobility options, a complete streets strategy would guide the
expansion, reconstruction, rehabilitation, maintenance, and operation of the street network.
DIRECTION ONE
balance the needs of all users of the street to support complete communities
and the urban structure.
ENAbLING STRATEGIES
q) Develop the complete streets strategy in consultation with interested stakeholders.
r) align the strategy with the road network classification system described in section 5.4.
s) Develop the complete streets strategy in consultation with interested stakeholders.
t) incorporate into the strategy the need to ensure that encroachments into the right-
of-way balance the public good, private needs, street operations, and safety. Potential
strategies to accommodate different modes and complete streets features are
presented in EX 5-1.
Transportation Master PlanWinnipeg
38
EX 5-1 Elements of Complete Streets
network road category Pedestrian cyclist transit Parking motorist
goods
movement
Provincial Road
Network
Provincial Truck Highway
Design aT into overpasses/interchanges Potential
express and regional bus
service
not Permitted
Primary focus
Provide direct access
into goods movement
facilities
Provincial roads sidewalks in urban areas
safe crossings
Paved shoulders
Permitted where required
Winnipeg Road
Network
Major arterials
sidewalks separated by boulevards
separated bike facilities where
road speed >50km/h
Diamond lanes, dedicated rapid transit, transit
priority
Permitted in commercial
areas
Maximize efficiency but design with regard for other road
users
Primary roadways for heavy-duty
vehicles
Minor arterials sidewalks on both sides
bike lanes or cycle tracks
signal priority, enhanced bus stop amenities
Encourage on-street parking to reduce off-street parking requirements
balance movement
with other road user needs Discouraged
except for direct access
to origin/destination
collector sidewalks on both sides
bike lanes or bike
boulevards
Local on-street bus routes
Local
sidewalks and consideration for shared space
Traffic calming measures,
encourage low speed
Colour Legend
Primary focusaccomodate with
cautionDiscouraged
05 Transportation Choice
5.2 Active Transportation
active transportation (aT) can provide safe, affordable, and efficient transportation
opportunities for people to incorporate physical activity into their daily lives and gain
associated health benefits. along with the personal health benefits of increasing
active modes of travel, come the broader community benefits – reduced greenhouse
gas emissions, improved air quality and maximizing the use of existing infrastructure.
a transportation network that supports active modes also supports the concept of
complete communities by providing transportation choice while improving neighbourhood
connectivity and vitality.
although walking and cycling are the predominant active modes, rolling, paddling, skating,
and skiing - while typically more season specific - are also ways in which people self-propel.
including infrastructure for active modes of travel is crucial to making active transportation
a competitive travel option within Winnipeg and the broader region. The needs of aT
network users can vary significantly. The active mode choice, as well as, the age and ability
of the users, and the primary purpose of the trip – for recreation or primarily to get from
point a to point b, can significantly change the needs of the network users.
over the past decade significant momentum has been gained active Transportation. Major
achievements in that time period include:
• approval of the 2005 active Transportation (aT) study and associated implementation
Plan,
• appointment of an active transportation coordinator,
• Establishment of an active transportation advisory committee (aTac),
• increased capital budget for annual aT action plans,
• Leveraged significant funds from other levels of government to expand the network, and
• increased public awareness of aT initiatives.
With many recent efforts having focused primarily on cycling, a more specific focus on
pedestrian network improvements is required to provide a broader range of aT mode
options and to promote a city and a transportation system that is accessible to all.
Refer to MAP 4
Transportation Master PlanWinnipeg
40
KEy DIRECTIONWinnipeg’s AT networks will to be designed, maintained and developed to
ensure the accessible, safe, and efficient use for all users while balancing
the needs of the different AT modes and trip types that all share the
networks.
DIRECTION ONE
Ensure that aT networks are planned, designed, implemented and
maintained to address year-round access.
ENAbLING STRATEGIES
a) create and maintain an up-to-date database of aT facilities.
b) Develop a process to monitor effectiveness of aT networks.
c) allocate sufficient funding in future capital and operating budgets to complete the aT
networks.
d) Work with regional partners to create safe connections to the regional aT networks.
e) formalize a prioritization process for facility investments.
f) Explore opportunities to expand the aT network in rail, hydro, and other available
corridors.
g) Encourage pedestrian- and cycling-supportive site design in all developments.
h) continue to work with local school divisions and schools to establish programs that
encourage active travel to and from schools.
i) include design guidelines for a range of pedestrian and cycling infrastructure within
the aT facilities design guide to provide safe pedestrian and cycling opportunities for a
range of ages and abilities.
05 Transportation Choice
DIRECTION TWO
Work with community stakeholders to ensure that changes to aT networks
meet the needs of their respective users.
ENAbLING STRATEGIES
j) Engage with communities to mitigate conflicts between different users of the
transportation system.
k) continue to expand the information available to the general public on all aT facilities
and programs.
l) Promote programs and events that support and encourage walking, cycling, rolling,
paddling, skating, skiing, and any other form of active transportation that can safely
share the city’s transportation networks.
m) Provide or support education to all transportation system users to improve
understanding of and compliance with safe operations in the integrated transportation
system by all.
n) seek innovative and new partnerships to support aT programs and facilities.
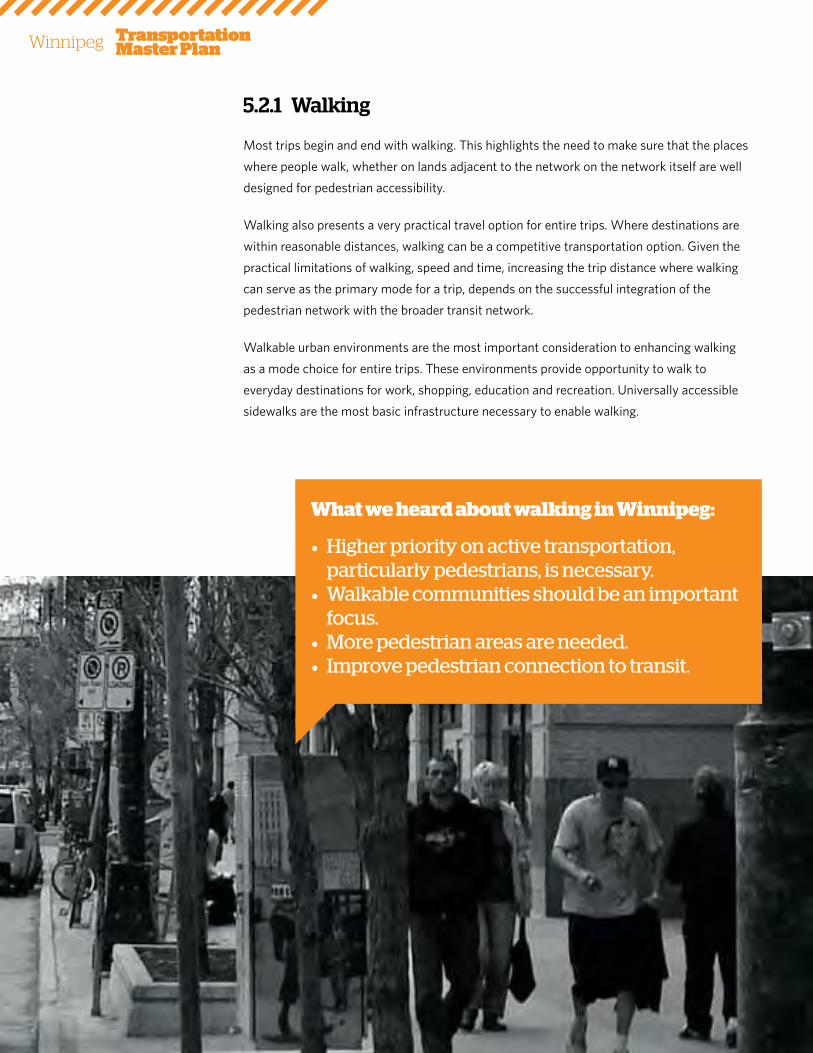
Transportation Master PlanWinnipeg
42
5.2.1 Walking
Most trips begin and end with walking. This highlights the need to make sure that the places
where people walk, whether on lands adjacent to the network on the network itself are well
designed for pedestrian accessibility.
Walking also presents a very practical travel option for entire trips. Where destinations are
within reasonable distances, walking can be a competitive transportation option. given the
practical limitations of walking, speed and time, increasing the trip distance where walking
can serve as the primary mode for a trip, depends on the successful integration of the
pedestrian network with the broader transit network.
Walkable urban environments are the most important consideration to enhancing walking
as a mode choice for entire trips. These environments provide opportunity to walk to
everyday destinations for work, shopping, education and recreation. universally accessible
sidewalks are the most basic infrastructure necessary to enable walking.
• Higher priority on active transportation, particularly pedestrians, is necessary.
• Walkable communities should be an important focus.
• More pedestrian areas are needed.• Improve pedestrian connection to transit.
What we heard about walking in Winnipeg:
05 Transportation Choice
This infrastructure when combined with neighbourhood design that incorporates a full
range of destinations, higher residential densities, and quality of urban design, provide for
environments that are deemed truly “walkable”. Walkability supports the city’s commitment
to complete communities, as the benefits of more walkable neighbourhoods where more
trips are taken by walking include improved safety resulting from more ‘eyes on the street’,
enhanced urban vitality and economic opportunities by encouraging smaller, local storefronts,
and increased social interaction.
year round maintenance of the pedestrian facilities is important to ensuring accessibility and
usability of the network. This becomes increasingly important as Winnipeg’s population ages
and factors heavily in individual mode choice.
DIRECTION ONE
Ensure that the pedestrian network is planned, designed, implemented, and
maintained to increase the competitiveness of walking as a transportation
mode choice.
ENAbLING STRATEGIES
o) Develop a city-wide pedestrian strategy that provides integrated guidance for the city’s
efforts to support pedestrian activity and connectivity.
p) Develop a strategic approach to identifying the need for and prioritization of pedestrian
amenities such as trees and street furniture.
q) coordinate pedestrian network development with urban design efforts and strategies.
r) continue and enhance incentives and funding programs to stimulate and encourage
streetscape and pedestrian realm improvements.
s) Maintain the walking network to address year-round pedestrian needs.
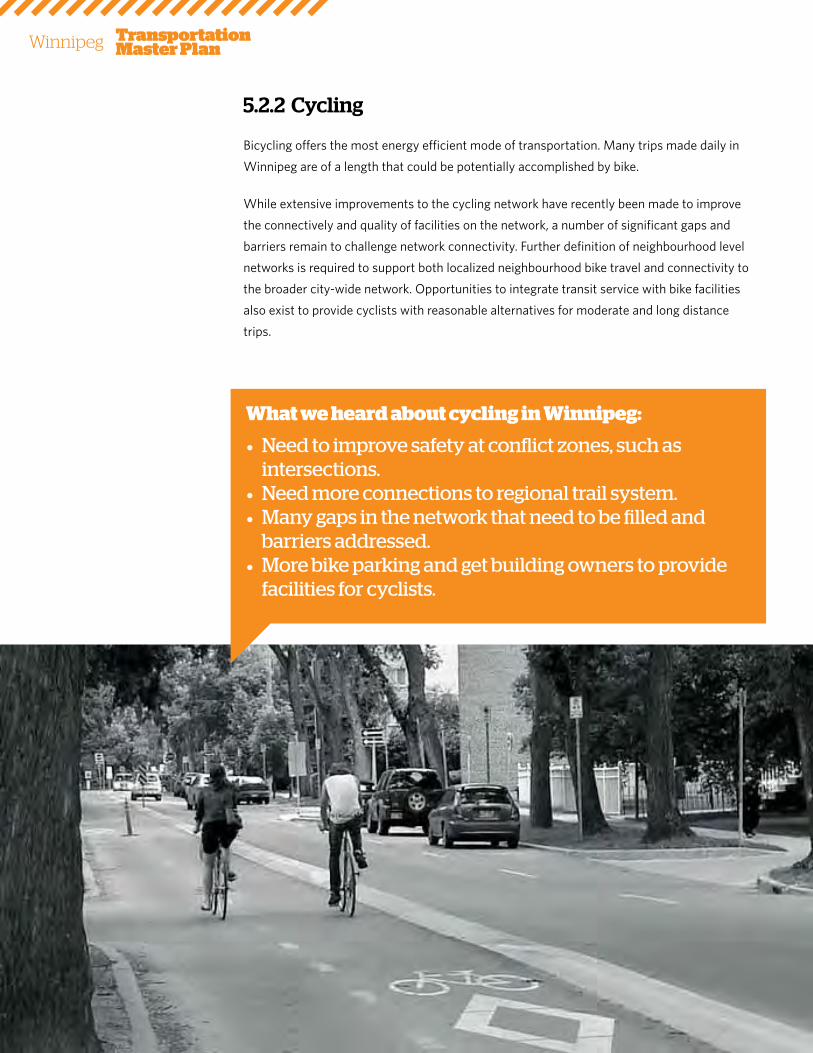
Transportation Master PlanWinnipeg
44
5.2.2 Cycling
bicycling offers the most energy efficient mode of transportation. Many trips made daily in
Winnipeg are of a length that could be potentially accomplished by bike.
While extensive improvements to the cycling network have recently been made to improve
the connectively and quality of facilities on the network, a number of significant gaps and
barriers remain to challenge network connectivity. further definition of neighbourhood level
networks is required to support both localized neighbourhood bike travel and connectivity to
the broader city-wide network. opportunities to integrate transit service with bike facilities
also exist to provide cyclists with reasonable alternatives for moderate and long distance
trips.
• Need to improve safety at conflict zones, such as intersections.
• Need more connections to regional trail system.• Many gaps in the network that need to be filled and
barriers addressed.• More bike parking and get building owners to provide
facilities for cyclists.
What we heard about cycling in Winnipeg:

05 Transportation Choice
in seeking further improvements to and use of the network, it must be acknowledged
that there is a significant range in the ages and abilities of cyclists, and that trip purpose –
recreational vs. utilitarian – also influences whether the network is deemed responsive to
user needs. Efforts to improving cycling as a viable mode will be most successful if they
include year-round maintenance of at least a core network, as well as efforts to educate
both the users of the cycling network and users of the broader network to ensure safe and
respectful interaction.
DIRECTION ONE
continually improve the city-wide cycling network (Map 4), to close
gaps, mitigate barriers and areas of conflict between cyclists and other
transportation network users.
ENAbLING STRATEGIES
t) Develop a city-wide cycling strategy that provides integrated guidance for the city’s
efforts to support cycling activity and connectivity.
u) consider the creation of a network of cycling spines or super corridors that link
the city’s main activity nodes and provide connectivity to local and regional cycling
networks.
v) Develop an all-season maintenance strategy for a core cycling network.
Seasonal on-street bicycle parking is a flexible and effective means of encouraging active transportation
Refer to MAP 4
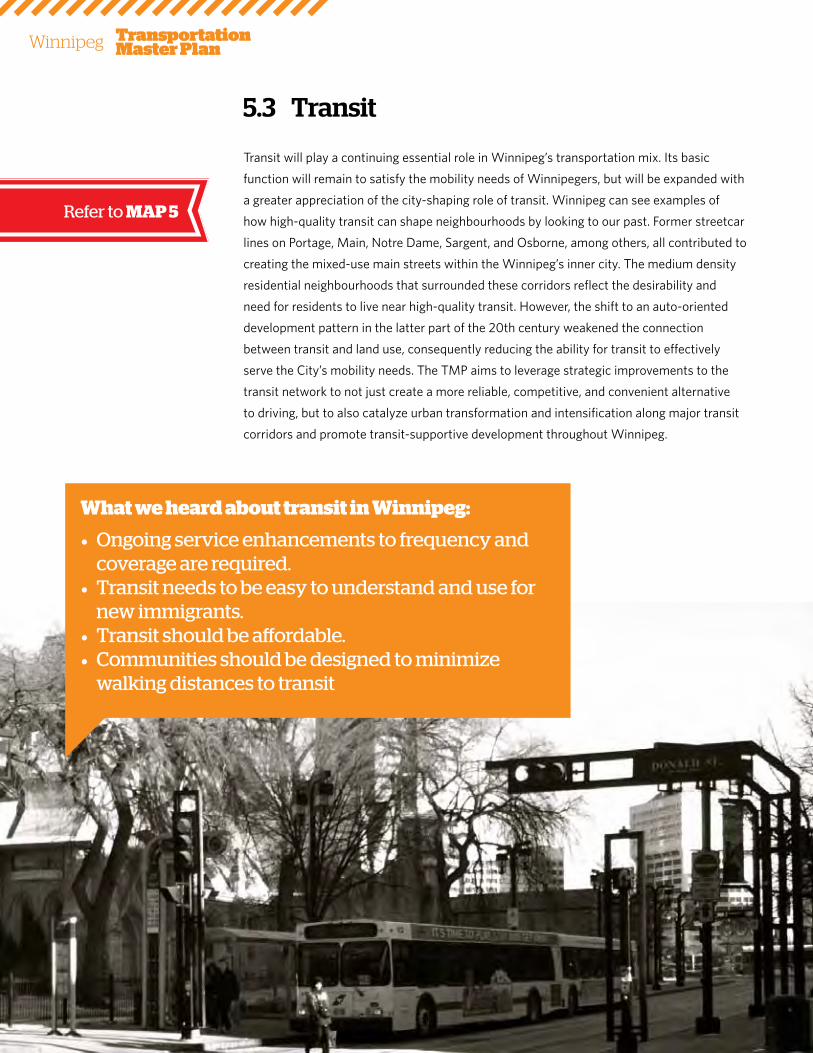
Transportation Master PlanWinnipeg
46
5.3 Transit
Transit will play a continuing essential role in Winnipeg’s transportation mix. its basic
function will remain to satisfy the mobility needs of Winnipegers, but will be expanded with
a greater appreciation of the city-shaping role of transit. Winnipeg can see examples of
how high-quality transit can shape neighbourhoods by looking to our past. former streetcar
lines on Portage, Main, notre Dame, sargent, and osborne, among others, all contributed to
creating the mixed-use main streets within the Winnipeg’s inner city. The medium density
residential neighbourhoods that surrounded these corridors reflect the desirability and
need for residents to live near high-quality transit. However, the shift to an auto-oriented
development pattern in the latter part of the 20th century weakened the connection
between transit and land use, consequently reducing the ability for transit to effectively
serve the city’s mobility needs. The TMP aims to leverage strategic improvements to the
transit network to not just create a more reliable, competitive, and convenient alternative
to driving, but to also catalyze urban transformation and intensification along major transit
corridors and promote transit-supportive development throughout Winnipeg.
• Ongoing service enhancements to frequency and coverage are required.
• Transit needs to be easy to understand and use for new immigrants.
• Transit should be affordable.• Communities should be designed to minimize
walking distances to transit
What we heard about transit in Winnipeg:
Refer to MAP 5
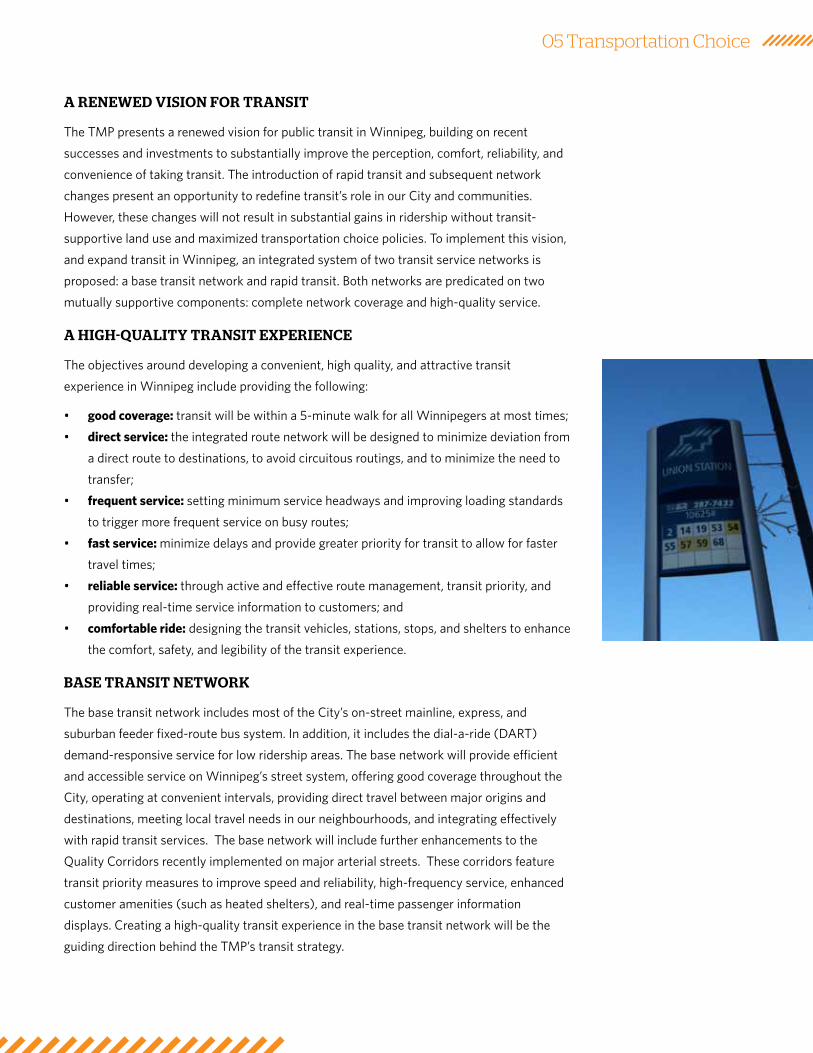
05 Transportation Choice
A RENEWED VISION FOR TRANSIT
The TMP presents a renewed vision for public transit in Winnipeg, building on recent
successes and investments to substantially improve the perception, comfort, reliability, and
convenience of taking transit. The introduction of rapid transit and subsequent network
changes present an opportunity to redefine transit’s role in our city and communities.
However, these changes will not result in substantial gains in ridership without transit-
supportive land use and maximized transportation choice policies. To implement this vision,
and expand transit in Winnipeg, an integrated system of two transit service networks is
proposed: a base transit network and rapid transit. both networks are predicated on two
mutually supportive components: complete network coverage and high-quality service.
A HIGH-QUALITy TRANSIT ExPERIENCE
The objectives around developing a convenient, high quality, and attractive transit
experience in Winnipeg include providing the following:
• good coverage: transit will be within a 5-minute walk for all Winnipegers at most times;
• direct service: the integrated route network will be designed to minimize deviation from
a direct route to destinations, to avoid circuitous routings, and to minimize the need to
transfer;
• frequent service: setting minimum service headways and improving loading standards
to trigger more frequent service on busy routes;
• fast service: minimize delays and provide greater priority for transit to allow for faster
travel times;
• reliable service: through active and effective route management, transit priority, and
providing real-time service information to customers; and
• comfortable ride: designing the transit vehicles, stations, stops, and shelters to enhance
the comfort, safety, and legibility of the transit experience.
bASE TRANSIT NETWORK
The base transit network includes most of the city’s on-street mainline, express, and
suburban feeder fixed-route bus system. in addition, it includes the dial-a-ride (DarT)
demand-responsive service for low ridership areas. The base network will provide efficient
and accessible service on Winnipeg’s street system, offering good coverage throughout the
city, operating at convenient intervals, providing direct travel between major origins and
destinations, meeting local travel needs in our neighbourhoods, and integrating effectively
with rapid transit services. The base network will include further enhancements to the
Quality corridors recently implemented on major arterial streets. These corridors feature
transit priority measures to improve speed and reliability, high-frequency service, enhanced
customer amenities (such as heated shelters), and real-time passenger information
displays. creating a high-quality transit experience in the base transit network will be the
guiding direction behind the TMP’s transit strategy.
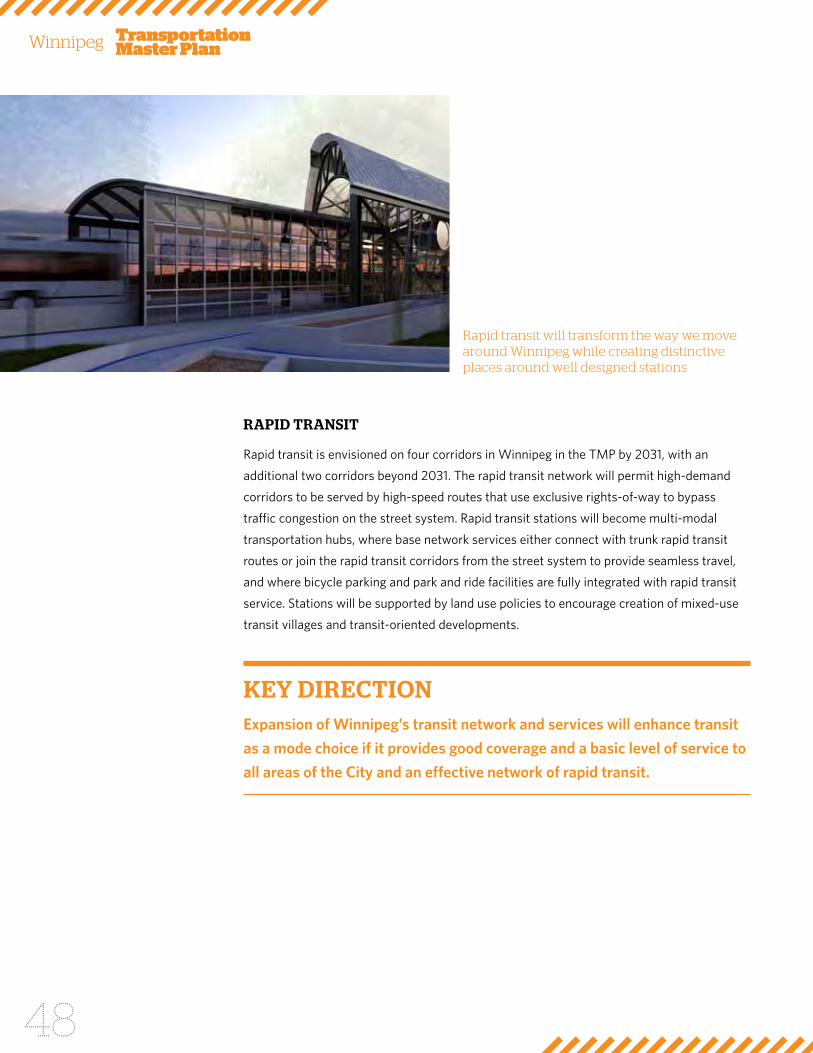
Transportation Master PlanWinnipeg
48
RAPID TRANSIT
rapid transit is envisioned on four corridors in Winnipeg in the TMP by 2031, with an
additional two corridors beyond 2031. The rapid transit network will permit high-demand
corridors to be served by high-speed routes that use exclusive rights-of-way to bypass
traffic congestion on the street system. rapid transit stations will become multi-modal
transportation hubs, where base network services either connect with trunk rapid transit
routes or join the rapid transit corridors from the street system to provide seamless travel,
and where bicycle parking and park and ride facilities are fully integrated with rapid transit
service. stations will be supported by land use policies to encourage creation of mixed-use
transit villages and transit-oriented developments.
KEy DIRECTIONExpansion of Winnipeg’s transit network and services will enhance transit
as a mode choice if it provides good coverage and a basic level of service to
all areas of the City and an effective network of rapid transit.
Rapid transit will transform the way we move around Winnipeg while creating distinctive places around well designed stations
05 Transportation Choice
DIRECTION ONE
Provide efficient and effective transit service to all areas of the city.
ENAbLING STRATEGIES
a) update service guidelines for the introduction of service into new communities,
minimum service frequencies, hours of service, bus stop and bus shelter placement, and
funding of service expansion.
b) Where appropriate, the transportation network will be designed to maximize transit
route coverage and directness, and allow for direct and safe active transportation
linkages.
c) adopt a fare strategy that prioritizes service improvements over fare freezes or
reductions.
d) Develop partnerships with social service agencies to increase funding outside of transit
to provide subsidized transit fares for residents with low income or special needs.
e) further adopt intelligent transportation systems (iTs) where appropriate to enhance
service reliability, performance monitoring, and system management.
f) Ensure transit services are fully accessible and barrier-free by 2020, including
accessible fleet, stops, and stations. continue to introduce accessible customer service
and information features.
g) Expand opportunities for transit park-and-ride through shared-use agreements with
owners and operators of large parking facilities in proximity to rapid transit stations and
major stops on Quality corridors.
h) integrate transit with active transportation by providing bicycle parking and improved
pedestrian connections, bicycle racks on buses, and developing safe and convenient
pedestrian and cycling routes to and from transit stops and stations.
i) Monitor and implement innovative initiatives that improve the transit experience,
including communications and information strategies, promotional activities, and
customer appreciation programs.
j) Manage fleet and operations to maximize environmental benefits of transit and explore
and implement opportunities to reduce energy consumption and emissions.

Transportation Master PlanWinnipeg
50
5.3.1 base Transit Network
The base transit network is an important component of the city-wide transit strategy
and a critical support for rapid transit. it expands the reach of the transit system into all
neighbourhoods, providing local service and access to destinations on the transportation
network.
DIRECTION ONE
further strengthen the base transit network to support the efficiency and
accessibility of transit.
ENAbLING STRATEGIES
k) Provide at least 30-minute service on all transit routes at all times.
l) Expand route coverage so that 95% of city residences are within a 5 to 10 minute walk
of transit service.
m) Explore feasibility of providing inter-municipal transit services which serve centres
outside the city.
n) continue to implement Quality corridors as a first stage to the implementation of rapid
transit.
o) complete and expand the on-street transit priority program and incorporate transit
priority measures in all roadway projects on transit routes, where desirable.
p) continue Winnipeg Transit’s bus stop and shelter upgrade program to improve
customer comfort.
q) restrict the use of diamond lanes to transit vehicles and bikes.
r) support transit oriented development along high frequency transit corridors.
05 Transportation Choice
5.3.2 Rapid Transit
rapid transit is necessary for Winnipeg’s on-going growth. it is needed to ensure that
residents are provided with a viable alternative to the automobile, to reduce existing and
future road congestion, and to build a transportation system that is capable of serving future
generations. rapid transit is also essential for shaping land use in a manner that achieves
the objectives of ourWinnipeg and complete communities.
it is important to identify the corridors where rapid transit will help contribute to a mode
shift to transit, reduce road congestion and promote new development and redevelopment.
The concept of a rapid transit system for Winnipeg has been contemplated for more than
four decades. rapid transit has been identified in some form or virtually all major plans since
the 1970’s including:
• Winnipeg area Transportation study (1968)
• Plan Winnipeg (1986)
• Plan Winnipeg...Toward 2010 (1993)
• TransPlan 2010 (1998)
• Plan Winnipeg 2020 (2001)
• ourWinnipeg (2010)
in addition, there have been numerous studies of rapid transit in one or more corridors
including the following:
• Monorail for Portage corridor (1972)
• southwest Transit corridor study (1973)
• rapid Transit Task force (2005)
Progress on the development of a rapid transit system over the past few decades has largely
been constrained by need and funding. because Winnipeg has not been growing rapidly and
congestion has been manageable, it has been difficult to justify major investments in rapid
transit. However, this is no longer the case with an expected growth of 240,000 people in
the capital region by 2031.
The construction of Winnipeg’s first rapid transit infrastructure, stage 1 of the southwest
rapid Transit corridor between Queen Elizabeth Way and Jubilee avenue, represents a
major milestone for the city and is a turning point for the transportation system. scheduled
to open for service in 2012, the new bus rapid transit corridor will greatly improve the speed,
reliability, comfort and convenience of transit travel between Downtown and the various
neighbourhoods and destinations in southwest Winnipeg.
as part of the preparation of this TMP, a substantial amount of work was carried out
to confirm the need and justification for rapid transit, to assess its potential in different
corridors, and to identify potential routing options for further study.
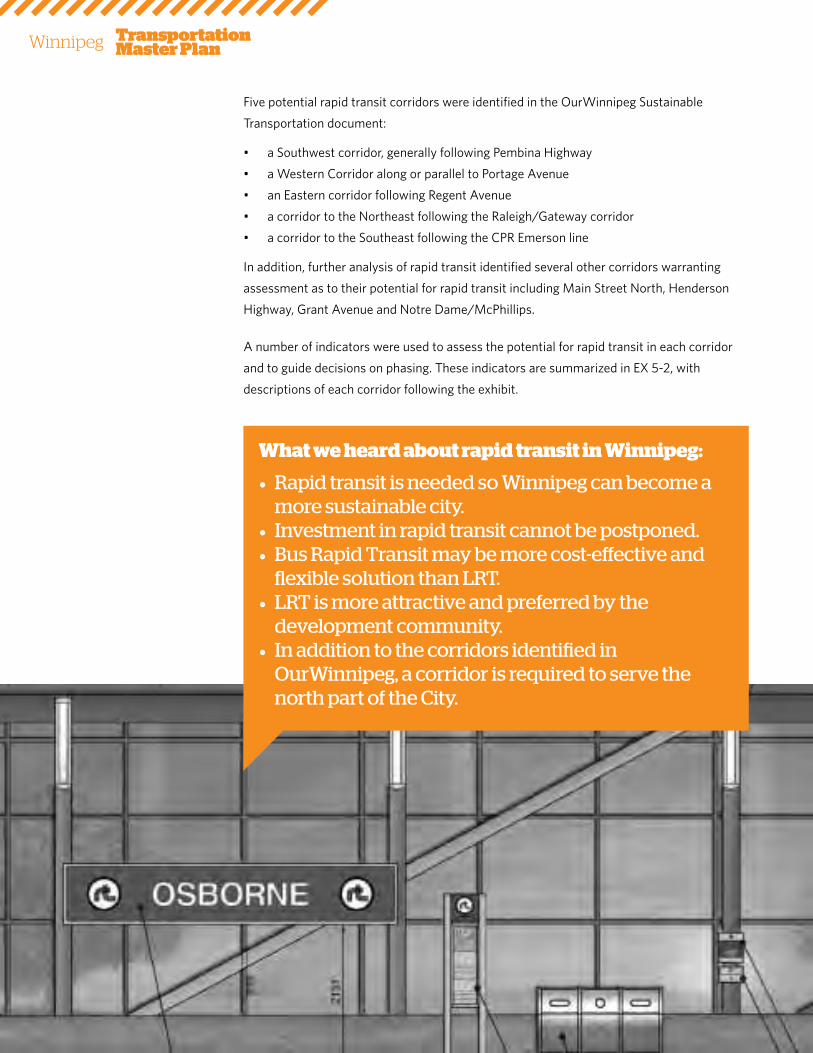
Transportation Master PlanWinnipeg
52
five potential rapid transit corridors were identified in the ourWinnipeg sustainable
Transportation document:
• a southwest corridor, generally following Pembina Highway
• a Western corridor along or parallel to Portage avenue
• an Eastern corridor following regent avenue
• a corridor to the northeast following the raleigh/gateway corridor
• a corridor to the southeast following the cPr Emerson line
in addition, further analysis of rapid transit identified several other corridors warranting
assessment as to their potential for rapid transit including Main street north, Henderson
Highway, grant avenue and notre Dame/McPhillips.
a number of indicators were used to assess the potential for rapid transit in each corridor
and to guide decisions on phasing. These indicators are summarized in EX 5-2, with
descriptions of each corridor following the exhibit.
• Rapid transit is needed so Winnipeg can become a more sustainable city.
• Investment in rapid transit cannot be postponed.• Bus Rapid Transit may be more cost-effective and
flexible solution than LRT.• LRT is more attractive and preferred by the
development community.• In addition to the corridors identified in
OurWinnipeg, a corridor is required to serve the north part of the City.
What we heard about rapid transit in Winnipeg:
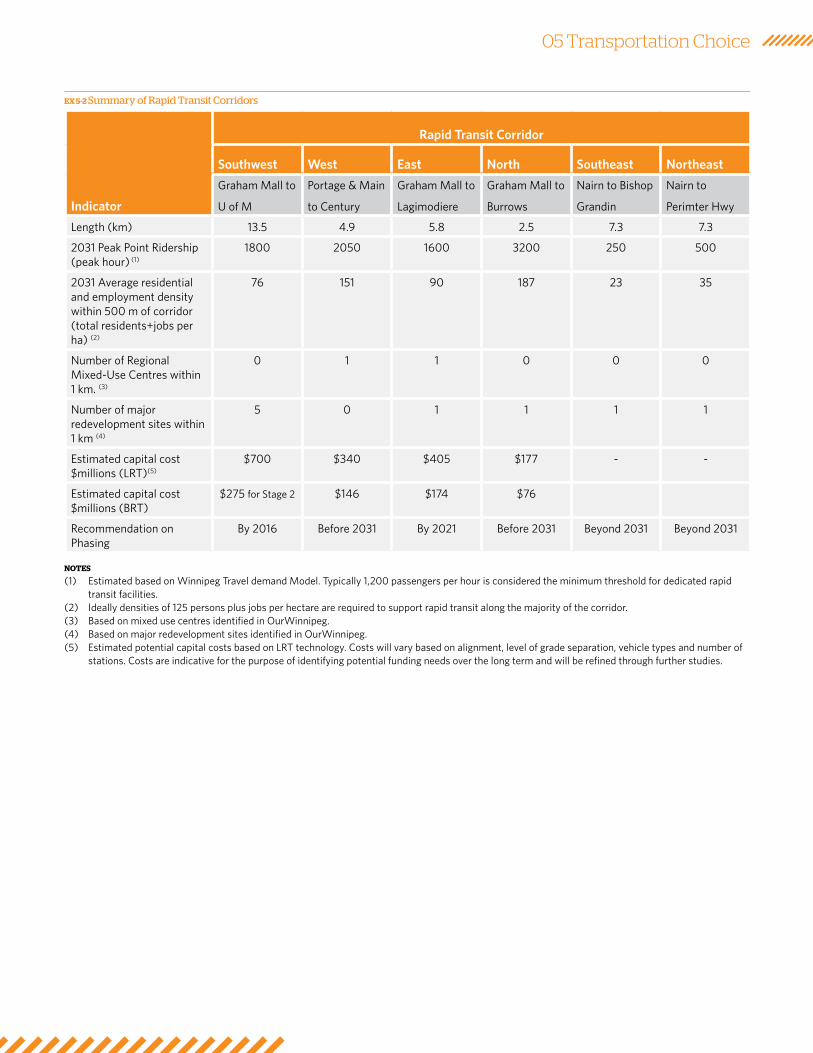
05 Transportation Choice
EX 5-2 Summary of Rapid Transit Corridors
Indicator
Rapid Transit Corridor
Southwest West East North Southeast Northeast
graham Mall to
u of M
Portage & Main
to century
graham Mall to
Lagimodiere
graham Mall to
burrows
nairn to bishop
grandin
nairn to
Perimter Hwy
Length (km) 13.5 4.9 5.8 2.5 7.3 7.3
2031 Peak Point ridership (peak hour) (1)
1800 2050 1600 3200 250 500
2031 average residential and employment density within 500 m of corridor (total residents+jobs per ha) (2)
76 151 90 187 23 35
number of regional Mixed-use centres within 1 km. (3)
0 1 1 0 0 0
number of major redevelopment sites within 1 km (4)
5 0 1 1 1 1
Estimated capital cost $millions (LrT)(5)
$700 $340 $405 $177 - -
Estimated capital cost $millions (brT)
$275 for stage 2 $146 $174 $76
recommendation on Phasing
by 2016 before 2031 by 2021 before 2031 beyond 2031 beyond 2031
nOTES
(1) Estimated based on Winnipeg Travel demand Model. Typically 1,200 passengers per hour is considered the minimum threshold for dedicated rapid transit facilities.
(2) ideally densities of 125 persons plus jobs per hectare are required to support rapid transit along the majority of the corridor.(3) based on mixed use centres identified in ourWinnipeg.(4) based on major redevelopment sites identified in ourWinnipeg.(5) Estimated potential capital costs based on LrT technology. costs will vary based on alignment, level of grade separation, vehicle types and number of
stations. costs are indicative for the purpose of identifying potential funding needs over the long term and will be refined through further studies.
Transportation Master PlanWinnipeg
54
SOUTHWEST CORRIDOR
implementing stage2 of the southwest corridor is an early priority to capitalize on the
investments in the soon to be opened stage1 project.
The current rapid transit development program has selected the southwest corridor as
the priority and stage 1 of this corridor is under construction and scheduled to open in
the spring of 2012. stage 1 will extend to Jubillee avenue and stage 2 is planned to extend
to Pembina and bison. When completed, a network of transit routes will use this new
infrastructure and existing transit priority measures (such as the graham Transit Mall and
Main street diamond lanes) to provide fast reliable transit service between the downtown
and the southwest part of the city (including the university of Manitoba, and residential,
commercial, and industrial areas).
This rapid transit corridor will serve existing residential areas in southwest Winnipeg
(having a total population of 75,000), the 30,000 students and staff at the university of
Manitoba, the new stadium complex at the university of Manitoba, the developing Waverley
West area (with a planned population of 30,000 and new employment centres by 2031), as
well as the ToD development underway in the fort rouge yards, and similar development
proposed for the southwood golf course lands, the former sugar beet lands near Pembina &
bishop grandin, and the Parker lands west of Pembina and south of the cn main line.
There are two possible alignments of the stage 2 extension of the southwest corridor to be
considered in a future detailed alignment study. Past plans have identified the cn Letellier
subdivision as a possible alignment for the stage 2 extension under a joint-use agreement
with the railway. There is also the potential for an alignment along the hydro corridors (see
Map 5), which would serve the emerging communities on the Parker and Taylor lands.
05 Transportation Choice
WESTERN CORRIDOR
The Western corridor would extend from the downtown core to Polo Park. although future
studies will need to confirm the alignment, Portage avenue is seen as having the greatest
potential for rapid transit. it has very high existing ridership and has a relatively high walk-
in market that would benefit from some level of higher-order transit. West of Polo Park,
congestion tapers off and there is less need for rapid transit by 2031.
one of the objectives of the Western corridor is also to connect the James armstrong
richardson international airport with rapid transit. This could be achieved by an extension
of the Portage avenue corridor northward on st. James or route 90, labelled in Map 5 as
the airport Link. Technology for this link would not necessarily have to be the same as the
Portage avenue corridor provided Polo Park functioned as a major mobility hub.
in assessing different options for Portage avenue (and other corridors), consideration
will be given to the idea of constructing a European-style light rail system. These types of
systems are being considered in many cities across north america and are best described
as a hybrid between traditional light rail (such as calgary) and streetcars (such as Toronto).
EASTERN CORRIDOR
The provision of an exclusive rapid transit facility from Downtown and east across the red
river would provide significant benefits to existing developed residential and commercial
areas and to new areas in the vicinity of the corridor such as planned commercial lands
along the north side of reenders Drive, and residential lands west of the future Edward
schreyer Parkway north of the frontage properties on regent avenue. it would also facilitate
redevelopment and intensification in Point Douglas, along Higgins ave. and sutherland ave.
it would also allow transit to bypass congestion on crossings of the red river.
There are still significant questions to be answered on the alignment of the Eastern
corridor as it relates to the crossing of the red river. one opportunity that has emerged is
constructing a new multi-modal bridge to replace the aging Louise bridge.
NORTHERN CORRIDOR
There are at least two options for connecting the north end and surrounding employment
areas with rapid transit. Previous rapid transit plans identified a corridor paralleling the cPr
Winnipeg yards and then northward along the cPr Winnipeg beach or arborg subdivision.
However, based primarily on ridership potential, Main street between Portage and Jefferson
is considered the preferred corridor. a rapid transit corridor on Main street could be
combined with the Western corridor if the latter utilized Portage avenue.
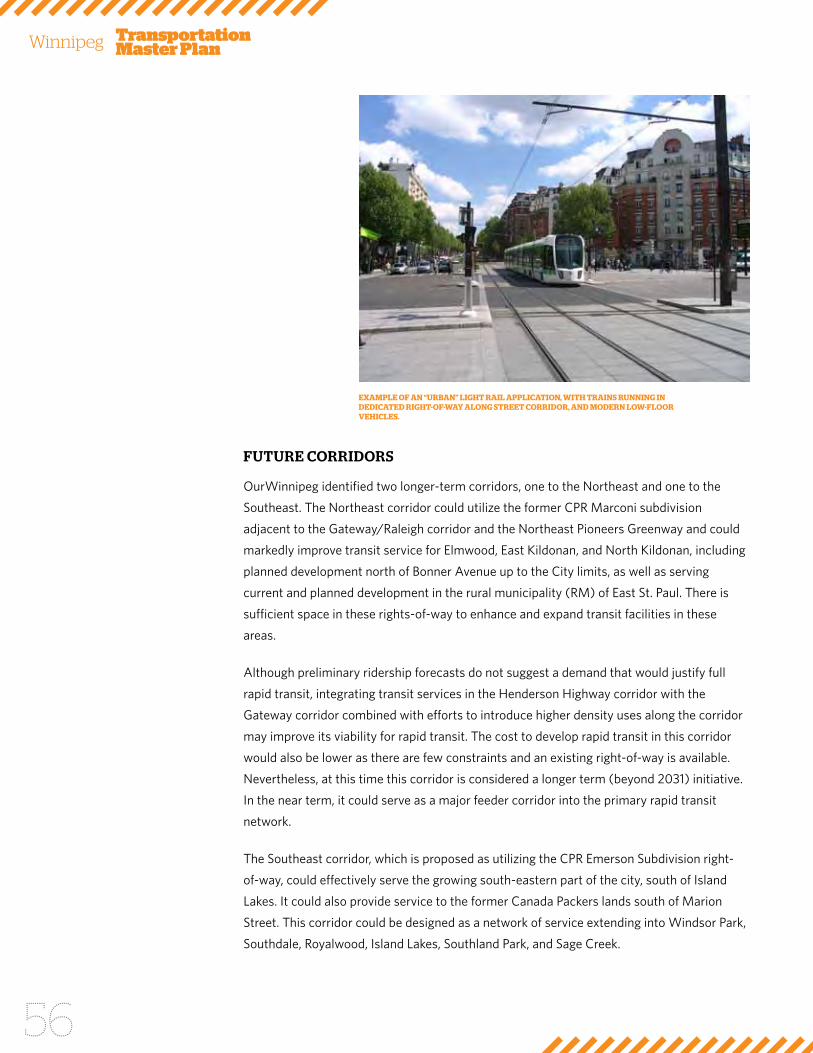
Transportation Master PlanWinnipeg
56
FUTURE CORRIDORS
ourWinnipeg identified two longer-term corridors, one to the northeast and one to the
southeast. The northeast corridor could utilize the former cPr Marconi subdivision
adjacent to the gateway/raleigh corridor and the northeast Pioneers greenway and could
markedly improve transit service for Elmwood, East kildonan, and north kildonan, including
planned development north of bonner avenue up to the city limits, as well as serving
current and planned development in the rural municipality (rM) of East st. Paul. There is
sufficient space in these rights-of-way to enhance and expand transit facilities in these
areas.
although preliminary ridership forecasts do not suggest a demand that would justify full
rapid transit, integrating transit services in the Henderson Highway corridor with the
gateway corridor combined with efforts to introduce higher density uses along the corridor
may improve its viability for rapid transit. The cost to develop rapid transit in this corridor
would also be lower as there are few constraints and an existing right-of-way is available.
nevertheless, at this time this corridor is considered a longer term (beyond 2031) initiative.
in the near term, it could serve as a major feeder corridor into the primary rapid transit
network.
The southeast corridor, which is proposed as utilizing the cPr Emerson subdivision right-
of-way, could effectively serve the growing south-eastern part of the city, south of island
Lakes. it could also provide service to the former canada Packers lands south of Marion
street. This corridor could be designed as a network of service extending into Windsor Park,
southdale, royalwood, island Lakes, southland Park, and sage creek.
EXamplE OF an “urban” lighT rail applicaTiOn, wiTh TrainS running in dEdicaTEd righT-OF-way alOng STrEET cOrridOr, and mOdErn lOw-FlOOr vEhiclES.
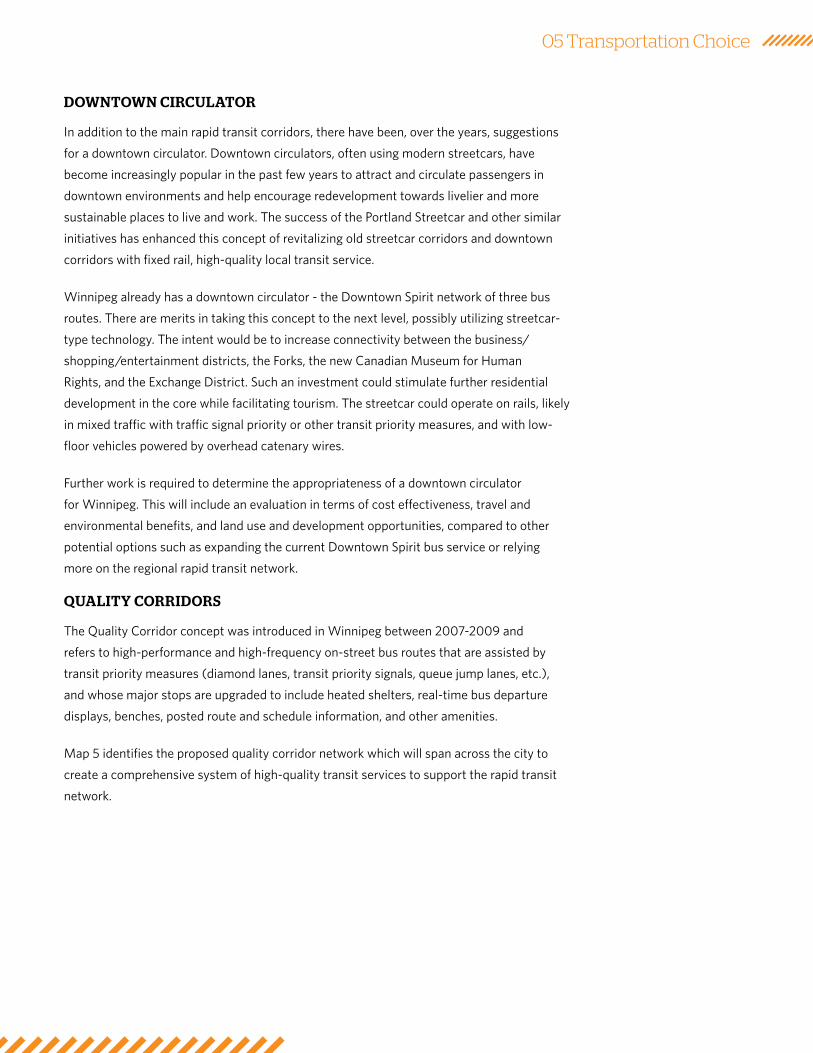
05 Transportation Choice
DOWNTOWN CIRCULATOR
in addition to the main rapid transit corridors, there have been, over the years, suggestions
for a downtown circulator. Downtown circulators, often using modern streetcars, have
become increasingly popular in the past few years to attract and circulate passengers in
downtown environments and help encourage redevelopment towards livelier and more
sustainable places to live and work. The success of the Portland streetcar and other similar
initiatives has enhanced this concept of revitalizing old streetcar corridors and downtown
corridors with fixed rail, high-quality local transit service.
Winnipeg already has a downtown circulator - the Downtown spirit network of three bus
routes. There are merits in taking this concept to the next level, possibly utilizing streetcar-
type technology. The intent would be to increase connectivity between the business/
shopping/entertainment districts, the forks, the new canadian Museum for Human
rights, and the Exchange District. such an investment could stimulate further residential
development in the core while facilitating tourism. The streetcar could operate on rails, likely
in mixed traffic with traffic signal priority or other transit priority measures, and with low-
floor vehicles powered by overhead catenary wires.
further work is required to determine the appropriateness of a downtown circulator
for Winnipeg. This will include an evaluation in terms of cost effectiveness, travel and
environmental benefits, and land use and development opportunities, compared to other
potential options such as expanding the current Downtown spirit bus service or relying
more on the regional rapid transit network.
QUALITy CORRIDORS
The Quality corridor concept was introduced in Winnipeg between 2007-2009 and
refers to high-performance and high-frequency on-street bus routes that are assisted by
transit priority measures (diamond lanes, transit priority signals, queue jump lanes, etc.),
and whose major stops are upgraded to include heated shelters, real-time bus departure
displays, benches, posted route and schedule information, and other amenities.
Map 5 identifies the proposed quality corridor network which will span across the city to
create a comprehensive system of high-quality transit services to support the rapid transit
network.
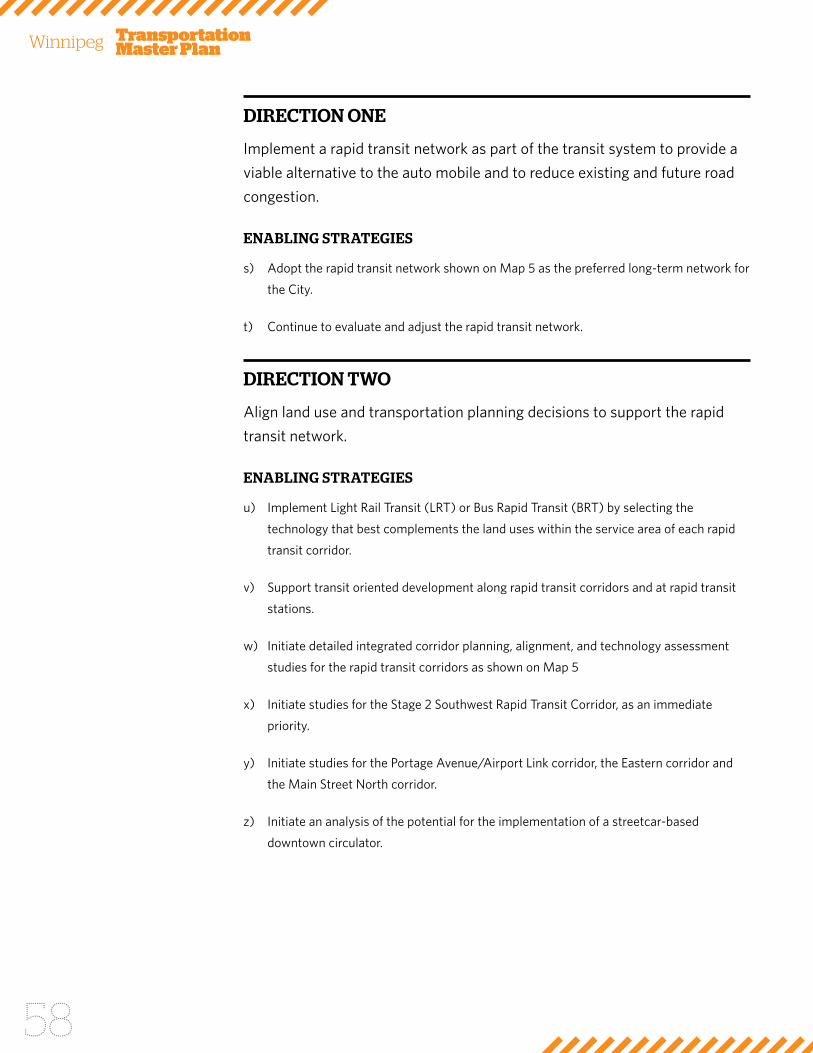
Transportation Master PlanWinnipeg
58
DIRECTION ONE
implement a rapid transit network as part of the transit system to provide a
viable alternative to the auto mobile and to reduce existing and future road
congestion.
ENAbLING STRATEGIES
s) adopt the rapid transit network shown on Map 5 as the preferred long-term network for
the city.
t) continue to evaluate and adjust the rapid transit network.
DIRECTION TWO
align land use and transportation planning decisions to support the rapid
transit network.
ENAbLING STRATEGIES
u) implement Light rail Transit (LrT) or bus rapid Transit (brT) by selecting the
technology that best complements the land uses within the service area of each rapid
transit corridor.
v) support transit oriented development along rapid transit corridors and at rapid transit
stations.
w) initiate detailed integrated corridor planning, alignment, and technology assessment
studies for the rapid transit corridors as shown on Map 5
x) initiate studies for the stage 2 southwest rapid Transit corridor, as an immediate
priority.
y) initiate studies for the Portage avenue/airport Link corridor, the Eastern corridor and
the Main street north corridor.
z) initiate an analysis of the potential for the implementation of a streetcar-based
downtown circulator.
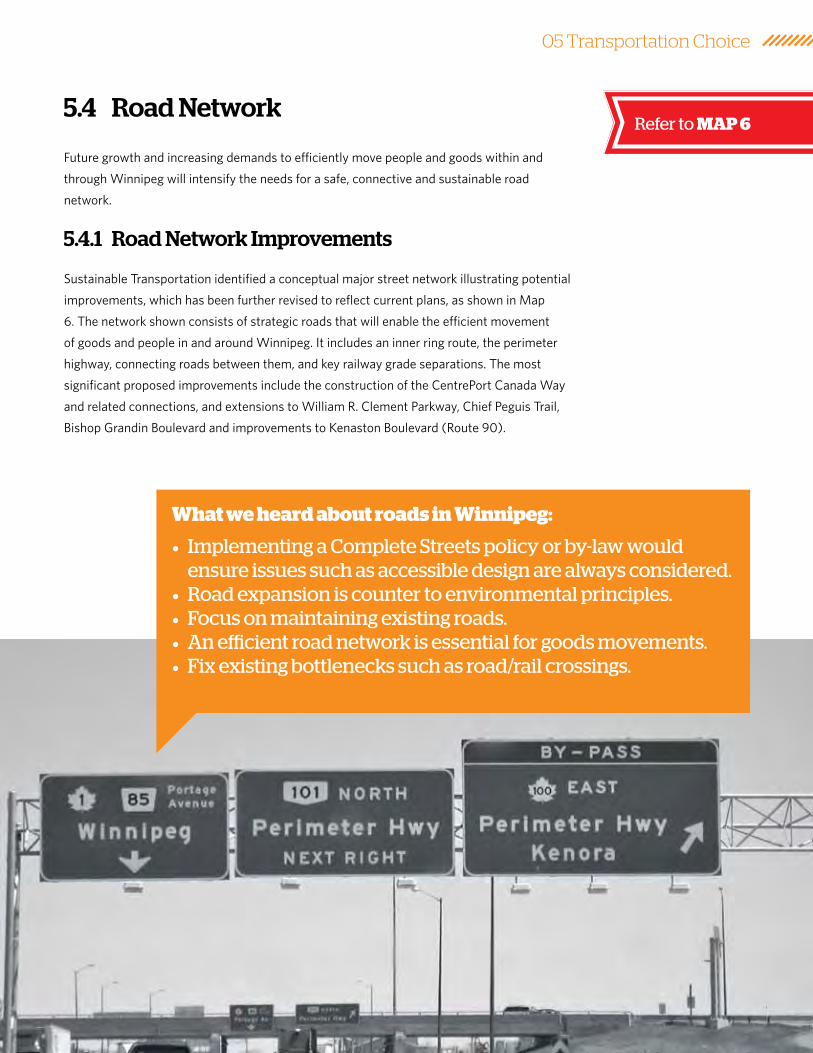
05 Transportation Choice
5.4 Road Network
future growth and increasing demands to efficiently move people and goods within and
through Winnipeg will intensify the needs for a safe, connective and sustainable road
network.
5.4.1 Road Network Improvements
sustainable Transportation identified a conceptual major street network illustrating potential
improvements, which has been further revised to reflect current plans, as shown in Map
6. The network shown consists of strategic roads that will enable the efficient movement
of goods and people in and around Winnipeg. it includes an inner ring route, the perimeter
highway, connecting roads between them, and key railway grade separations. The most
significant proposed improvements include the construction of the centrePort canada Way
and related connections, and extensions to William r. clement Parkway, chief Peguis Trail,
bishop grandin boulevard and improvements to kenaston boulevard (route 90).
• Implementing a Complete Streets policy or by-law would ensure issues such as accessible design are always considered.
• Road expansion is counter to environmental principles.• Focus on maintaining existing roads.• An efficient road network is essential for goods movements.• Fix existing bottlenecks such as road/rail crossings.
What we heard about roads in Winnipeg:
Refer to MAP 6

Transportation Master PlanWinnipeg
60
investment in new infrastructure and expansion of the strategic road network cannot solely
accommodate future growth and demands. in addition, strategies and initiatives to enhance
the existing road network in Winnipeg must also be implemented. They should reflect best
practices for policy, design features, and iTs to foster a full range of mobility options and
increase safety for all users.
While the city has invested $2.3M per year since 2008 to implement a traffic signal
management system which has resulted in improving the movement of motorists on major
routes without the need to implement more expensive solutions such as adding traffic lanes
or grade separation, traffic signals in Winnipeg are dated and fail to meet the demands of
the current expectations of the transportation users.
nearly one third of field equipment consists of electromechanical controllers, which are over
50 years old, and much of the electronic equipment is reaching its useful life. Traffic signal
plant has deteriorated significantly over the last 30 years and reflects the need to invest in a
proper preventive and replacement maintenance program.
The opportunity exists to take the strategic investment of the new traffic signal
management system initiated in 2008 to form the basis for the implementation of a
modern and integrated traffic signal management system, to implement iTs solutions, and
to establish a traffic management centre to more efficiently and proactively address traffic
management problems. Traffic management centres have existed for many years in most
major canadian cities, including vancouver, calgary, Edmonton, ottawa, Montreal and
Toronto and serve as the nerve centre to manage emerging congestion and traffic operations
problems, assist enforcement and emergency agencies in safety and security matters and
support rapid transit operations. in more recent years, traffic management centres have
also expanded their role and provide information to motorists and the media through the
internet, or through personal mobile technologies or on-board vehicular navigation systems.
in addition to the improvements and additions to the strategic road network and traffic
signal management system, it will also be necessary to undertake other modifications to
the existing major street network at key locations to replace transportation infrastructure
that is beyond its useful life and to mitigate existing spot congestion problems. Examples
include assessing the options for replacement of the arlington street bridge, widening of the
Pembina Highway and osborne street underpasses, and construction of a grade separation
at Waverley street and the cn Mainline.
05 Transportation Choice
KEy DIRECTIONIn order to accommodate increasing demand as well as efficiently and
effectively move people and goods within and through Winnipeg, a safe,
connective and sustainable road network is required as part of a balanced,
multi-modal transportation system.
DIRECTION ONE
Ensure that a safe, connective and sustainable road network is part of the
balanced, multi-modal transportation system.
ENAbLING STRATEGIES
a) adopt the strategic road network as illustrated on Map 6
b) conduct planning and detailed design studies of the improvements to the strategic
road network shown in EX 5-3 and illustrated in Map 7.
c) conduct an annual review of the priority assigned to the strategic road network
improvements in consultation with the Planning, Property and Development
Department as part of the monitoring process described in greater detail in section 10.
DIRECTION TWO
Enhance the efficiency and effectiveness of the existing road network.
ENAbLING STRATEGIES
d) identify congestion hotspots in the road network that provide an opportunity to support
sustainable modes and transportation demand management.
e) seek to improve access and efficiency of the taxi system by expanding on-street taxi
zones and more equitable enforcement of no stopping zones.
f) investigate opportunities to implement alternatives to roadway expansion and
widening.
g) continue to implement localized improvements to the existing major road network that
reduce congestion for all modes.
Refer to MAP 7
Transportation Master PlanWinnipeg
62
h) Evaluate the applicability of roundabouts as a substitute for full signalized intersections
in the design of new roadway projects to improve safety and reduce congestion and
operational costs.
i) Minimize negative impact of property access on multi-modal functionality of strategic
roadway network.
j) Extend the implementation of the traffic signal management system to other key routes
and establish a traffic signal optimization program.
k) integrate the traffic signal management system with traffic operations and iTs solutions
to improve the efficiency of the road network in a sustainable manner.
l) implement a modern traffic management centre to monitor, manage and react
efficiently to emerging congestion and unexpected traffic, security or emergency
conditions.
EX 5-3 summarizes and prioritizes the strategic road network and other major road
network improvements that are illustrated on Map 7. There are two groups of projects
shown on EX 5-3:
• Projects that are part of the approved 2011 capital budget or 2012-2016 five year
capital forecast; and,
• Projects that are noT part of the approved 2011 capital budget or 2012-2016 five year
forecast that have been identified as being required to accommodate future travel
demand to 2031
The latter group of projects has been further characterized as short Term (by 2016),
Medium Term (by 2021), and Long Term (by 2031) based on the analysis of the additional
travel demand described in section 3.3, alternative Land use and Transportation scenarios.
it should be noted that the priority of the strategic road network improvements illustrated
in EX 5-3 will be reviewed on an annual basis as part of the requirements necessary to
ensure that transportation and land use planning continue to be integrated. as such,
changes to patterns of development that are not currently anticipated and/or other factors
may result in the need to alter the priority of one or more of the strategic road network
improvements.
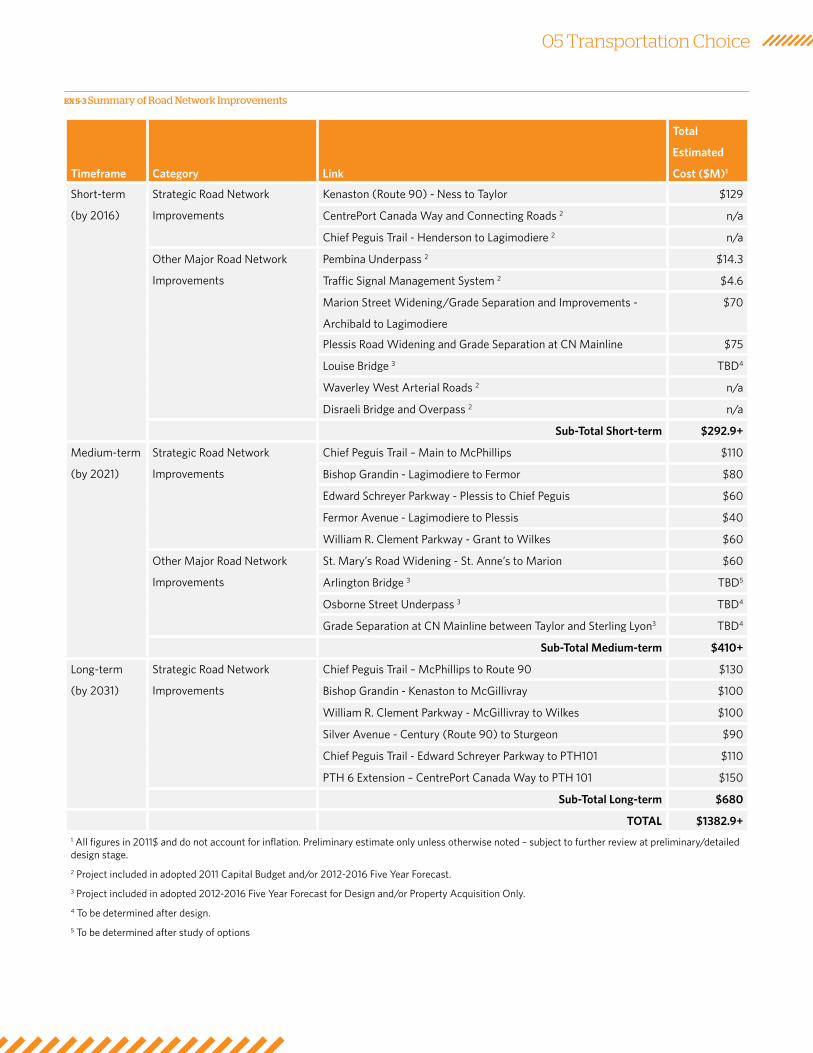
05 Transportation Choice
EX 5-3 Summary of Road Network Improvements
Timeframe Category Link
Total
Estimated
Cost ($M)1
short-term
(by 2016)
strategic road network
improvements
kenaston (route 90) - ness to Taylor $129
centrePort canada Way and connecting roads 2 n/a
chief Peguis Trail - Henderson to Lagimodiere 2 n/a
other Major road network
improvements
Pembina underpass 2 $14.3
Traffic signal Management system 2 $4.6
Marion street Widening/grade separation and improvements -
archibald to Lagimodiere
$70
Plessis road Widening and grade separation at cn Mainline $75
Louise bridge 3 TbD4
Waverley West arterial roads 2 n/a
Disraeli bridge and overpass 2 n/a
Sub-Total Short-term $292.9+
Medium-term
(by 2021)
strategic road network
improvements
chief Peguis Trail – Main to McPhillips $110
bishop grandin - Lagimodiere to fermor $80
Edward schreyer Parkway - Plessis to chief Peguis $60
fermor avenue - Lagimodiere to Plessis $40
William r. clement Parkway - grant to Wilkes $60
other Major road network
improvements
st. Mary’s road Widening - st. anne’s to Marion $60
arlington bridge 3 TbD5
osborne street underpass 3 TbD4
grade separation at cn Mainline between Taylor and sterling Lyon3 TbD4
Sub-Total Medium-term $410+
Long-term
(by 2031)
strategic road network
improvements
chief Peguis Trail – McPhillips to route 90 $130
bishop grandin - kenaston to Mcgillivray $100
William r. clement Parkway - Mcgillivray to Wilkes $100
silver avenue - century (route 90) to sturgeon $90
chief Peguis Trail - Edward schreyer Parkway to PTH101 $110
PTH 6 Extension – centrePort canada Way to PTH 101 $150
Sub-Total Long-term $680
TOTAL $1382.9+1 all figures in 2011$ and do not account for inflation. Preliminary estimate only unless otherwise noted – subject to further review at preliminary/detailed design stage.
2 Project included in adopted 2011 capital budget and/or 2012-2016 five year forecast.
3 Project included in adopted 2012-2016 five year forecast for Design and/or Property acquisition only.
4 To be determined after design.
5 To be determined after study of options
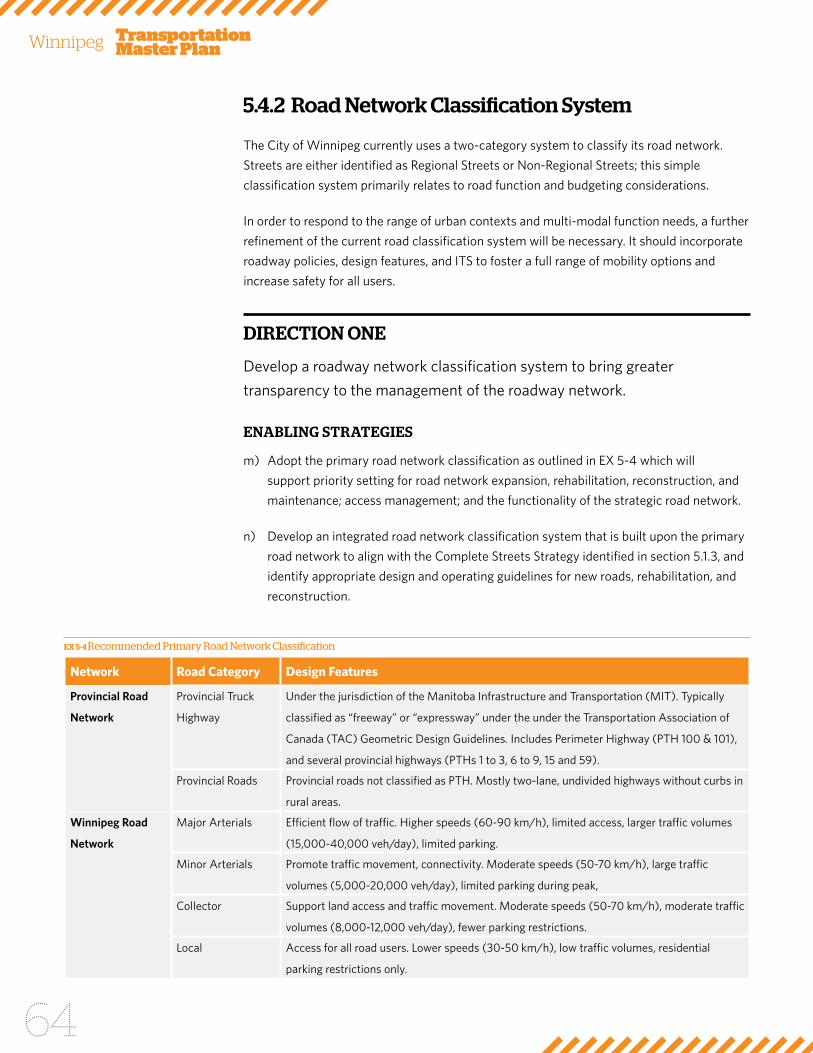
Transportation Master PlanWinnipeg
64
5.4.2 Road Network Classification System
The city of Winnipeg currently uses a two-category system to classify its road network.
streets are either identified as regional streets or non-regional streets; this simple
classification system primarily relates to road function and budgeting considerations.
in order to respond to the range of urban contexts and multi-modal function needs, a further
refinement of the current road classification system will be necessary. it should incorporate
roadway policies, design features, and iTs to foster a full range of mobility options and
increase safety for all users.
DIRECTION ONE
Develop a roadway network classification system to bring greater
transparency to the management of the roadway network.
ENAbLING STRATEGIES
m) adopt the primary road network classification as outlined in EX 5-4 which will
support priority setting for road network expansion, rehabilitation, reconstruction, and
maintenance; access management; and the functionality of the strategic road network.
n) Develop an integrated road network classification system that is built upon the primary
road network to align with the complete streets strategy identified in section 5.1.3, and
identify appropriate design and operating guidelines for new roads, rehabilitation, and
reconstruction.
EX 5-4 Recommended Primary Road Network Classification
network road category Design Features
Provincial Road
Network
Provincial Truck
Highway
under the jurisdiction of the Manitoba infrastructure and Transportation (MiT). Typically
classified as “freeway” or “expressway” under the under the Transportation association of
canada (Tac) geometric Design guidelines. includes Perimeter Highway (PTH 100 & 101),
and several provincial highways (PTHs 1 to 3, 6 to 9, 15 and 59).
Provincial roads Provincial roads not classified as PTH. Mostly two-lane, undivided highways without curbs in
rural areas.
Winnipeg Road
Network
Major arterials Efficient flow of traffic. Higher speeds (60-90 km/h), limited access, larger traffic volumes
(15,000-40,000 veh/day), limited parking.
Minor arterials Promote traffic movement, connectivity. Moderate speeds (50-70 km/h), large traffic
volumes (5,000-20,000 veh/day), limited parking during peak,
collector support land access and traffic movement. Moderate speeds (50-70 km/h), moderate traffic
volumes (8,000-12,000 veh/day), fewer parking restrictions.
Local access for all road users. Lower speeds (30-50 km/h), low traffic volumes, residential
parking restrictions only.
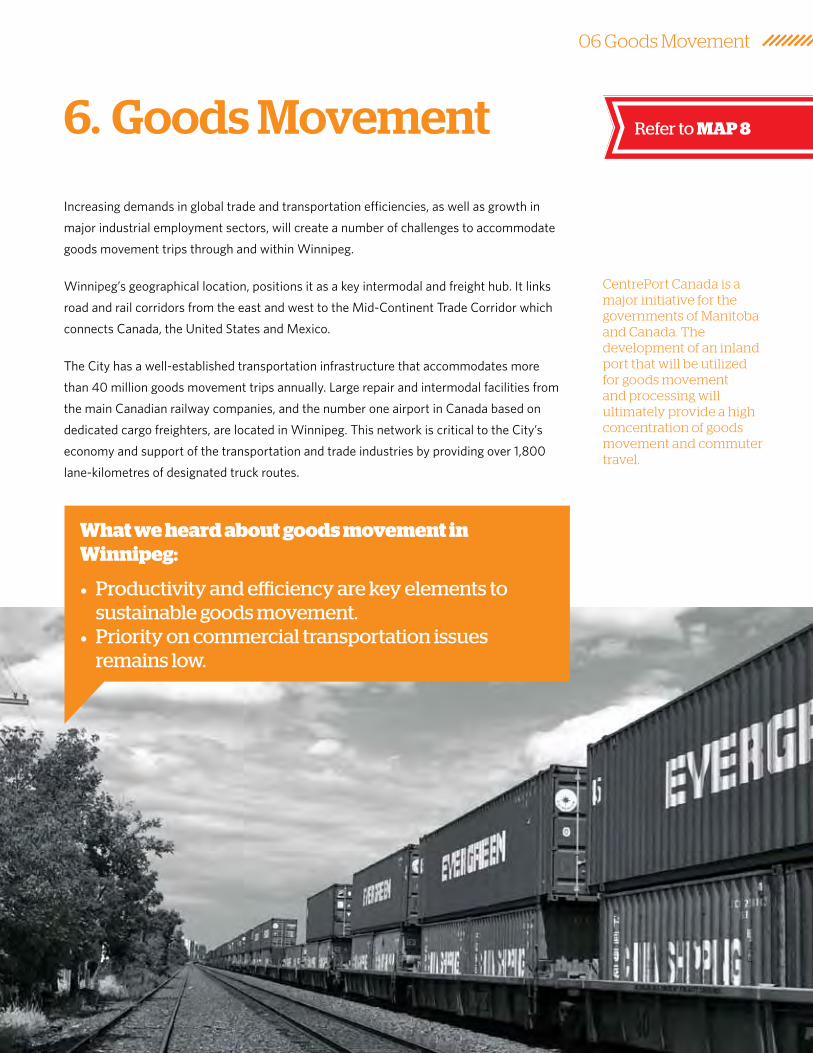
06 Goods Movement
6. Goods Movement
increasing demands in global trade and transportation efficiencies, as well as growth in
major industrial employment sectors, will create a number of challenges to accommodate
goods movement trips through and within Winnipeg.
Winnipeg’s geographical location, positions it as a key intermodal and freight hub. it links
road and rail corridors from the east and west to the Mid-continent Trade corridor which
connects canada, the united states and Mexico.
The city has a well-established transportation infrastructure that accommodates more
than 40 million goods movement trips annually. Large repair and intermodal facilities from
the main canadian railway companies, and the number one airport in canada based on
dedicated cargo freighters, are located in Winnipeg. This network is critical to the city’s
economy and support of the transportation and trade industries by providing over 1,800
lane-kilometres of designated truck routes.
CentrePort Canada is a major initiative for the governments of Manitoba and Canada. The development of an inland port that will be utilized for goods movement and processing will ultimately provide a high concentration of goods movement and commuter travel.
Refer to MAP 8
• Productivity and efficiency are key elements to sustainable goods movement.
• Priority on commercial transportation issues remains low.
What we heard about goods movement in Winnipeg:
Transportation Master PlanWinnipeg
66
Winnipeg’s gross domestic product is projected to grow at an average of 2.5% compounded
annually to 2030 and 88,000 new jobs are forecast by 2031 (conference board of canada,
2007). The majority of these jobs will be in the service industry or targeted to key strategic
sectors including manufacturing and financial services.
all employment sectors have unique locational characteristics and transportation needs.
Providing and maintaining an effective road network to employment lands and large
industrial centres will accommodate current and future goods movement demand. This will
be key to reducing the growing pressures on transportation infrastructure and minimizing
impacts to neighbouring residential and commercial developments.
KEy DIRECTION Balancing the needs of efficient and sustainable goods movement with
those of complete communities will allow the City to remain economically
competitive while maintaining neighbourhood liveability.
DIRECTION ONE
Ensure an effective and sustainable goods movement network that includes
key trade corridors and truck routes is part of the balanced, multi-modal
transportation system.
ENAbLING STRATEGIES
a) adopt and implement the goods movement network as identified on Map 8.
b) continue to work with the transportation industry to direct higher volumes of goods
movement towards the network.
c) continue to work with stakeholders such as the Winnipeg airports authority to support
the 24-hour operations of the James armstrong richardson international airport as a
major centre for goods movement and commercial activity.
06 Goods Movement
d) Explore and support opportunities for innovative goods movement and service that
respond to changing delivery methods.
e) To reduce peak-hour demands, encourage sustainable loading and delivery practices
and review related city policies and design standards.
f) use intelligent transportation systems (iTs) to minimize traffic flows and travel times
while improving safety on the goods movement network.
g) use iTs to collect data on truck movements and volumes to improve efficiency of the
transportation network.
h) continue to build on strategic partnerships with higher levels of government, key
freight, rail and air agencies, and industry stakeholders.
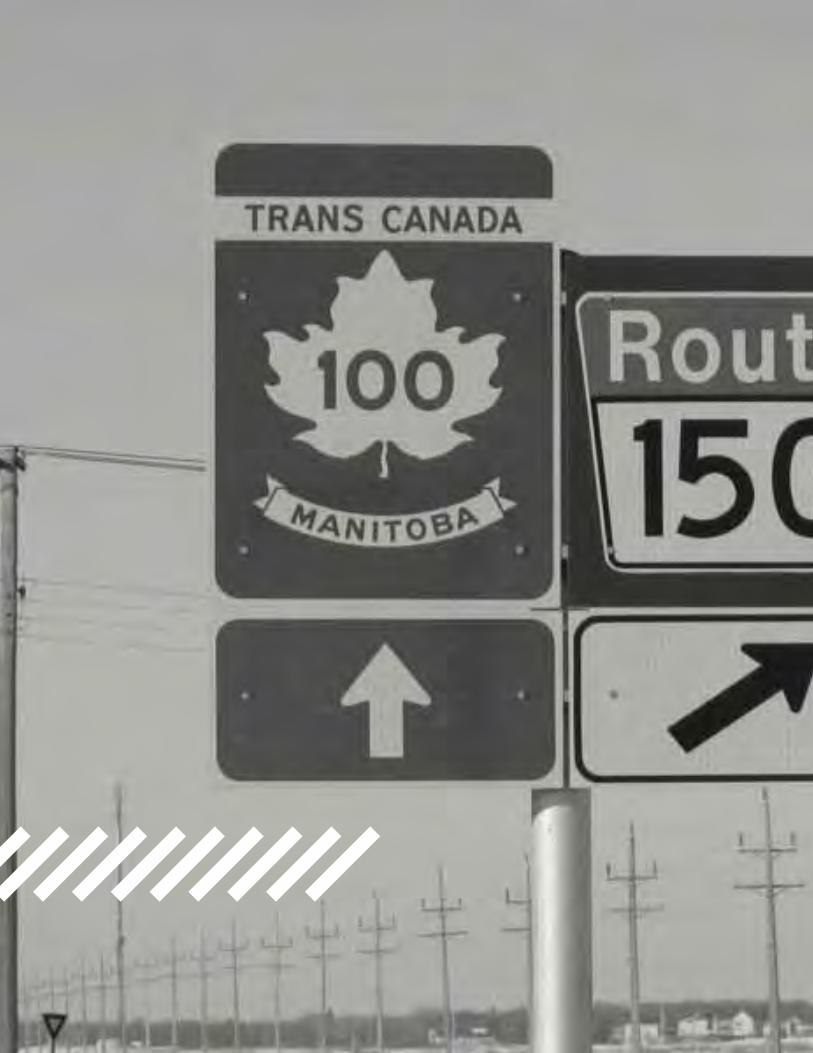
07 Regional Connections
7. Regional Connections
Manitoba’s capital region includes the city of Winnipeg and its surrounding municipalities,
an area with a radius of approximately 50 kilometres from downtown Winnipeg. Main
communities in the capital region include st. andrews, East st. Paul, West st. Paul, selkirk,
and stonewall, connected primarily through the provincial highway network.
as discussed earlier, it is anticipated that population in the capital region outside of the
city of Winnipeg will increase substantially in the future. The conference board of canada
forecasts that areas surrounding the city will grow to over 103,000 people by 2031 resulting
in a doubling of trips to/from the capital region outside Winnipeg. The concern with this
increase in travel is that it primarily impacts the transportation network within the city.
The coordination of transportation planning on a regional scale will therefore be essential.
The provincial government has taken initial steps to coordinate the planning and delivery
of services in the capital region, including the development of guiding principles for the
region and establishing a regional Planning advisory committee. The city of Winnipeg will
continue to participate and contribute to ongoing discussions on the future of governance
and service delivery in the capital region.
Transportation Master PlanWinnipeg
70
KEy DIRECTION The provision of effective and efficient regional transportation links in the
Capital Region is essential to economic prosperity.
DIRECTION ONE
support sustainable transportation linkages between Winnipeg and the
surrounding municipalities.
ENAbLING STRATEGIES
a) Participate with surrounding capital region municipalities in the development of
coordinated transportation objectives
b) support a framework for regional multi-modal transportation service delivery.
c) Explore the feasibility of developing a regional Transportation authority to plan,
implement, and deliver transportation infrastructure and services.
d) support the development of a transportation demand management (TDM) strategy for
the capital region.
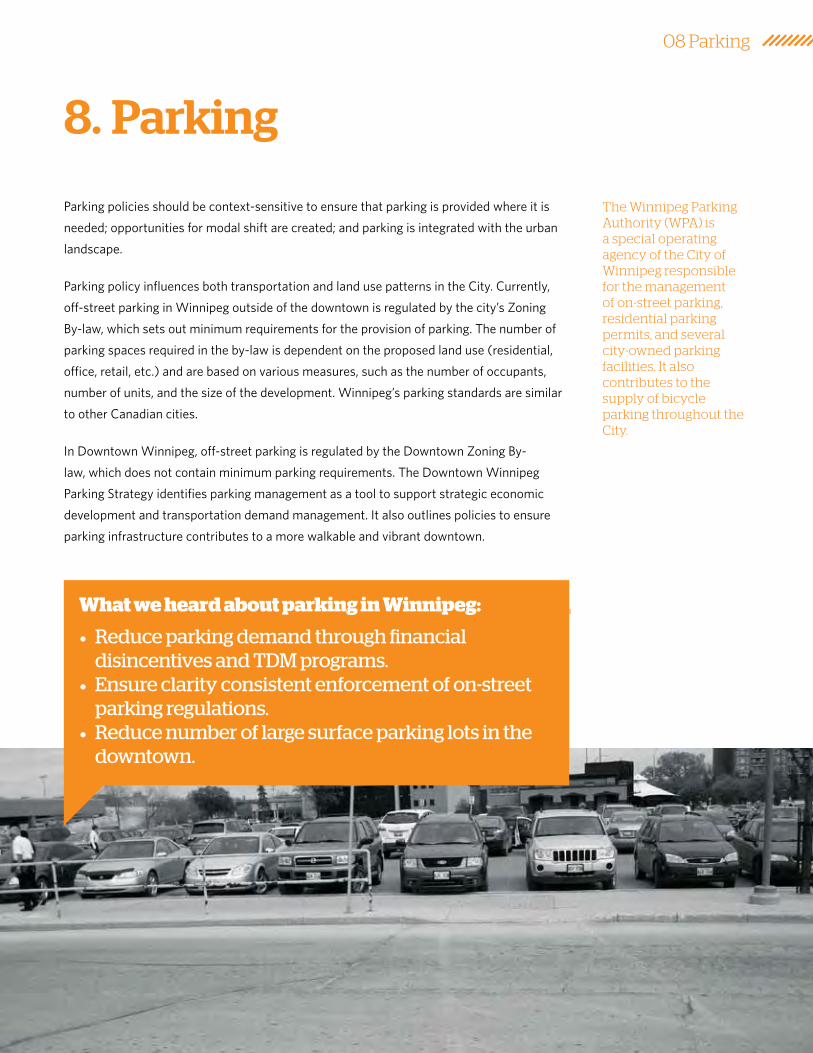
08 Parking
8. Parking
Parking policies should be context-sensitive to ensure that parking is provided where it is
needed; opportunities for modal shift are created; and parking is integrated with the urban
landscape.
Parking policy influences both transportation and land use patterns in the city. currently,
off-street parking in Winnipeg outside of the downtown is regulated by the city’s Zoning
by-law, which sets out minimum requirements for the provision of parking. The number of
parking spaces required in the by-law is dependent on the proposed land use (residential,
office, retail, etc.) and are based on various measures, such as the number of occupants,
number of units, and the size of the development. Winnipeg’s parking standards are similar
to other canadian cities.
in Downtown Winnipeg, off-street parking is regulated by the Downtown Zoning by-
law, which does not contain minimum parking requirements. The Downtown Winnipeg
Parking strategy identifies parking management as a tool to support strategic economic
development and transportation demand management. it also outlines policies to ensure
parking infrastructure contributes to a more walkable and vibrant downtown.
• Reduce parking demand through financial disincentives and TDM programs.
• Ensure clarity consistent enforcement of on-street parking regulations.
• Reduce number of large surface parking lots in the downtown.
What we heard about parking in Winnipeg:
The Winnipeg Parking Authority (WPA) is a special operating agency of the City of Winnipeg responsible for the management of on-street parking, residential parking permits, and several city-owned parking facilities. It also contributes to the supply of bicycle parking throughout the City.
Transportation Master PlanWinnipeg
72
KEy DIRECTION Parking should facilitate access for bicycle and motor vehicle users of the
transportation network to adjacent development in a manner that supports
the concept of complete communities.
DIRECTION ONE
Provide for an effective and appropriate level of parking supply.
ENAbLING STRATEGIES
a) review parking standards contained within the city’s zoning by-laws to ensure
consistency with the vision and objectives in ourWinnipeg, complete communities,
and the TMP.
b) Develop parking standards according to urban structure classification that include
maximum parking regulations and shared parking to reduce parking over supply.
c) Provide opportunities in the development approval process to reduce the number of
parking spaces required by the Zoning by-law. considerations for parking reduction
include:
- proximity to rapid transit corridors and stations;
- proximity to transit routes operating at a high frequency;
- proximity to municipally-owned parking facilities;
- providing parking spaces for car sharing; and
- entering into shared parking arrangements with adjacent development.
d) allow for payment in-lieu of providing parking or to reduce parking requirement, with
specific targets for the use of such payment to develop municipally-owned shared
parking facilities.
e) continue to develop municipally-owned parking facilities through the Winnipeg Parking
authority in key locations.
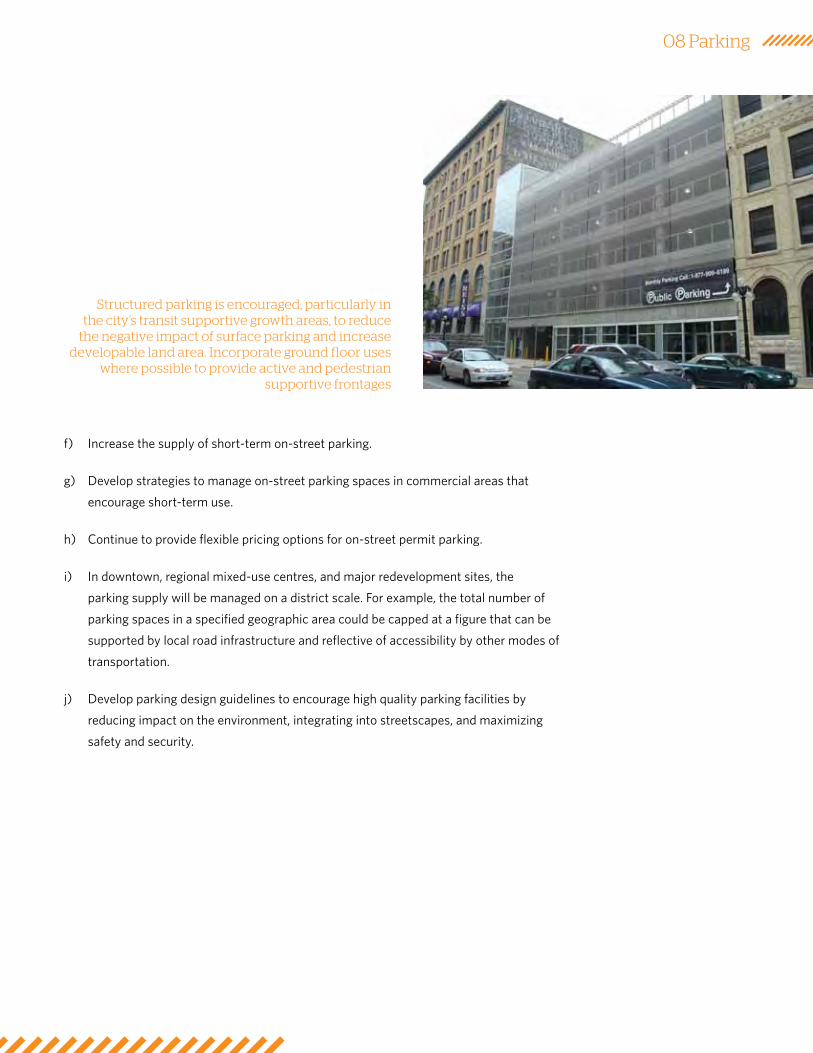
08 Parking
f) increase the supply of short-term on-street parking.
g) Develop strategies to manage on-street parking spaces in commercial areas that
encourage short-term use.
h) continue to provide flexible pricing options for on-street permit parking.
i) in downtown, regional mixed-use centres, and major redevelopment sites, the
parking supply will be managed on a district scale. for example, the total number of
parking spaces in a specified geographic area could be capped at a figure that can be
supported by local road infrastructure and reflective of accessibility by other modes of
transportation.
j) Develop parking design guidelines to encourage high quality parking facilities by
reducing impact on the environment, integrating into streetscapes, and maximizing
safety and security.
Structured parking is encouraged, particularly in the city’s transit supportive growth areas, to reduce
the negative impact of surface parking and increase developable land area. Incorporate ground floor uses
where possible to provide active and pedestrian supportive frontages
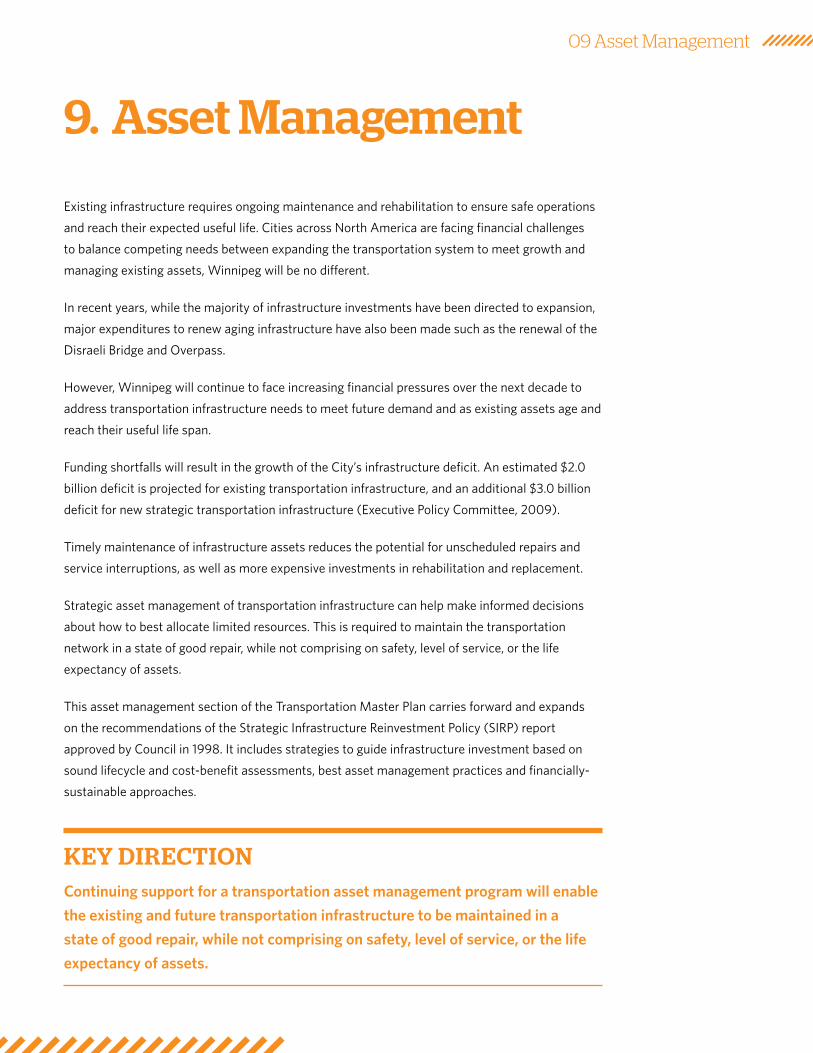
09 Asset Management
9. Asset Management
Existing infrastructure requires ongoing maintenance and rehabilitation to ensure safe operations
and reach their expected useful life. cities across north america are facing financial challenges
to balance competing needs between expanding the transportation system to meet growth and
managing existing assets, Winnipeg will be no different.
in recent years, while the majority of infrastructure investments have been directed to expansion,
major expenditures to renew aging infrastructure have also been made such as the renewal of the
Disraeli bridge and overpass.
However, Winnipeg will continue to face increasing financial pressures over the next decade to
address transportation infrastructure needs to meet future demand and as existing assets age and
reach their useful life span.
funding shortfalls will result in the growth of the city’s infrastructure deficit. an estimated $2.0
billion deficit is projected for existing transportation infrastructure, and an additional $3.0 billion
deficit for new strategic transportation infrastructure (Executive Policy committee, 2009).
Timely maintenance of infrastructure assets reduces the potential for unscheduled repairs and
service interruptions, as well as more expensive investments in rehabilitation and replacement.
strategic asset management of transportation infrastructure can help make informed decisions
about how to best allocate limited resources. This is required to maintain the transportation
network in a state of good repair, while not comprising on safety, level of service, or the life
expectancy of assets.
This asset management section of the Transportation Master Plan carries forward and expands
on the recommendations of the strategic infrastructure reinvestment Policy (sirP) report
approved by council in 1998. it includes strategies to guide infrastructure investment based on
sound lifecycle and cost-benefit assessments, best asset management practices and financially-
sustainable approaches.
KEy DIRECTION Continuing support for a transportation asset management program will enable
the existing and future transportation infrastructure to be maintained in a
state of good repair, while not comprising on safety, level of service, or the life
expectancy of assets.
Transportation Master PlanWinnipeg
76
DIRECTION ONE
Expand the existing transportation asset management program to respond
to current and anticipated infrastructure maintenance requirements.
ENAbLING STRATEGIES
a) refine the existing Transportation asset Management program to consider the needs of
all users in the planning, engineering and financing phases of all new and rehabilitation
transportation projects.
b) update the sirP report with a transportation-specific component to reflect best
practices in transportation asset management and reflect new infrastructure projects.
c) continue to implement the following recommendations of the 1998 sirP report until an
updated report is adopted:
» subject new or rehabilitation projects to life cycle costing analyses.
» Minimize deferral of existing infrastructure maintenance and only defer when
impacts to its useful life and life cycle are minimal.
» factor maintenance costs into initial cost to ensure additional funding is in place for
future incremental maintenance costs.
» support computerized management systems for maintenance programs.
» Encourage and implement advanced techniques, improved technologies, best
practices and sustainable materials in infrastructure building and maintenance.
d) coordinate preventative or planned maintenance with new or redevelopment projects
to reduce duplication in work, minimize impacts on service, and reduce additional
strains on an asset’s useful life.
e) review and refine the current policy for street cleaning, snow removal and ice control,
and ongoing maintenance as it relates to the multi-modal transportation network.
f) consider the adaptive re-use of structures for other modes, such as active
transportation.
g) follow environmentally sustainable principles and practices, including the recycling
and reuse of building materials, using energy efficient lighting and signal devices, and
following best stormwater management practices.
h) implement an asset management system for traffic control devices.
i) update and maintain transportation planning tools to meet future requirements and
integrate with traffic operations.
10 Implementation, Funding, and Plan Monitoring
10. Implementation, Funding, and Plan Monitoring
It is essential to have a comprehensive implementation, funding, and plan monitoring framework as part of the transportation master plan. It provides guidance for the actions to be taken by different stakeholders and city agencies in the short-, medium-, and long-term. Most importantly, it provides the framework necessary to evaluate and monitor the progress of the plan.
10.1 Implementation Strategy
The following section outlines the strategy to implement the Directions and Enabling
strategies of the Transportation Master Plan (TMP). it reflects the vision of ourWinnipeg
as it relates to transportation while supporting the strategic directions of complete
communities, sustainable Transportation, and a sustainable Winnipeg.
Enabling Strategies
EX 10-1 summarizes the enabling strategies identified throughout the plan, providing the
timeframe of the action within the short-, medium-, and long-term. actions that initiated in
an earlier time frame, but continued through the later periods are denoted with a symbol.
connections to the key strategic goals of the Transportation Master Plan are indicated in the
table. Partners in the implementation of each enabling strategy and an estimate of the level
of effort and potential capital budget impact are also included.
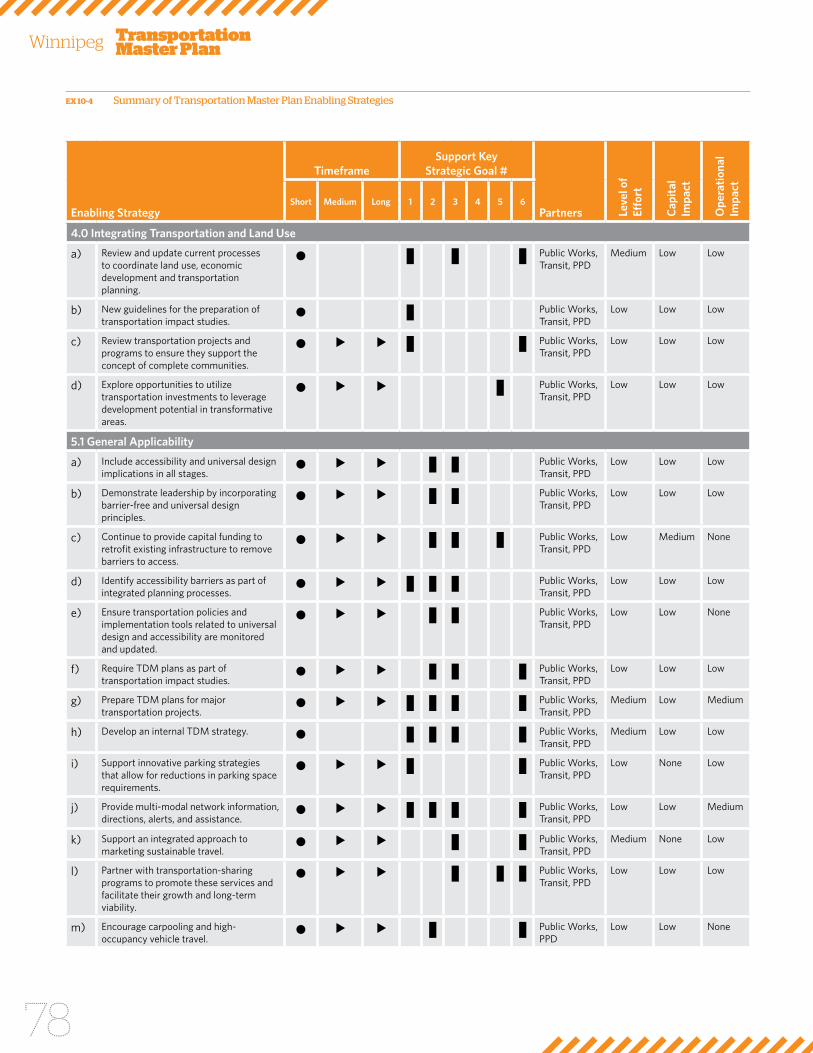
Transportation Master PlanWinnipeg
78
Enabling Strategy
TimeframeSupport Key
Strategic Goal #
Partners Leve
l of
Effo
rt
Cap
ital
Im
pact
Ope
rati
onal
Im
pact
Short Medium Long 1 2 3 4 5 6
4.0 Integrating Transportation and Land Use
a) review and update current processes to coordinate land use, economic development and transportation planning.
¦ ¦ ¦ Public Works, Transit, PPD
Medium Low Low
b) new guidelines for the preparation of transportation impact studies.
¦ Public Works, Transit, PPD
Low Low Low
c) review transportation projects and programs to ensure they support the concept of complete communities.
¦ ¦ Public Works, Transit, PPD
Low Low Low
d) Explore opportunities to utilize transportation investments to leverage development potential in transformative areas.
¦ Public Works, Transit, PPD
Low Low Low
5.1 General Applicability
a) include accessibility and universal design implications in all stages.
¦ ¦ Public Works, Transit, PPD
Low Low Low
b) Demonstrate leadership by incorporating barrier-free and universal design principles.
¦ ¦ Public Works, Transit, PPD
Low Low Low
c) continue to provide capital funding to retrofit existing infrastructure to remove barriers to access.
¦ ¦ ¦ Public Works, Transit, PPD
Low Medium none
d) identify accessibility barriers as part of integrated planning processes.
¦ ¦ ¦ Public Works, Transit, PPD
Low Low Low
e) Ensure transportation policies and implementation tools related to universal design and accessibility are monitored and updated.
¦ ¦ Public Works, Transit, PPD
Low Low none
f) require TDM plans as part of transportation impact studies.
¦ ¦ ¦ Public Works, Transit, PPD
Low Low Low
g) Prepare TDM plans for major transportation projects.
¦ ¦ ¦ ¦ Public Works, Transit, PPD
Medium Low Medium
h) Develop an internal TDM strategy. ¦ ¦ ¦ ¦ Public Works, Transit, PPD
Medium Low Low
i) support innovative parking strategies that allow for reductions in parking space requirements.
¦ ¦ Public Works, Transit, PPD
Low none Low
j) Provide multi-modal network information, directions, alerts, and assistance.
¦ ¦ ¦ ¦ Public Works, Transit, PPD
Low Low Medium
k) support an integrated approach to marketing sustainable travel.
¦ ¦ Public Works, Transit, PPD
Medium none Low
l) Partner with transportation-sharing programs to promote these services and facilitate their growth and long-term viability.
¦ ¦ ¦ Public Works, Transit, PPD
Low Low Low
m) Encourage carpooling and high-occupancy vehicle travel.
¦ ¦ Public Works, PPD
Low Low none
EX 10-4 Summary of Transportation Master Plan Enabling Strategies
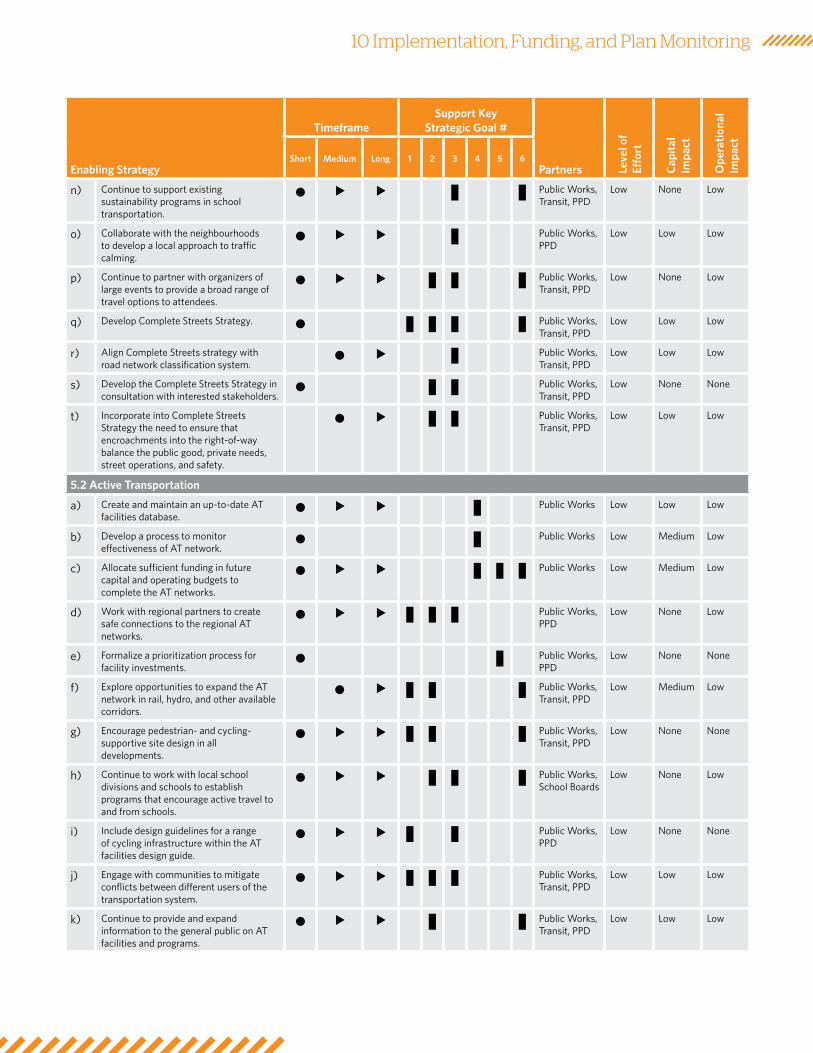
10 Implementation, Funding, and Plan Monitoring
Enabling Strategy
TimeframeSupport Key
Strategic Goal #
Partners Leve
l of
Effo
rt
Cap
ital
Im
pact
Ope
rati
onal
Im
pact
Short Medium Long 1 2 3 4 5 6
n) continue to support existing sustainability programs in school transportation.
¦ ¦ Public Works, Transit, PPD
Low none Low
o) collaborate with the neighbourhoods to develop a local approach to traffic calming.
¦ Public Works, PPD
Low Low Low
p) continue to partner with organizers of large events to provide a broad range of travel options to attendees.
¦ ¦ ¦ Public Works, Transit, PPD
Low none Low
q) Develop complete streets strategy. ¦ ¦ ¦ ¦ Public Works, Transit, PPD
Low Low Low
r) align complete streets strategy with road network classification system.
¦ Public Works, Transit, PPD
Low Low Low
s) Develop the complete streets strategy in consultation with interested stakeholders.
¦ ¦ Public Works, Transit, PPD
Low none none
t) incorporate into complete streets strategy the need to ensure that encroachments into the right-of-way balance the public good, private needs, street operations, and safety.
¦ ¦ Public Works, Transit, PPD
Low Low Low
5.2 Active Transportation
a) create and maintain an up-to-date aT facilities database.
¦ Public Works Low Low Low
b) Develop a process to monitor effectiveness of aT network.
¦ Public Works Low Medium Low
c) allocate sufficient funding in future capital and operating budgets to complete the aT networks.
¦ ¦ ¦ Public Works Low Medium Low
d) Work with regional partners to create safe connections to the regional aT networks.
¦ ¦ ¦ Public Works, PPD
Low none Low
e) formalize a prioritization process for facility investments.
¦ Public Works, PPD
Low none none
f) Explore opportunities to expand the aT network in rail, hydro, and other available corridors.
¦ ¦ ¦ Public Works, Transit, PPD
Low Medium Low
g) Encourage pedestrian- and cycling-supportive site design in all developments.
¦ ¦ ¦ Public Works, Transit, PPD
Low none none
h) continue to work with local school divisions and schools to establish programs that encourage active travel to and from schools.
¦ ¦ ¦ Public Works, school boards
Low none Low
i) include design guidelines for a range of cycling infrastructure within the aT facilities design guide.
¦ ¦ Public Works, PPD
Low none none
j) Engage with communities to mitigate conflicts between different users of the transportation system.
¦ ¦ ¦ Public Works, Transit, PPD
Low Low Low
k) continue to provide and expand information to the general public on aT facilities and programs.
¦ ¦ Public Works, Transit, PPD
Low Low Low
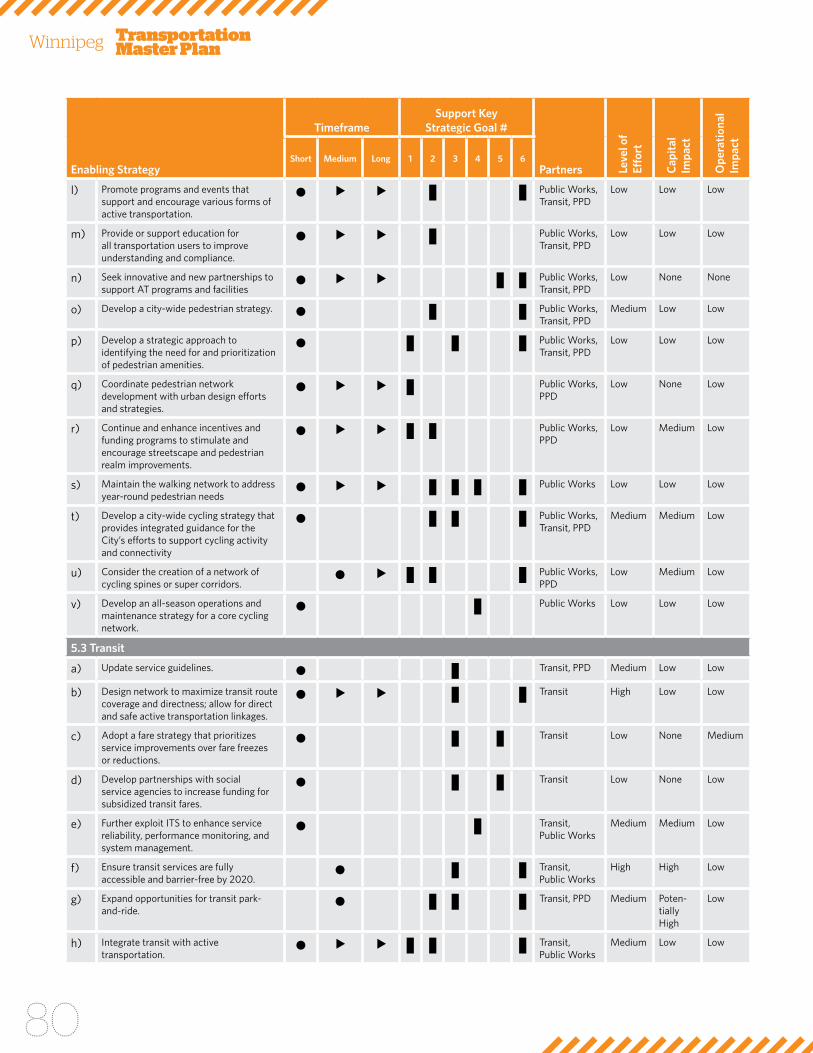
Transportation Master PlanWinnipeg
80
Enabling Strategy
TimeframeSupport Key
Strategic Goal #
Partners Leve
l of
Effo
rt
Cap
ital
Im
pact
Ope
rati
onal
Im
pact
Short Medium Long 1 2 3 4 5 6
l) Promote programs and events that support and encourage various forms of active transportation.
¦ ¦ Public Works, Transit, PPD
Low Low Low
m) Provide or support education for all transportation users to improve understanding and compliance.
¦ Public Works, Transit, PPD
Low Low Low
n) seek innovative and new partnerships to support aT programs and facilities
¦ ¦ Public Works, Transit, PPD
Low none none
o) Develop a city-wide pedestrian strategy. ¦ ¦ Public Works, Transit, PPD
Medium Low Low
p) Develop a strategic approach to identifying the need for and prioritization of pedestrian amenities.
¦ ¦ ¦ Public Works, Transit, PPD
Low Low Low
q) coordinate pedestrian network development with urban design efforts and strategies.
¦ Public Works, PPD
Low none Low
r) continue and enhance incentives and funding programs to stimulate and encourage streetscape and pedestrian realm improvements.
¦ ¦ Public Works, PPD
Low Medium Low
s) Maintain the walking network to address year-round pedestrian needs
¦ ¦ ¦ ¦ Public Works Low Low Low
t) Develop a city-wide cycling strategy that provides integrated guidance for the city’s efforts to support cycling activity and connectivity
¦ ¦ ¦ Public Works, Transit, PPD
Medium Medium Low
u) consider the creation of a network of cycling spines or super corridors.
¦ ¦ ¦ Public Works, PPD
Low Medium Low
v) Develop an all-season operations and maintenance strategy for a core cycling network.
¦ Public Works Low Low Low
5.3 Transit
a) update service guidelines. ¦ Transit, PPD Medium Low Low
b) Design network to maximize transit route coverage and directness; allow for direct and safe active transportation linkages.
¦ ¦ Transit High Low Low
c) adopt a fare strategy that prioritizes service improvements over fare freezes or reductions.
¦ ¦ Transit Low none Medium
d) Develop partnerships with social service agencies to increase funding for subsidized transit fares.
¦ ¦ Transit Low none Low
e) further exploit iTs to enhance service reliability, performance monitoring, and system management.
¦ Transit, Public Works
Medium Medium Low
f) Ensure transit services are fully accessible and barrier-free by 2020.
¦ ¦ Transit, Public Works
High High Low
g) Expand opportunities for transit park-and-ride.
¦ ¦ ¦ Transit, PPD Medium Poten-tially High
Low
h) integrate transit with active transportation.
¦ ¦ ¦ Transit, Public Works
Medium Low Low
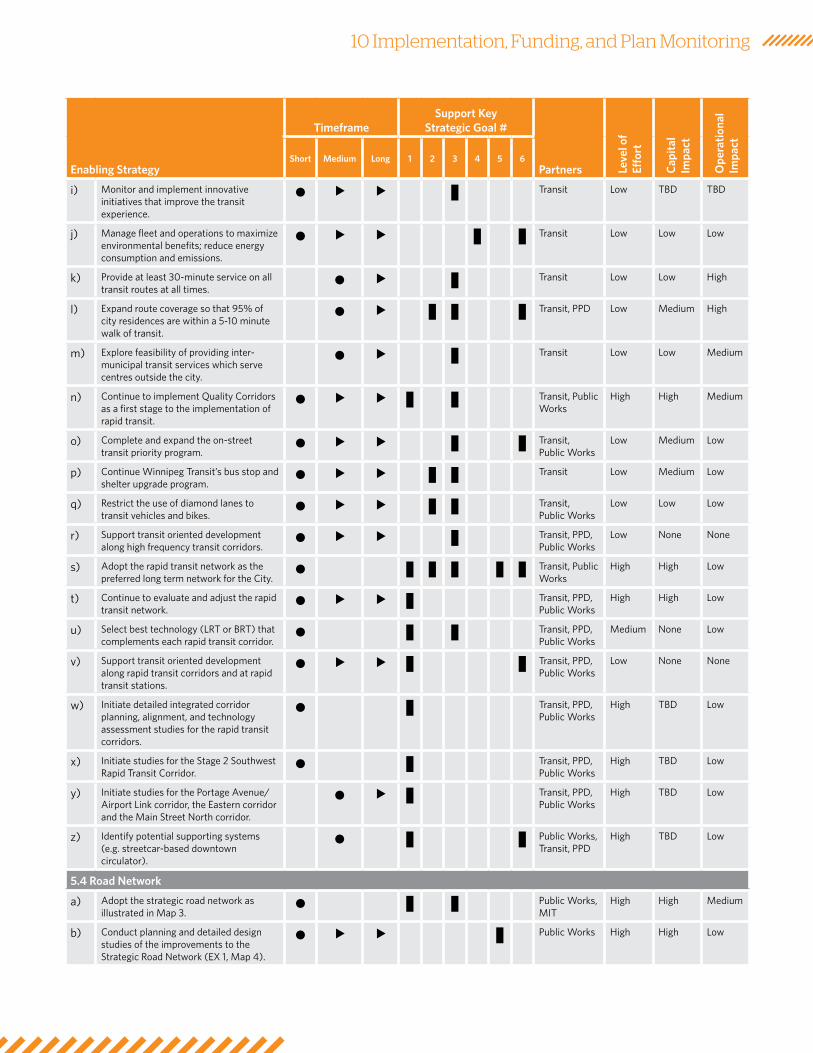
10 Implementation, Funding, and Plan Monitoring
Enabling Strategy
TimeframeSupport Key
Strategic Goal #
Partners Leve
l of
Effo
rt
Cap
ital
Im
pact
Ope
rati
onal
Im
pact
Short Medium Long 1 2 3 4 5 6
i) Monitor and implement innovative initiatives that improve the transit experience.
¦ Transit Low TbD TbD
j) Manage fleet and operations to maximize environmental benefits; reduce energy consumption and emissions.
¦ ¦ Transit Low Low Low
k) Provide at least 30-minute service on all transit routes at all times.
¦ Transit Low Low High
l) Expand route coverage so that 95% of city residences are within a 5-10 minute walk of transit.
¦ ¦ ¦ Transit, PPD Low Medium High
m) Explore feasibility of providing inter-municipal transit services which serve centres outside the city.
¦ Transit Low Low Medium
n) continue to implement Quality corridors as a first stage to the implementation of rapid transit.
¦ ¦ Transit, Public Works
High High Medium
o) complete and expand the on-street transit priority program.
¦ ¦ Transit, Public Works
Low Medium Low
p) continue Winnipeg Transit’s bus stop and shelter upgrade program.
¦ ¦ Transit Low Medium Low
q) restrict the use of diamond lanes to transit vehicles and bikes.
¦ ¦ Transit, Public Works
Low Low Low
r) support transit oriented development along high frequency transit corridors.
¦ Transit, PPD, Public Works
Low none none
s) adopt the rapid transit network as the preferred long term network for the city.
¦ ¦ ¦ ¦ ¦ Transit, Public Works
High High Low
t) continue to evaluate and adjust the rapid transit network.
¦ Transit, PPD, Public Works
High High Low
u) select best technology (LrT or brT) that complements each rapid transit corridor.
¦ ¦ Transit, PPD, Public Works
Medium none Low
v) support transit oriented development along rapid transit corridors and at rapid transit stations.
¦ ¦ Transit, PPD, Public Works
Low none none
w) initiate detailed integrated corridor planning, alignment, and technology assessment studies for the rapid transit corridors.
¦ Transit, PPD, Public Works
High TbD Low
x) initiate studies for the stage 2 southwest rapid Transit corridor.
¦ Transit, PPD, Public Works
High TbD Low
y) initiate studies for the Portage avenue/airport Link corridor, the Eastern corridor and the Main street north corridor.
¦ Transit, PPD, Public Works
High TbD Low
z) identify potential supporting systems (e.g. streetcar-based downtown circulator).
¦ ¦ Public Works, Transit, PPD
High TbD Low
5.4 Road Network
a) adopt the strategic road network as illustrated in Map 3.
¦ ¦ Public Works, MiT
High High Medium
b) conduct planning and detailed design studies of the improvements to the strategic road network (EX 1, Map 4).
¦ Public Works High High Low
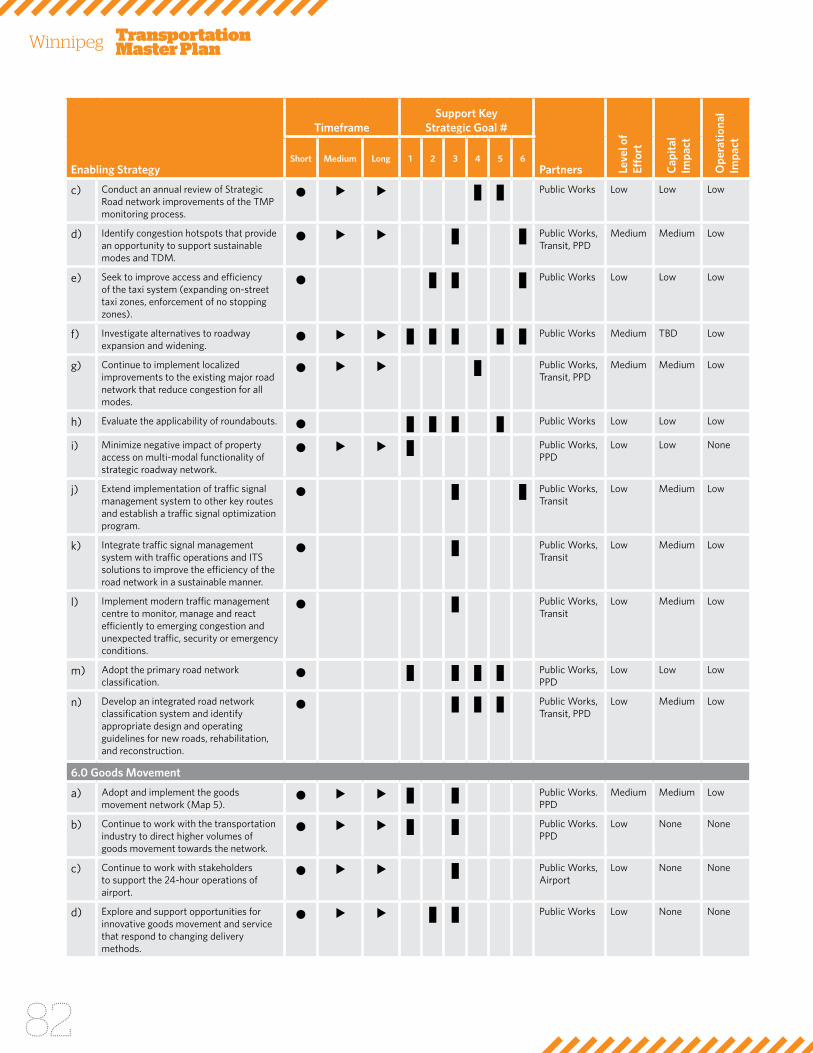
Transportation Master PlanWinnipeg
82
Enabling Strategy
TimeframeSupport Key
Strategic Goal #
Partners Leve
l of
Effo
rt
Cap
ital
Im
pact
Ope
rati
onal
Im
pact
Short Medium Long 1 2 3 4 5 6
c) conduct an annual review of strategic road network improvements of the TMP monitoring process.
¦ ¦ Public Works Low Low Low
d) identify congestion hotspots that provide an opportunity to support sustainable modes and TDM.
¦ ¦ Public Works, Transit, PPD
Medium Medium Low
e) seek to improve access and efficiency of the taxi system (expanding on-street taxi zones, enforcement of no stopping zones).
¦ ¦ ¦ Public Works Low Low Low
f) investigate alternatives to roadway expansion and widening.
¦ ¦ ¦ ¦ ¦ Public Works Medium TbD Low
g) continue to implement localized improvements to the existing major road network that reduce congestion for all modes.
¦ Public Works, Transit, PPD
Medium Medium Low
h) Evaluate the applicability of roundabouts. ¦ ¦ ¦ ¦ Public Works Low Low Low
i) Minimize negative impact of property access on multi-modal functionality of strategic roadway network.
¦ Public Works, PPD
Low Low none
j) Extend implementation of traffic signal management system to other key routes and establish a traffic signal optimization program.
¦ ¦ Public Works, Transit
Low Medium Low
k) integrate traffic signal management system with traffic operations and iTs solutions to improve the efficiency of the road network in a sustainable manner.
¦ Public Works, Transit
Low Medium Low
l) implement modern traffic management centre to monitor, manage and react efficiently to emerging congestion and unexpected traffic, security or emergency conditions.
¦ Public Works, Transit
Low Medium Low
m) adopt the primary road network classification.
¦ ¦ ¦ ¦ Public Works, PPD
Low Low Low
n) Develop an integrated road network classification system and identify appropriate design and operating guidelines for new roads, rehabilitation, and reconstruction.
¦ ¦ ¦ Public Works, Transit, PPD
Low Medium Low
6.0 Goods Movement
a) adopt and implement the goods movement network (Map 5).
¦ ¦ Public Works. PPD
Medium Medium Low
b) continue to work with the transportation industry to direct higher volumes of goods movement towards the network.
¦ ¦ Public Works. PPD
Low none none
c) continue to work with stakeholders to support the 24-hour operations of airport.
¦ Public Works, airport
Low none none
d) Explore and support opportunities for innovative goods movement and service that respond to changing delivery methods.
¦ ¦ Public Works Low none none
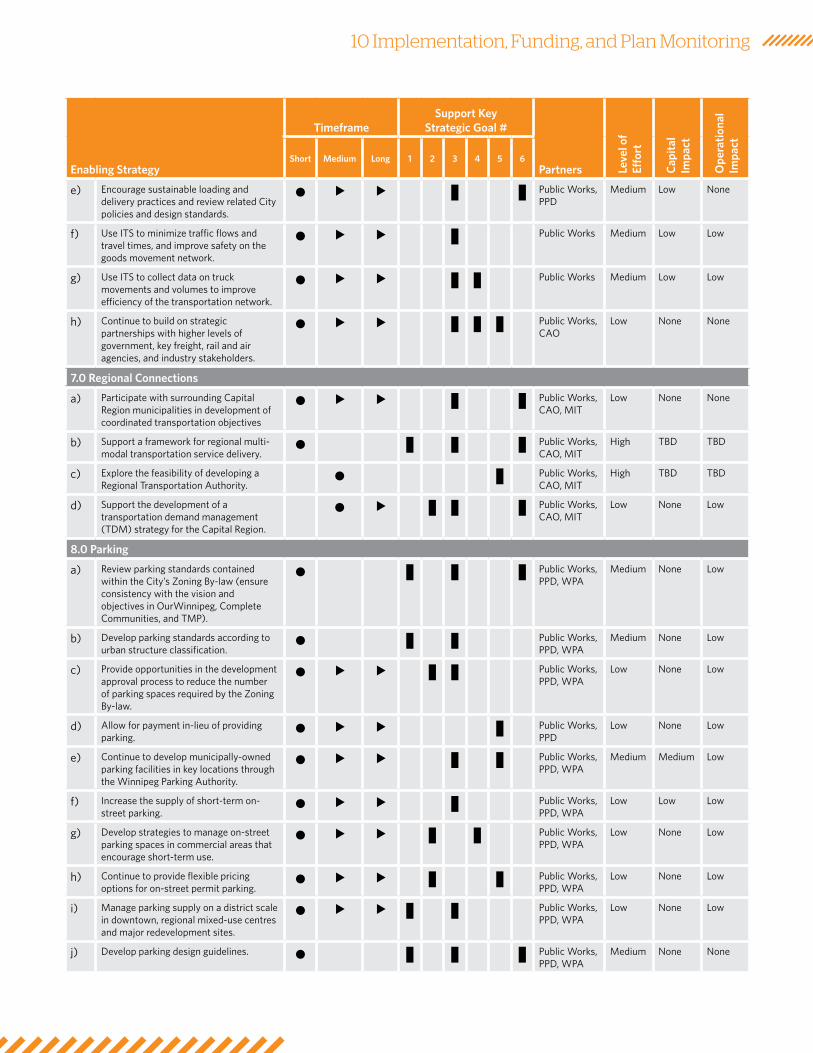
10 Implementation, Funding, and Plan Monitoring
Enabling Strategy
TimeframeSupport Key
Strategic Goal #
Partners Leve
l of
Effo
rt
Cap
ital
Im
pact
Ope
rati
onal
Im
pact
Short Medium Long 1 2 3 4 5 6
e) Encourage sustainable loading and delivery practices and review related city policies and design standards.
¦ ¦ Public Works, PPD
Medium Low none
f) use iTs to minimize traffic flows and travel times, and improve safety on the goods movement network.
¦ Public Works Medium Low Low
g) use iTs to collect data on truck movements and volumes to improve efficiency of the transportation network.
¦ ¦ Public Works Medium Low Low
h) continue to build on strategic partnerships with higher levels of government, key freight, rail and air agencies, and industry stakeholders.
¦ ¦ ¦ Public Works, cao
Low none none
7.0 Regional Connections
a) Participate with surrounding capital region municipalities in development of coordinated transportation objectives
¦ ¦ Public Works, cao, MiT
Low none none
b) support a framework for regional multi-modal transportation service delivery.
¦ ¦ ¦ Public Works, cao, MiT
High TbD TbD
c) Explore the feasibility of developing a regional Transportation authority.
¦ Public Works, cao, MiT
High TbD TbD
d) support the development of a transportation demand management (TDM) strategy for the capital region.
¦ ¦ ¦ Public Works, cao, MiT
Low none Low
8.0 Parking
a) review parking standards contained within the city’s Zoning by-law (ensure consistency with the vision and objectives in ourWinnipeg, complete communities, and TMP).
¦ ¦ ¦ Public Works, PPD, WPa
Medium none Low
b) Develop parking standards according to urban structure classification.
¦ ¦ Public Works, PPD, WPa
Medium none Low
c) Provide opportunities in the development approval process to reduce the number of parking spaces required by the Zoning by-law.
¦ ¦ Public Works, PPD, WPa
Low none Low
d) allow for payment in-lieu of providing parking.
¦ Public Works, PPD
Low none Low
e) continue to develop municipally-owned parking facilities in key locations through the Winnipeg Parking authority.
¦ ¦ Public Works, PPD, WPa
Medium Medium Low
f) increase the supply of short-term on-street parking.
¦ Public Works, PPD, WPa
Low Low Low
g) Develop strategies to manage on-street parking spaces in commercial areas that encourage short-term use.
¦ ¦ Public Works, PPD, WPa
Low none Low
h) continue to provide flexible pricing options for on-street permit parking.
¦ ¦ Public Works, PPD, WPa
Low none Low
i) Manage parking supply on a district scale in downtown, regional mixed-use centres and major redevelopment sites.
¦ ¦ Public Works, PPD, WPa
Low none Low
j) Develop parking design guidelines. ¦ ¦ ¦ Public Works, PPD, WPa
Medium none none
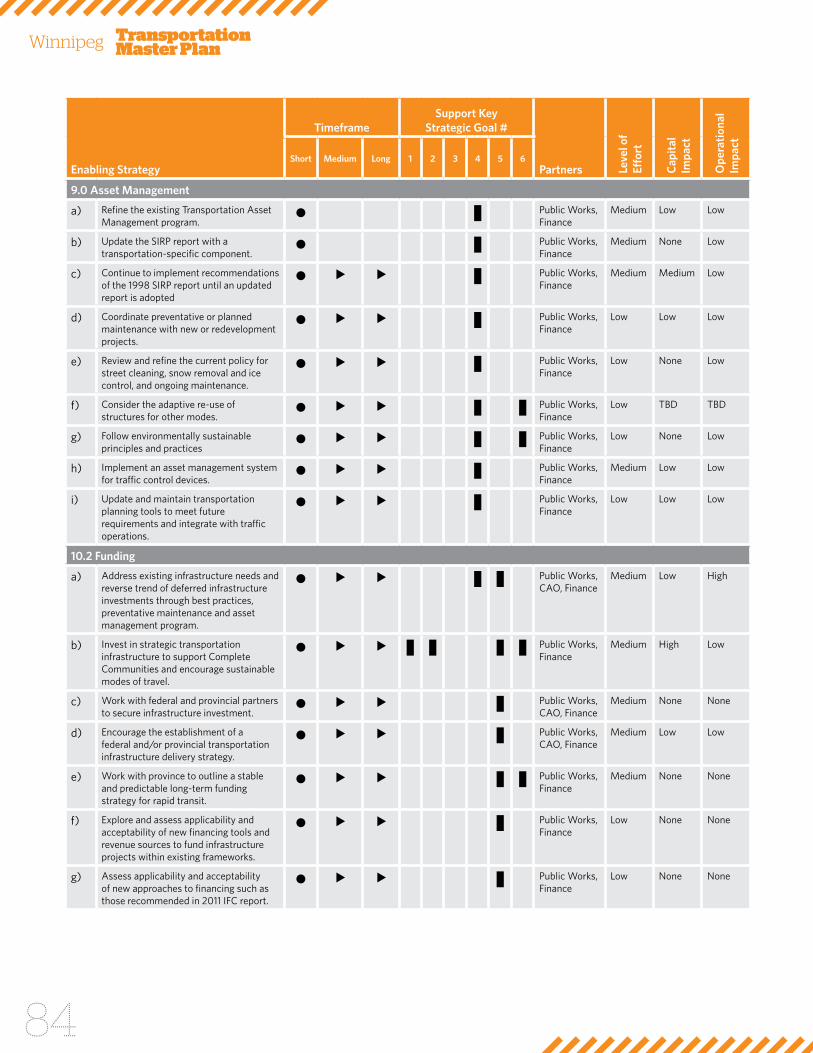
Transportation Master PlanWinnipeg
84
Enabling Strategy
TimeframeSupport Key
Strategic Goal #
Partners Leve
l of
Effo
rt
Cap
ital
Im
pact
Ope
rati
onal
Im
pact
Short Medium Long 1 2 3 4 5 6
9.0 Asset Management
a) refine the existing Transportation asset Management program.
¦ Public Works, finance
Medium Low Low
b) update the sirP report with a transportation-specific component.
¦ Public Works, finance
Medium none Low
c) continue to implement recommendations of the 1998 sirP report until an updated report is adopted
¦ Public Works, finance
Medium Medium Low
d) coordinate preventative or planned maintenance with new or redevelopment projects.
¦ Public Works, finance
Low Low Low
e) review and refine the current policy for street cleaning, snow removal and ice control, and ongoing maintenance.
¦ Public Works, finance
Low none Low
f) consider the adaptive re-use of structures for other modes.
¦ ¦ Public Works, finance
Low TbD TbD
g) follow environmentally sustainable principles and practices
¦ ¦ Public Works, finance
Low none Low
h) implement an asset management system for traffic control devices.
¦ Public Works, finance
Medium Low Low
i) update and maintain transportation planning tools to meet future requirements and integrate with traffic operations.
¦ Public Works, finance
Low Low Low
10.2 Funding
a) address existing infrastructure needs and reverse trend of deferred infrastructure investments through best practices, preventative maintenance and asset management program.
¦ ¦ Public Works, cao, finance
Medium Low High
b) invest in strategic transportation infrastructure to support complete communities and encourage sustainable modes of travel.
¦ ¦ ¦ ¦ Public Works, finance
Medium High Low
c) Work with federal and provincial partners to secure infrastructure investment.
¦ Public Works, cao, finance
Medium none none
d) Encourage the establishment of a federal and/or provincial transportation infrastructure delivery strategy.
¦ Public Works, cao, finance
Medium Low Low
e) Work with province to outline a stable and predictable long-term funding strategy for rapid transit.
¦ ¦ Public Works, finance
Medium none none
f) Explore and assess applicability and acceptability of new financing tools and revenue sources to fund infrastructure projects within existing frameworks.
¦ Public Works, finance
Low none none
g) assess applicability and acceptability of new approaches to financing such as those recommended in 2011 ifc report.
¦ Public Works, finance
Low none none
10 Implementation, Funding, and Plan Monitoring
Early Action Items
Demonstrating action early in the implementation of the TMP will be important to assure
its long term success. The implementation plan identifies several “Early actions” that may
have a major impact on the transportation network. They would also build public and political
support and momentum for the overall TMP. These “Early actions” are identified below.
COMPLETE STREETS
The initiation of a complete streets strategy for Winnipeg should be a key priority that would
have a significant impact. as the strategy is developed, opportunities should be identified
to pilot and demonstrate complete streets, such as scheduled and budgeted road rebuilding
projects. Wherever possible, these pilot projects should be publicized and marketed widely
with educational and awareness programs and organizing community events and street
festivals to mark its completion.
RAPID TRANSIT
The southwest rapid Transit corridor is just the first step to a network of rapid transit
throughout the city of Winnipeg. it will offer a glimpse of how fast and reliable transit can
be a competitive and attractive alternative to driving. Maintaining the momentum from
this initial investment into the overall rapid transit network will be important to ensure the
rest of the network is built in a timely manner. securing the commitment and the funding
to complete the southwest rapid Transit corridor to the university of Manitoba will further
demonstrate the benefits of rapid transit. The city can take proactive steps to continue
to prepare other corridors for rapid transit by building up ridership through increased
frequencies and limited stop service. Marketing and branding of these corridors to make
future rapid transit “visible” in communities should also be considered to increase public
awareness and support.
ACTION ON REGIONAL TRANSPORTATION
The third early action will be to begin addressing regional transportation issues in Manitoba’s
capital region, as significant growth in travel demand between Winnipeg and surrounding
areas is predicted. in the short term, a regional Transportation Working group composed
of representatives from capital region municipalities and Manitoba infrastructure and
Transportation should be created. This Working group will establish a much needed dialogue
and framework from which regional transportation issues can be addressed. it can also
explore the feasibility of establishing a regional transportation authority, which can improve
the coordination and delivery of transportation infrastructure and services on a regional scale.
ExPAND THE TRAFFIC SIGNALS MANAGEMENT SySTEM
The continuation and expansion of the traffic signals management system will build upon the
initiative that began in 2008. it will enable the implementation of intelligent transportation
system (iTs) solutions, and allow for the establishment of a traffic management centre to
address traffic management problems more efficiently and pro-actively.
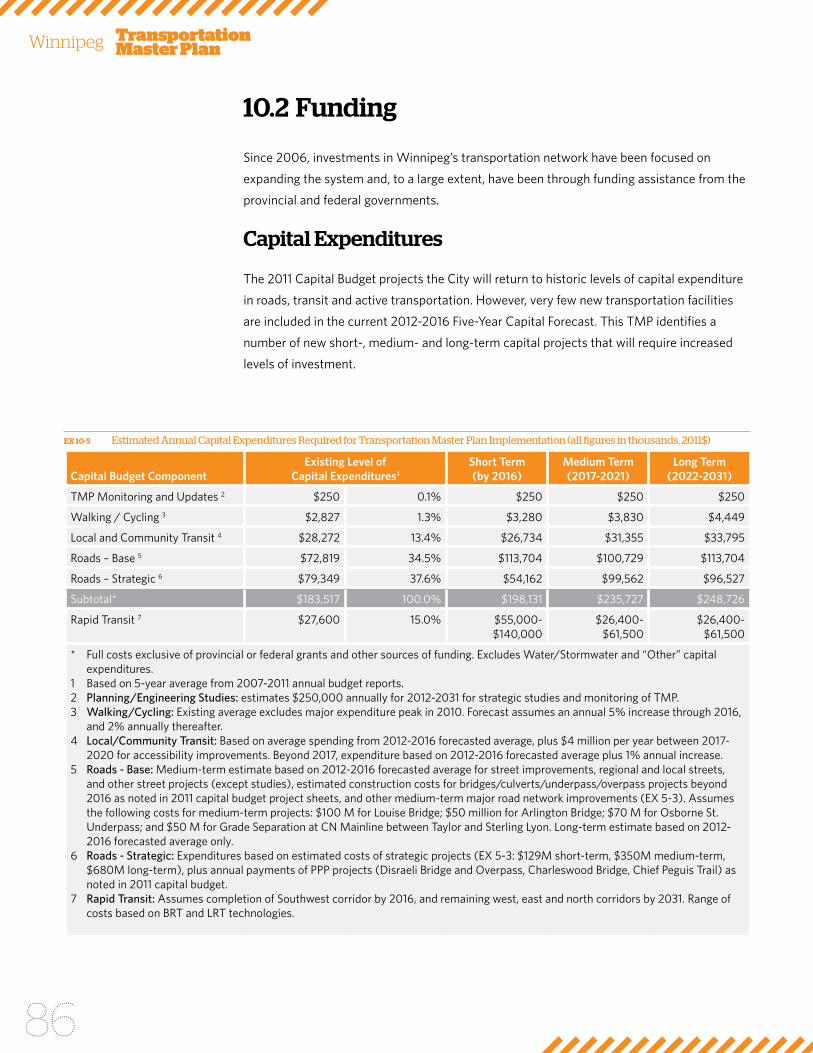
Transportation Master PlanWinnipeg
86
10.2 Funding
since 2006, investments in Winnipeg’s transportation network have been focused on
expanding the system and, to a large extent, have been through funding assistance from the
provincial and federal governments.
Capital Expenditures
The 2011 capital budget projects the city will return to historic levels of capital expenditure
in roads, transit and active transportation. However, very few new transportation facilities
are included in the current 2012-2016 five-year capital forecast. This TMP identifies a
number of new short-, medium- and long-term capital projects that will require increased
levels of investment.
EX 10-5 Estimated Annual Capital Expenditures Required for Transportation Master Plan Implementation (all figures in thousands, 2011$)
Capital Budget ComponentExisting Level of
Capital Expenditures1
Short Term (by 2016)
Medium Term (2017-2021)
Long Term (2022-2031)
TMP Monitoring and updates 2 $250 0.1% $250 $250 $250
Walking / cycling 3 $2,827 1.3% $3,280 $3,830 $4,449
Local and community Transit 4 $28,272 13.4% $26,734 $31,355 $33,795
roads – base 5 $72,819 34.5% $113,704 $100,729 $113,704
roads – strategic 6 $79,349 37.6% $54,162 $99,562 $96,527
subtotal* $183,517 100.0% $198,131 $235,727 $248,726
rapid Transit 7 $27,600 15.0% $55,000-$140,000
$26,400-$61,500
$26,400-$61,500
* full costs exclusive of provincial or federal grants and other sources of funding. Excludes Water/stormwater and “other” capital expenditures.
1 based on 5-year average from 2007-2011 annual budget reports.2 Planning/Engineering Studies: estimates $250,000 annually for 2012-2031 for strategic studies and monitoring of TMP.3 Walking/Cycling: Existing average excludes major expenditure peak in 2010. forecast assumes an annual 5% increase through 2016,
and 2% annually thereafter.4 Local/Community Transit: based on average spending from 2012-2016 forecasted average, plus $4 million per year between 2017-
2020 for accessibility improvements. beyond 2017, expenditure based on 2012-2016 forecasted average plus 1% annual increase.5 Roads - Base: Medium-term estimate based on 2012-2016 forecasted average for street improvements, regional and local streets,
and other street projects (except studies), estimated construction costs for bridges/culverts/underpass/overpass projects beyond 2016 as noted in 2011 capital budget project sheets, and other medium-term major road network improvements (EX 5-3). assumes the following costs for medium-term projects: $100 M for Louise bridge; $50 million for arlington bridge; $70 M for osborne st. underpass; and $50 M for grade separation at cn Mainline between Taylor and sterling Lyon. Long-term estimate based on 2012-2016 forecasted average only.
6 Roads - Strategic: Expenditures based on estimated costs of strategic projects (EX 5-3: $129M short-term, $350M medium-term, $680M long-term), plus annual payments of PPP projects (Disraeli bridge and overpass, charleswood bridge, chief Peguis Trail) as noted in 2011 capital budget.
7 Rapid Transit: assumes completion of southwest corridor by 2016, and remaining west, east and north corridors by 2031. range of costs based on brT and LrT technologies.
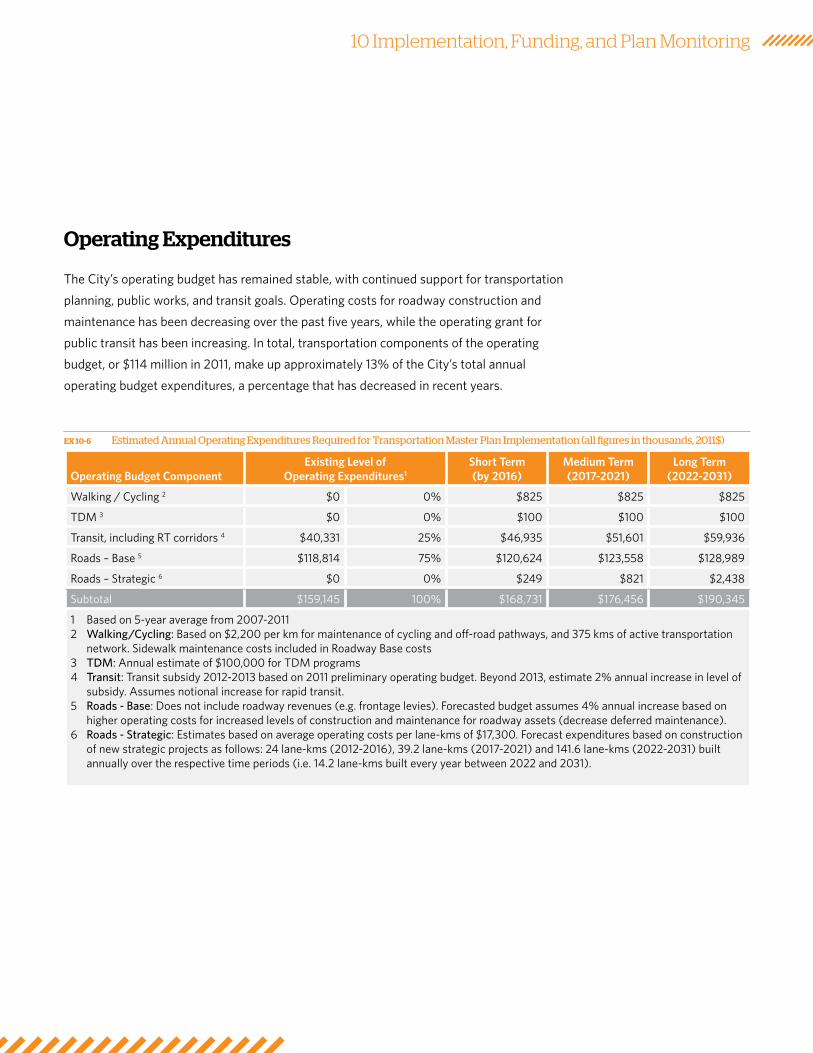
10 Implementation, Funding, and Plan Monitoring
Operating Expenditures
The city’s operating budget has remained stable, with continued support for transportation
planning, public works, and transit goals. operating costs for roadway construction and
maintenance has been decreasing over the past five years, while the operating grant for
public transit has been increasing. in total, transportation components of the operating
budget, or $114 million in 2011, make up approximately 13% of the city’s total annual
operating budget expenditures, a percentage that has decreased in recent years.
EX 10-6 Estimated Annual Operating Expenditures Required for Transportation Master Plan Implementation (all figures in thousands, 2011$)
Operating Budget ComponentExisting Level of
Operating Expenditures1
Short Term (by 2016)
Medium Term (2017-2021)
Long Term (2022-2031)
Walking / cycling 2 $0 0% $825 $825 $825
TDM 3 $0 0% $100 $100 $100
Transit, including rT corridors 4 $40,331 25% $46,935 $51,601 $59,936
roads – base 5 $118,814 75% $120,624 $123,558 $128,989
roads – strategic 6 $0 0% $249 $821 $2,438
subtotal $159,145 100% $168,731 $176,456 $190,345
1 based on 5-year average from 2007-20112 Walking/Cycling: based on $2,200 per km for maintenance of cycling and off-road pathways, and 375 kms of active transportation
network. sidewalk maintenance costs included in roadway base costs3 TDM: annual estimate of $100,000 for TDM programs4 Transit: Transit subsidy 2012-2013 based on 2011 preliminary operating budget. beyond 2013, estimate 2% annual increase in level of
subsidy. assumes notional increase for rapid transit.5 Roads - Base: Does not include roadway revenues (e.g. frontage levies). forecasted budget assumes 4% annual increase based on
higher operating costs for increased levels of construction and maintenance for roadway assets (decrease deferred maintenance). 6 Roads - Strategic: Estimates based on average operating costs per lane-kms of $17,300. forecast expenditures based on construction
of new strategic projects as follows: 24 lane-kms (2012-2016), 39.2 lane-kms (2017-2021) and 141.6 lane-kms (2022-2031) built annually over the respective time periods (i.e. 14.2 lane-kms built every year between 2022 and 2031).
Transportation Master PlanWinnipeg
88
KEy DIRECTION In order to adequately fund the future growth and maintenance
requirements of the multi-modal transportation network it will be
necessary to address the expected capital funding shortfalls.
DIRECTION ONE
Provide adequate funding for the growth and maintenance requirements of
the multi-modal transportation network.
ENAbLING STRATEGIES
a) address existing infrastructure needs and reverse the trend of deferred capital
infrastructure investments through best practices, preventative maintenance and the
asset Management Program discussed in section 9.
b) invest in strategic transportation infrastructure to support complete communities and
encourage sustainable modes of travel.
c) Work with federal and provincial partners to secure infrastructure investment for major
multi-modal transportation projects that support economic development.
d) Encourage the establishment of a federal and/or provincial transportation infrastructure
delivery strategy.
e) Work with province to outline a stable and predictable long term funding strategy for
implementing the rapid transit network.
f) Explore and assess the applicability and acceptability of new financing tools and
revenue sources to fund infrastructure projects within existing frameworks.
g) assess the applicability and acceptability of new approaches to financing such as those
recommended in the infrastructure funding council (ifc) report of 2011.
10 Implementation, Funding, and Plan Monitoring
10.3 Plan Review and Updates
The Winnipeg Transportation Master Plan is not intended to be a static document. it must
be regularly reviewed to ensure it meets the transportation needs of the city. changing
community expectations, growth patterns, and development pressures can necessitate a
re-investigation of the Plan, as would changes in the expected timing of major rapid transit
infrastructure. The on-going review process will involve:
• annual updates through Winnipeg’s five-year capital forecast and budgeting process.
• Preparation of an annual report to council on local transportation conditions,
behaviours, needs and trends with joint input from other departments. in addition to
the performance measurement indicators presented in EX 10-7, this annual report will
include:
» summaries of public feedback on transportation issues and projects implemented
» updates on public and private sector TDM initiatives (i.e. carpooling, preferential
parking, transit service delivery, flexible work hours, cycling facilities);
» status of provincial initiatives, policies and funding programs; and
» any need to review, amend or update components of the TMP.
The TMP requires regular updating to remain relevant and effective in dealing with the city’s
transportation needs. Therefore, it is further recommended that the Plan undergo a full
review every five years in association with future statutory reviews of ourWinnipeg.
Plan Monitoring
Performance measurement is necessary to gauge the effectiveness of the policies, programs
and infrastructure improvements in achieving the Plan’s strategic goals and enabling
strategies. The performance measurement program provides a framework for the city to
track changes in land use patterns, demographic characteristics, system performance and
mode choice over time. This information will allow the city to assess the success of actions
taken and provide guidance in further implementation of the TMP.
a proposed performance measurement framework is outlined in EX 10-7, structured
according to the five strategic goals of the TMP. This list represents a desirable set of
indicators for monitoring the implementation of the TMP and resulting transportation
performance. it is recognized that many of these indicators require additional data collection
and all may not be achievable given current data and staffing resources.
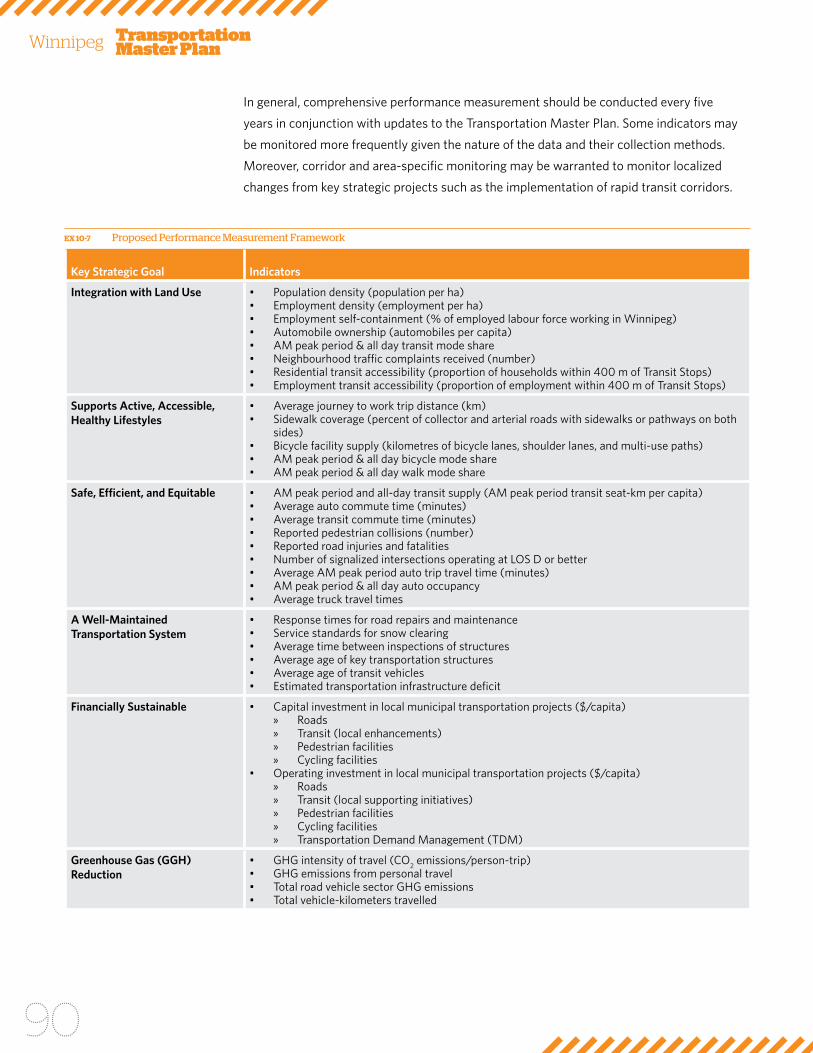
Transportation Master PlanWinnipeg
90
in general, comprehensive performance measurement should be conducted every five
years in conjunction with updates to the Transportation Master Plan. some indicators may
be monitored more frequently given the nature of the data and their collection methods.
Moreover, corridor and area-specific monitoring may be warranted to monitor localized
changes from key strategic projects such as the implementation of rapid transit corridors.
EX 10-7 Proposed Performance Measurement Framework
Key Strategic Goal Indicators
Integration with Land Use • Population density (population per ha)• Employment density (employment per ha)• Employment self-containment (% of employed labour force working in Winnipeg)• automobile ownership (automobiles per capita)• aM peak period & all day transit mode share• neighbourhood traffic complaints received (number)• residential transit accessibility (proportion of households within 400 m of Transit stops)• Employment transit accessibility (proportion of employment within 400 m of Transit stops)
Supports Active, Accessible, Healthy Lifestyles
• average journey to work trip distance (km)• sidewalk coverage (percent of collector and arterial roads with sidewalks or pathways on both
sides)• bicycle facility supply (kilometres of bicycle lanes, shoulder lanes, and multi-use paths)• aM peak period & all day bicycle mode share• aM peak period & all day walk mode share
Safe, Efficient, and Equitable • aM peak period and all-day transit supply (aM peak period transit seat-km per capita)• average auto commute time (minutes)• average transit commute time (minutes)• reported pedestrian collisions (number)• reported road injuries and fatalities• number of signalized intersections operating at Los D or better• average aM peak period auto trip travel time (minutes)• aM peak period & all day auto occupancy• average truck travel times
A Well-Maintained Transportation System
• response times for road repairs and maintenance• service standards for snow clearing• average time between inspections of structures• average age of key transportation structures• average age of transit vehicles• Estimated transportation infrastructure deficit
Financially Sustainable • capital investment in local municipal transportation projects ($/capita) » roads » Transit (local enhancements) » Pedestrian facilities » cycling facilities
• operating investment in local municipal transportation projects ($/capita) » roads » Transit (local supporting initiatives) » Pedestrian facilities » cycling facilities » Transportation Demand Management (TDM)
Greenhouse Gas (GGH) Reduction
• gHg intensity of travel (co2 emissions/person-trip)
• gHg emissions from personal travel• Total road vehicle sector gHg emissions• Total vehicle-kilometers travelled

MAPS

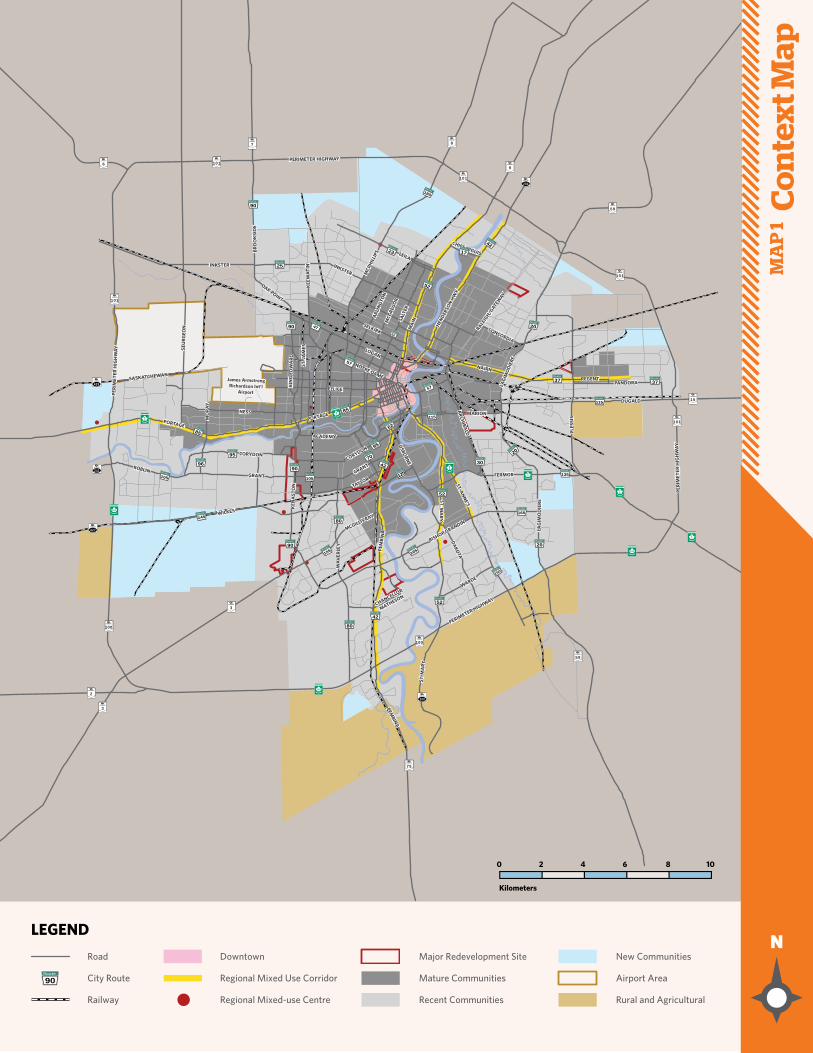
Kilometers
0 2 4 6 8 10
LEGEND
Road
City RouteRoute
90
Railway
Downtown
Regional Mixed Use Corridor
Regional Mixed-use Centre
Major Redevelopment Site
Mature Communities
Recent Communities
New Communities
Airport Area
Rural and Agricultural
MA
P 1
Co
nte
xt M
ap
PORTAGEPORTAGE
PORTAGEPORTAGE
SASKATCHEWANSASKATCHEWAN
CORYDON
CORYDON
KEN
AST
ON
KEN
AST
ON
BISHOP GRANDIN
BISHOP GRANDIN
WARDEWARDE
PERIMETER HIGHWAY
PERIMETER HIGHWAY
PER
IMET
ER H
IGH
WA
YPE
RIM
ETER
HIG
HW
AY
PLES
SIS
PLES
SIS
PER
IMET
ER H
IGH
WA
YPE
RIM
ETER
HIG
HW
AY
PERIMETER HIGHWAYPERIMETER HIGHWAY
MARIONMARION
FERMORFERMOR
CONCORDIA
CONCORDIA
NAIRNNAIRN
REGENTREGENT
RALEIG
H/GATEW
AY
RALEIG
H/GATEW
AY
HEN
DER
SON
HW
Y
HEN
DER
SON
HW
Y
LAG
IMO
DIE
RE
LAG
IMO
DIE
RE
TAYLORTAYLOR
GRANTGRANT
MCGILLIVRAY
MCGILLIVRAY
WA
VER
LEY
WA
VER
LEY
PEM
BIN
APE
MB
INA
PEMBIN
A
PEMBIN
A
WILKESWILKES
ACADEMYACADEMY
NESSNESS
James Armstrong Richardson Int’l
Airport
James Armstrong Richardson Int’l
AirportELLICEELLICE
LOGANLOGAN
NOTRE DAME
NOTRE DAME
OAK POINT
OAK POINT
KIN
G E
DW
AR
DK
ING
ED
WA
RD
INKSTERINKSTER
INKSTERINKSTER
SELKIRKSELKIRK
MCG
REG
OR
MCG
REG
OR
SALT
ERSA
LTER
ARL
ING
TON
ARL
ING
TON
MO
RA
YM
OR
AY
OSBO
RNE
OSBO
RNE
ARCH
IBALD
ARCH
IBALD
LAG
IMO
DIE
RE
LAG
IMO
DIE
REST. M
AR
YST. M
AR
Y
ST. M
AR
YST
. MA
RY
ST. AN
NE’S
ST. AN
NE’S
DA
KOTA
DA
KOTA
CHANCELLOR
MATHESONCHANCELLOR
MATHESON
GRANTGRANT
CORYDONCORYDON
ROBLINROBLIN
MA
INM
AIN
MCP
HIL
LIPS
MCP
HIL
LIPS
KEE
WA
TIN
KEE
WA
TIN
CHIEF PEGUIS
CHIEF PEGUISLEILALEILA
PANDORAPANDORA
DUGALDDUGALD
ST. J
AM
ESST
. JA
MES
BR
OO
KSI
DE
BR
OO
KSI
DE
STU
RG
EON
ST
UR
GEO
N
Route180
M AN I TO BA
MA N ITO BA
MAN I TO B A
MA NI T OBA
M AN ITO B A
MA N I T OB A
100
MAN IT OB A
100
MAN I TO BA
100
Route
20
Route
20
Route
20Route
90
Route
90
Route
90Route
165
Route
165
Route
80
Route
42
Route42
Route
80
Route
155
Route
150
Route
52
Route
135
Route
115
Route
37 Route
37
Route
115
Route42
Route52
Route23Route17
Route85
Route
85
Route
95
Route
95
Route
70
Route
145
Route
105
Route105
Route
62
Route
52
Route
25
Route
96
MA N ITO BA
Route
90Route
125
Route
30
Route
57
Route57
Route47Route62
101��������
15��������
101��������
59��������
101��������
9��������
8��������
101��������
7��������
6��������
101��������
2��������
3��������
100��������
3��������
100��������
75��������
59��������
427
241
425
204
200

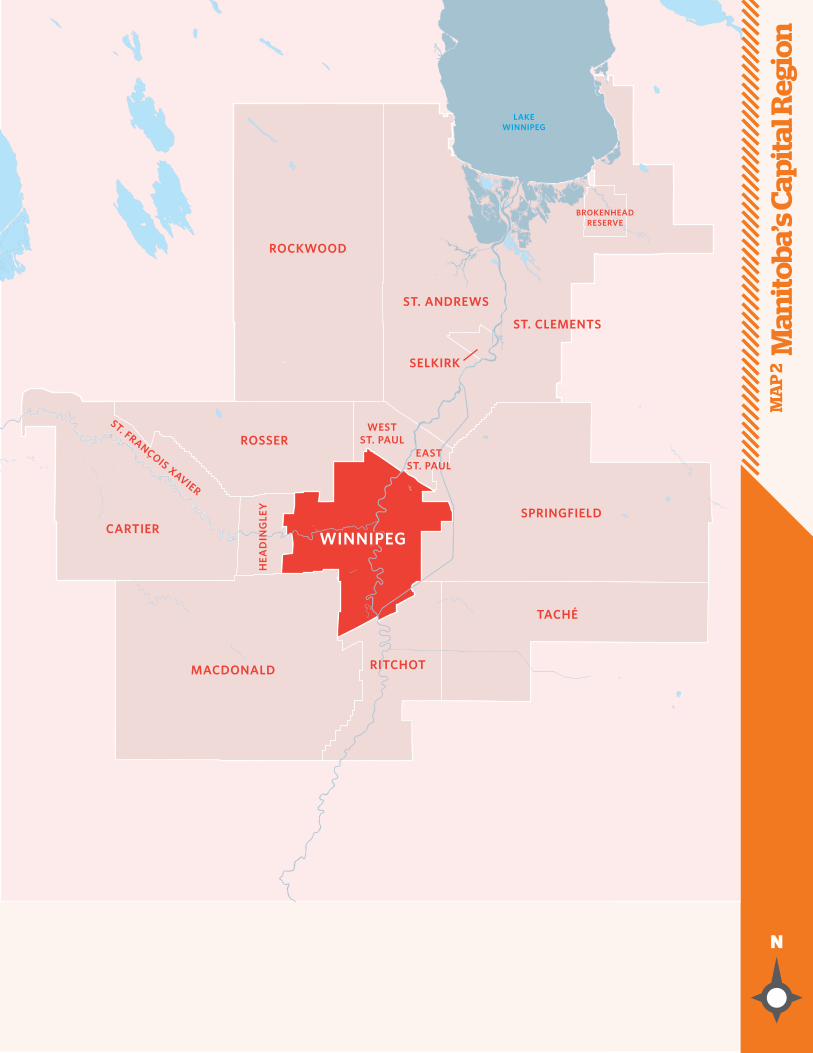
Kilometers
0 2 4 6 8 10
LEGEND
ROCKWOOD
ST. ANDREWS
ST. CLEMENTS
SELKIRK
WINNIPEGWINNIPEG
WESTST. PAUL
EASTST. PAUL
ROSSER
CARTIER
MACDONALD RITCHOT
TACHÉ
SPRINGFIELD
BROKENHEAD RESERVE
LAKE WINNIPEG
HEA
DIN
GLE
Y
ST. FRANÇOIS XAVIER
MA
P 2
Man
itob
a’s C
apit
al R
egio
n

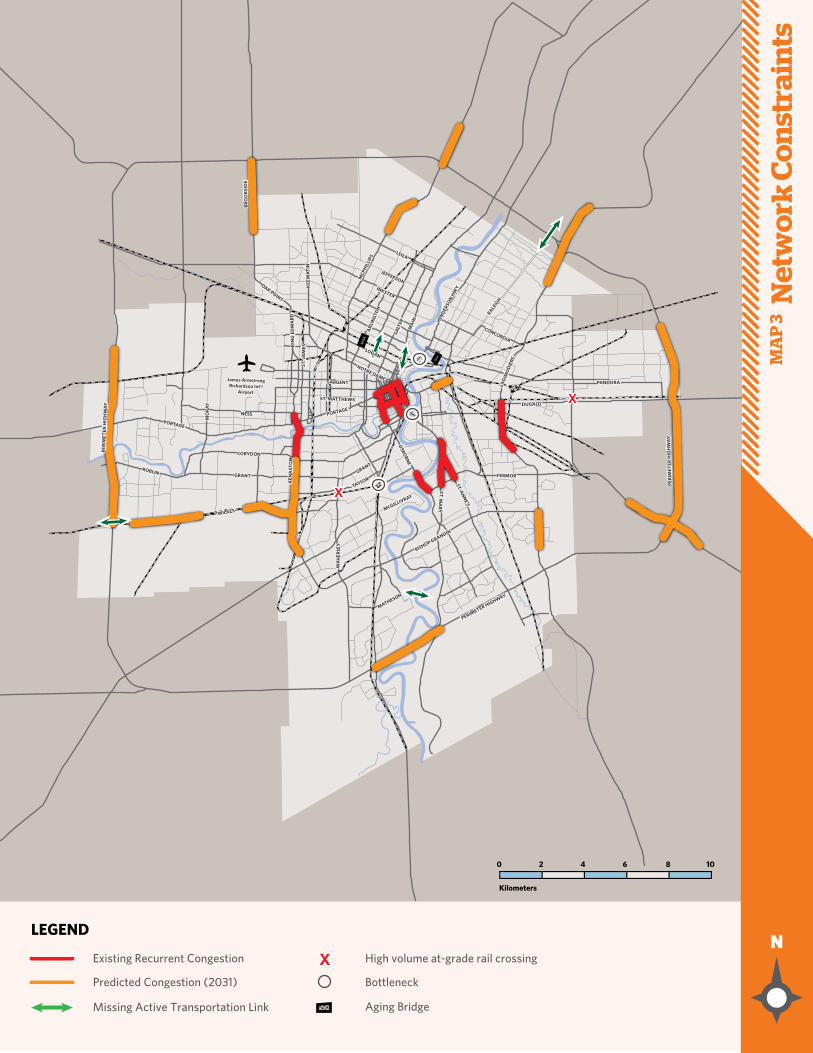
Kilometers
0 2 4 6 8 10
LEGEND
Existing Recurrent Congestion
Predicted Congestion (2031)
High volume at-grade rail crossing
Bottleneck
Aging BridgeMissing Active Transportation Link
PORTAGEPORTAGE
PORTAGEPORTAGE
GRANTGRANT
KEN
AST
ON
KEN
AST
ON
BISHOP GRANDIN
BISHOP GRANDIN
PERIMETER HIGHWAY
PERIMETER HIGHWAY
PER
IMET
ER H
IGH
WA
YPE
RIM
ETER
HIG
HW
AY
PER
IMET
ER H
IGH
WA
YPE
RIM
ETER
HIG
HW
AY
FERMORFERMOR
DUGALDDUGALD
CONCORDIA
CONCORDIA
RALEIG
H
RALEIG
H
HEN
DER
SON
HW
Y
HEN
DER
SON
HW
Y
LAG
IMO
DIE
RE
LAG
IMO
DIE
RE
TAYLORTAYLOR
MCGILLIVRAY
MCGILLIVRAY
WA
VER
LEY
WA
VER
LEY
WILKESWILKES
CORYDONCORYDON
NESSNESS
SARGENTSARGENT
LOGANLOGAN
OAK POINT
OAK POINTK
ING
ED
WA
RD
KIN
G E
DW
AR
DINKSTERINKSTER
JEFFERSON
JEFFERSON
SALT
ERSA
LTER
ARL
ING
TON
ARL
ING
TON
ST. MATTHEWSST. MATTHEWS
MO
RA
YM
OR
AY
OSBO
RNE
OSBO
RNE
ST. MA
RY
ST. MA
RY
ST. AN
NE’S
ST. AN
NE’S
MATHESON
MATHESON
GRANTGRANTROBLINROBLIN
MA
INM
AIN
NOTRE DAME
NOTRE DAME
MCP
HIL
LIPS
MCP
HIL
LIPS
KEE
WA
TIN
KEE
WA
TIN
LEILALEILA
PANDORAPANDORA
ST. J
AM
ESST
. JA
MES
BR
OO
KSI
DE
BR
OO
KSI
DE
James Armstrong Richardson Int’l
Airport
James Armstrong Richardson Int’l
Airport
MA
P 3
N
etw
ork
Co
nst
rain
ts

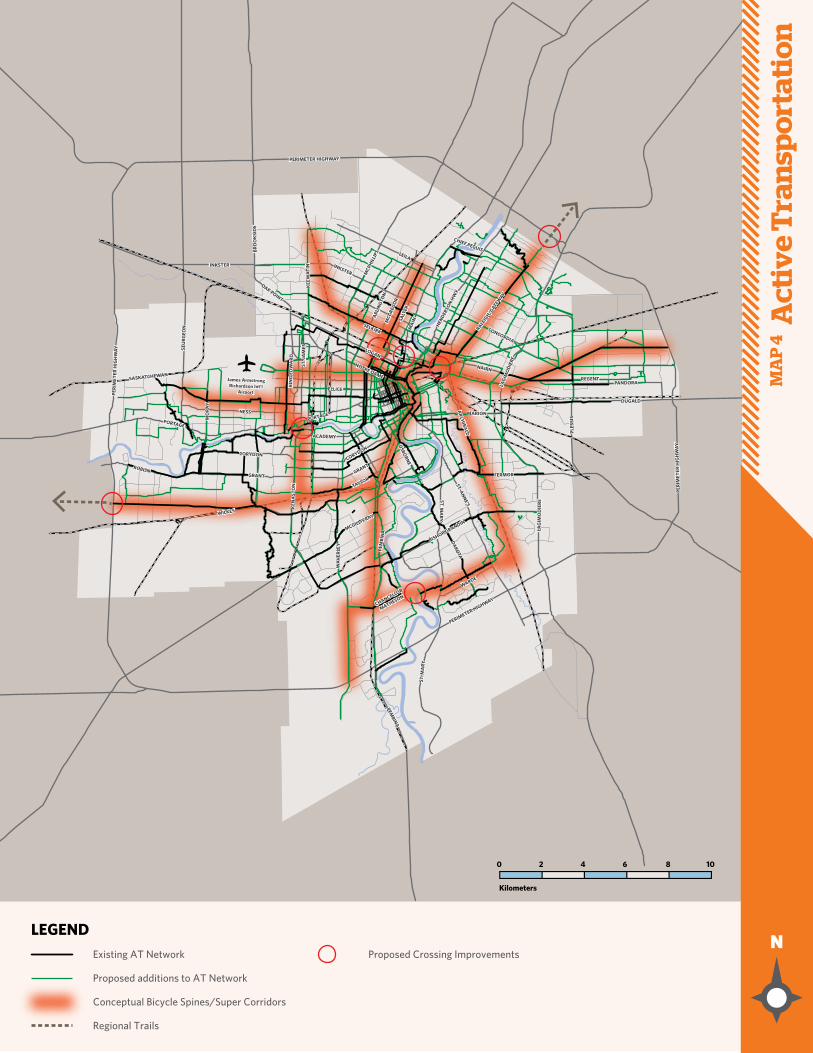
Kilometers
0 2 4 6 8 10
LEGEND
Existing AT Network
Regional Trails
Proposed additions to AT Network
Proposed Crossing Improvements
Conceptual Bicycle Spines/Super Corridors
James Armstrong Richardson Int’l
Airport
James Armstrong Richardson Int’l
Airport
MA
P 4
A
ctiv
e T
ran
spo
rtat
ion
PORTAGEPORTAGE
PORTAGEPORTAGE
SASKATCHEWANSASKATCHEWAN
CORYDON
CORYDON
KEN
AST
ON
KEN
AST
ON
BISHOP GRANDIN
BISHOP GRANDIN
WARDEWARDE
PERIMETER HIGHWAY
PERIMETER HIGHWAY
PER
IMET
ER H
IGH
WA
YPE
RIM
ETER
HIG
HW
AY
PLES
SIS
PLES
SIS
PER
IMET
ER H
IGH
WA
YPE
RIM
ETER
HIG
HW
AY
PERIMETER HIGHWAYPERIMETER HIGHWAY
MARIONMARION
FERMORFERMOR
CONCORDIA
CONCORDIA
NAIRNNAIRN
REGENTREGENT
RALEIG
H/GATEW
AY
RALEIG
H/GATEW
AY
HEN
DER
SON
HW
Y
HEN
DER
SON
HW
Y
LAG
IMO
DIE
RE
LAG
IMO
DIE
RE
TAYLORTAYLOR
GRANTGRANT
MCGILLIVRAY
MCGILLIVRAY
WA
VER
LEY
WA
VER
LEY
PEM
BIN
APE
MB
INA
PEMBIN
A
PEMBIN
A
WILKESWILKES
ACADEMYACADEMY
NESSNESS
James Armstrong Richardson Int’l
Airport
James Armstrong Richardson Int’l
AirportELLICEELLICE
LOGANLOGAN
NOTRE DAME
NOTRE DAME
OAK POINT
OAK POINT
KIN
G E
DW
AR
DK
ING
ED
WA
RD
INKSTERINKSTER
INKSTERINKSTER
SELKIRKSELKIRK
MCG
REG
OR
MCG
REG
OR
SALT
ERSA
LTER
ARL
ING
TON
ARL
ING
TON
MO
RA
YM
OR
AY
OSBO
RNE
OSBO
RNE
ARCH
IBALD
ARCH
IBALD
LAG
IMO
DIE
RE
LAG
IMO
DIE
REST. M
AR
YST. M
AR
Y
ST. M
AR
YST
. MA
RY
ST. AN
NE’S
ST. AN
NE’S
DA
KOTA
DA
KOTA
CHANCELLOR
MATHESONCHANCELLOR
MATHESON
GRANTGRANT
CORYDONCORYDON
ROBLINROBLIN
MA
INM
AIN
MCP
HIL
LIPS
MCP
HIL
LIPS
KEE
WA
TIN
KEE
WA
TIN
CHIEF PEGUIS
CHIEF PEGUISLEILALEILA
PANDORAPANDORA
DUGALDDUGALD
ST. J
AM
ESST
. JA
MES
BR
OO
KSI
DE
BR
OO
KSI
DE
STU
RG
EON
ST
UR
GEO
N

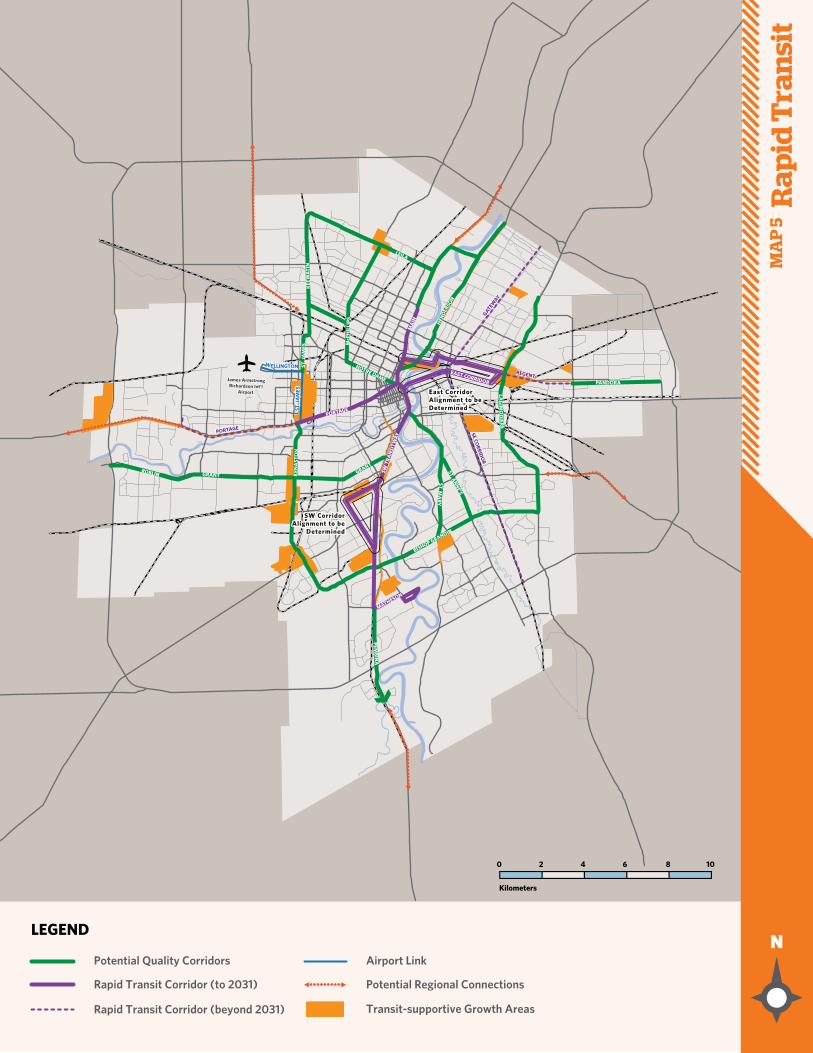
Kilometers
0 2 4 6 8 10
LEGEND
PORTAGE
GRANT
KEN
AST
ON
BISHOP GRANDIN
ST. MA
RY
ST. AN
NE’S
MATHESON
GRANTROBLIN SW
TR
AN
SITW
AY
MA
IN
EAST CORRIDOR
NOTRE DAME
McP
HIL
LIPS
KEE
WA
TIN
HEN
DER
SON
LEILA
PANDORA
LAG
IMO
DIE R
E
GATEWAY
GATEWAY
ST. J
AM
ESST
. JA
MES
WELLINGTONWELLINGTON
PEMB
INA
ST. J
AM
ES
PORTAGEPORTAGE
REGENTREGENT
SE CORRID
OR
SE CORRID
OR
SW Corridor Alignment to be
Determined
SW Corridor Alignment to be
Determined
East Corridor Alignment to be Determined
East Corridor Alignment to be Determined
Potential Quality Corridors
Rapid Transit Corridor (to 2031)
Airport Link
Potential Regional Connections
Transit-supportive Growth AreasRapid Transit Corridor (beyond 2031)
James Armstrong Richardson Int’l
Airport
James Armstrong Richardson Int’l
Airport
MA
P 5
R
apid
Tra
nsi
t

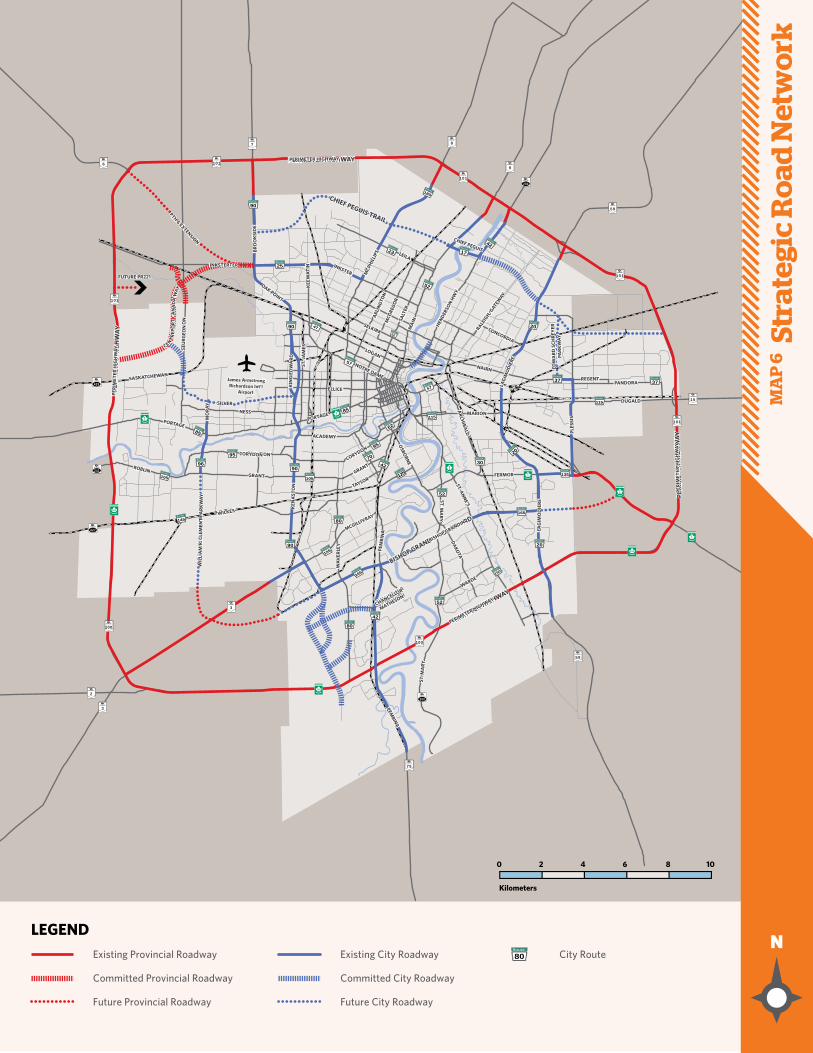
Kilometers
0 2 4 6 8 10
LEGEND
FUTURE PR221FUTURE PR221
Future Provincial Roadway
Existing Provincial Roadway
Committed Provincial Roadway
Future City Roadway
Existing City Roadway
Committed City Roadway
City RouteRoute
80
PORTAGEPORTAGE
PORTAGEPORTAGE
SASKATCHEWANSASKATCHEWAN
CORYDON
CORYDON
KEN
AST
ON
KEN
AST
ON
BISHOP GRANDIN BOULEVARD
BISHOP GRANDIN BOULEVARD
WARDEWARDE
PERIMETER HIGHWAY
PERIMETER HIGHWAY
PER
IMET
ER H
IGH
WA
YPE
RIM
ETER
HIG
HW
AYPL
ESSI
SPL
ESSI
S
EDW
AR
D S
CH
REY
ER
PAR
KW
AY
EDW
AR
D S
CH
REY
ER
PAR
KW
AY
PER
IMET
ER H
IGH
WA
YPE
RIM
ETER
HIG
HW
AY
PERIMETER HIGHWAYPERIMETER HIGHWAY
MARIONMARION
FERMORFERMOR
CONCORDIA
CONCORDIA
NAIRNNAIRN
REGENTREGENT
RALEIG
H/GATEW
AY
RALEIG
H/GATEW
AY
HEN
DER
SON
HW
Y
HEN
DER
SON
HW
Y
LAG
IMO
DIE
RE
LAG
IMO
DIE
RE
TAYLORTAYLOR
GRANTGRANT
MCGILLIVRAY
MCGILLIVRAY
WA
VER
LEY
WA
VER
LEY
PEM
BIN
APE
MB
INA
PEMBIN
A
PEMBIN
A
WILKESWILKES
ACADEMYACADEMY
NESSNESS
SILVERSILVER
James Armstrong Richardson Int’l
Airport
James Armstrong Richardson Int’l
AirportELLICEELLICE
LOGANLOGAN
NOTRE DAME
NOTRE DAME
OAK POINT
OAK POINT
PTH 6 EXTENSION
PTH 6 EXTENSION
CENT
REP
OR
T C
AN
AD
A W
AY
KIN
G E
DW
AR
DK
ING
ED
WA
RD
INKSTERINKSTER
INKSTERINKSTER
SELKIRKSELKIRK
MCG
REG
OR
MCG
REG
OR
SALT
ERSA
LTER
ARL
ING
TON
ARL
ING
TON
MO
RA
YM
OR
AY
WIL
LIA
M R
. CLE
MEN
T P
AR
KW
AY
WIL
LIA
M R
. CLE
MEN
T P
AR
KW
AY
OSBO
RNE
OSBO
RNE
ARCH
IBALD
ARCH
IBALD
LAG
IMO
DIE
RE
LAG
IMO
DIE
REST. M
AR
YST. M
AR
Y
ST. M
AR
YST
. MA
RY
ST. AN
NE’S
ST. AN
NE’S
DA
KOTA
DA
KOTA
CHANCELLOR
MATHESONCHANCELLOR
MATHESON
GRANTGRANT
CORYDONCORYDON
ROBLINROBLIN
MA
INM
AIN
MCP
HIL
LIPS
MCP
HIL
LIPS
KEE
WA
TIN
KEE
WA
TIN
CHIEF PEGUIS TRAIL
CHIEF PEGUIS TRAIL
LEILALEILA
PANDORAPANDORA
DUGALDDUGALD
ST. J
AM
ESST
. JA
MES
BR
OO
KSI
DE
BR
OO
KSI
DE
STU
RG
EON
ST
UR
GEO
N
MA
P 6
St
rate
gic
Ro
ad N
etw
ork
PORTAGEPORTAGE
PORTAGEPORTAGE
SASKATCHEWANSASKATCHEWAN
CORYDON
CORYDON
KEN
AST
ON
KEN
AST
ON
BISHOP GRANDIN
BISHOP GRANDIN
WARDEWARDE
PERIMETER HIGHWAY
PERIMETER HIGHWAY
PER
IMET
ER H
IGH
WA
YPE
RIM
ETER
HIG
HW
AY
PLES
SIS
PLES
SIS
PER
IMET
ER H
IGH
WA
YPE
RIM
ETER
HIG
HW
AY
PERIMETER HIGHWAYPERIMETER HIGHWAY
MARIONMARION
FERMORFERMOR
CONCORDIA
CONCORDIA
NAIRNNAIRN
REGENTREGENT
RALEIG
H/GATEW
AY
RALEIG
H/GATEW
AY
HEN
DER
SON
HW
Y
HEN
DER
SON
HW
Y
LAG
IMO
DIE
RE
LAG
IMO
DIE
RE
TAYLORTAYLOR
GRANTGRANT
MCGILLIVRAY
MCGILLIVRAY
WA
VER
LEY
WA
VER
LEY
PEM
BIN
APE
MB
INA
PEMBIN
A
PEMBIN
A
WILKESWILKES
ACADEMYACADEMY
NESSNESS
James Armstrong Richardson Int’l
Airport
James Armstrong Richardson Int’l
AirportELLICEELLICE
LOGANLOGAN
NOTRE DAME
NOTRE DAME
OAK POINT
OAK POINT
KIN
G E
DW
AR
DK
ING
ED
WA
RD
INKSTERINKSTER
INKSTERINKSTER
SELKIRKSELKIRK
MCG
REG
OR
MCG
REG
OR
SALT
ERSA
LTER
ARL
ING
TON
ARL
ING
TON
MO
RA
YM
OR
AY
OSBO
RNE
OSBO
RNE
ARCH
IBALD
ARCH
IBALD
LAG
IMO
DIE
RE
LAG
IMO
DIE
REST. M
AR
YST. M
AR
Y
ST. M
AR
YST
. MA
RY
ST. AN
NE’S
ST. AN
NE’S
DA
KOTA
DA
KOTA
CHANCELLOR
MATHESONCHANCELLOR
MATHESON
GRANTGRANT
CORYDONCORYDON
ROBLINROBLIN
MA
INM
AIN
MCP
HIL
LIPS
MCP
HIL
LIPS
KEE
WA
TIN
KEE
WA
TIN
CHIEF PEGUIS
CHIEF PEGUISLEILALEILA
PANDORAPANDORA
DUGALDDUGALD
ST. J
AM
ESST
. JA
MES
BR
OO
KSI
DE
BR
OO
KSI
DE
STU
RG
EON
ST
UR
GEO
N
Route180
M AN I TO BA
MA N ITO BA
MAN I TO B A
MA NI T OBA
M AN ITO B A
MA N I T OB A
100
MAN IT OB A
100
MAN I TO BA
100
Route
20
Route
20
Route
20Route
90
Route
90
Route
90
Route
165
Route
165
Route
80
Route
42
Route42
Route
80
Route
155
Route
150
Route
52
Route
135
Route
115
Route
37 Route
37
Route
115
Route42
Route52
Route23Route17
Route85
Route
85
Route
95
Route
95
Route
70
Route
145
Route
105
Route105
Route
62
Route
52
Route
25
Route
96
MA N ITO BA
Route
90Route
125
Route
30
Route
57
Route57
Route47Route62
101��������
15��������
101��������
59��������
101��������
9��������
8��������
101��������
7��������
6��������
101��������
2��������
3��������
100��������
3��������
100��������
75��������
59��������
427
241
425
204
200

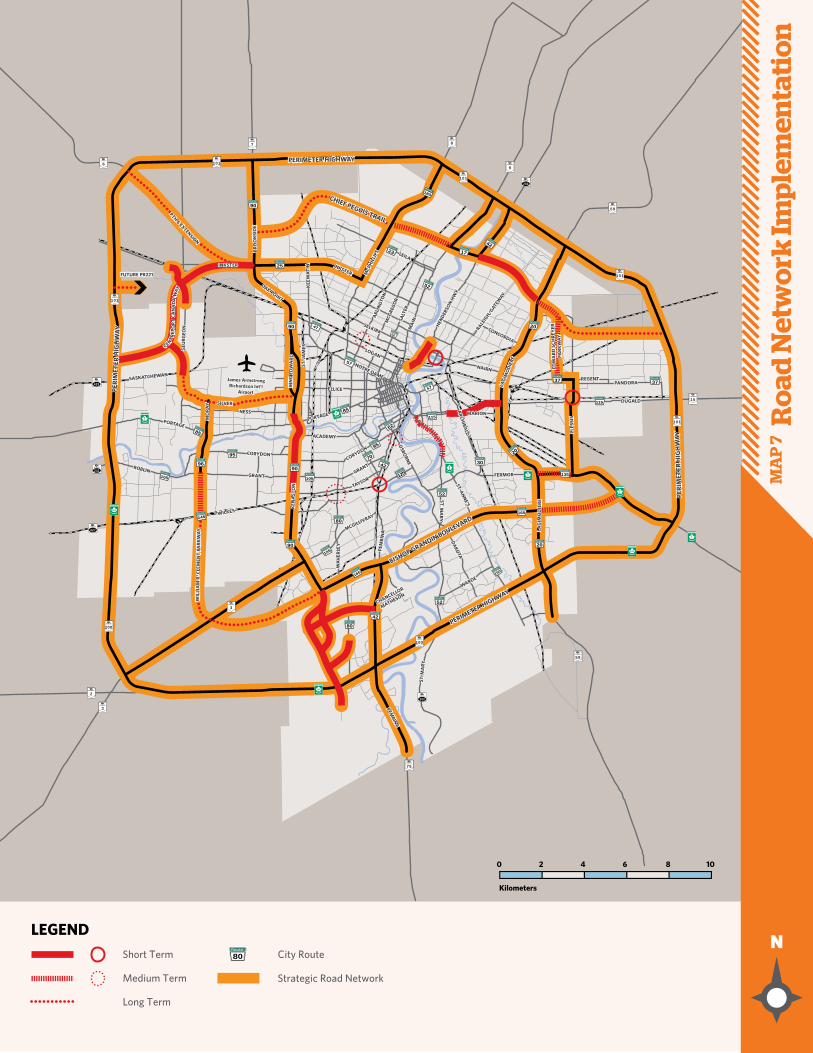
Kilometers
0 2 4 6 8 10
LEGEND
Long Term
Short Term
Medium Term
City Route
Strategic Road Network
Route
80
MA
P 7
R
oad
Net
wo
rk Im
ple
men
tati
on
PORTAGEPORTAGE
PORTAGEPORTAGE
SASKATCHEWANSASKATCHEWAN
CORYDON
CORYDON
KEN
AST
ON
KEN
AST
ON
BISHOP GRANDIN BOULEVARD
BISHOP GRANDIN BOULEVARD
WARDEWARDE
PERIMETER HIGHWAY
PERIMETER HIGHWAY
PER
IMET
ER H
IGH
WA
YPE
RIM
ETER
HIG
HW
AYPL
ESSI
SPL
ESSI
S
EDW
AR
D S
CH
REY
ER
PAR
KW
AY
EDW
AR
D S
CH
REY
ER
PAR
KW
AY
PER
IMET
ER H
IGH
WA
YPE
RIM
ETER
HIG
HW
AY
PERIMETER HIGHWAYPERIMETER HIGHWAY
MARIONMARION
FERMORFERMOR
CONCORDIA
CONCORDIA
NAIRNNAIRN
REGENTREGENT
RALEIG
H/GATEW
AY
RALEIG
H/GATEW
AY
HEN
DER
SON
HW
Y
HEN
DER
SON
HW
Y
LAG
IMO
DIE
RE
LAG
IMO
DIE
RE
TAYLORTAYLOR
GRANTGRANT
MCGILLIVRAY
MCGILLIVRAY
WA
VER
LEY
WA
VER
LEY
PEM
BIN
APE
MB
INA
PEMBIN
A
PEMBIN
A
WILKESWILKES
ACADEMYACADEMY
NESSNESS
SILVERSILVER
James Armstrong Richardson Int’l
Airport
James Armstrong Richardson Int’l
AirportELLICEELLICE
LOGANLOGAN
NOTRE DAME
NOTRE DAME
OAK POINT
OAK POINT
PTH 6 EXTENSION
PTH 6 EXTENSION
CENT
REP
OR
T C
AN
AD
A W
AY
KIN
G E
DW
AR
DK
ING
ED
WA
RD
INKSTERINKSTER
INKSTERINKSTER
FUTURE PR221FUTURE PR221
SELKIRKSELKIRK
MCG
REG
OR
MCG
REG
OR
SALT
ERSA
LTER
ARL
ING
TON
ARL
ING
TON
MO
RA
YM
OR
AY
WIL
LIA
M R
. CLE
MEN
T P
AR
KW
AY
WIL
LIA
M R
. CLE
MEN
T P
AR
KW
AY
OSBO
RNE
OSBO
RNE
ARCH
IBALD
ARCH
IBALD
LAG
IMO
DIE
RE
LAG
IMO
DIE
REST. M
AR
YST. M
AR
Y
ST. M
AR
YST
. MA
RY
ST. AN
NE’S
ST. AN
NE’S
DA
KOTA
DA
KOTA
CHANCELLOR
MATHESONCHANCELLOR
MATHESON
GRANTGRANT
CORYDONCORYDON
ROBLINROBLIN
MA
INM
AIN
MCP
HIL
LIPS
MCP
HIL
LIPS
KEE
WA
TIN
KEE
WA
TIN
CHIEF PEGUIS TRAIL
CHIEF PEGUIS TRAIL
LEILALEILA
PANDORAPANDORA
DUGALDDUGALD
ST. J
AM
ESST
. JA
MES
BR
OO
KSI
DE
BR
OO
KSI
DE
STU
RG
EON
ST
UR
GEO
N
Route180
M AN I TO BA
MA N ITO BA
MAN I TO B A
MA NI T OBA
M AN ITO B A
MA N I T OB A
100
MAN IT OB A
100
MAN I TO BA
100
Route
20
Route
20
Route
20Route
90
Route
90
Route
90
Route
165
Route
165
Route
80
Route
42
Route42
Route
80
Route
155
Route
150
Route
52
Route
135
Route
115
Route
37 Route
37
Route
115
Route42
Route52
Route23Route17
Route85
Route
85
Route
95
Route
95
Route
70
Route
145
Route
105
Route105
Route
62
Route
52
Route
25
Route
96
MA N ITO BA
Route
90Route
125
Route
30
Route
57
Route57
Route47Route62
101��������
15��������
101��������
59��������
101��������
9��������
8��������
101��������
7��������
6��������
101��������
2��������
3��������
100��������
3��������
100��������
75��������
59��������
427
241
425
204
200

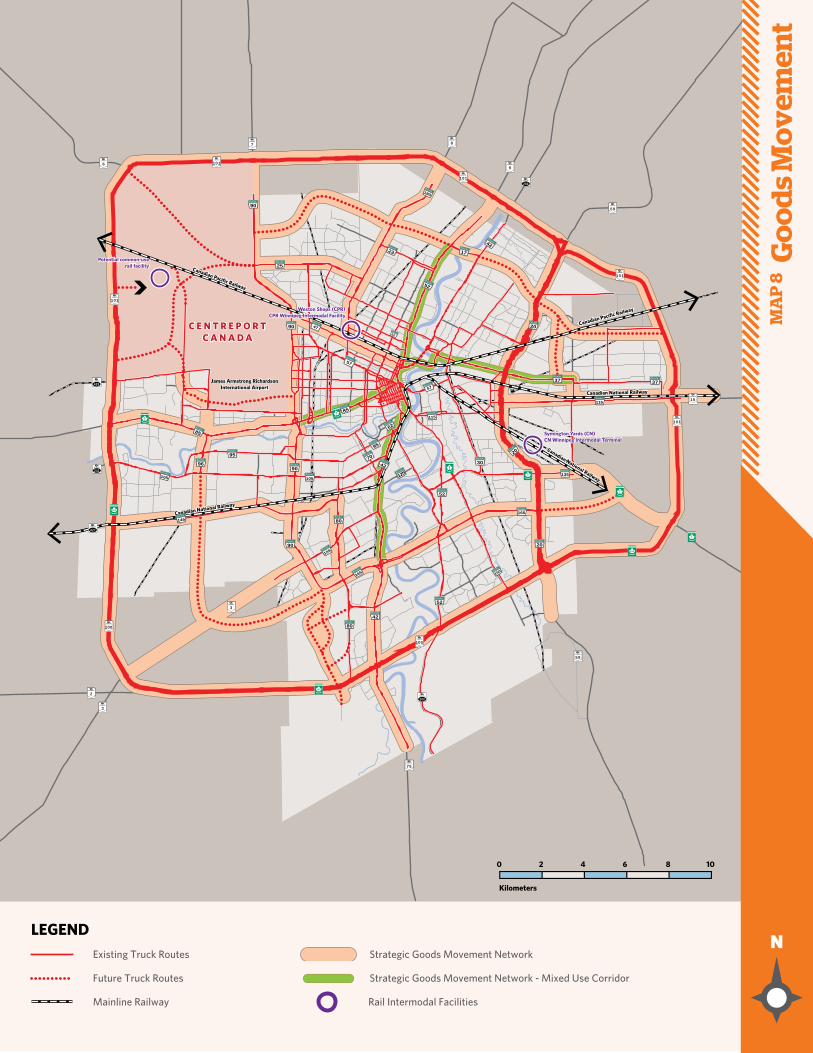
Kilometers
0 2 4 6 8 10
LEGEND
Symington Yards (CN)CN Winnipeg Intermodal TerminalSymington Yards (CN)CN Winnipeg Intermodal Terminal
Weston Shops (CPR)CPR Winnipeg Intermodal Facility
Weston Shops (CPR)CPR Winnipeg Intermodal Facility
James Armstrong RichardsonInternational Airport
James Armstrong RichardsonInternational Airport
Potential common-use rail facility
Potential common-use rail facility Canadian Pacific Railway
Canadian Pacific Railway
Canadian Pacific Railway
Canadian Pacific Railway
Canadian National RailwayCanadian National Railway
Canadian National Railway
Canadian National Railway
Canadian National Railway
Canadian National Railway
Existing Truck Routes
Future Truck Routes
Strategic Goods Movement Network
Strategic Goods Movement Network - Mixed Use Corridor
Rail Intermodal FacilitiesMainline Railway
MA
P 8
G
oo
ds
Mo
vem
ent
Route180
M AN I TO BA
MA N ITO BA
MAN I TO B A
MA NI T OBA
M AN ITO B A
MA N I T OB A
100
MAN IT OB A
100
MAN I TO BA
100
Route
20
Route
20
Route
20Route
90
Route
90
Route
90
Route
165
Route
165
Route
80
Route
42
Route42
Route
80
Route
155
Route
150
Route
52
Route
135
Route
115
Route
37 Route
37
Route
115
Route42
Route52
Route23Route17
Route85
Route
85
Route
95
Route
95
Route
70
Route
145
Route
105
Route105
Route
62
Route
52
Route
25
Route
96
MA N ITO BA
Route
90Route
125
Route
30
Route
57
Route57
Route47Route62
101��������
15��������
101��������
59��������
101��������
9��������
8��������
101��������
7��������
6��������
101��������
2��������
3��������
100��������
3��������
100��������
75��������
59��������
427
241
425
204
200