Winds and Global Circulation - MSU Billings 2010/Suits/Gphy... · Winds and Global Circulation ......
85
Winds and Global Circulation • Atmospheric Pressure • Winds • Global Wind and Pressure Patterns • Oceans and Ocean Currents • El Niňo
Transcript of Winds and Global Circulation - MSU Billings 2010/Suits/Gphy... · Winds and Global Circulation ......

Winds and Global Circulation
• Atmospheric Pressure
• Winds
• Global Wind and Pressure Patterns
• Oceans and Ocean Currents
• El Niňo

Precipitation in Montana
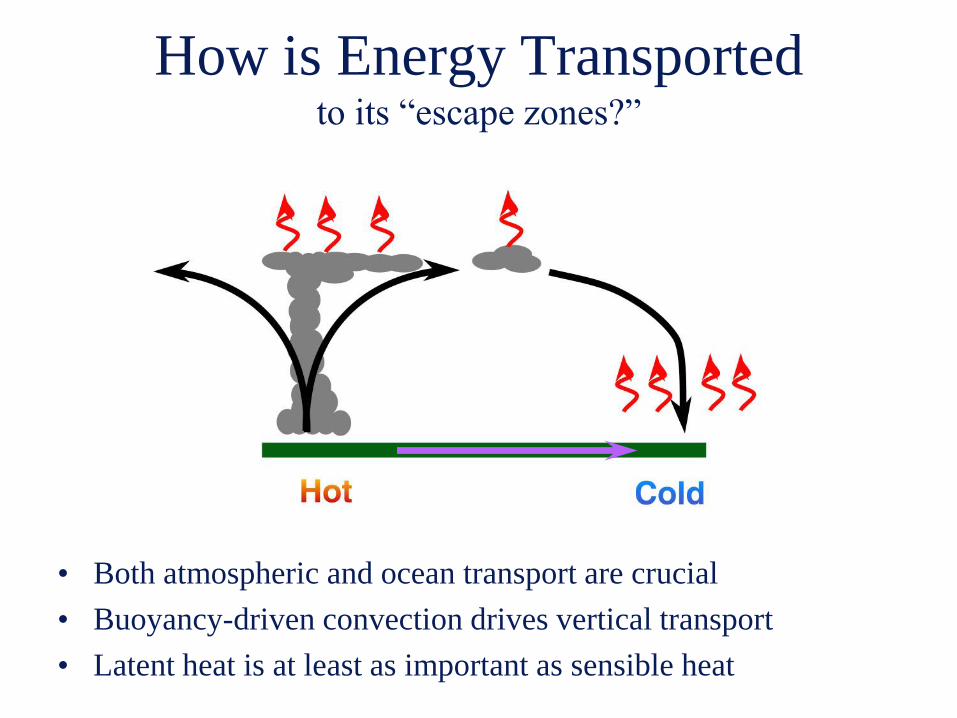
How is Energy Transportedto its “escape zones?”
• Both atmospheric and ocean transport are crucial
• Buoyancy-driven convection drives vertical transport
• Latent heat is at least as important as sensible heat

Atmospheric Circulationin a nutshell
• Hot air rises (rains a lot) in the tropics
• Air cools and sinks in the subtropics
(deserts)
• Poleward-flow is deflected by the Coriolis
force into westerly jet streams in the
temperate zone
• Jet streams are unstable to small
perturbations, leading to huge eddies
(storms and fronts) that finish the job

Atmospheric Circulationin a nutshell
• Winds are initially generated by differences
in heating at the Earth’s surface
• Geostrophic winds result in rotational
movement around high and low pressure
centers.
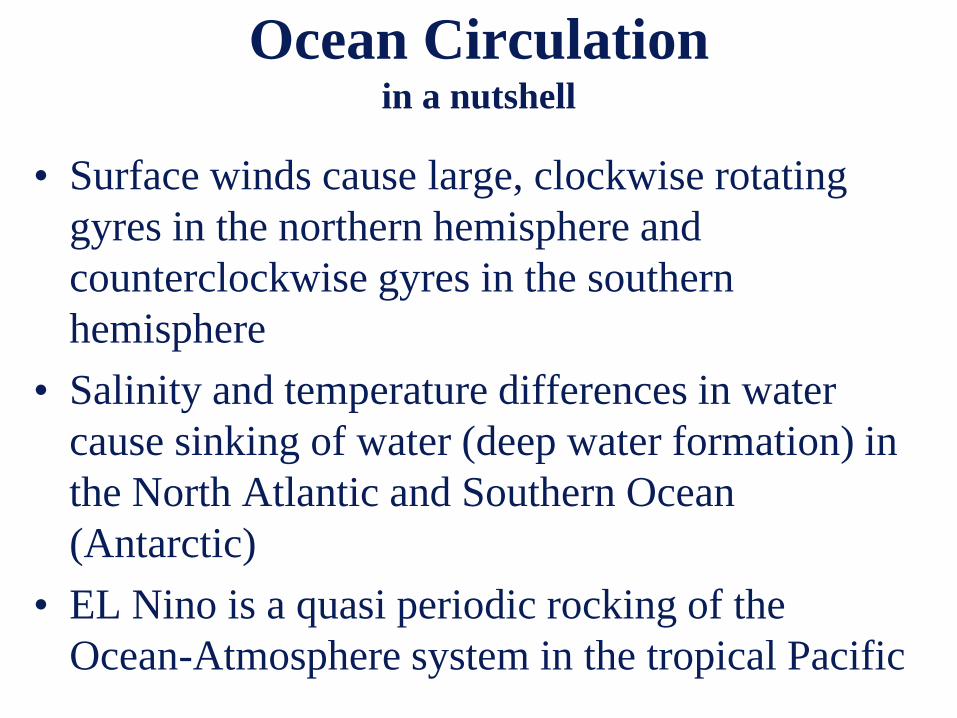
Ocean Circulationin a nutshell
• Surface winds cause large, clockwise rotating
gyres in the northern hemisphere and
counterclockwise gyres in the southern
hemisphere
• Salinity and temperature differences in water
cause sinking of water (deep water formation) in
the North Atlantic and Southern Ocean
(Antarctic)
• EL Nino is a quasi periodic rocking of the
Ocean-Atmosphere system in the tropical Pacific

Atmospheric Pressure
As the atmosphere is held down by gravity, it exerts a force upon every surface (pressure = force per unit area)
At sea level the force is the weight of 1 kg of air that lies above each square centimeter of the surface
(around 15 lbs per in2)
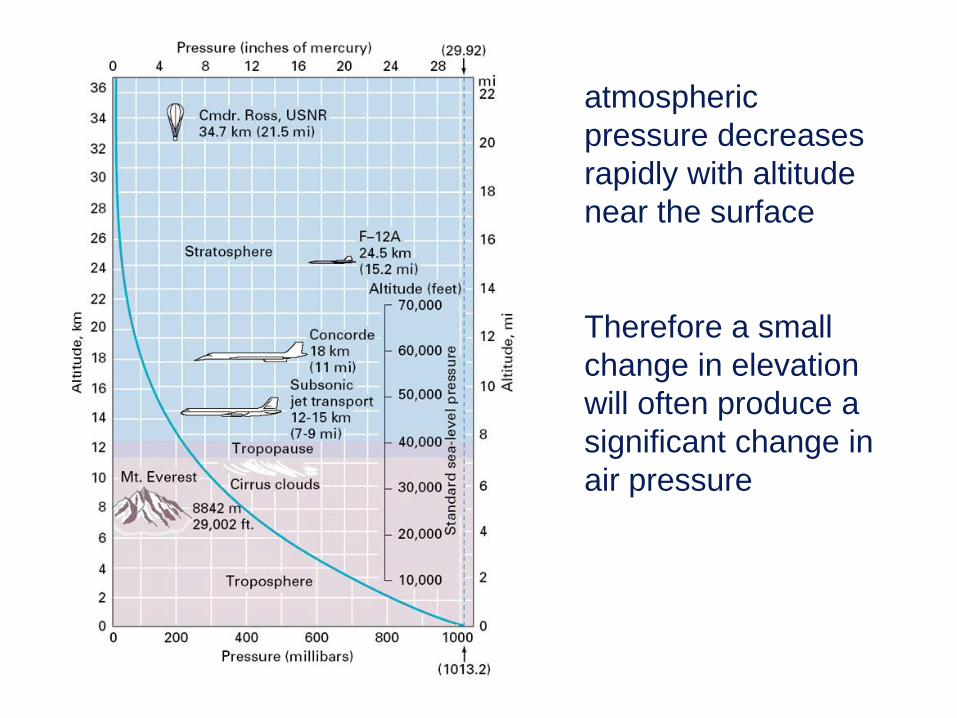
atmospheric
pressure decreases
rapidly with altitude
near the surface
Therefore a small
change in elevation
will often produce a
significant change in
air pressure

How winds are made

Two columns of air–
same temperature
same distribution of mass
1000 mb 1000 mb
500 mb level

Cool the left column;
warm the right column
1000 mb
500 mb
500 mb
1000 mb
The heated column
expandsThe cooled
column
contracts
original 500 mb level

The level of the 500 mb surface changes;
the surface pressure remains unchanged
1000 mb
new 500 mblevel in warmair
new 500 mblevel in coldair
1000 mb
The 500 mb surface isdisplaced upward in thewarmer column
The level corresponding to500 mb is displaced
downward in the cooler column
original 500 mb level
The surface pressure remains the same since both columns still contain the same mass of air.

1000 mb
new 500 mblevel in warm air
new 500 mblevel in cold air
1000 mb
The 500 mb surface isdisplaced upward in thewarmer column
The 500 mb surface isdisplaced downward inthe cooler column
original 500 mb level
The surface pressure remains the same since both columns still contain the same mass of air.
A pressure difference in the horizontal direction develops above the surface
HighLow

1003 mb 997 mb
original 500 mb level
Air moves from high to low pressure in the middle of the column,
causing the surface pressure to change.
HighLow wind
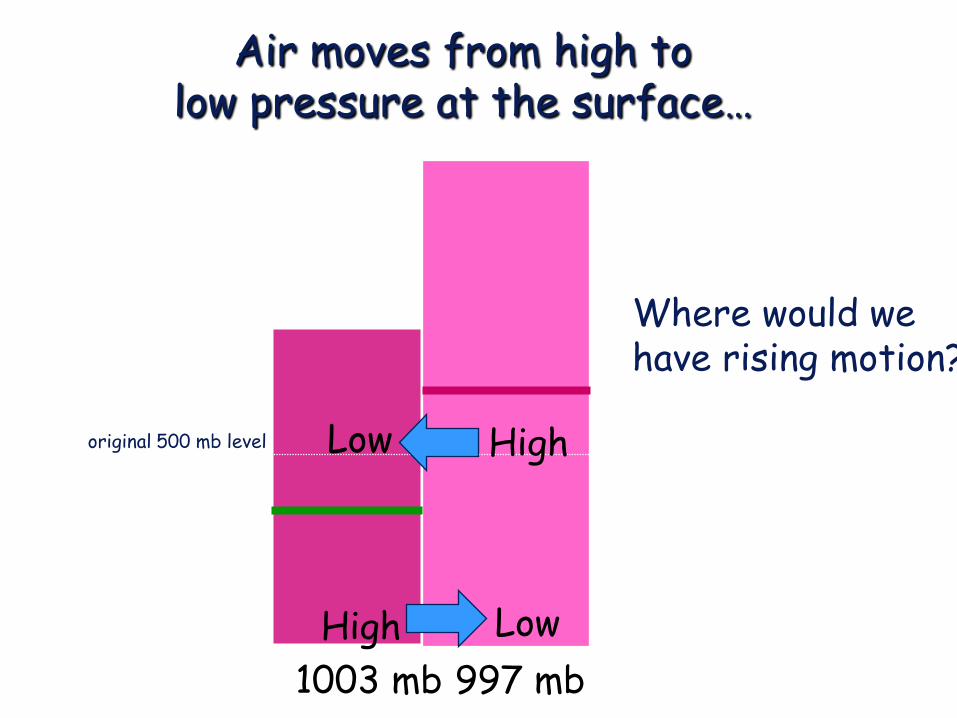
1003 mb 997 mb
original 500 mb level
Air moves from high to low pressure at the surface…
HighLow
High Low
Where would we have rising motion?

What have we just observed?
• Starting with a uniform atmosphere at rest, we introduced differential heating
• The differential heating caused different rates of expansion in the fluid
• The differing rates of expansion resulted in pressure differences along a horizontal surface.
• The pressure differences induced horizontal flow (wind) in the fluid
• This is how the atmosphere converts heating into motion
• Winds are the result of differential heating

Surface Pressure Maps
• Altitude-adjusted surface station pressures are used to
construct sea level pressure contours

weak pressure
gradient
The pressure gradient forces acts at right
angles to the isobars (90 degrees)
strong pressure
gradient
820
830
840
850
860
870
880
890
820
830
840
850
860
Differences in air pressure = a pressure gradient

Global Circulation

SUNWarm
Low Pressure
Cold
High
Pressure
But heat is
transported from
the Equator to the
Poles - how?
0o
30oN
60oN
30oS
60oS
90oN
90oN
Earth

Fig. 7-6, p. 151

How is Energy Transportedto its “escape zones?”
• Both atmospheric and ocean transport are crucial
• Buoyancy-driven convection drives vertical transport
• Latent heat is at least as important as sensible heat

What a single cell convection model would look like for a
non-rotating earth
• Thermal convection leads to formation of convection cell in each hemisphere
• Energy transported from equator toward poles
• What would prevailing wind direction be over N. America with this flow pattern on a rotating earth?


What’s wrong
with the 1-cell model?
• Neglects effect of rotation
- with rotation, winds would cause earth to spin down
- with rotation, the upper level winds would accelerate to
unphysical speeds near the pole. You would be funneling all
the air from the Equator down at the Poles
- It is not a stable solution for wind circulation

Fig. 8-1, p. 172

Coriolis Force acts to the right
in the Northern Hemisphere
Physics

Coriolis Effect
The Coriolis Effect deflects moving objects to the right in the
northern hemisphere and to the left in the southern.

General Circulation of the Earth’s
Atmosphere
No Deflection
Deflection
Deflection
Deflection is
least at the
equator and
greatest at the
poles
0o
30oN
60oN
30oS
60oS
90oN
90oN

Wind patterns on a rotating Earth3 circulation cells in each hemisphere

Fig. 7-12, p. 154

Wind patterns on a rotating Earth3 circulation cells in each hemisphere


warm air rises at the
equator producing low
pressure (Intertropical
Convergence Zone,
ITCZ) and flows
towards the poles
L0o
30oN
60oN
30oS
60oS
90oN
90oN
Cold air sinks at 30o
N and S latitude
Creating high pressure
(subtropical high
pressure, STH)
L0o
30oN
60oN
30oS
60oS
90oN
90oN
H
H

Northeasterly and southeasterly
surface winds flow from the
subtropical high pressure belts
(30o N and S) to the low
pressure belt (ITCZ) at
the equator (calm winds:
doldrums)
westerly surface winds
flow from the subtropical
high pressure belts towards
higher latitudes
L0o
30oN
60oN
30oS
60oS
90oN
90oN
H
H

westerly surface winds are forced
to rise around 60o N and S latitude
when they encounter cold polar
easterly winds from the poles
resulting in Subpolar Low
pressure (SPL) belts
L0o
30oN
60oN
30oS
60oS
90oN
90oN
H
H
L
L

cold air sinks at the
poles producing
polar high (PH)
pressure regions
L0o
30oN
60oN
30oS
60oS
90oN
90oN
H
H
L
L
H
H

Figure 5.17, p. 163

Jet streams are
streams
of fast
moving
air aloft
that occur
where
atmospheric
temperature
gradients
are strong
L0o
30oN
60oN
30oS
60oS
90oN
90oN
H
H
L
L
H
H polar jet stream
polar jet stream
subtropical
jet streams

Key features of three cell model
• Hadley cell (thermally direct cell)
- driven by meridional gradient in heating
- air rises near equator and descends near 30 degrees
- explains deserts; trade winds; ITCZ
• Ferrel Cell (indirect thermal cell)
- driven by heat transports of eddies
- air rises near 60 degrees and descends near 30 degrees
- explains surface westerlies from 30-60
• Weak winds found near
– Equator (doldrums)
– 30 degrees (horse latitudes)
• Boundary between cold polar air and mid-latitude warmer air is the polar front


Geostrophic Winds

Coriolis Force acts to the right
in the Northern Hemisphere
Physics

Coriolis Effect
The Coriolis Effect deflects moving objects to the right in the
northern hemisphere and to the left in the southern.

low pressure
pressure geostrophic
gradient force winds
992
996
1000
1004
1008
1012
1016
1020
high pressure
Coriolis Force

Gradient Wind

“Geostrophic Wind”
• The Geostrophic wind is flow in a straight line in
which the pressure gradient force balances the
Coriolis force.
994 mb
996 mb
998 mb
Lower Pressure
Higher Pressure
Note: Geostrophic flow is often a good approximation high in the atmosphere (>500 meters)

air descends
High pressure (anticyclone)
From above
H
Side View
surrounding air is
relatively low
L
HL L

air ascends
Low pressure (depressions, cyclone)
From above
L
Side View
surrounding air is
relatively high
H
LH H

Friction forces
Near the surface, friction reduces the speed of the wind,
This reduces the Coriolis Force,
Which changes the direction of the geostrophic wind,
The pressure gradient force over powers the Coriolis effect,
As a result wind flow across the isobars.
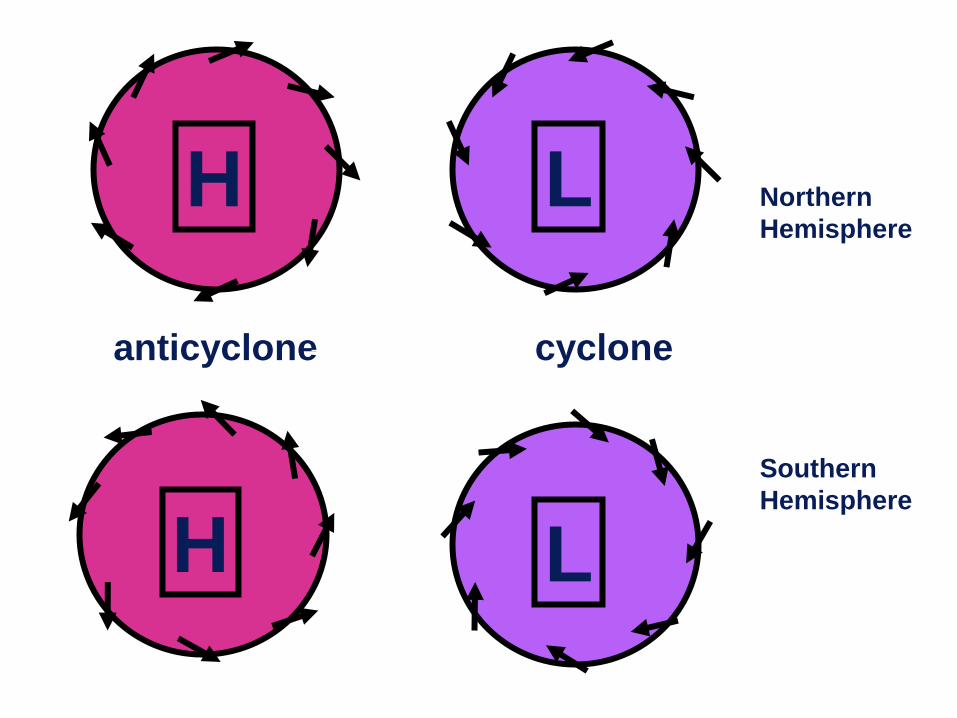
Northern
Hemisphere
Southern
Hemisphere
H L
LH
anticyclone cyclone

Global Temperature patterns and
weather

Temperature Patterns
• Stronger seasonal heating and cooling on land produces asymmetry
• Poleward distortion of isotherms over northern high latitude oceans
• Equatorward distortion over subtropics

Seasonal Migration of ITCZ
• Mean position is somewhat north of Equator
• Strong departures from zonal mean position driven by seasonal heating over land
(Especially over Asia, S. America, Africa)

MonsoonsIn July the position of the ITCZ moves North
• low pressure over land causes winds to flow off the ocean
• this brings heavy rainfall
Figure 5.20, p. 167

Monsoons
In January high pressure over the land produces dry winds
Air is flowing towards the ITCZ
Figure 5.20, p. 167

Elevation of the 500 mb isobar

Polar Front Jet Stream
• Polar front jet stream forms along polar front where strong thermal gradient causes a strong pressure gradient
• Strong pressure gradient force and coriolis force produce strong west wind parallel to contour lines
• Polar jet sometimes splits into north and south branches

Jet Streams• Fast air currents, 1000’s of
km’s long, a few hundred km wide, a few km thick
• Typically find two jet streams (subtropical and polar front) at tropopause in NH
• When would you expect the jets to be strongest?

Smooth westward
flow of upper air
westerlies
Develop at the polar
front, and form
convoluted waves
eventually pinch off
Primary mechanism
for poleward heat
transfere
Pools of cool air
create areas of low
pressure
Rossby Waves


The “dishpan” experiment
• A tank of water with a hot equator and a cold pole is
rotated
– Troughs, ridges and eddies are produced, similar to
patterns observed in earth’s general circulation


http://jrscience.wcp.muohio.edu/coriolis/satmovies.html#anchor1386282
movies
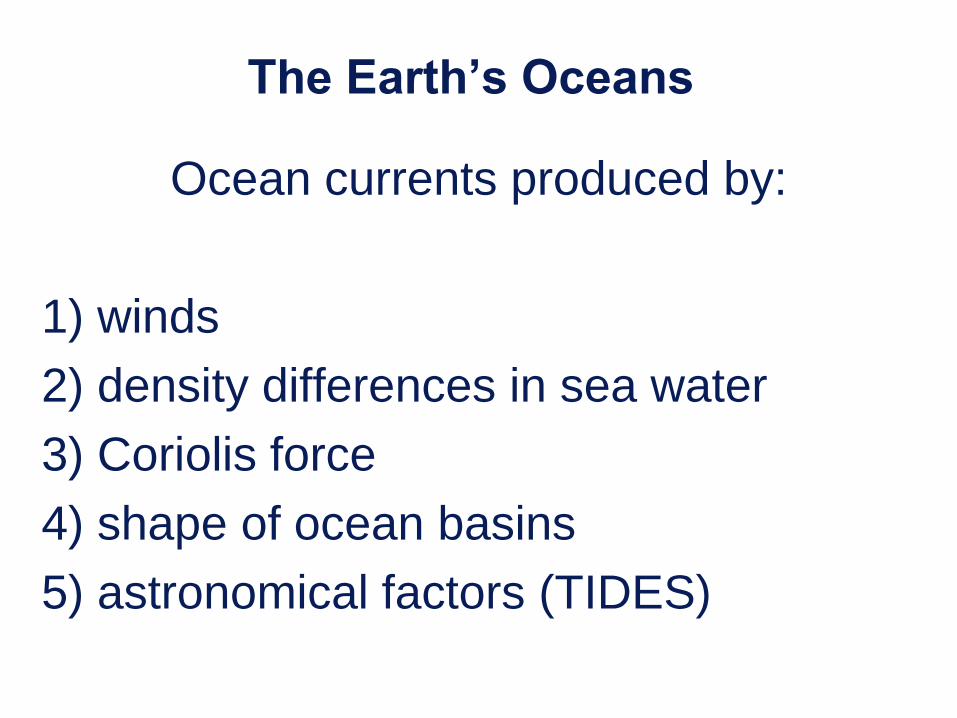
The Earth’s Oceans
Ocean currents produced by:
1) winds
2) density differences in sea water
3) Coriolis force
4) shape of ocean basins
5) astronomical factors (TIDES)

Ocean Currents
driven mostly by wind
blowing over the surface
however, currents move
slowly
lag behind wind speed so
often called drifts
wind
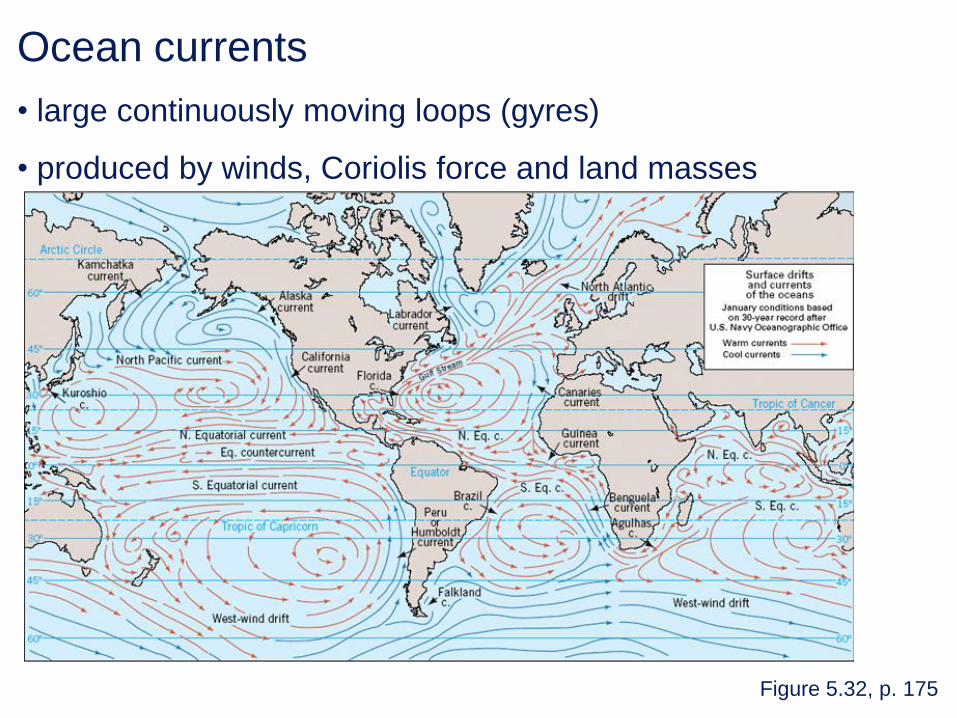
Ocean currents
• large continuously moving loops (gyres)
• produced by winds, Coriolis force and land masses
Figure 5.32, p. 175

Fig. 8-2, p. 172

Each hemisphere contains a tropical and subtropical gyre
EQUATOR
North Tropical Gyre
South Tropical Gyre
N. Subtropical Gyre
S. Subtropical Gyre

Surface Currents redistribute heat

Upwelling
where cold water rises from deep ocean areas and where
the Coriolis forces prompts ocean currents to diverge
from coastlines
Figure 5.37, p. 180

Deep-sea currents
• driven by differences in temperature and salinity
• much slower than surface currents
Figure 5.32, p. 180

The Ocean Conveyor Belt
Deep-sea currents
• driven by differences in temperature and salinity
• much bigger and slower than surface currents

El Niño Southern Oscillation (ENSO)
• Trade winds promote cold water upwelling in eastern tropical Pacific
– Cool, deep water is nutrient rich and supports rich ecosystem
(plankton, fish, birds,…)
• Weaker trades lead to weaker upwelling. Warm nutrient-poor tropical water replaces the
cold, nutrient-rich water .
– called El Niño (boy child)
• Every few years this El Niño (surface warming) persists and is widespread
– Huge ecosystem and economic losses
– Alters weather patterns over much of the world
+3
+2
-1
+1
-2
0
1950 1955 1960 1965 1970 1975 1980 1985 1990 1995 2000 2005
El Niño
La Niña
57-58 65-66
72-73
76-77
82-83
86-87
97-98

El Niño
La Niña
Normal
Sea Surface Temperatures
(oC)
La Niña: cold surface water
moves over central and
eastern Pacific.
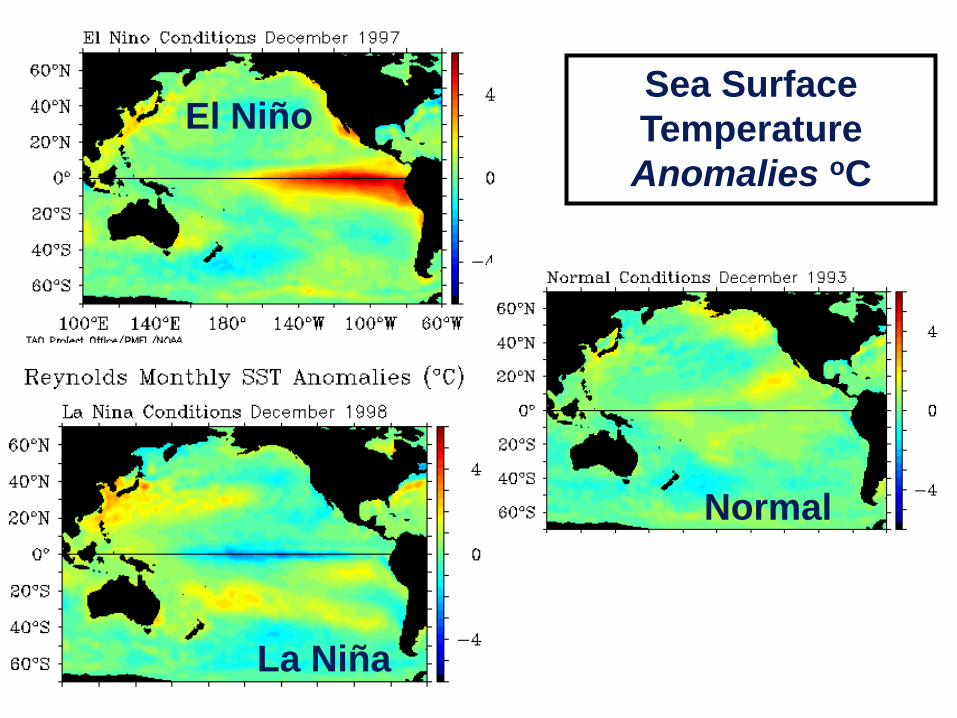
El Niño
La Niña
Normal
Sea Surface
Temperature
Anomalies oC

Normal conditions – equatorial Pacific

ENSO (El Nino - Southern Oscillation)
conditions

Idealized ENSO wave
http://www.cdc.noaa.gov/people/joseph.barsugli/anim.html
For animation of most recent anomaly asee
http://www.cdc.noaa.gov/map/clim/sst_olr/sst_anim.shtml
Animations on the web

Why do we care about ENSO?
• Global impacts on weather.
• Long timescale (months) yields improved
seasonal prediction.
• Provides insight into coupled behavior of
oceans and atmosphere … may lead to
better overall understanding of climate

Weather Variation: ENSO cycle
winter
summer

Impacts of El Niño
• Droughts– Fires
– Agricultural productivity
– Water supply
• Extreme Precipitation– Floods
– Erosion
– Disease
– Transportation
• Impacts through marine food chain– Natural ecological responses
– Economic