Wind Turbine Tower Structure Analysis According to Wind Load in … · 2019-02-04 · Wind Turbine...
148
1 Wind Turbine Tower Structure Analysis According to Wind Load in Terms of Cost Selcuk SAHIN Master Thesis Presented in partial fulfillment of the requirements for the double degree: “Advanced Master in Naval Architecture” conferred by University of Liege “Master of Sciences in Applied Mechanics, specialization in Hydrodynamics, Energetics and Propulsion” conferred by Ecole Centrale de Nantes Developed at West Pomeranian University of Technology, Szczecin, Poland and Pusan National University, Pusan, Korea in the framework of the “EMSHIP” Erasmus Mundus Master Course in “Integrated Advanced Ship Design” Ref. 159652-1-2009-1-BE-ERA MUNDUS-EMMC Supervisor: Prof. Maciej Taczała, West Pomeranian University of Technology, Szczecin Prof. Jeom Kee Paik, Pusan National University, Busan Reviewer: Dr. Hervé LE SOURNE, L'Institut Catholique d'Arts et Métiers (ICAM), Nantes Szczecin, February 2016
Transcript of Wind Turbine Tower Structure Analysis According to Wind Load in … · 2019-02-04 · Wind Turbine...
1
Wind Turbine Tower Structure Analysis According to
Wind Load in Terms of Cost
Selcuk SAHIN
Master Thesis
Presented in partial fulfillment of the requirements for the double degree:
“Advanced Master in Naval Architecture” conferred by University of Liege
“Master of Sciences in Applied Mechanics, specialization in Hydrodynamics,
Energetics and Propulsion” conferred by Ecole Centrale de Nantes
Developed at West Pomeranian University of Technology, Szczecin, Poland and
Pusan National University, Pusan, Korea in the framework of the
“EMSHIP”
Erasmus Mundus Master Course in
“Integrated Advanced Ship Design”
Ref. 159652-1-2009-1-BE-ERA MUNDUS-EMMC
Supervisor: Prof. Maciej Taczała, West Pomeranian University of
Technology, Szczecin
Prof. Jeom Kee Paik, Pusan National University, Busan
Reviewer: Dr. Hervé LE SOURNE, L'Institut Catholique d'Arts et
Métiers (ICAM), Nantes
Szczecin, February 2016

P 2 Selcuk SAHIN
Master Thesis developed at West Pomeranian University of Technology, Szczecin, Poland and The Lloyd’s
Register Foundation Research Centre of Excellence, Pusan, Republic of Korea
CONTENTS
ACKNOWLEDGEMENTS 9
DECLARATION OF AUTHORSHIP 10
ABSTRACT 11
1. INTRODUCTION 12
1.1. Why Wind Energy 12
1.2. Wind Market 13
1.3. Anatomy of Wind Turbines 20
1.3.1. Components of a Horizontal Axis Wind Turbine 21
1.3.1.1. Foundation 22
1.3.1.2. Tower 23
1.3.1.3. Nacelle 24
1.3.1.4. Rotor 25
1.3.1.5. Electric System Room 25
1.4. Types of Wind Turbine Towers 25
1.4.1. Lattice Towers 25
1.4.2. Steel Cylindrical Towers 26
1.4.3. Concrete Towers 28
1.4.4. Hybrid Towers 29
1.5. Standards 30
1.6. Gap 32
1.7. Objectives 32
1.8. Structure of the Work 33
2. STATE OF THE ART 34
3. TURBINE TOWER SELECTION 35
4. ANALYTICAL ANALYSES 36
4.1. Wind Load Design 37
4.1.1. Basic Wind Load Design 37
4.1.2. Experimental Wind Load Design 38
4.2. Partial Safety Factors 42
4.3. Tower and Shell Analyses 44
4.3.1. Yield Data 46

Wind Turbine Tower Structure Analysis According to Wind Load in Terms of Cost 3
“EMSHIP” Erasmus Mundus Master Course, period of study September 2014 – February 2016
4.3.2. Buckling Strength 47
4.3.2.1. Buckling Calculation Stress Data 50
4.3.2.2. Meridional Buckling Stress 58
4.3.2.3. Circumferential Buckling Stress 65
4.3.2.4. Shear Buckling Stress 70
4.3.2.5. Buckling Stress Reserve Factor Calculations 75
4.3.3. Fatigue Strength 78
4.3.3.1. S-N Curve 80
4.3.3.2. Palmgren-Miner’s Rule 81
4.3.3.3. Safety Factors 82
4.3.3.4. Fatigue Damage Calculation 83
4.3.4. Dynamic 91
4.3.4.1. Determining Tower Natural Frequency 91
4.3.4.2. Determining Operation Frequency and Working Frequency 92
4.4. Tower Flange Design 95
4.4.1. L-flange (Single Sided) Calculations 103
4.4.2. T-flange (Double Sided) Calculations 104
4.4.3. Geometric Restrictions 106
4.4.4. Results 107
5. ULTIMATE STRENGTH OF CYLINDRICAL TOWERS WITH OPENING IN WIND
TURBINE STRUCTURES 109
5.1. Structure Features of Wind Turbine Structures and Openings 110
5.1.1. Definition of Geometrical Parameters 110
5.1.2. Geometrical Feature of Wind Turbine Structures 110
5.2. Nonlinear Finite Element Modelling 113
5.2.1. Finite Element Model 113
5.2.2. Boundary Conditions 115
5.2.3. Mesh-Convergence Study 116
5.2.4. Validation with Experiment 117
5.3. Effect of Opening Shapes 118
5.4. Effect of Stiffeners 120
5.5. Ideal Door Opening 122
6. COST ANALYSIS 123
6.1. Fabrication Cost 124
P 4 Selcuk SAHIN
Master Thesis developed at West Pomeranian University of Technology, Szczecin, Poland and The Lloyd’s
Register Foundation Research Centre of Excellence, Pusan, Republic of Korea
6.1.1. Flange Fabrication Cost 125
6.2. Final Cost Estimation 127
7. CONCLUSION AND DISCUSSION 129
7.1. Future Research 130
8. REFERENCES 132
9. APPENDIX 136
9.1. Experimental Load Input Data 136
9.2. Interpolated Experimental Load Input Data 137
9.3. Load Input Data 138
9.4. Stress Calculation 139
9.5. Meridional Buckling Stress 140
9.6. Circumferential Buckling Stress 141
9.7. Shear Buckling Stress 142
9.8. SRF Buckling Calculation 143
9.9. Fatigue Details 144
9.10. Fatigue Calculation 1 145
9.11. Fatigue Calculation 2 146
9.12. Flange Failure Modes 1 147
9.13. Flange Failure Modes 2 148

Wind Turbine Tower Structure Analysis According to Wind Load in Terms of Cost 5
“EMSHIP” Erasmus Mundus Master Course, period of study September 2014 – February 2016
LIST OF FIGURES
Figure 1: Market forecast for 2014-2019 (GWEC 2012) 12
Figure 2: Total wind energy cost per unit of electricity produced (“Development of the Cost of
Wind-Generated Power” n.d.) 13
Figure 3: Gansu onshore wind farm in China (“New Wind and Solar Sectors Won’t Solve
China’s Water Scarcity | Circle of Blue WaterNews” n.d.) 14
Figure 4: The Swedish offshore wind farm Lillgrund in the Øresund between Malmö and
Copenhagen (“Wind Turbine Risks to Seabirds: New Tool Maps Birds’ Sensitivity to Offshore
Farms (Constantine Alexander's Blog)” n.d.) 15
Figure 5: Global cumulative installed wind capacity 1997-2014 (GWEC 2012) 15
Figure 6: Global annual installed wind capacity 1997-2014 (GWEC 2012) 16
Figure 7: Top 10 new installed capacity Jan-Dec 2014(Left) & Top 10 cumulative capacity
Dec 2014 (Right) (GWEC 2012) 16
Figure 8: Annual installed capacity by region 2006-2014 (GWEC 2012) 17
Figure 9: Annual market forecast by region 2014-2019 (GWEC 2012) 18
Figure 10: Cumulative market forecast by region 2014-2019 (GWEC 2012) 18
Figure 11: Average hub-height, generating capacity and rotor length of wind turbines, by
installation year (US DOE 2014) 19
Figure 12: HAWT and VAWT (“Wind Basics - Hill Country Wind Power” n.d.) 20
Figure 13: Components of horizontal wind turbine (Kanbur 2014) 21
Figure 14: Concrete foundation of onshore wind turbine (“Wind Farm | Riley Group” n.d.) 22
Figure 15: The offshore wind energy development considering to deepness (Aydin 2007) 22
Figure 16: Shallow and deep-water foundation technologies (Aydin 2007) 23
Figure 17: View of nacelle (“The Inside of a Wind Turbine | Department of Energy” n.d.) 24
Figure 18: Lattice tower sample (“Everything You Need to Know About Small Wind Turbines”
n.d.) 26
Figure 19: a) Steel cylindrical tower b) Flange connection (Kanbur 2014) 26
Figure 20: Pre-Stressing process (Kanbur 2014) 27
Figure 21: Tower and blades transportation for offshore wind turbines (“Heavy Lift Vessel
‘Atlantic’ Delivered to Her Owners - CONOSHIP” n.d.) 28
Figure 22: Concrete towers for wind turbines (“ACCIONA Windpower Inaugurates the First
Concrete Tower Production Plant in Mexico” n.d.) 29
Figure 23: Assembly process for hybrid tower (“Prefabricated DYWIDAG Tendons Secure
Innovative ATS Hybrid Wind Tower - DYWIDAG-Systems International” n.d.) 30
Figure 24: Flowchart of final thesis 33
Figure 25: Tower length distribution 35
Figure 26: Preliminary designed tower 36
Figure 27: Basic theory of sensor loads and interpolated loads relation 39
Figure 28: Calculation methodology for linear interpolation (“Excel Interpolation Formulas -
Peltier Tech Blog” n.d.) 40
Figure 29: Resulting extreme bending moments along the tower 41
Figure 30: Fatigue bending moments along the tower 42

P 6 Selcuk SAHIN
Master Thesis developed at West Pomeranian University of Technology, Szczecin, Poland and The Lloyd’s
Register Foundation Research Centre of Excellence, Pusan, Republic of Korea
Figure 31: Stress-Strain relation (“Stress Strain Diagram For Ductile And Brittle Materials -
Transtutors” n.d.) 45
Figure 32: Can sample for tower 47
Figure 33: Top view for tower can 48
Figure 34: Hollow cylindirical cross section 48
Figure 35: Symbols in shells of revolution (CEN (European Commitee for Standardization)
2007b) 50
Figure 36: Five different stresses can be seen on tower (“SPECIFIC ACTION OF STRESSES
- 14014_74” n.d.) 50
Figure 37: Direct stress (“Force and Strength” n.d.) 51
Figure 38: Tube element under torsion (“Torsion (mechanics) - Wikipedia, the Free
Encyclopedia” n.d.) 52
Figure 39: In circular shaft stress varies from the center (“Theory -8” n.d.) 52
Figure 40: Hoop stress on the structure (“EngrApps: Burst and Collapse - Pressure Vessel
Design” n.d.) 54
Figure 41: Wind pressure distribution around shell circumference (CEN (European Commitee
for Standardization) 2007b) 55
Figure 42: Equivalent axisymmetric pressure distribution (CEN (European Commitee for
Standardization) 2007b) 55
Figure 43: Cylinder geometry (CEN (European Commitee for Standardization) 2007b) 58
Figure 44: Stress reserve factor each can 77
Figure 45: Welding connections in the tower (Kanbur 2014) 78
Figure 46: Typical weld details in a tubular tower a) weld at flange b) weld between two cans
(Verma 2011) 78
Figure 47: The stress cycle (Germanischer Lloyd Industrial Services GmbH 2010) 79
Figure 48: Fatigue strength curves for direct stress ranges (CEN (European Commitee for
Standardization) 2005b) 81
Figure 49: Chancing tower details in order to provide European Standards 83
Figure 50: DEL and SRF corresponding to tower height 90
Figure 51: SRF for fatigue and buckling 90
Figure 52: Baumeister frequency value corresponding to tower mass 91
Figure 53: Frequency analyses of the tower 94
Figure 54: Campbell Diagram 94
Figure 55: Segment approach for design of ring flange connection (Achmus et al. n.d.) 96
Figure 56: Section view of connection (Kanbur 2014) 96
Figure 57: Failure modes of the simlified calculation method acc. to Petersen (Schaumann and
Seidel 2000) 97
Figure 58: a) L-flange b) T-flange 98
Figure 59: T-flange failure modes (CEN (European Commitee for Standardization) 2007b)
104
Figure 60: SRF’s for bolt and flange 108
Figure 61: Wind tower accident due to wrong door opening estimatiıon (“WindAction | Wind
Turbines and Public Safety: Setbacks Matter” n.d.) 109
Figure 62: A schematic representation of typical wind turbine with a door opening 110

Wind Turbine Tower Structure Analysis According to Wind Load in Terms of Cost 7
“EMSHIP” Erasmus Mundus Master Course, period of study September 2014 – February 2016
Figure 63: Geometrical characteristics of wind turbine and door opening: (a) capacity; (b)
height of wind turbine; (c) maximum diameter of wind turbine; (d) minimum diameter of wind
turbine; (e) minimum thickness of wind turbine; (f) maximum thickness of wind turbine; (g)
height of door opening; (h) width of door opening; (i) thickness of door opening 111
Figure 64: Geometrical characteristics of wind turbine and door opening: (a) height to minimum
diameter ratio of wind turbine; (b) height to maximum diameter ratio of wind turbine; (c)
minimum diameter to minimum thickness ratio of wind turbine; (d) maximum diameter to
maximum thickness ratio of wind turbine; (e) height to width ratio of door opening; (f) width
to thickness ratio of door opening 112
Figure 65: A schematic representations of typical and applied geometries for the standard
turbine with the door opening: (a) nomenclature; (b) typical geometry and applied loading.
114
Figure 66: An example of 1st buckling mode under pure bending moment in x-axis 114
Figure 67: Applied material model for the present and validation studies 115
Figure 68: Coordinate system and applied boundary conditions of the wind turbine: (a)
coordinate system; (b) fixed. 116
Figure 69: Results of mesh-convergence study for DMAX x HS = 3750 x 12655 mm, h x b x t x
R = 1950 x 700 x 30 x 100 mm, σY = 299 MPa, w0 = 0.3t : (a) bending moment; (b) deformation
116
Figure 70: Results of mesh-convergence study for DMAX x HS = 3750 x 12655 mm, h x b x t x
R = 1950 x 700 x 30 x 100 mm, σY = 299 MPa, w0 = 0.3t : (a) bending moment; (b) deformation
117
Figure 71: Geometry information for validation study: (a) applied geometry model; (b) applied
mesh model. 117
Figure 72: Validation study on developed FE modelling technique (Dimopoulos and Gantes
2012) 118
Figure 73: Applies geometries of the door opening: (a) no opening; (b) rectangular; (c)
elliptical; (d) half-rectangular and -elliptical. 119
Figure 74: Comparisons of numerical computations for different door opening shapes: (a) 1st
buckling mode; (b) stress distribution at rotation angle 3 degrees; (c) deformation at rotation
angle 3 degrees. 119
Figure 75: Comparisons of bending moment for different shapes of the door opening. 120
Figure 76: Applied stiffener geometries of the door opening: (a) no stiffener; (b) edge stiffener;
(c) flat-bar stiffener; (d) door-shaped stiffener 121
Figure 77: Comparisons of numerical computations for different stiffeners: (a) 1st buckling
mode; (b) stress distribution at rotation angle 3 degrees; (c) deformation at rotation angle 3
degrees 121
Figure 78: Comparisons of bending moment for different stiffeners of the door opening 122
Figure 79: Final door model 123
Figure 80: Bolted ring flange connection (Verma 2011) 125
Figure 81: Wind turbine tower cost comparisons for 3.6-MW (Lanier and Way 2005) 128
P 8 Selcuk SAHIN
Master Thesis developed at West Pomeranian University of Technology, Szczecin, Poland and The Lloyd’s
Register Foundation Research Centre of Excellence, Pusan, Republic of Korea
ABBREVIATIONS
AWEA American Wind Energy Association
ASTM American Society for Testing and Materials
DEL Damage Equivalent Load
DIN German Instute for Standardization
EC Eurocode
EC3 Eurocode 3: Design of Steel Structures
EC3-1-1 Eurocode 3: Part 1-1: General Rules
EC3-1-4 Eurocode 3: Part 1-4: Supplementary Rules for Stainless Steel
EC3-1-5 Eurocode 3: Part 1-5: Plated Structural Elements
EC3-1-6 Eurocode 3: Part 1-6: Strength and Stability of Shell Structures
EC3-1-9 Eurocode 3: Part 1-9: Fatigue
EN European Standards
EU European Union
FEM Finite Element Method
GWEC Global Wind Energy Council
HAWT Horizontal-Axis Wind Turbine
IEC International Electrotechnical Commision
SRF Stress Reserve Factor
UK United Kingdom
VAWT Vertical-Axis Wind Turbine

Wind Turbine Tower Structure Analysis According to Wind Load in Terms of Cost 9
“EMSHIP” Erasmus Mundus Master Course, period of study September 2014 – February 2016
ACKNOWLEDGEMENTS
I want to thank all the people who shared their knowledge with me for the development of this
work. First of all, I would like to express my cordial thankfulness to my advisors Prof. Maciej
Taczała from West Pomeranian University, Prof. J.K. Paik from Pusan National University and
Prof. Philippe Rigo from the University of Liege.
Also, I would like to thank the master thesis examination committee.
In additional, I would like to give special thanks to Dr. Young Il Park and Sang-Eui Lee who
guided me in wind turbine industry with their knowledge and comments.
I would also like to thank my friends and classmates: S. Oy, J. D. Benther, A. Selamoglu for
their supports and aids in order to finish my final thesis.
Finally, I would like to thank my family for their support throughout my life.

P 10 Selcuk SAHIN
Master Thesis developed at West Pomeranian University of Technology, Szczecin, Poland and The Lloyd’s
Register Foundation Research Centre of Excellence, Pusan, Republic of Korea
DECLARATION OF AUTHORSHIP
I declare that this thesis and the work presented in it are my own and have been generated by
me as the result of my own original research.
Where I have consulted the published work of others, this is always clearly attributed.
Where I have quoted from the work of others, the source is always given. With the exception
of such quotations, this thesis is entirely my own work.
I have acknowledged all main sources of help.
Where the thesis is based on work done by myself jointly with others, I have made clear exactly
what was done by others and what I have contributed myself.
This thesis contains no material that has been submitted previously, in whole or in part, for the
award of any other academic degree or diploma.
I cede copyright of the thesis in favor of the University of …..
Date: Signature

Wind Turbine Tower Structure Analysis According to Wind Load in Terms of Cost 11
“EMSHIP” Erasmus Mundus Master Course, period of study September 2014 – February 2016
ABSTRACT
The development of wind energy is drastically increasing as a result of the energy need in the
world. The main concerns about the design is to make a safe and economically feasible wind
turbines. The design of the wind turbine tower must be strong and stiff enough to endure the
varying wind and wave loads.
In this study, a site specific 3MW monopile type wind turbine tower was designed and analysed
according to European Standards considering wind loads. The standard analysis procedure of
the tower is respectively buckling, fatigue and dynamic analyses were done analytically and
optimum door opening geometry was found and FEM analyses examined. Basic cost
optimization of the tower was also done.
The objectives of this thesis help to producers (1) how to design wind turbine towers in
structural aspect, (2) identify which kind of standards must be followed, (3) follow the standards
and (4) show idealization and FEM analyses of door opening of wind tower.
The analytic results of the designed tower were found in interval that is wanted to reach. The
importance of the tower door opening was observed. Considering to other door opening
geometries, the geometry that was chosen for this thesis was one of the good result.
Keywords (Standards, Wind Turbine, Tower, Door Opening, Analyses)

P 12 Selcuk SAHIN
Master Thesis developed at West Pomeranian University of Technology, Szczecin, Poland and The Lloyd’s
Register Foundation Research Centre of Excellence, Pusan, Republic of Korea
1. INTRODUCTION
1.1. Why Wind Energy
In the world, a big percentage of our energy is provided from fossil fuels. These are basically
coal, oil and gas. These sources are not sustainable, therefore at the end it will run out.
Additionally, as a result of using these sources, the environment is damaged by humans. As a
consequent of intensive use of the fossil fuels; global warming, extinction of species and human
health problems are increasing.
Nowadays, fossil energy is continually replaced by renewable energy, therefore energy impact
magnitude on the environment is lower compared to fossil fuels. Being responsible for nature,
many countries have implemented their own renewable energy initiatives into their future
energy plans. According to (GWEC 2012), in 2019 cumulative wind capacity will be more than
650 GW as it can be seen in Figure 1,
Figure 1: Market forecast for 2014-2019 (GWEC 2012)
Additionally cost/KW ratio for wind energy gets lower as it can be seen in Figure 2,

Wind Turbine Tower Structure Analysis According to Wind Load in Terms of Cost 13
“EMSHIP” Erasmus Mundus Master Course, period of study September 2014 – February 2016
Figure 2: Total wind energy cost per unit of electricity produced (“Development of the Cost of Wind-
Generated Power” n.d.)
1.2. Wind Market
Amazingly, wind energy increases its popularity day by day. Nowadays, wind turbine energy
is the most developed and commercially viable energy source among the renewable energy
resources. Wind power is produced from a useful form of the wind energy using wind turbines
or wind mills.
The first windmill was used in Europe in the 12th century. However, the first attempts to
produce energy from the wind started in 19th century in Denmark. In 1894, the first energy
production from the wind has succeeded. On the other hand, during that period oil and gas
sectors developed a lot and because of that, wind energy had to wait until 1973. Between 1973
and 1979 a world oil crises occurred. During that time, people turned their face to another
energy sources. Firstly, small turbines were developed such as 20-30 kilowatt. From that time
to now, turbines reach to 5-10 megawatt.

P 14 Selcuk SAHIN
Master Thesis developed at West Pomeranian University of Technology, Szczecin, Poland and The Lloyd’s
Register Foundation Research Centre of Excellence, Pusan, Republic of Korea
Figure 3: Gansu onshore wind farm in China (“New Wind and Solar Sectors Won’t Solve China’s
Water Scarcity | Circle of Blue WaterNews” n.d.)
Because of the technological and material development, the diameter of turbines and length of
the tower were increased in order to bring more wind speed. Big wind farms were established
that included several wind turbines. Farm’s features are flat large areas, mountain or hills top
no turbulence. These farms are called onshore wind farm as can be seen in Figure 3. In addition
to onshore, engineers developed offshore wind turbines, because finding a convenient place for
onshore turbines is not that easy. In contrary, there is a very big opportunity on the sea, as
shown in Figure 4. There are some advantages and disadvantages between these two kinds of
the wind farm. Advantages of offshore are constant wind speed, more wind potential.
Disadvantages of offshore are the foundation, cost, installation, transportation, and
maintenance.

Wind Turbine Tower Structure Analysis According to Wind Load in Terms of Cost 15
“EMSHIP” Erasmus Mundus Master Course, period of study September 2014 – February 2016
Figure 4: The Swedish offshore wind farm Lillgrund in the Øresund between Malmö and Copenhagen
(“Wind Turbine Risks to Seabirds: New Tool Maps Birds’ Sensitivity to Offshore Farms (Constantine
Alexander's Blog)” n.d.)
Power production is one of the most important criteria for all kind of wind farm. Before
installation; long-term wind speed measurement, estimation of yearly energy production,
turbine selection and cost analyzes must be done. In order to estimate total energy production
time/costs, one basic rule can be applied, from the experiences, generally production is 1/3 of
the rated turbine out. As a basic example, a 100 MW rated output offshore wind farm (it means
20 number, 5 MW wind turbines) can produce 100*1/3*24*365 = 292000 MWh per year.
Considering a house in Europe uses 4000 kWh per year, as a result, energy consumption of
75000 houses will be provided.
According to GWEC‘s 2014 report, total installed wind capacity is 369.597 MW from 1997 to
2014. Details can be seen in Figure 5,
Figure 5: Global cumulative installed wind capacity 1997-2014 (GWEC 2012)
Also, the annual installed wind capacity can be seen in the same report, due to Figure 6, in 2014,
turbine companies did record installation for wind energy.
P 16 Selcuk SAHIN
Master Thesis developed at West Pomeranian University of Technology, Szczecin, Poland and The Lloyd’s
Register Foundation Research Centre of Excellence, Pusan, Republic of Korea
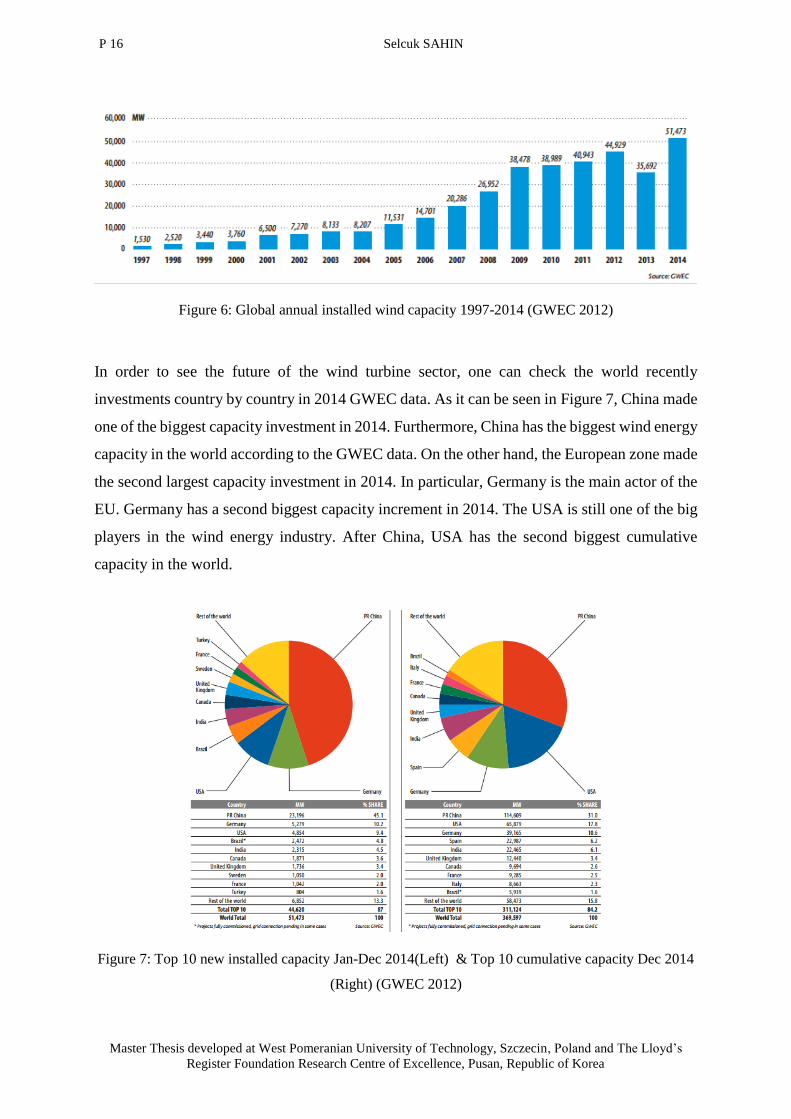
Figure 6: Global annual installed wind capacity 1997-2014 (GWEC 2012)
In order to see the future of the wind turbine sector, one can check the world recently
investments country by country in 2014 GWEC data. As it can be seen in Figure 7, China made
one of the biggest capacity investment in 2014. Furthermore, China has the biggest wind energy
capacity in the world according to the GWEC data. On the other hand, the European zone made
the second largest capacity investment in 2014. In particular, Germany is the main actor of the
EU. Germany has a second biggest capacity increment in 2014. The USA is still one of the big
players in the wind energy industry. After China, USA has the second biggest cumulative
capacity in the world.
Figure 7: Top 10 new installed capacity Jan-Dec 2014(Left) & Top 10 cumulative capacity Dec 2014
(Right) (GWEC 2012)
Wind Turbine Tower Structure Analysis According to Wind Load in Terms of Cost 17
“EMSHIP” Erasmus Mundus Master Course, period of study September 2014 – February 2016
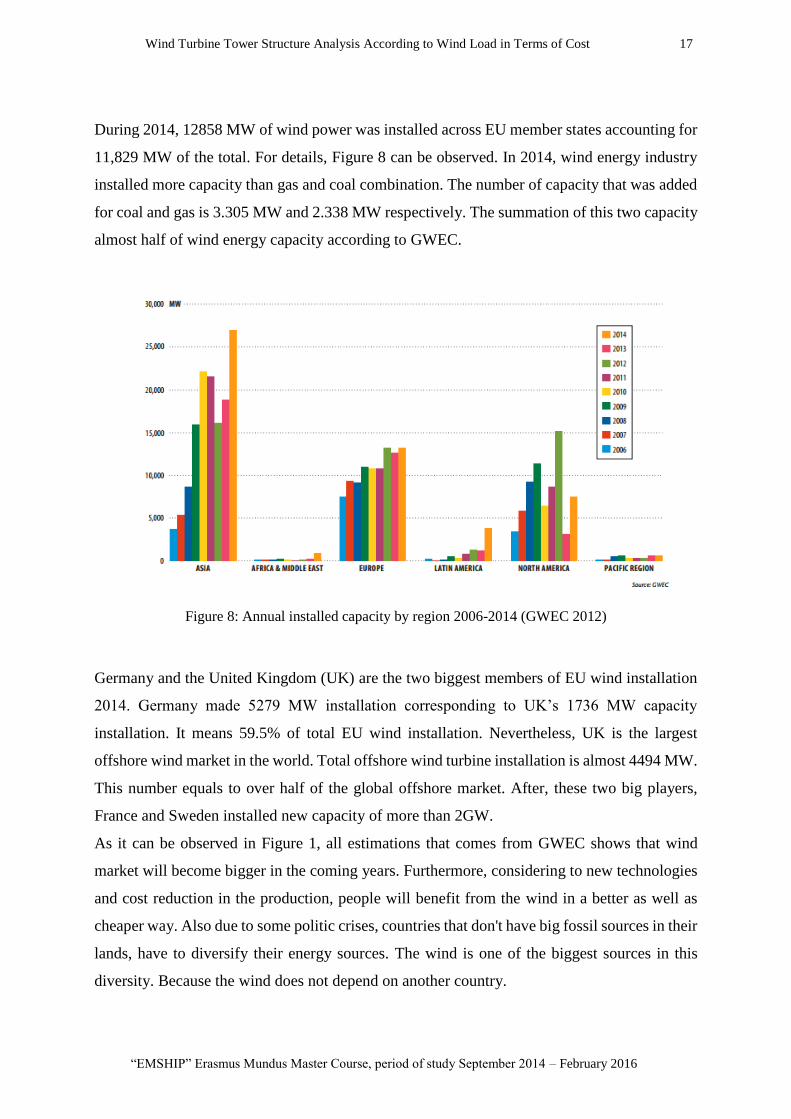
During 2014, 12858 MW of wind power was installed across EU member states accounting for
11,829 MW of the total. For details, Figure 8 can be observed. In 2014, wind energy industry
installed more capacity than gas and coal combination. The number of capacity that was added
for coal and gas is 3.305 MW and 2.338 MW respectively. The summation of this two capacity
almost half of wind energy capacity according to GWEC.
Figure 8: Annual installed capacity by region 2006-2014 (GWEC 2012)
Germany and the United Kingdom (UK) are the two biggest members of EU wind installation
2014. Germany made 5279 MW installation corresponding to UK’s 1736 MW capacity
installation. It means 59.5% of total EU wind installation. Nevertheless, UK is the largest
offshore wind market in the world. Total offshore wind turbine installation is almost 4494 MW.
This number equals to over half of the global offshore market. After, these two big players,
France and Sweden installed new capacity of more than 2GW.
As it can be observed in Figure 1, all estimations that comes from GWEC shows that wind
market will become bigger in the coming years. Furthermore, considering to new technologies
and cost reduction in the production, people will benefit from the wind in a better as well as
cheaper way. Also due to some politic crises, countries that don't have big fossil sources in their
lands, have to diversify their energy sources. The wind is one of the biggest sources in this
diversity. Because the wind does not depend on another country.

P 18 Selcuk SAHIN
Master Thesis developed at West Pomeranian University of Technology, Szczecin, Poland and The Lloyd’s
Register Foundation Research Centre of Excellence, Pusan, Republic of Korea
Moreover, the wind is renewable energy. It produces very low-levels of pollution compared to
coal and gas. Especially in China, thermal power stations constitute big threats to human health
with respect to air pollution. Also, nuclear energy stations carry a big risk to human life. As an
example; in Fukushima, the nuclear matter/material leak has not yet been stopped.
Figure 9: Annual market forecast by region 2014-2019 (GWEC 2012)
Considering to reasons that were mentioned above, the wind energy sector has to grow. As it
can be seen in Figure 9 and Figure 10, GWEC’s market forecasts for each region, also supports
that idea. According to a forecast from 2014 to 2019, Asia will reach 282 GW wind energy
power. Europa will follow to Asia and Europa will have 202 GW settled wind energy in 2019.
Figure 10: Cumulative market forecast by region 2014-2019 (GWEC 2012)

Wind Turbine Tower Structure Analysis According to Wind Load in Terms of Cost 19
“EMSHIP” Erasmus Mundus Master Course, period of study September 2014 – February 2016
As observed in Table 1, in the next 5 years, all around the world wind energy markets will reach
big numbers. Although the economic crises in EU, the market will become 56.34% bigger than
now. On the other hand, Asian wind will dominate the market. They will become almost two
times larger than now.
Table 1: Cumulative market forecast for increment of wind energy capacity
2014-2015 2015-2016 2016-2017 2017-2018 2018-2019 2014-2019
Europe 9.33% 8.87% 8.46% 8.67% 8.51% 52.24%
North America 11.52% 9.64% 7.96% 8.73% 8.92% 56.34%
Asia 18.31% 16.37% 14.32% 12.98% 11.68% 98.59%
Latin America 47.06% 36.00% 29.41% 25.00% 21.82% 294.12%
Pacific 11.36% 10.20% 18.52% 15.63% 13.51% 90.91%
Middle East and Africa 60.00% 50.00% 50.00% 33.33% 33.33% 540.00%
Not only the market but also technology on the turbine has increased. Figure 11 shows alteration
of hub-height, generating capacity and rotor length of wind turbines year by year.
Figure 11: Average hub-height, generating capacity and rotor length of wind turbines, by installation
year (US DOE 2014)

P 20 Selcuk SAHIN
Master Thesis developed at West Pomeranian University of Technology, Szczecin, Poland and The Lloyd’s
Register Foundation Research Centre of Excellence, Pusan, Republic of Korea
The figure above shows that technological and market behavior of wind energy grows in
parallel. So, innovation of wind turbine must continue in order to increase markets all over the
world. As a result of this innovation, turbines that can work in different conditions can be
produced.
1.3. Anatomy of Wind Turbines
Generally, wind turbines can be divided into two parts. These are horizontal-axis wind turbines
and vertical axis wind turbines. HAWT have the main rotor shaft at the top of a tower and it
turns parallel to wind. In contrary shaft of the VAWT turns vertically. In order to see difference
between two types of turbine, Figure 12 might give an idea.
Considering to big percentage of the market, in this thesis, horizontal-axis turbines will be
studied.
Figure 12: HAWT and VAWT (“Wind Basics - Hill Country Wind Power” n.d.)
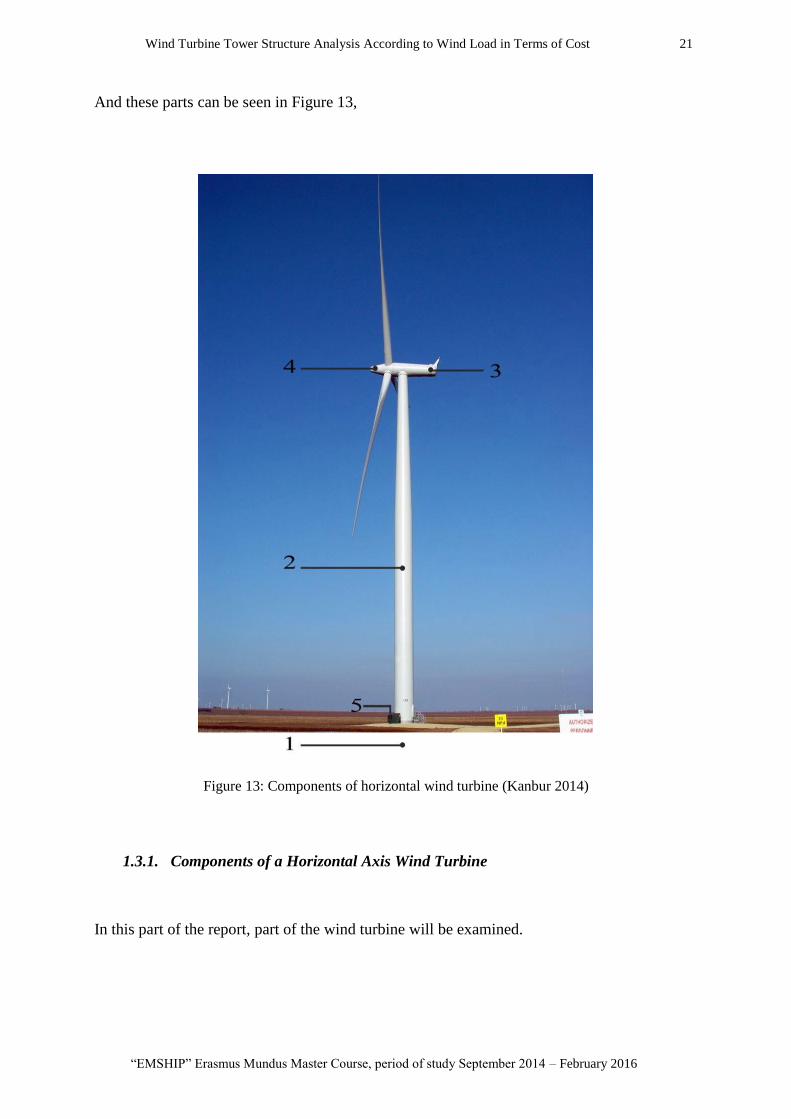
Basically, horizontal-axis wind turbines consist of 5 main parts. These are,
1. Foundation
2. Tower
3. Nacelle
4. Rotor
5. Electricity System Room
Wind Turbine Tower Structure Analysis According to Wind Load in Terms of Cost 21
“EMSHIP” Erasmus Mundus Master Course, period of study September 2014 – February 2016
And these parts can be seen in Figure 13,
Figure 13: Components of horizontal wind turbine (Kanbur 2014)
1.3.1. Components of a Horizontal Axis Wind Turbine
In this part of the report, part of the wind turbine will be examined.

P 22 Selcuk SAHIN
Master Thesis developed at West Pomeranian University of Technology, Szczecin, Poland and The Lloyd’s
Register Foundation Research Centre of Excellence, Pusan, Republic of Korea
1.3.1.1. Foundation
Figure 14: Concrete foundation of onshore wind turbine (“Wind Farm | Riley Group” n.d.)
Turbines have to sit in a steel reinforced concrete foundation like Figure 14. Depending on the
size of the turbine dimensions, the foundation size should be obtained. The foundation is
important for withstanding strong wind conditions. The foundation is generally underground
when construction is completed, there is no chance to see this.
Figure 15: The offshore wind energy development considering to deepness (Aydin 2007)

Wind Turbine Tower Structure Analysis According to Wind Load in Terms of Cost 23
“EMSHIP” Erasmus Mundus Master Course, period of study September 2014 – February 2016
Figure 15 shows the foundation for offshore wind turbines. According to deepness, subsea
foundation types change. Some foundation technologies were given in Figure 16. As it was
mentioned before, according to deepness, subsea foundation goes to change.
Figure 16: Shallow and deep-water foundation technologies (Aydin 2007)
1.3.1.2. Tower
The mission of the tower is to carry the rotor and nacelle’s mass. One ideal design of the tower
can transfer loads, which come from wind and rotor to the foundation in order to avoid an
accident. The cost of wind turbine tower is around 30-33% of the total investment. In order to
avoid the big cost of the tower, minimization of the mass of the tower is very critical work for
the last two decades. Nowadays, tubular conical towers are used in the production of modern
wind turbines, so very well shape towers can be produced using this method. Tubular conical
parts are manufactured in 20-30 meters long welded cans and they are bolted with each other
on the site.

P 24 Selcuk SAHIN
Master Thesis developed at West Pomeranian University of Technology, Szczecin, Poland and The Lloyd’s
Register Foundation Research Centre of Excellence, Pusan, Republic of Korea
Steel tubular conical towers may be manufactured as the tapered steel or concrete. According
to production condition, steel tower could be pressed or welded together in each can. This
process could be done in a plant or on site. One of the important topics is transportation.
Generally, the allowance diameter of tower is 4.4m for transportation. So, some special
permissions are required in order to carry towers. Sometimes, using specific methods of
assembly in the field can solve transportation problems.
1.3.1.3. Nacelle
According to AWEA, the nacelle is a cover housing that houses all of the generating
components in a wind turbine, including the generator, gearbox, drive train and brake assembly.
The nacelle of a wind turbine is the box-like component that sits atop the tower and is connected
to the rotor. The nacelle contains the majority of the approximately 8000 components of the
wind turbine. The nacelle housing is made of fiberglass and protects the internal components
from the environment. The nacelle cover is fastened to the main frame, which also supports all
the other components inside the nacelle. The main frames are large metal structures that must
be able to withstand large fatigue loads. One general view of nacelle can be observed in Figure
17.
Figure 17: View of nacelle (“The Inside of a Wind Turbine | Department of Energy” n.d.)

Wind Turbine Tower Structure Analysis According to Wind Load in Terms of Cost 25
“EMSHIP” Erasmus Mundus Master Course, period of study September 2014 – February 2016
1.3.1.4. Rotor
The rotor consist of blades and a hub. Generally, 3 blade systems are most popular. However,
there are a few examples of 2 blades systems. Blades are produced by fiberglass and carbon
fiber. On the other hand, there can be many kinds of hub type. Such as rigid and joint.
1.3.1.5. Electric System Room
Under the wind turbine, there is a room that is called the electric system room. This room is for
some kind of electricity activities. Generally, inside the room, one can see many cables,
transformers, converters and power factor correction capacitors.
1.4. Types of Wind Turbine Towers
Nowadays, wind turbine towers can be produced in many types and made of many materials.
As a material, towers are made of concrete or constructional steel. In generally, towers can be
divided into four categories, lattice towers, cylindrical towers, concrete towers and hybrid
towers which are made from both concrete and metal.
1.4.1. Lattice Towers
As it can be seen in Figure 18, lattice tower consists from many pieces of metal stick. The
connection between these metal parts is made by bolts. One of the positive aspects of this
structure is it is easily accessible. This kind of small parts can be found in all metal producer.
Also, according to the shape of the tower, the wind load effect is lower than other structure
types. However, this kind of structure cannot carry very heavy nacelles and the main cost is
higher than other tower types.

P 26 Selcuk SAHIN
Master Thesis developed at West Pomeranian University of Technology, Szczecin, Poland and The Lloyd’s
Register Foundation Research Centre of Excellence, Pusan, Republic of Korea
Figure 18: Lattice tower sample (“Everything You Need to Know About Small Wind Turbines” n.d.)
1.4.2. Steel Cylindrical Towers
Nowadays, in the wind energy sector, the most chosen type of wind turbine tower is the steel
cylindrical tower. Considering to other towers, these kinds of towers are quite lighter than the
others. These are not only lighter but also economic. Actually, the main reason to choose this
type of tower is the strength of the structure. Compared with other tower types, cylindrical
towers are much stronger.
Generally, these towers’ main sections are connected to each other with bolts. But before
connection, in order to produce the cylindrical part, bended flap metal must be welded from
their vertical welding line. Generally each can is chosen around 2-3 meters. Then these 2-3
meters part are welded horizontally. A sample of a cylindrical tower and flange connections
can be seen in Figure 19.
Figure 19: a) Steel cylindrical tower b) Flange connection (Kanbur 2014)

Wind Turbine Tower Structure Analysis According to Wind Load in Terms of Cost 27
“EMSHIP” Erasmus Mundus Master Course, period of study September 2014 – February 2016
As it mentioned above, the main sections must be connected to each other with flanges and
bolts. Before real connection, one technician must apply the pre-stressing process for all bolts
in each section. This activity can be seen in following Figure 20,
Figure 20: Pre-Stressing process (Kanbur 2014)
In generally from bottom to top, the diameter of each can gets smaller. Also, the thickness of
each can changes according to loads. As mentioned above, steel cylindrical towers are more
economical than others. Due to its structural shape, the tower has fewer bolts connections
compared with lattice towers, it means that less number of pre-stressing and stressing time.
Additionally, cylindrical towers need less maintenance than other types. In safety aspects,
cylindrical towers provide more safety climbing space for technicians. The esthetic view is also
one positive way for this kind of towers.
As it can be seen in Figure 21, one of the very important issues is transportation. The diameter
of sections must be sized according to country regulations. Or else, it causes a big traffic
problem. For offshore wind turbines, all production must be managed by the company that is
responsible for transportation in a seaway. Day by day, the energy requirement is being
increased. The result of this increment towers become higher and larger. So, the problem of
transportation becomes a more important issue than in past. One of the solutions is to, divide
sections to more small pieces. Nevertheless, dividing by small pieces makes more cost for
companies.

P 28 Selcuk SAHIN
Master Thesis developed at West Pomeranian University of Technology, Szczecin, Poland and The Lloyd’s
Register Foundation Research Centre of Excellence, Pusan, Republic of Korea
Figure 21: Tower and blades transportation for offshore wind turbines (“Heavy Lift Vessel ‘Atlantic’
Delivered to Her Owners - CONOSHIP” n.d.)
1.4.3. Concrete Towers
Compared with steel towers, concrete towers are not as popular as steel structures. On the other
hand, according to energy requirements, the height of tower and rotor diameter are going to
increase a lot. The result of this increment, in order to reach more safety structures, investors
turn to concrete structures. Especially, dynamic analyzes results of concrete structures are quite
impressive.
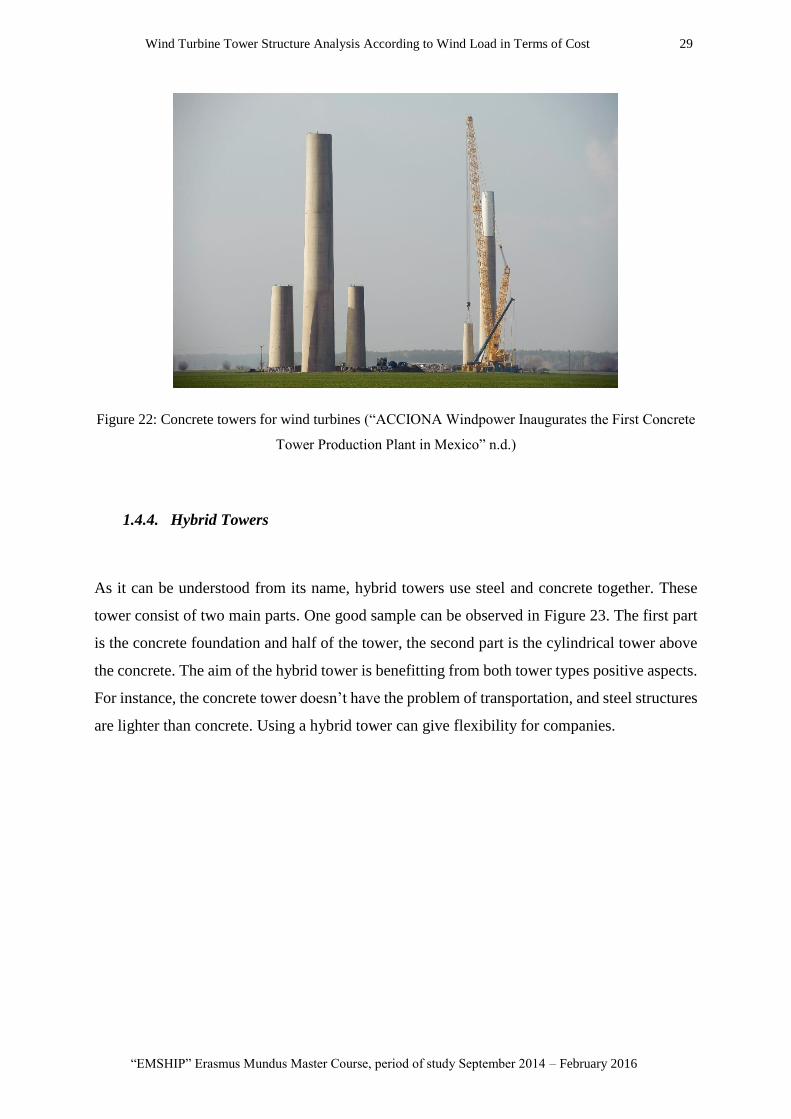
Generally, concrete towers are assembled in the field, as it can be seen in following Figure 22.
Additionally, concrete is used in construction sector a lot, so there is no provider problem. For
wind towers, a pre-stressing concrete method is used by companies. As a result of this method,
a number of crack on the concrete get decrease. Less crack mean is long life in terms of fatigue.
One another good aspect of concrete is local torsions or bending. During assembly, steel
structures must be checked very carefully for local torsions or bending.
Wind Turbine Tower Structure Analysis According to Wind Load in Terms of Cost 29
“EMSHIP” Erasmus Mundus Master Course, period of study September 2014 – February 2016
Figure 22: Concrete towers for wind turbines (“ACCIONA Windpower Inaugurates the First Concrete
Tower Production Plant in Mexico” n.d.)
1.4.4. Hybrid Towers
As it can be understood from its name, hybrid towers use steel and concrete together. These
tower consist of two main parts. One good sample can be observed in Figure 23. The first part
is the concrete foundation and half of the tower, the second part is the cylindrical tower above
the concrete. The aim of the hybrid tower is benefitting from both tower types positive aspects.
For instance, the concrete tower doesn’t have the problem of transportation, and steel structures
are lighter than concrete. Using a hybrid tower can give flexibility for companies.

P 30 Selcuk SAHIN
Master Thesis developed at West Pomeranian University of Technology, Szczecin, Poland and The Lloyd’s
Register Foundation Research Centre of Excellence, Pusan, Republic of Korea
Figure 23: Assembly process for hybrid tower (“Prefabricated DYWIDAG Tendons Secure Innovative
ATS Hybrid Wind Tower - DYWIDAG-Systems International” n.d.)
Compared with a fully concrete tower, during the assembly of the hybrid towers, the less strong
crane is necessary. It means an easy assembly process and less cost than the fully concrete
tower. Furthermore, the top of the hybrid tower is steel, therefore, it’s less heavy than fully
concrete. This is a positive thing in earthquake conditions.
1.5. Standards
According to (GWEC 2012), wind turbine production is increasing drastically. As a result of
this increase, production must be taken under control due to production quality, safety and
environmental effects. Therefore, wind turbine producers must follow some standards in order
to avoid negative consequences/side effects.
Wind Turbine Tower Structure Analysis According to Wind Load in Terms of Cost 31
“EMSHIP” Erasmus Mundus Master Course, period of study September 2014 – February 2016
As a result of industrial development, countries/regions have their own standards. Thus,
countries can provide better service quality to their citizens. European Standards, American
Standards, Japanese Standards might be given as an example. If one wants to control all these
standards, one will see they have quite similar approaches. Countries have some different
conditions due to climate and production methods, therefore some part of the standard can show
some difference according to country.
In this thesis European Standards are going to be used. It means all design calculation, safety
numbers, empirical data will be taken from European Standards (Eurocodes EC). European
Standards was chosen because:
This study (thesis) was developed in Europe.
Europe is one of the big innovation centers in wind energy.
Thesis advisors were using European Norms.
Widely accepted in many different countries.
A turbine tower is a steel construction. Therefore during the design process “Eurocode 3:
Design of Steel Structures” was used. All structure is designed according to EC3. Details of the
calculation can be seen analytical part of the thesis. But basically, design values of geometrical
data must be convenient for (CEN (European Commitee for Standardization) 2005a).
According to (CEN (European Commitee for Standardization) 2007b):
1. The thickness of the shell should be taken as defined in the relevant application standard.
If no application standard is relevant, the nominal thickness of the wall, reduced by the
prescribed value of corrosion loss, should be used.
2. The thickness ranges range within which the rules of this Standard may be applied are
defined in the relevant EN1993 application parts.
3. The middle surface of the shell should be taken as the reference surface for loads.
4. The radius r of the shell should be taken as the nominal radius of the middle surface of
the shell, measured normal to the axis revolution.
5. The buckling design rules of this Standard should not be applied outside the ranges of
the r/t ratio set out in section 8 or Annex D or in the relevant EC3 application parts.
(CEN (European Commitee for Standardization) 2007b)

P 32 Selcuk SAHIN
Master Thesis developed at West Pomeranian University of Technology, Szczecin, Poland and The Lloyd’s
Register Foundation Research Centre of Excellence, Pusan, Republic of Korea
1.6. Gap
The tower of the wind turbine is a topic that has been worked for many years. In scientific and
experimental literature, there are many different approaches, proposals and suggestions, some
of the tower have been already developed in final thesis such as (Kanbur 2014; Travanty 2001;
Verma 2011). Furthermore some studies have already been conducted on the subject by
universities and companies. All these sample works can be seen in chapter 8.
However, there are not many published paper focusing on the design of wind turbine tower
based specifically on standards. As it was mentioned in previous chapters, standard is the one
of the most important criteria. Without standards, turbine cannot be accepted by government
for installation. Therefore, all calculations in this report made by standards which will be
described in relevant sections throughout the thesis. Another goal of the thesis is to illustrate
producers how one steel wind turbine tower can be designed according to standard rules; thus
prevent companies from losing money, because of the fact that unsuccessful model that cannot
fulfil standard criteria.
Furthermore, there is not many paper about wind turbine door opening. An experimental
structural analyses can be seen in (Dimopoulos and Gantes 2012). However even this work,
there is nothing about door shape idealization. Chapter 5 will show how to deal with door
opening of the tower.
1.7. Objectives
This thesis is aiming to give ideas how to design a wind turbine tower in structural aspects and
how to find ideal door opening of turbine tower by using ANSYS based on European Standards.
The study is supervised by Prof. Taczala from West Pomeranian University of Technology,
Prof. Philippe Rigo from University of Liege and Prof. J.K. Paik from KOSORI, and will be
published in a paper which is called “Ultimate Strength of Cylindrical Towers with Opening in
Wind Turbine Structures”, where tower door opening is idealized and analyzed.

Wind Turbine Tower Structure Analysis According to Wind Load in Terms of Cost 33
“EMSHIP” Erasmus Mundus Master Course, period of study September 2014 – February 2016
Within the framework of the thesis, one site-specific wind turbine tower was designed and an
optimal door opening type was found which are the main objectives of the work. As it was
mentioned before, all calculations were done according to standards. Furthermore, around one
hundred types of door openings were investigated, useful data were collected and sorted. These
door types were analyzed by using ANSYS and ideal result was found. Another objective is to
provide a sort of guideline for tower producers illustrating how to use standards and how to
design a tower that satisfies standards. Last goal is to show people importance of a door opening
for wind tower design and how they can idealize their design.
1.8. Structure of the Work
When the thesis was being developed, the flowchart given below was followed. The chart was
generated by thesis supervisor at the beginning of the internship.
Figure 24: Flowchart of final thesis

P 34 Selcuk SAHIN
Master Thesis developed at West Pomeranian University of Technology, Szczecin, Poland and The Lloyd’s
Register Foundation Research Centre of Excellence, Pusan, Republic of Korea
2. STATE OF THE ART
Wind turbines have been developed since over than 100 years ago. As a result of this
development, nowadays it is becoming one of the biggest energy sources. Therefore, recently
many researches have been published regarding the subject.
First of all, there are many projects developed and applied that we can see on the web. All these
data were sorted and based on the gathered data, most common tower type was selected.
Experimental data showing the loads applying on the structure were taken from the advisor of
the thesis and convenient shape and flange size were decided. For material of the tower,
(Standard 2004) were the source of the thesis. During all this time, sample thesis and guidelines
were followed such as (Det Norske Veritas 2011; Kanbur 2014; Karimirad 2014; Verma 2011)
When preliminary design of the model of tower was completed, analytical calculations were
started to be done using (CEN (European Commitee for Standardization) 2005a). For buckling
calculations, (CEN (European Commitee for Standardization) 2007a, 2007b) was used. All
buckling detail about the shell were given in the standards. Then fatigue calculations were done
using (CEN (European Commitee for Standardization) 2005b). During the dynamic
calculations (Kanbur 2014; Lanier and Way 2005) were followed. As it was underlined before,
standards were critical for the thesis, as you can see above during the calculations standards
were used for entire calculations.
Door opening of the tower is one of the crucial part of the report. When opening was being
developed, it was seen that there are not many published works on the subject. Therefore, during
the analyses stage, opening on the shell structures were studied in general. In order to evaluate
the validity of the FEM results of the tower, (Husson 2008) was used. It gives ideas about
designing FEM model. FEM model was developed in ANSYS. ANSYS was selected as
structural analyses program due to the fact that it is one of the most widely used software and
several guidelines and tutorials are present.
Cost estimation was made using (Lanier and Way 2005; Verma 2011). However, cost
estimations were done relatively roughly since data related with the calculations are confidential
and are not shared by the companies. As a suggestion for future works, it is fair to say that cost
estimation part of the work may be improved in many aspects.

Wind Turbine Tower Structure Analysis According to Wind Load in Terms of Cost 35
“EMSHIP” Erasmus Mundus Master Course, period of study September 2014 – February 2016
3. TURBINE TOWER SELECTION
According to information that was given above; in this report cylindrical steel tower will be
examined. This model was chosen because the cylindrical model is the most chosen type of
tower by wind energy industry. Also, considering to wind load, very similar model can be used
for offshore and onshore conditions. Some similar towers can be seen in Italy and Belgium.
During the thesis probabilistic method was followed. Before start to this research, 495 wind
towers data was brought from all over the world by internet. These data was separated according
to tower height and divided by 8 groups in each 20 meters interval. After examination of these
values, the biggest group is 60-80 meters height group with 37% of total tower number as it can
be seen in Figure 25. Therefore model was chosen in that interval. Producer can see most
common used tower model according to the data that is collected in the thesis. Based on the
suggestions of the thesis advisor, 65 meters model was selected to be the ideal length for further
work.
Figure 25: Tower length distribution
The tower is a cylindrical tower which consists of 3 sections that are bolted together through
internal flange-bolt connections. In addition to that, the tower is connected to the base by bolts
0%
7%
15%
37%
28%
6%
6%
1%
Tower Length Distribution
Tower 0-20m
Tower 20-40m
Tower 40-60m
Tower 60-80m
Tower 80-100m
Tower 100-120m
Tower 120-140m
Tower 140-160m
P 36 Selcuk SAHIN
Master Thesis developed at West Pomeranian University of Technology, Szczecin, Poland and The Lloyd’s
Register Foundation Research Centre of Excellence, Pusan, Republic of Korea
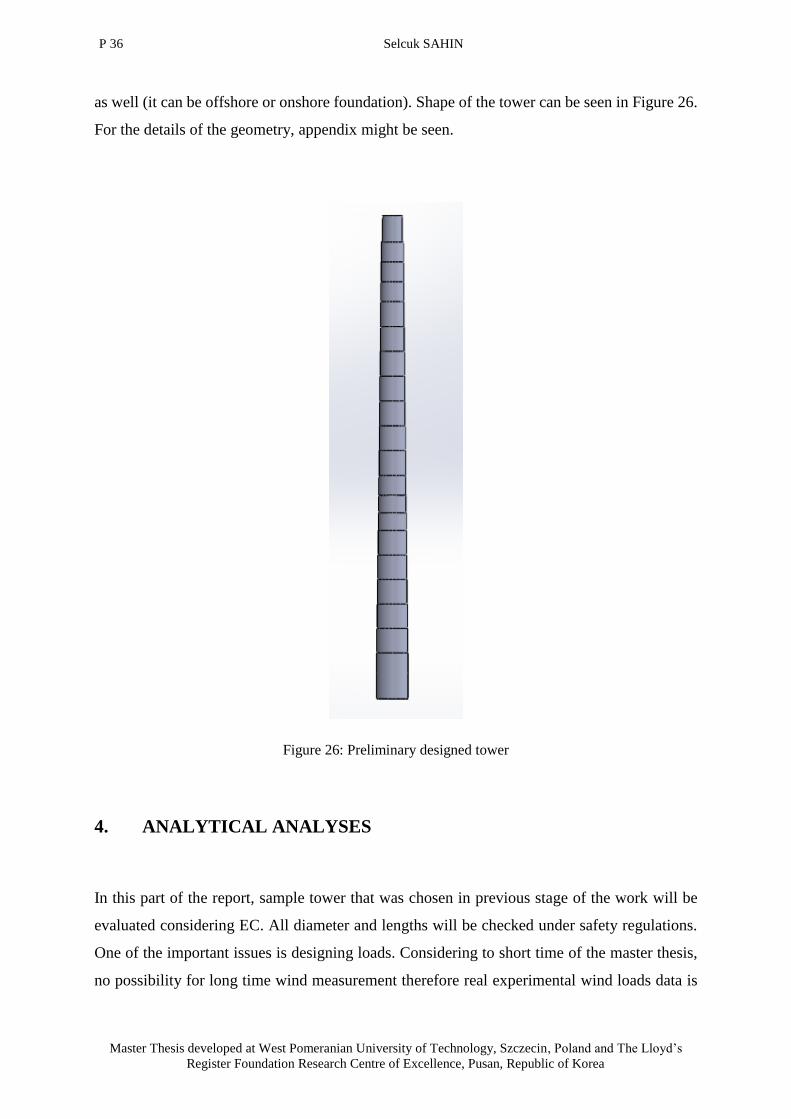
as well (it can be offshore or onshore foundation). Shape of the tower can be seen in Figure 26.
For the details of the geometry, appendix might be seen.
Figure 26: Preliminary designed tower
4. ANALYTICAL ANALYSES
In this part of the report, sample tower that was chosen in previous stage of the work will be
evaluated considering EC. All diameter and lengths will be checked under safety regulations.
One of the important issues is designing loads. Considering to short time of the master thesis,
no possibility for long time wind measurement therefore real experimental wind loads data is
Wind Turbine Tower Structure Analysis According to Wind Load in Terms of Cost 37
“EMSHIP” Erasmus Mundus Master Course, period of study September 2014 – February 2016
provided by the advisor. In order to figure out wind load engineering, one brief explanation
could be read in the following part of the report.
4.1. Wind Load Design
In this part of the thesis loads on the tower will be assessed.
4.1.1. Basic Wind Load Design
According to (Shakya n.d.), theoretically wind load on the tower might be calculated by
following formulas:
𝑞𝑧 = 0.613 ∗ 𝐾𝑧 ∗ 𝐾𝑧𝑡 ∗ 𝐾𝑑 ∗ 𝐼 ∗ 𝑉2 (1)
𝐹 = 𝑞𝑧 ∗ 𝐺 ∗ 𝐶𝑓 ∗ 𝐴𝑓 (2)
qz : velocity pressure
Kz : velocity pressure expose coefficient depends on height
Kd : wind directional factor
I : importance factor
V : wind based speed
F : velocity pressure
G : gust effect factor
Cf : force coefficient factor
Af : projected area normal to wind

P 38 Selcuk SAHIN
Master Thesis developed at West Pomeranian University of Technology, Szczecin, Poland and The Lloyd’s
Register Foundation Research Centre of Excellence, Pusan, Republic of Korea
4.1.2. Experimental Wind Load Design
In addition to the designed wind load, it can be developed by experiment. In this thesis,
experimental load variables were used. As a result of this, it can be said that obtained results
are close to reality. However, it is not always possible due to the fact that specific cases are not
eligible with ease.
In general, the load input consists of two methods that are currently used popularly. These are
sensor load method and the top load method. Basically, the top load method is generated from
extrapolation of the top loads throughout the tower. In order to increase estimation accuracy in
the loads at desired level, curve shape factor is also given. The sensor method uses rain flow
spectra and precise load values that are measured by sensor throughout the tower. Then using
with interpolation, loads values are in the desired level can be found as it can be seen in Figure
27. Linear interpolation is enough to reach exact load.
The calculation methods described in this research, design loads for fatigue and extreme loads
are given in different levels throughout the tower considering to sensors. It is basically each 10-
15 meters. Circumferential welds are very important for strength calculations, therefore, loads
that must be calculated in each 2-3 meters. As it was mentioned in the previous passage, loads
in each 2-3 meters can be found by interpolation. On the other hand, fatigue calculations are
based on rain flow spectra. As it is known from previous experiences, interpolations are
essential for fatigue calculations.
Nevertheless, one of the biggest problems of interpolation is accuracy. Results that come from
linear interpolation should be compared with interpolation that includes the effect of curvature
which bases on bending moment curve in along the tower. However, it is not possible to use of
spectra for the fatigue calculation in a short time, equivalent fatigue moment curve will be used
for this check. Additionally, in order to calculate fatigue load through the tower, equivalent
fatigue bending moment assumption must be accepted. Considering to the assumption,
equivalent fatigue bending moment is for Wohler exponent m=4 and n=107.

Wind Turbine Tower Structure Analysis According to Wind Load in Terms of Cost 39
“EMSHIP” Erasmus Mundus Master Course, period of study September 2014 – February 2016
Figure 27: Basic theory of sensor loads and interpolated loads relation
Loads assumptions are must be valid for the specified temperature range in IEC 61400-1. Also,
dead weights must be taken into account in accordance with standard DIN 1055 “Design Loads
for Buildings”.
Table 2: Extreme load sensor data
Sensor
Height
Design
Bending
Moment
Partial
Coefficient
Design
Torsion
Design
Shear
Force
Design Normal
Force Tower
Top
Wind
Speed
- Mresd γf Mzd Fresp,d Fzc V
[m] [kNm] [-] [kNm] [kN] [kN] [m/s]
0 57898 1.35 -1.069 -98 -1284.6 56.5
0.2 57702 1.35 -1.069 -98 -1284.6 56.5
7.4 50667 1.35 -1.069 -98 -1284.7 56.5
12.6 45684 1.35 -1.069 -98 -1283.5 56.6
18.3 40242 1.35 -1.069 -98 -1284.2 56.6
28.8 30562 1.35 -1.069 -98 -1282.1 56.6
33 26818 1.35 -1.069 -98 -1240.8 57.5
41.7 19392 1.35 -1.069 -98 -1470.4 13.8
50.2 13008 1.35 -1.069 -98 -1480.8 13.7
55.4 9418 1.35 -1.069 -98 -1487.7 13.7
63 5539 1.35 -1.015 -44 -1442.6 23.4
P 40 Selcuk SAHIN
Master Thesis developed at West Pomeranian University of Technology, Szczecin, Poland and The Lloyd’s
Register Foundation Research Centre of Excellence, Pusan, Republic of Korea
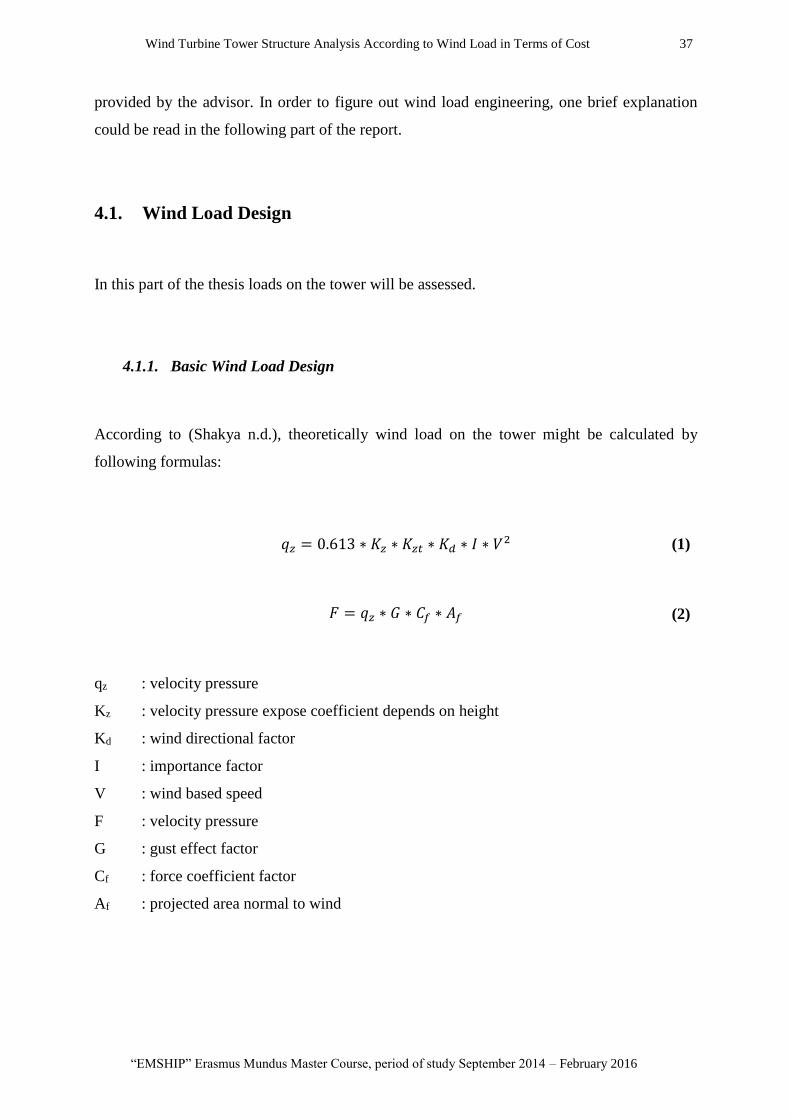
Table 2 shows values that are taken from sensors. As it can be seen in Table 2, 11 sensors were
used for calculation. According to sensors, maximum design bending moment, maximum
design torsion, maximum design shear force, maximum normal force and wind speed can be
generated from wind speed. Using these designed bending moments in each sensor, all designed
bending moment in tower could be found by linear interpolation simulate like Figure 28,
Figure 28: Calculation methodology for linear interpolation (“Excel Interpolation Formulas - Peltier
Tech Blog” n.d.)
Interpolation equality:
𝑋 − 𝑋1𝑋2 − 𝑋1
=(𝑌 − 𝑌1)
(𝑌2 − 𝑌1)
(3)
By changing of variables in the equality, above equation becomes:
𝑌 = 𝑌1 + (𝑋 − 𝑋1) ∗
(𝑌2 − 𝑌1)
(𝑋2 − 𝑋1)
(4)
In order to see the loads in 38 different levels along the tower, Figure 29 might be evaluated.
38 levels were chosen for interpolation, because of the fact that 38 different cans were planned
to be produced.

Wind Turbine Tower Structure Analysis According to Wind Load in Terms of Cost 41
“EMSHIP” Erasmus Mundus Master Course, period of study September 2014 – February 2016
Figure 29: Resulting extreme bending moments along the tower
Sensors help also the estimation of fatigue equivalent bending moments. 11 fatigue bending
moments for each sensor can be seen in Table 3,
Table 3: Fatigue load sensor data
Sensor
No
Sensor
Height
Experimental Fatigue
Equivalent Moment
Equivalent
Cycles
- -
[#] [m] [kNm] [#]
1 0 12329 1.00E+07
2 0.2 12281 1.00E+07
3 7.4 10601 1.00E+07
4 12.6 9424 1.00E+07
5 18.3 8181 1.00E+07
6 28.8 6225 1.00E+07
7 33 5536 1.00E+07
8 41.7 4239 1.00E+07
9 50.2 3200 1.00E+07
10 55.4 2886 1.00E+07
11 63 3024 1.00E+07
𝑛𝑒𝑞 ∆𝑀𝑥′𝑦.𝑒𝑞

P 42 Selcuk SAHIN
Master Thesis developed at West Pomeranian University of Technology, Szczecin, Poland and The Lloyd’s
Register Foundation Research Centre of Excellence, Pusan, Republic of Korea
After using same linear interpolation which is applied in extreme conditions following Figure
30 can be reached.
Figure 30: Fatigue bending moments along the tower
4.2. Partial Safety Factors
In order to be economical, instead of only one safety factor, different partial safety factors are
applied for each load condition. Safety factor values change from 1.1 to 1.35 depending on the
load case.
Like all the industrial sectors, there are many imperfections of production in the wind tower.
The producer must make a balance between economic and safety. If best fabrication quality is
chosen, the cost of production will increase drastically in contrast to, if worst fabrication quality
is chosen, life and quality of tower can decrease. So this is a very important point for tower
designer and producer. According to EU regulation of fabrication tolerance quality class, “Class
B” was chosen in this thesis. All details about “Class B” can be seen in Table 4.

Wind Turbine Tower Structure Analysis According to Wind Load in Terms of Cost 43
“EMSHIP” Erasmus Mundus Master Course, period of study September 2014 – February 2016
Table 4: Fabrication tolerance quality classes
Fabrication Tolerance Quality Class Description Q
Class A Excellent 40
Class B High 25
Class C Normal 16
Table 5: Partial safety coefficients for extreme conditions according to (CEN (European Commitee for
Standardization) 2005a) and (CEN (European Commitee for Standardization) 2007b)
Extreme Conditions
Name Symbol Value Unit
Fabrication Tolerance Quality Cl. Q 25 -
Fabrication Tolerance Quality Cl. a0 0.65 -
Fabrication Tolerance Quality Cl. aτ 0.65 -
Buckling γm 1.2 -
Yielding (sheets & flanges) γm 1.1 -
Yielding (bolts) γmb,y 1.1 -
Tensile strength (bolts) γmb,u 1.25 -
Rolled thread - yield str. γm,yr 1 -
Rolled thread - tensile str. γm,tr 0.9 -
Gravity Load - unfavorable γf,gu 1.1 -
Gravity Load - favorable γf,gf 0.9 -
Table 5 shows partial safeties that were chosen according to EC. During calculation, not only
extreme situations but also fatigue must be considered. In order to see fatigue safety numbers,
following Table 6 could be observed.
𝛼𝜏

P 44 Selcuk SAHIN
Master Thesis developed at West Pomeranian University of Technology, Szczecin, Poland and The Lloyd’s
Register Foundation Research Centre of Excellence, Pusan, Republic of Korea
Table 6: Partial safety coefficients for fatigue conditions according to (CEN (European Commitee for
Standardization) 2005b)
Fatigue
Name Symbol Value Unit
Load γf 1 -
Material (sheets) γmf 1.265 -
Material (bolts) γmf 1.265 -
Calibration factor Ct 1 -
Air density ρair 1.225 kg/m3
Water density ρwater 1025 kg/m3
4.3. Tower and Shell Analyses
Materials of wind tower shell must provide some properties. This material property can be seen
in EC3-1-6. According to EU standards,
1. The material properties of steel should be obtained from the relevant application
standard.
2. Where materials with nonlinear stress-strain curves are involved and a buckling analysis
is carried out under stress design, the initial tangent value of Young’s modulus E should
be replaced by a reduced value. If no better method is available, the secant modulus at
the 0.2% proof stress should be used when assessing the elastic critical load or elastic
critical stress.
3. In the global numerical analysis using material nonlinearity, the 0.2% proof stress
should be used to represent the yield stress fx in all relevant expressions. The stress-
strain curve should be obtained from EC3-1-5 Annex C for carbon steels and EC3-1-4
Annex C for stainless steels. (CEN (European Commitee for Standardization) 2007b)
In order to figure out yield and strength behavior of materials, stress-strain relations must be
known. Relation could be observed in Figure 31,

Wind Turbine Tower Structure Analysis According to Wind Load in Terms of Cost 45
“EMSHIP” Erasmus Mundus Master Course, period of study September 2014 – February 2016
Figure 31: Stress-Strain relation (“Stress Strain Diagram For Ductile And Brittle Materials -
Transtutors” n.d.)
Before start to analytical analyzes, materials that are chosen for tower must be mentioned. 65-
meter wind turbine shell material yield details can be seen in below for EN and ASTM,
Table 7: Tower shell material quality according to standards in normal temperature (minimum
operational temperature is -20°C and minimum stand-still temperature of -30°C)
Tower Shell
Material Quality According to EN S355J0 EN 100205
Material Quality According to ASTM S355K2 EN 100025, ASTM A709
As it can be seen in Table 7 and Table 8, according to conditions and temperatures, different
material limits have to be considered. Materials were chosen due to advisor suggestions and
other towers samples.
P 46 Selcuk SAHIN
Master Thesis developed at West Pomeranian University of Technology, Szczecin, Poland and The Lloyd’s
Register Foundation Research Centre of Excellence, Pusan, Republic of Korea
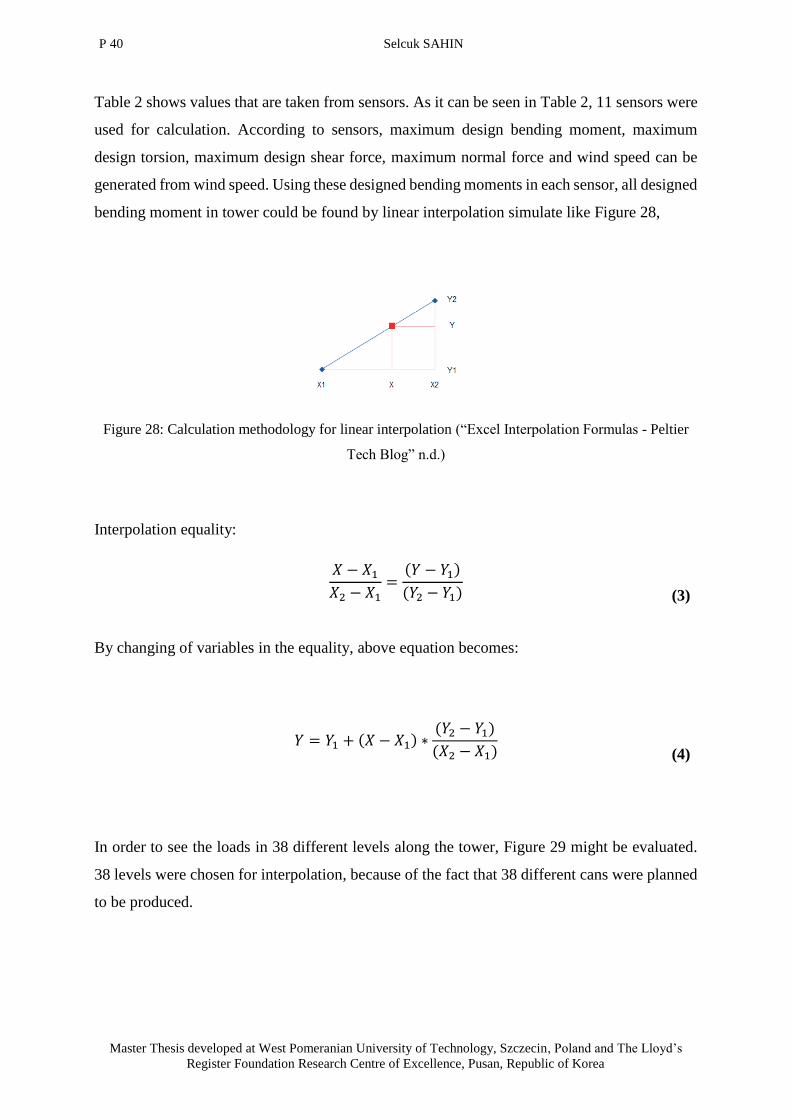
Table 8: Tower shell material quality according to standards in operational temperature (minimum
operational temperature is -30°C and minimum stand-still temperature of -40°C)
Tower Shell
Material Quality
According to EN
for shell thickness t<=25mm
S355J0 EN 100205
for shell thickness t>25mm
S355J2 EN 100205
Material Quality
According to ASTM
S355K2 EN 10025, ASTM A709
4.3.1. Yield Data
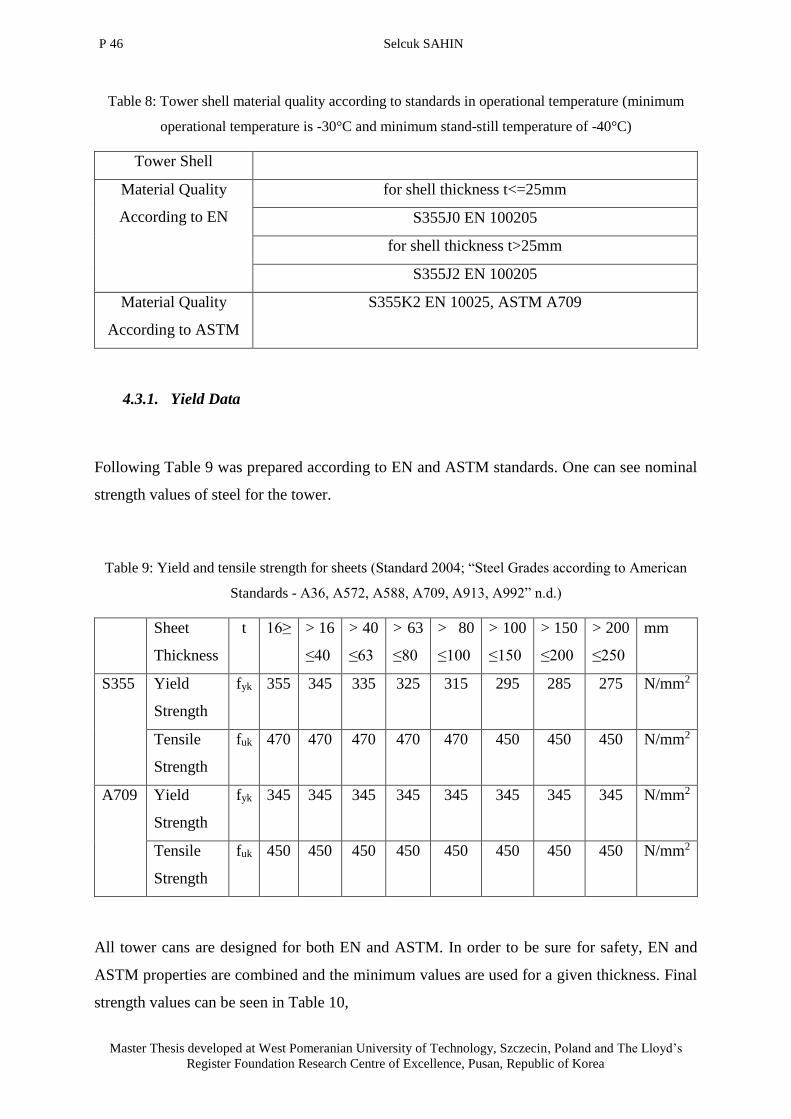
Following Table 9 was prepared according to EN and ASTM standards. One can see nominal
strength values of steel for the tower.
Table 9: Yield and tensile strength for sheets (Standard 2004; “Steel Grades according to American
Standards - A36, A572, A588, A709, A913, A992” n.d.)
Sheet
Thickness
t 16≥ > 16
≤40
> 40
≤63
> 63
≤80
> 80
≤100
> 100
≤150
> 150
≤200
> 200
≤250
mm
S355 Yield
Strength
fyk 355 345 335 325 315 295 285 275 N/mm2
Tensile
Strength
fuk 470 470 470 470 470 450 450 450 N/mm2
A709 Yield
Strength
fyk 345 345 345 345 345 345 345 345 N/mm2
Tensile
Strength
fuk 450 450 450 450 450 450 450 450 N/mm2
All tower cans are designed for both EN and ASTM. In order to be sure for safety, EN and
ASTM properties are combined and the minimum values are used for a given thickness. Final
strength values can be seen in Table 10,

Wind Turbine Tower Structure Analysis According to Wind Load in Terms of Cost 47
“EMSHIP” Erasmus Mundus Master Course, period of study September 2014 – February 2016
Table 10: Minumum yield and tensile strength for sheets (Standard 2004; “Steel Grades according to
American Standards - A36, A572, A588, A709, A913, A992” n.d.)
Sheet
thickness
t 16≥ > 16
≤40
> 40
≤63
> 63
≤80
> 80
≤100
> 100
≤150
> 150
≤200
> 200
≤250
mm
Yield
Strength
fyk 345 345 335 325 315 295 285 275 N/mm2
Tensile
Strength
fuk 450 450 450 450 450 450 450 450 N/mm2
4.3.2. Buckling Strength
In this part of the report, buckling will be criticized. All calculations will be done according to
EC3-1-6. Formulation and assumptions will be explained. Firstly, basic geometrical
calculations will be done then stress calculations will be conducted. Same steps will be repeated
for each can of the tower. A sample of can might be seen in Figure 32 and Figure 33,
Figure 32: Can sample for tower

P 48 Selcuk SAHIN
Master Thesis developed at West Pomeranian University of Technology, Szczecin, Poland and The Lloyd’s
Register Foundation Research Centre of Excellence, Pusan, Republic of Korea
Figure 33: Top view for tower can
Calculation of cross-sectional area:
𝐴 = 𝜋 ∗ ((𝑟𝑚𝑖 + 𝑡)2 − (𝑟𝑚𝑖 − 𝑡)2) (5)
𝑟𝑚𝑖 =𝐷𝑚𝑖
2 (6)
A : cross-sectional area
rmi : mean radius
Dmi : mean diameter
t : thickness
Figure 34: Hollow cylindirical cross section

Wind Turbine Tower Structure Analysis According to Wind Load in Terms of Cost 49
“EMSHIP” Erasmus Mundus Master Course, period of study September 2014 – February 2016
As it can be seen in Figure 34, moment of inertia for hollow cylindrical cross section can be
calculated by the following formula:
𝐼 =𝜋 ∗ ((𝑟𝑚𝑖 + 𝑡)4 − (𝑟𝑚𝑖 − 𝑡)4)
4 (7)
Throughout the tower boundary condition for each can may change. Boundary condition is
relevant the connection type of can. Table 11 shows different boundary conditions that will be
used in this report,
Table 11: Boundary conditions for shells (CEN (European Commitee for Standardization) 2007b)
Boundary
Condition
Code
Simple
Term
Description Normal
Displacement
Vertical
Displacement
Meridional
Rotation
BC1r Clamped radially restrained
meridionally restrained
rotation restrained
w=0 u=0 βΦ=0
BC1f radially restrained
meridionally restrained
rotation free
w=0 u=0 βΦ≠0
BC2r radially restrained
meridionally free rotation
restrained
w=0 u≠0 βΦ=0
BC2f Pinned radially restrained
meridionally free rotation
free
w=0 u≠0 βΦ≠0
BC3 Free edge radially free meridionally
free rotation free
w≠0 u≠0 βΦ≠0
Buckling will be evaluated under calculated loads in terms of sensor data, meridional buckling
stress, hoop buckling stress and shear buckling stress. In order to figure out directions of stress,
Figure 35 may be observed.

P 50 Selcuk SAHIN
Master Thesis developed at West Pomeranian University of Technology, Szczecin, Poland and The Lloyd’s
Register Foundation Research Centre of Excellence, Pusan, Republic of Korea
Figure 35: Symbols in shells of revolution (CEN (European Commitee for Standardization) 2007b)
4.3.2.1. Buckling Calculation Stress Data
Calculation of buckling stresses will be divided into four parts, these are direct, bending, shear
torsion, shear force stress. Basic stress calculations will be used in following parts of the thesis.
In order to understand, fundamental of this calculation the following Figure 36 can give an idea.
Figure 36: Five different stresses can be seen on tower (“SPECIFIC ACTION OF STRESSES -
14014_74” n.d.)
In order to imagine direct stress on the shell, Figure 37 can give an idea,

Wind Turbine Tower Structure Analysis According to Wind Load in Terms of Cost 51
“EMSHIP” Erasmus Mundus Master Course, period of study September 2014 – February 2016
Figure 37: Direct stress (“Force and Strength” n.d.)
Formula of direct stress:
𝜎𝑛 =𝐹𝑧𝑑𝐴
(8)
σn : direct stress
Fzd : designed normal force
A : cross-sectional area
Normal design force is obtained from interpolation of sensor loads. At the end of the
calculation, 38 different stress data were obtained for each cross section.
Similar to direct stress, basic bending moment formula is applicable. Bending stress formula is:
𝜎𝑏 =𝑀𝑟𝑒𝑠𝑑
𝐼∗ (𝑟𝑚𝑖 + 𝑡) (9)
σb : bending stress
Mresd : designed bending moment
I : inertia

P 52 Selcuk SAHIN
Master Thesis developed at West Pomeranian University of Technology, Szczecin, Poland and The Lloyd’s
Register Foundation Research Centre of Excellence, Pusan, Republic of Korea
rmi : mean radius
t : thickness
Torsion can be figured out from Figure 38, in the field of solid mechanics, torsion is the twisting
of an object due to an applied torque. It is expressed in newton meters.
Figure 38: Tube element under torsion (“Torsion (mechanics) - Wikipedia, the Free Encyclopedia”
n.d.)
For calculation of shear stress torsion, following formulas and Figure 39 can be examined,
Figure 39: In circular shaft stress varies from the center (“Theory -8” n.d.)

Wind Turbine Tower Structure Analysis According to Wind Load in Terms of Cost 53
“EMSHIP” Erasmus Mundus Master Course, period of study September 2014 – February 2016
Firstly, polar moment of inertia might be calculated:
𝐽 =𝜋
2(𝑟𝑜
4 − 𝑟𝑖4) (10)
Then,
𝜏𝑡𝑜𝑟𝑠𝑖𝑜𝑛 = 𝜏𝑚𝑎𝑥 = 𝜏2 =𝑇 ∗ 𝑟0𝐽
(11)
τtorsion : torsion shear stress
J : polar moment of inertia
ro : outside radius
ri : inside radius
T : torque
Finally, force shear stress will be examined in the following formula:
𝜏𝑠ℎ𝑒𝑎𝑟 =𝐹𝑟𝑒𝑠𝑝,𝑑
𝐴 (12)
τshear : force shear stress
Fresp,d : designed shear force
A : cross-sectional area
Geometry of can is assumed shafts with circular sections, therefore deplanation of section is
not seen. Total direct stress and total shear stress can be found by following formulas:

P 54 Selcuk SAHIN
Master Thesis developed at West Pomeranian University of Technology, Szczecin, Poland and The Lloyd’s
Register Foundation Research Centre of Excellence, Pusan, Republic of Korea
𝜎𝑧 = 𝜎𝑛 + 𝜎𝑏 (13)
σz : total direct stress
σn : direct stress
σb : bending stress
𝜎𝑧𝜗 = 𝜏𝑠ℎ𝑒𝑎𝑟 + 𝜏𝑡𝑜𝑟𝑠𝑖𝑜𝑛 (14)
σzϑ : total shear stress
τshear : force shear stress
τtorsion : torsion shear stress
Hoop stress because of the wind pressure on the structure must be calculated as it can be seen
in Figure 40.
Figure 40: Hoop stress on the structure (“EngrApps: Burst and Collapse - Pressure Vessel Design”
n.d.)
Hoop stress depends on pressure. Basically, pressure on the tower is resulted from wind. Using
wind data that is taken from the sensors, pressure on the tower can be estimated. Initially, EC3-
1-6 says that, cylinders must satisfy circumferential shell buckling conditions by following
formula,

Wind Turbine Tower Structure Analysis According to Wind Load in Terms of Cost 55
“EMSHIP” Erasmus Mundus Master Course, period of study September 2014 – February 2016
𝑟
𝑡≤ 0.21 ∗ √
𝐸
𝑓𝑦𝑘 (15)
r : radius
t : thickness
E : modulus of elasticity
fyk : characteristic yielding stress
Firstly, wind pressure distribution on the tower should be known. According to EC3-1-6, wind
distribution on the tower could be seen in the following Figure 41,
Figure 41: Wind pressure distribution around shell circumference (CEN (European Commitee for
Standardization) 2007b)
Because of the complex shape of the pressure distribution on the above figure, calculation is
not that easy. According to EC3-1-6, wind pressure on the tower should be converted to a
symmetrical condition which is presented in Figure 42,
Figure 42: Equivalent axisymmetric pressure distribution (CEN (European Commitee for
Standardization) 2007b)
P 56 Selcuk SAHIN
Master Thesis developed at West Pomeranian University of Technology, Szczecin, Poland and The Lloyd’s
Register Foundation Research Centre of Excellence, Pusan, Republic of Korea
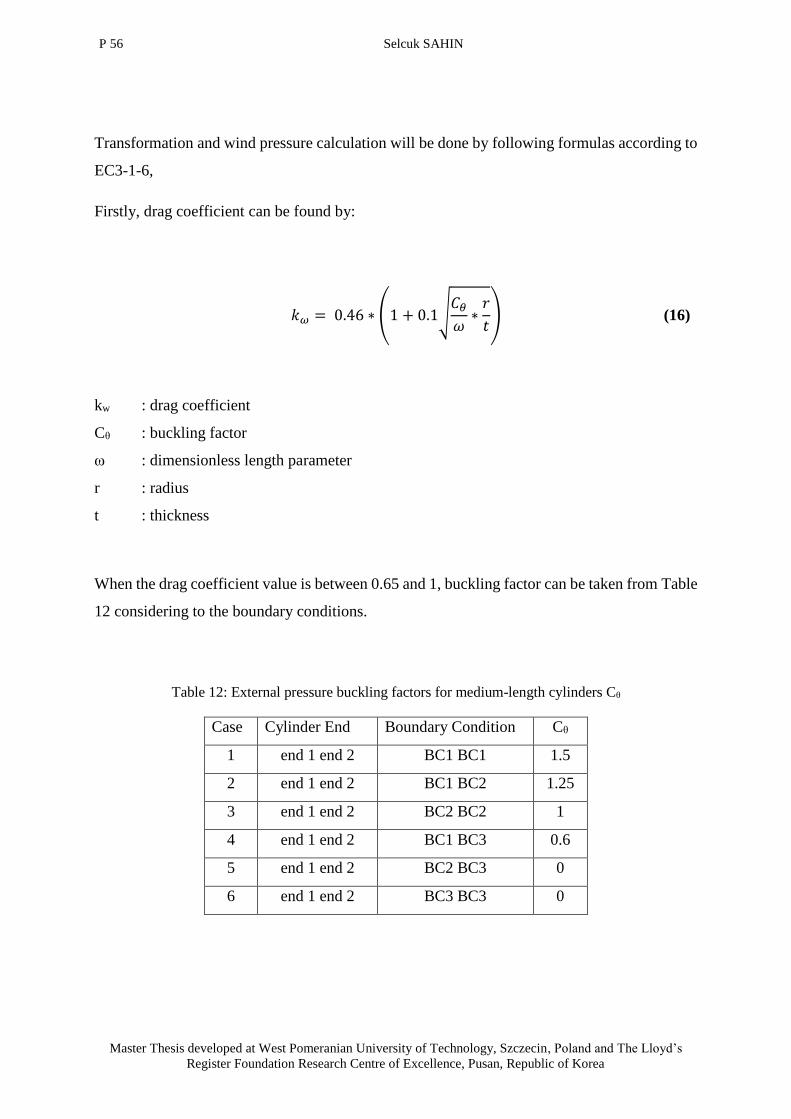
Transformation and wind pressure calculation will be done by following formulas according to
EC3-1-6,
Firstly, drag coefficient can be found by:
𝑘𝜔 = 0.46 ∗ (1 + 0.1√𝐶𝜃𝜔
∗𝑟
𝑡) (16)
kw : drag coefficient
Cθ : buckling factor
ω : dimensionless length parameter
r : radius
t : thickness
When the drag coefficient value is between 0.65 and 1, buckling factor can be taken from Table
12 considering to the boundary conditions.
Table 12: External pressure buckling factors for medium-length cylinders Cθ
Case Cylinder End Boundary Condition Cθ
1 end 1 end 2 BC1 BC1 1.5
2 end 1 end 2 BC1 BC2 1.25
3 end 1 end 2 BC2 BC2 1
4 end 1 end 2 BC1 BC3 0.6
5 end 1 end 2 BC2 BC3 0
6 end 1 end 2 BC3 BC3 0

Wind Turbine Tower Structure Analysis According to Wind Load in Terms of Cost 57
“EMSHIP” Erasmus Mundus Master Course, period of study September 2014 – February 2016
Non-symmetric maximum wind pressure is determined by:
𝑞𝑤𝑚𝑎𝑥 = 0.5 ∗ 𝜌𝑎𝑖𝑟 ∗ 𝑉𝑤𝑖𝑛𝑑2 (17)
qwmax : non-symmetric maximum wind pressure
ρair : density of air which is 1.225 kg/m3
Vwind : velocity of wind (comes from sensor data interpolations)
Equivalent axisymmetric pressure is defined:
𝑞𝑒𝑞 = 𝑘𝑤 ∗ 𝑞𝑤𝑚𝑎𝑥 (18)
qeq : axisymmetric maximum wind pressure
kw : drag coefficient
qwmax : non-symmetric maximum wind pressure
The hoop stress is defined as:
𝜎𝜃 = 𝑞𝑒𝑞 ∗ 𝑟𝑚𝑖
𝑡 (19)
σθ : hoop stress
qeq : axisymmetric maximum wind pressure
rmi : main radius
t : thickness

P 58 Selcuk SAHIN
Master Thesis developed at West Pomeranian University of Technology, Szczecin, Poland and The Lloyd’s
Register Foundation Research Centre of Excellence, Pusan, Republic of Korea
After the completion of all stress calculations, reference stress that consists of all stress such as
direct, hoop and shear can be found. The Von Misses stress (total reference stress) of each can
of tower can be expressed by:
𝜎𝑟𝑒𝑓 = √𝜎𝑧2 + 𝜎𝜃2 − 𝜎𝑧 ∗ 𝜎𝜃 + 3 ∗ 𝜎𝑧𝜃2 (20)
σref : Von Misses stress (total reference stress)
σz : total direct stress
σθ : hoop stress
σzθ : total shear stress
4.3.2.2. Meridional Buckling Stress
Figure 43: Cylinder geometry (CEN (European Commitee for Standardization) 2007b)
The symbolic geometry of shell can be seen in Figure 43. According to EC-1-6, the length of
the shell must be characterized. The length of the shell segment is characterized in terms of the
dimensionless length parameter by the following formula:
𝜔 =𝑙
𝑟∗ √
𝑟
𝑡 (21)

Wind Turbine Tower Structure Analysis According to Wind Load in Terms of Cost 59
“EMSHIP” Erasmus Mundus Master Course, period of study September 2014 – February 2016
Then:
𝜔 =𝑙
√𝑟𝑡 (22)
ω : dimensionless length parameter
l : cylinder length between defined boundaries
r : radius of cylinder middle surface
t : thickness
According to dimensionless length parameter, correction factor can be determined by:
For medium-length cylinders, could be defined by:
1.7 ≤ 𝜔 ≤ 0.5 ∗ (𝑟
𝑡) (23)
𝐶𝑥 = 1.0 (24)
For medium short cylinders, could be determined by:
𝜔 ≤ 1.7 (25)
𝐶𝑥 = 1.36 −1.83
𝜔+2.07
𝜔2 (26)
For medium long cylinders, could be expressed by:
𝜔 > 0.5 ∗ (𝑟
𝑡) (27)

P 60 Selcuk SAHIN
Master Thesis developed at West Pomeranian University of Technology, Szczecin, Poland and The Lloyd’s
Register Foundation Research Centre of Excellence, Pusan, Republic of Korea
𝐶𝑥 = 𝐶𝑥,𝑁 (28)
𝐶𝑥,𝑁 = 1 +0.2
𝐶𝑥𝑏∗ [1 − 2 ∗ 𝜔
𝑡
𝑟] (29)
Cxb can be obtain from below Table 13,
Table 13: Parameter Cxb for the effect of boundary conditions on the elastic critical meridional
buckling stress in long cylinders
Case Cylinder end Boundary Conditions Cxb
1 end 1 end 2 BC1 BC1 6
2 end 1 end 2 BC1 BC2 3
3 end 1 end 2 BC2 BC2 1
ω : dimensionless length parameter
r : radius of cylinder middle surface
t : thickness
Cx : correction factor
Cx,N : normal correction factor
Cxb : effect of boundary conditions on the elastic critical meridional buckling stress in long
cylinders
After all these calculations, the elastic critical meridional buckling stress, using a value of
correction factor, may be obtained from:
𝜎𝑥,𝑅𝑐𝑟 = 0.605 ∗ 𝐸 ∗ 𝐶𝑥 ∗ (𝑡
𝑟) (30)
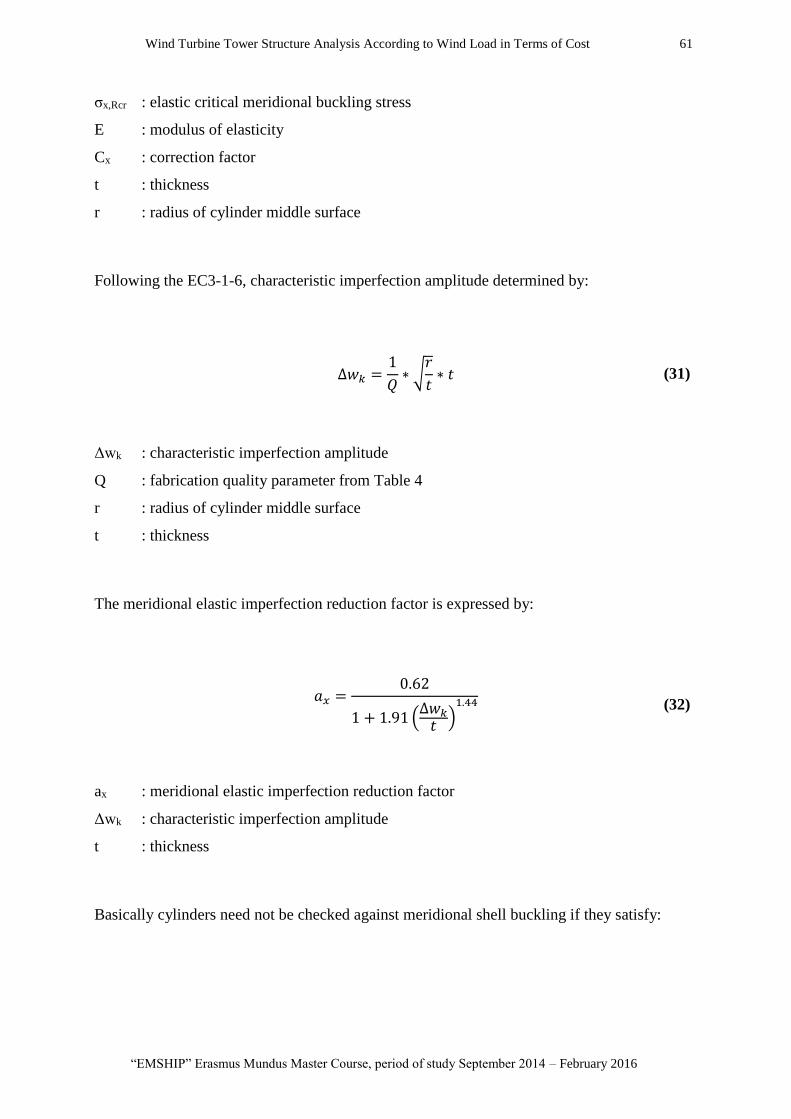
Wind Turbine Tower Structure Analysis According to Wind Load in Terms of Cost 61
“EMSHIP” Erasmus Mundus Master Course, period of study September 2014 – February 2016
σx,Rcr : elastic critical meridional buckling stress
E : modulus of elasticity
Cx : correction factor
t : thickness
r : radius of cylinder middle surface
Following the EC3-1-6, characteristic imperfection amplitude determined by:
∆𝑤𝑘 =1
𝑄∗ √
𝑟
𝑡∗ 𝑡 (31)
Δwk : characteristic imperfection amplitude
Q : fabrication quality parameter from Table 4
r : radius of cylinder middle surface
t : thickness
The meridional elastic imperfection reduction factor is expressed by:
𝑎𝑥 =
0.62
1 + 1.91 (∆𝑤𝑘
𝑡 )1.44
(32)
ax : meridional elastic imperfection reduction factor
Δwk : characteristic imperfection amplitude
t : thickness
Basically cylinders need not be checked against meridional shell buckling if they satisfy:

P 62 Selcuk SAHIN
Master Thesis developed at West Pomeranian University of Technology, Szczecin, Poland and The Lloyd’s
Register Foundation Research Centre of Excellence, Pusan, Republic of Korea
𝑟
𝑡≤ 0.03
𝐸
𝑓𝑦𝑘 (33)
r : radius of cylinder middle surface
t : thickness
E : modulus of elasticity
fyk : characteristic yielding stress
If cylinders don’t satisfy above equation, the meridional squash limit slenderness, the plastic
range factor and the interaction exponent should be taken as:
𝜆𝑥0 = 0.20 (34)
𝛽 = 0.60 (35)
𝜂 = 1.0 (36)
For long cylinders, there is one special condition in order to calculate meridional squash limit
slenderness, according to EC3-1-6:
𝜆𝑥0 = 0.20 + 0.10 ∗ (𝜎𝑥𝐸𝜎𝑥𝐸,𝑀
) (37)
𝜆x0 : meridional squash limit slenderness
β : plastic range factor
𝞰 : interaction exponent
σxE : design value of the meridional stress σx,Ed
σxE,M : the component of σx,Ed that derives from tubular global bending

Wind Turbine Tower Structure Analysis According to Wind Load in Terms of Cost 63
“EMSHIP” Erasmus Mundus Master Course, period of study September 2014 – February 2016
The value of the plastic limit relative slenderness could be found by:
𝜆𝑝 = √𝑎
1 − 𝛽 (38)
𝜆p : plastic limit relative slenderness
a : elastic imperfection reduction factor
β : plastic range factor
The relative shell slenderness for meridional buckling stresses should be expressed by:
𝜆𝑥 = √𝑓𝑦𝑘
𝜎𝑥,𝑅𝑐𝑟 (39)
𝜆x : relative shell slenderness for meridional buckling
fyk : characteristic yielding stress
σx,Rcr : elastic critical meridional buckling stress
The meridional buckling reduction factors could be determined by following formula,
according to relative slenderness of the shell:
𝜒𝑥 = 1 𝑓𝑜𝑟 𝜆 ≤ 𝜆0 (40)
𝜒𝑥 = 1 − 𝛽 ∗ (𝜆 − 𝜆0
𝜆𝑝 − 𝜆0)
𝜂
𝑓𝑜𝑟 𝜆0 < 𝜆 < 𝜆𝑝 (41)

P 64 Selcuk SAHIN
Master Thesis developed at West Pomeranian University of Technology, Szczecin, Poland and The Lloyd’s
Register Foundation Research Centre of Excellence, Pusan, Republic of Korea
𝜒𝑥 =𝑎
𝜆2 𝑓𝑜𝑟 𝜆𝑝 ≤ 𝜆 (42)
χx : meridional buckling reduction factor
𝜆 : relative shell slenderness for meridional buckling
𝜆0 : meridional squash limit slenderness
β : plastic range factor
𝜆p : plastic limit relative slenderness
𝞰 : interaction exponent
a : elastic imperfection reduction factor
Then characteristic buckling stresses can be found for each tower can by following formula:
𝜎𝑥,𝑅𝑘 = 𝜒𝑥 ∗ 𝑓𝑦𝑘 (43)
σx,Rk : characteristic buckling stresses
χx : meridional buckling reduction factor
fyk : characteristic yielding stress
Finally designed buckling resistance could be determined by:
𝜎𝑥,𝑅𝑑 = 𝜎𝑥,𝑅𝑘 ∗ 𝛾𝑀1 (44)
σx,Rd : design buckling resistance
σx,Rk : characteristic buckling stresses
γM1 : partial factor

Wind Turbine Tower Structure Analysis According to Wind Load in Terms of Cost 65
“EMSHIP” Erasmus Mundus Master Course, period of study September 2014 – February 2016
For partial factor doesn’t have standard rule. Therefor value can be taken according to country
and sector. However, basically it shouldn’t be taken as smaller than 1.1, in this work it is taken
1.2
4.3.2.3. Circumferential Buckling Stress
Dimensionless length parameter can be seen in formula 21st then according to dimensionless
length parameter, segment can be determined.
Depend on the boundary condition the factor of Cθ might be taken from Table 12,
For medium-length cylinders, could be defined by:
20 ≤ (𝜔
𝐶𝜃) ≤ 1.63 ∗ (
𝑟
𝑡) (45)
Later, the elastic critical circumferential buckling stress for medium cylinder, could be found
from:
𝜎𝜃,𝑅𝑐𝑟 = 0,92 ∗ 𝐸 ∗ (𝐶𝜃𝜔) ∗ (
𝑡
𝑟) (46)
σθ,Rcr : elastic critical meridional buckling stress
E : modulus of elasticity
Cθ : correction factor
ω : dimensionless length parameter
t : thickness
r : radius of cylinder middle surface
For short cylinders, could be defined by:
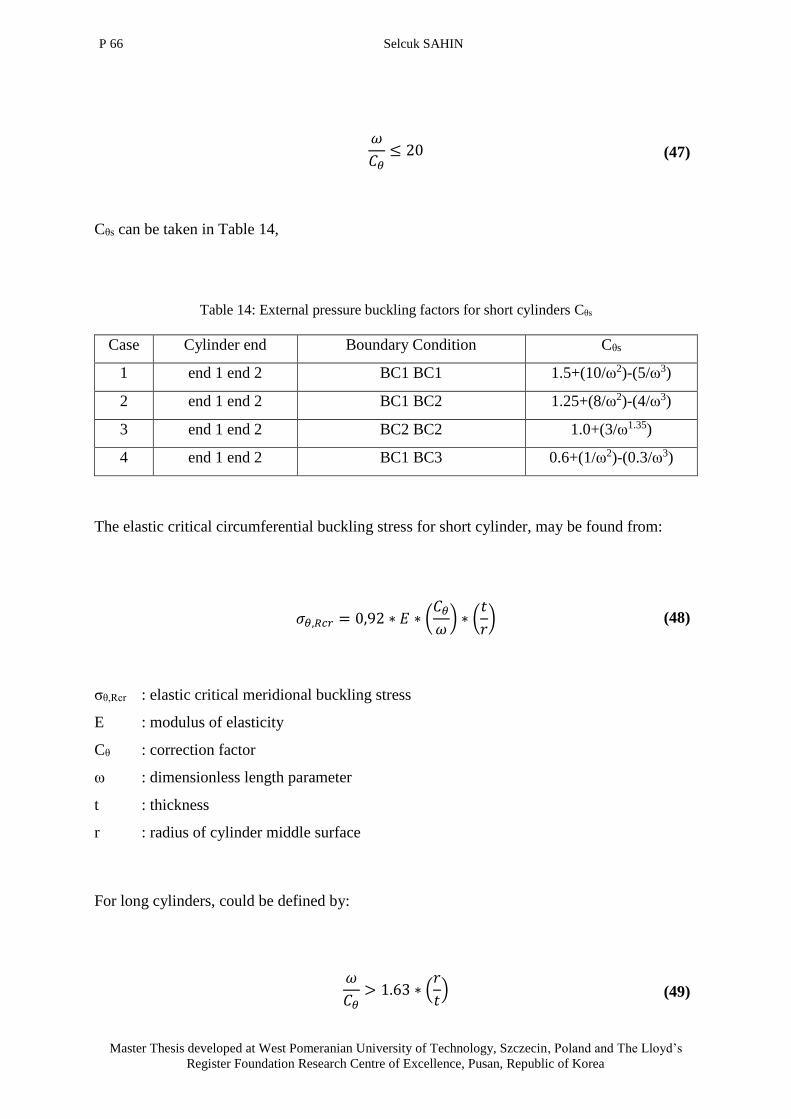
P 66 Selcuk SAHIN
Master Thesis developed at West Pomeranian University of Technology, Szczecin, Poland and The Lloyd’s
Register Foundation Research Centre of Excellence, Pusan, Republic of Korea
𝜔
𝐶𝜃≤ 20 (47)
Cθs can be taken in Table 14,
Table 14: External pressure buckling factors for short cylinders Cθs
Case Cylinder end Boundary Condition Cθs
1 end 1 end 2 BC1 BC1 1.5+(10/ω2)-(5/ω3)
2 end 1 end 2 BC1 BC2 1.25+(8/ω2)-(4/ω3)
3 end 1 end 2 BC2 BC2 1.0+(3/ω1.35)
4 end 1 end 2 BC1 BC3 0.6+(1/ω2)-(0.3/ω3)
The elastic critical circumferential buckling stress for short cylinder, may be found from:
𝜎𝜃,𝑅𝑐𝑟 = 0,92 ∗ 𝐸 ∗ (𝐶𝜃𝜔) ∗ (
𝑡
𝑟) (48)
σθ,Rcr : elastic critical meridional buckling stress
E : modulus of elasticity
Cθ : correction factor
ω : dimensionless length parameter
t : thickness
r : radius of cylinder middle surface
For long cylinders, could be defined by:
𝜔
𝐶𝜃> 1.63 ∗ (
𝑟
𝑡) (49)

Wind Turbine Tower Structure Analysis According to Wind Load in Terms of Cost 67
“EMSHIP” Erasmus Mundus Master Course, period of study September 2014 – February 2016
Then, the elastic critical circumferential buckling stress for long cylinders, is found by:
𝜎𝜃,𝑅𝑐𝑟 = 𝐸 ∗ (𝑡
𝑟)2
[0.275 + 2.03 ∗ (𝐶𝜃𝜔
∗𝑟
𝑡)4
] (50)
σθ,Rcr : elastic critical meridional buckling stress
E : modulus of elasticity
t : thickness
r : radius of cylinder middle surface
Cθ : correction factor
ω : dimensionless length parameter
Circumferential buckling parameters can be determined from fabrication quality, according to
EC3-1-6, fabrication quality can be seen in Table 15,
Table 15: Values of aθ based on fabrication quality
Fabrication Tolerance Quality Class Description aθ
Class A Excellent 0.75
Class B High 0.65
Class C Normal 0.5
The circumferential squash limit slenderness, the plastic range factor and the interaction
exponent should be taken as:
𝜆𝜃0 = 0.40 (51)
𝛽 = 0.60 (52)
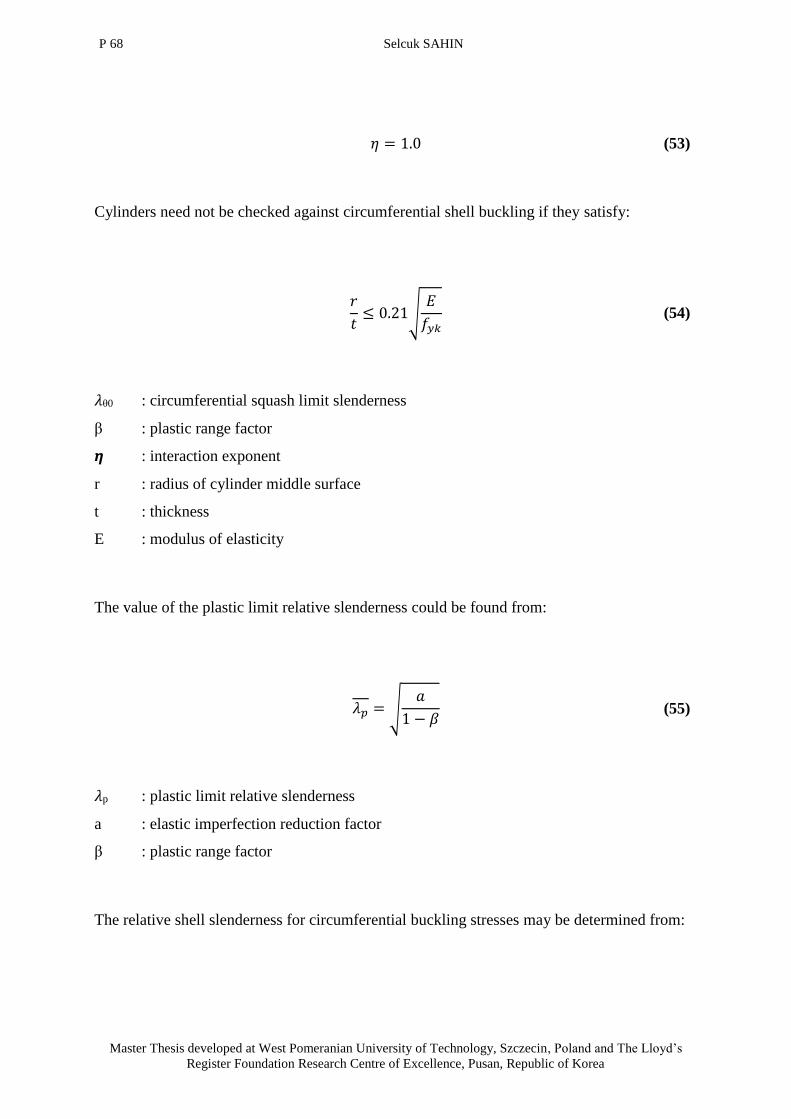
P 68 Selcuk SAHIN
Master Thesis developed at West Pomeranian University of Technology, Szczecin, Poland and The Lloyd’s
Register Foundation Research Centre of Excellence, Pusan, Republic of Korea
𝜂 = 1.0 (53)
Cylinders need not be checked against circumferential shell buckling if they satisfy:
𝑟
𝑡≤ 0.21√
𝐸
𝑓𝑦𝑘 (54)
𝜆θ0 : circumferential squash limit slenderness
β : plastic range factor
𝞰 : interaction exponent
r : radius of cylinder middle surface
t : thickness
E : modulus of elasticity
The value of the plastic limit relative slenderness could be found from:
𝜆𝑝 = √𝑎
1 − 𝛽 (55)
𝜆p : plastic limit relative slenderness
a : elastic imperfection reduction factor
β : plastic range factor
The relative shell slenderness for circumferential buckling stresses may be determined from:

Wind Turbine Tower Structure Analysis According to Wind Load in Terms of Cost 69
“EMSHIP” Erasmus Mundus Master Course, period of study September 2014 – February 2016
𝜆𝜃 = √𝑓𝑦𝑘
𝜎𝜃,𝑅𝑐𝑟 (56)
𝜆θ : relative shell slenderness for circumferential buckling
fyk : characteristic yielding stress
σθ,Rcr : elastic critical circumferential buckling stress
The circumferential buckling reduction factors could be determined according to relative
slenderness of the shell:
𝜒𝜃 = 1 𝑓𝑜𝑟 𝜆 ≤ 𝜆0 (57)
𝜒𝜃 = 1 − 𝛽 ∗ (𝜆 − 𝜆0
𝜆𝑝 − 𝜆0)
𝜂
𝑓𝑜𝑟 𝜆0 < 𝜆 < 𝜆𝑝 (58)
𝜒𝜃 =𝑎
𝜆2 𝑓𝑜𝑟 𝜆𝑝 ≤ 𝜆 (59)
χθ : circumferential buckling reduction factor
𝜆 : relative shell slenderness for circumferential buckling
𝜆0 : circumferential squash limit slenderness
β : plastic range factor
𝜆p : plastic limit relative slenderness
𝞰 : interaction exponent
a : elastic imperfection reduction factor
Then characteristic buckling stresses can be found for each tower can by following formula:

P 70 Selcuk SAHIN
Master Thesis developed at West Pomeranian University of Technology, Szczecin, Poland and The Lloyd’s
Register Foundation Research Centre of Excellence, Pusan, Republic of Korea
𝜎𝜃,𝑅𝑘 = 𝜒𝜃 ∗ 𝑓𝑦𝑘 (60)
σx,Rk : characteristic buckling stresses
χx : circumferential buckling reduction factor
fyk : characteristic yielding stress
Finally designed buckling resistance could be determined by:
𝜎𝜃,𝑅𝑑 = 𝜎𝜃,𝑅𝑘 ∗ 𝛾𝑀1 (61)
σθ,Rd : design buckling resistance
σθ,Rk : characteristic buckling stresses
γM1 : partial factor
4.3.2.4. Shear Buckling Stress
Dimensionless length parameter can be seen in formula 21st.
For medium-length cylinders, which are defined by:
10 ≤ 𝜔 ≤ 8.7 ∗ (𝑟
𝑡) (62)
Correction factor may be found:
𝐶𝜏 = 1.0 (63)
Wind Turbine Tower Structure Analysis According to Wind Load in Terms of Cost 71
“EMSHIP” Erasmus Mundus Master Course, period of study September 2014 – February 2016
ω : dimensionless length parameter
r : radius of cylinder middle surface
t : thickness
Cτ : correction factor
For short cylinders, could be defined by:
𝜔 < 10 (64)
Correction factor may be found:
𝐶𝜏 = √1 +42
𝜔3 (65)
ω : dimensionless length parameter
Cτ : correction factor
For long cylinders, which are defined by:
𝜔 > 8.7 ∗ (𝑟
𝑡) (66)
Correction factor may be found:
𝐶𝜏 =1
3∗ √𝜔 ∗
𝑡
𝑟 (67)

P 72 Selcuk SAHIN
Master Thesis developed at West Pomeranian University of Technology, Szczecin, Poland and The Lloyd’s
Register Foundation Research Centre of Excellence, Pusan, Republic of Korea
ω : dimensionless length parameter
r : radius of cylinder middle surface
t : thickness
Cτ : correction factor
Shear buckling parameters can be determined by fabrication quality, according to EC3-1-6,
fabrication quality can be seen in Table 15,
The shear squash limit slenderness, the plastic range factor and the interaction exponent should
be taken as:
𝜆𝜏0 = 0.40 (68)
𝛽 = 0.60 (69)
𝜂 = 1.0 (70)
Cylinders need not be checked against circumferential shell buckling if they satisfy:
𝑟
𝑡≤ 0.16 [√
𝐸
𝑓𝑦𝑘]
0.67
(71)
𝜆τ0 : shear squash limit slenderness
β : plastic range factor
𝞰 : interaction exponent
r : radius of cylinder middle surface
t : thickness
E : modulus of elasticity

Wind Turbine Tower Structure Analysis According to Wind Load in Terms of Cost 73
“EMSHIP” Erasmus Mundus Master Course, period of study September 2014 – February 2016
fyk : characteristic yielding stress
𝜆𝑝 = √𝑎
1 − 𝛽 (72)
𝜆p : plastic limit relative slenderness
a : elastic imperfection reduction factor
β : plastic range factor
The relative shell slenderness for shear buckling stresses should be determined by:
𝜆𝜏 = √𝑓𝑦𝑘
𝜏𝑥𝜃,𝑅𝑐𝑟 (73)
𝜆θ : relative shell slenderness for shear buckling
fyk : characteristic yielding stress
σxτ,Rcr : elastic critical shear buckling stress
The shear buckling reduction factors could be determined according to relative slenderness of
the shell:
𝜒𝜏 = 1 𝑓𝑜𝑟 𝜆 ≤ 𝜆0 (74)
𝜒𝜏 = 1 − 𝛽 ∗ (𝜆 − 𝜆0
𝜆𝑝 − 𝜆0)
𝜂
𝑓𝑜𝑟 𝜆0 < 𝜆 < 𝜆𝑝 (75)

P 74 Selcuk SAHIN
Master Thesis developed at West Pomeranian University of Technology, Szczecin, Poland and The Lloyd’s
Register Foundation Research Centre of Excellence, Pusan, Republic of Korea
𝜒𝜏 =𝑎
𝜆2 𝑓𝑜𝑟 𝜆𝑝 ≤ 𝜆 (76)
χτ : shear buckling reduction factor
𝜆 : relative shell slenderness for circumferential buckling
𝜆0 : shear squash limit slenderness
β : plastic range factor
𝜆p : plastic limit relative slenderness
𝞰 : interaction exponent
a : elastic imperfection reduction factor
Then characteristic buckling stresses might be found for each tower can by following formula:
𝜏𝑥𝜃,𝑅𝑘 =𝜒𝜃 ∗ 𝑓𝑦𝑘
√3 (77)
τxθ,Rk : characteristic buckling stresses
χx : circumferential buckling reduction factor
fyk : characteristic yielding stress
Finally designed buckling resistance could be determined by:
𝜏𝑥𝜃,𝑅𝑑 = 𝜏𝑥𝜃,𝑅𝑘 ∗ 𝛾𝑀1 (78)
τxθ,Rd : design buckling resistance
τxθ,Rk : characteristic buckling stresses
γM1 : partial factor

Wind Turbine Tower Structure Analysis According to Wind Load in Terms of Cost 75
“EMSHIP” Erasmus Mundus Master Course, period of study September 2014 – February 2016
4.3.2.5. Buckling Stress Reserve Factor Calculations
The stress reserve factor is the ratio between experimental data and European standards. The
SRF must be greater than “1” for each buckling condition. In order to obtain exact SRF
following formulas can be used:
SRF for yielding:
𝑓𝑦𝑑 =𝑓𝑦𝑘
1.2 (79)
𝑆𝑅𝐹𝑦 =𝜎𝑟𝑒𝑓
𝑓𝑦𝑑 (80)
fyd : yielding strength design
fyk : characteristic yielding stress
SRFy : stress reserve factor for yielding
σref : Von Misses stress (total reference stress)
SRF for meridional buckling:
𝑆𝑅𝐹𝑚 =𝜎𝑥,𝑅𝑑𝜎𝑧
(81)
SRFm : stress reserve factor for meridional buckling
σx,Rd : meridional design buckling stress
σz : total normal stress
SRF for circumferential buckling:

P 76 Selcuk SAHIN
Master Thesis developed at West Pomeranian University of Technology, Szczecin, Poland and The Lloyd’s
Register Foundation Research Centre of Excellence, Pusan, Republic of Korea
𝑆𝑅𝐹𝑐 =𝜎𝜃,𝑅𝑑𝜎𝑎
(82)
SRFm : stress reserve factor for meridional buckling
σθ,Rd : circumferential design buckling stress
σa : hoop stress
SRF for shear buckling:
𝑆𝑅𝐹𝑠 =𝜏𝜃,𝑅𝑑𝜏𝑧𝜃
(83)
SRFs : stress reserve factor for shear buckling
τθ,Rd : shear design buckling stress
τzθ : total shear stress
Interaction Parameters:
𝑘𝑥 = 1 + 𝑥𝑥2 (84)
𝑘𝜏 = 1.5 + 0.5 ∗ 𝑥𝜏2 (85)
𝐼𝑛𝑡𝑒𝑟𝑎𝑐𝑡 𝑈𝑡𝑖𝑙𝑖𝑡𝑦 = (𝜎𝑧
𝜎𝑥,𝑅𝑑)
𝑘𝑥
+ (𝜏𝑧𝜃
𝜏𝑥𝜃,𝑅𝑑)
𝑘𝜏
(86)
𝑆𝑅𝐹𝐼 =1
𝐼𝑛𝑡𝑒𝑟𝑎𝑐𝑡 𝑈𝑡𝑖𝑙𝑖𝑡𝑦 (87)

Wind Turbine Tower Structure Analysis According to Wind Load in Terms of Cost 77
“EMSHIP” Erasmus Mundus Master Course, period of study September 2014 – February 2016
kx : buckling interaction parameter
xx : meridional buckling reduction factor
kτ : shear interaction parameter
xτ : shear buckling reduction factor
σa : hoop stress
σx,Rd : meridional design buckling stress
τzθ : total shear stress
τθ,Rd : shear design buckling stress
SRFI : stress reserve factor for interaction
These five SRF is the critical ratios for each buckling condition. In order to figure out tower is
safety or not, minimum SRF value for each can must be evaluated. The value that is below than
one, cannot be approved. Critical SRF values for this tower may be seen in following Figure
44,
Figure 44: Stress reserve factor each can
For these tower minimum SRF value is 1.003 in the SRF Interaction at 20th can.

P 78 Selcuk SAHIN
Master Thesis developed at West Pomeranian University of Technology, Szczecin, Poland and The Lloyd’s
Register Foundation Research Centre of Excellence, Pusan, Republic of Korea
4.3.3. Fatigue Strength
In steel construction, structure is exposed continious load during all of the life such as wave,
wind. Because of these continious loads there will be some small cracks. These cracks will
increase day by day, it might be risk for collapse. Therefore, during design of the tower, not
only buckling but also fatigue calculation must be done. Fatigue is very important in the joint
areas such as welding or flanges. Two important parameters for fatigue is number of cycles and
stress interval.
Basically, welding is applied on the tower in three main parts. These are welding for being
cylinder, welding between two cans and welding between flange and section. Details can be
seen in Figure 45,
Figure 45: Welding connections in the tower (Kanbur 2014)
Fatigue loads is critical in the weld between two cans also weld between sections and flanges,
typical weld in a tubular tower can be seen in Figure 46,
Figure 46: Typical weld details in a tubular tower a) weld at flange b) weld between two cans (Verma
2011)

Wind Turbine Tower Structure Analysis According to Wind Load in Terms of Cost 79
“EMSHIP” Erasmus Mundus Master Course, period of study September 2014 – February 2016
Wind loading on the tower is the main reason of fatigue cracking. Fatigue design can be carried
out depend on the S-N curves that are made in the laboratory. In the calculation of the fatigue
Palmgren-Miner’s is the key factor.
Before start to talk about S-N curve, detail categories of joints may be figured out. According
to their notch effect, welded joints are classified into detail categories. The detail category is
values that reference to fatigue stress. Basically detail category shows fatigue value at 2*106
number of cycles. It depend on the geometry and fabrication. The given detail categories assume
100% controlled in a penetration aspect. Not only the detail categories of welding but also
surface of welding is very important. Weld should provide a stress flow as smooth as possible
without major internal or external notches, discontinuities in rigidity and obstructions to strains.
In order to prevent stress concentration, the wall thickness must be tapered with a slope not to
be greater than 1:4.
Table 16: Detail categories for common welds in a tubular tower
Weld Categories (ΔσR)
Can to Can 80-90
Can to Flange 71
All part of wind turbines are exposed to different stress ranges. This stress variation can be
illustrated like Figure 47,
Figure 47: The stress cycle (Germanischer Lloyd Industrial Services GmbH 2010)

P 80 Selcuk SAHIN
Master Thesis developed at West Pomeranian University of Technology, Szczecin, Poland and The Lloyd’s
Register Foundation Research Centre of Excellence, Pusan, Republic of Korea
According to Figure 47, stresses can be expressed by,
𝜎𝑚 =(𝜎𝑚𝑎𝑥 + 𝜎𝑚𝑖𝑛)
2 (88)
𝜎𝑎𝑚𝑝 =|𝜎𝑚𝑎𝑥 − 𝜎𝑚𝑖𝑛|
2 (89)
𝑅 =𝜎𝑚𝑖𝑛
𝜎𝑚𝑎𝑥 (90)
σmax : maximum upper stress
σmin : minimum upper stress
σamp : amplitude of the stress cycle
R : ratio between minumum and maximum stress
4.3.3.1. S-N Curve
In order to perform fatigue analysis, the S-N curve for the weld must be followed from EC3-1-
9 as it can be seen in Figure 48. Basically, S-N curve can be calculated by following formulas:
log (𝑁) = 6.69897 + 𝑚 ∗ 𝑄 (91)
𝑄 = 𝑙𝑜𝑔 (∆𝜎𝑅∆𝜎
) −0.39794
𝑚𝑜 (92)
m : inverse slope of S-N curve
mo : inverse slope in the range N ≤ 5*106
ΔσR : fatigue strength reference value of S-N curve at 2*106 cycles of stress range
Δσ : stress range [N/mm2]

Wind Turbine Tower Structure Analysis According to Wind Load in Terms of Cost 81
“EMSHIP” Erasmus Mundus Master Course, period of study September 2014 – February 2016
N : number of endured stress cycless according to S-N curve
Figure 48: Fatigue strength curves for direct stress ranges (CEN (European Commitee for
Standardization) 2005b)
4.3.3.2. Palmgren-Miner’s Rule
The fatigue is the process that is cumulative damage, different varies of loads could be estimated
by using S-N curve considering to Palmgren-Miner’s cumulative damage approach. The total
damage that is on the tower, can help to estimate design life of the tower. It can be expressed
as the summation of the damage from each stress levels at each load cycle. According to
Palmgren-Miner’s rule, the accumulated damage can be expressed by:
𝐷 =∑𝑛𝑖𝑁𝑖
𝑖
(93)
D : accumulated fatigue damage
ni : stress cycles of the ith stress range
Ni : corresponding number of cycles to failure
Failure may happen when the accumulated fatigue damage is higher than 1.0. In order to
withstand, D must be smaller or equal to 1.0.

P 82 Selcuk SAHIN
Master Thesis developed at West Pomeranian University of Technology, Szczecin, Poland and The Lloyd’s
Register Foundation Research Centre of Excellence, Pusan, Republic of Korea
4.3.3.3. Safety Factors
Safety factors must be considered during the design of structure. These safety factors are
obtained by country standards. Each tower producer must follow these standards in order to
avoid some fatigue accident. All these safety numbers come from empirical experiences.
For the towers, main safety strategies and numbers can be seen in Table 17 and Table 18,
Table 17: Safety strategies for structures
Partial Safety γmf Factor
Consequence of Failure
Fail Safe and Damage
Tolerant Strategy
Safe Life and Infinite Life
Strategy
Loss of secondary structural parts 1.00 1.15
Loss of entire structure 1.15 1.30
Loss of human life 1.30 1.40
Table 18: Safety factors for structures
Material Factor Load Safety Factor Total Safety Factor Design Fatigue Life
γmf γFf γMf Year
1.1 1 1.265 20
As it can be seen above tables, total safety number may be determined by:
𝛾𝑀𝑓 = 𝛾𝑚𝑓 ∗ 𝛾𝐹𝑓 ∗ 𝑆𝑎𝑓𝑒 𝐿𝑖𝑓𝑒 & 𝐼𝑛𝑓𝑖𝑛𝑖𝑡𝑒 𝐿𝑖𝑓𝑒 𝑆𝑡𝑟. (94)
γMf : total safety factor
γmf : material factor
γFf : load safety factor

Wind Turbine Tower Structure Analysis According to Wind Load in Terms of Cost 83
“EMSHIP” Erasmus Mundus Master Course, period of study September 2014 – February 2016
4.3.3.4. Fatigue Damage Calculation
In this section, fatigue calculation of wind tower will be presented. Calculation will be shown
step by step. However, in order to provide EC3-1-9 standards, shape and fatigue detail category
were modified during the calculation as it can be seen in Figure 49. Basically, the calculation
loop was repeated twice, because in the first calculation, tower couldn’t provide the standards.
Then design was improved, and it satisfied European Norms.
Figure 49: Chancing tower details in order to provide European Standards
First of all geometrical calculations are done for shape of the tower. Section modulus for each
can could be determined by:
𝑊𝑏𝑒𝑛 =𝜋 ∗ (𝐷𝑜𝑢𝑡𝑒𝑟
4 − 𝐷𝑖𝑛𝑛𝑒𝑟4)
32 ∗ 𝐷𝑜𝑢𝑡𝑒𝑟 (95)
𝑊𝑡𝑜𝑟 = 𝑊𝑏𝑒𝑛 ∗ 2 (96)
SMF My SMF My Damage Damage
[%] [%] [-] [-]
357.76% 357.76% 0.002 0.002
2.41% 15.39% 0.909 0.564
2.48% 15.48% 0.907 0.562
0.12% 12.81% 0.995 0.617
1.54% 14.41% 0.941 0.584
11.05% 11.05% 0.658 0.658
Fatigue damage
(bending) - DEL
Fatigue damage
(bending) - DEL
Primary
Design
Results
Modified
Design
Results
Primary
Design
Results
Modified
Design
Results
P 84 Selcuk SAHIN
Master Thesis developed at West Pomeranian University of Technology, Szczecin, Poland and The Lloyd’s
Register Foundation Research Centre of Excellence, Pusan, Republic of Korea
𝑐𝑟𝑒𝑑 = (25
𝑡)0.2
(97)
𝐹𝑜𝑟 𝑡 ≤ 25 𝑚𝑚 ∶ 𝑐𝑟𝑒𝑑 = 1 (98)
Wben : section modulus of bending
Wtor : section modulus of torsion
cred : thickness reduction factor
t : thickness
As it was mentioned above, in this tower 71, 80 and 90 fatigue class material were used.
Considering these classes, constant amplitude fatigue limit and cut-off limit can be expressed
by:
∆𝜎𝐷 = (2
5)
13∗ ∆𝜎𝐶 (99)
∆𝜎𝐿 = (5
100)
15∗ ∆𝜎𝐷
(100)
ΔσD : constant amplitude fatigue limit
ΔσC : detail category fatigue limit
ΔσL : cut-off fatigue limit
As it was mentioned at the beginning of the fatigue part, fatigue load on the tower is real life
loads that is taken from a similar sample. Therefore, fatigue equivalent moments are taken from
experimental data provided by supervisor. As a result of using real life data, final result will be
closer to the real life condition.
Wind Turbine Tower Structure Analysis According to Wind Load in Terms of Cost 85
“EMSHIP” Erasmus Mundus Master Course, period of study September 2014 – February 2016
∆𝜎𝑖 =
∆𝑀𝑦
𝑊𝑏𝑒𝑛∗ 𝑆𝐶𝐹
(101)
Δσi : bending stress range
ΔMy : fatigue equivalent moment
Wben : section modulus for the tower wall at the specific tower level
SCF : stress concentration factor, usually determined by FEA
∆𝜎𝑖,𝑑 = ∆𝜎𝑖 ∗ 𝛾𝑀𝑓
(102)
Δσi,d : design bending stress range
Δσi : bending stress range
γMf : total safety factor
The torsional stress range is determined by following expression:
∆𝜏𝑖 =
∆𝑀𝑧
2 ∗𝑊𝑡𝑜𝑟
(103)
∆𝜏𝑖,𝑑 = ∆𝜏𝑖 ∗ 𝛾𝑀𝑓
(104)
Δτi,d : design torsion stress range
Δτi : torsion stress range
γMf : total safety factor
According to EC3-1-9, wohler exponent could be found by:
P 86 Selcuk SAHIN
Master Thesis developed at West Pomeranian University of Technology, Szczecin, Poland and The Lloyd’s
Register Foundation Research Centre of Excellence, Pusan, Republic of Korea
𝑖𝑓 ∆𝜎𝑖,𝑑 ≥ 𝐶𝑟𝑑 ∗ ∆𝜎𝐷
(105)
𝑁 =
𝜎𝐶𝑚
(𝜎𝑖,𝑑/𝐶𝑟𝑒𝑑)𝑚 ∗ 2 ∗ 106, 𝑚 = 3
(106)
𝑖𝑓 ∆𝜎𝑖,𝑑 < 𝐶𝑟𝑒𝑑 ∗ ∆𝜎𝐷
(107)
𝑁 =
𝜎𝐷𝑚
(𝜎𝑖,𝑑/𝐶𝑟𝑒𝑑)𝑚 ∗ 2 ∗ 106, 𝑚 = 5
(108)
𝑖𝑓 ∆𝜎𝑖,𝑑 ≤ 𝐶𝑟𝑒𝑑 ∗ ∆𝜎𝐿 , 𝑁 = ∞
(109)
Δσi,d : design bending stress range
cred : thickness reduction factor
ΔσD : constant amplitude fatigue limit
ΔσC : detail category fatigue limit
N : number of cycles to failure with design stress range σi,d
m : wohler exponent
ΔσL : cut-off fatigue limit
In order to estimate structure life torsional calculation might be done. Torsional stress range
can be determined by:
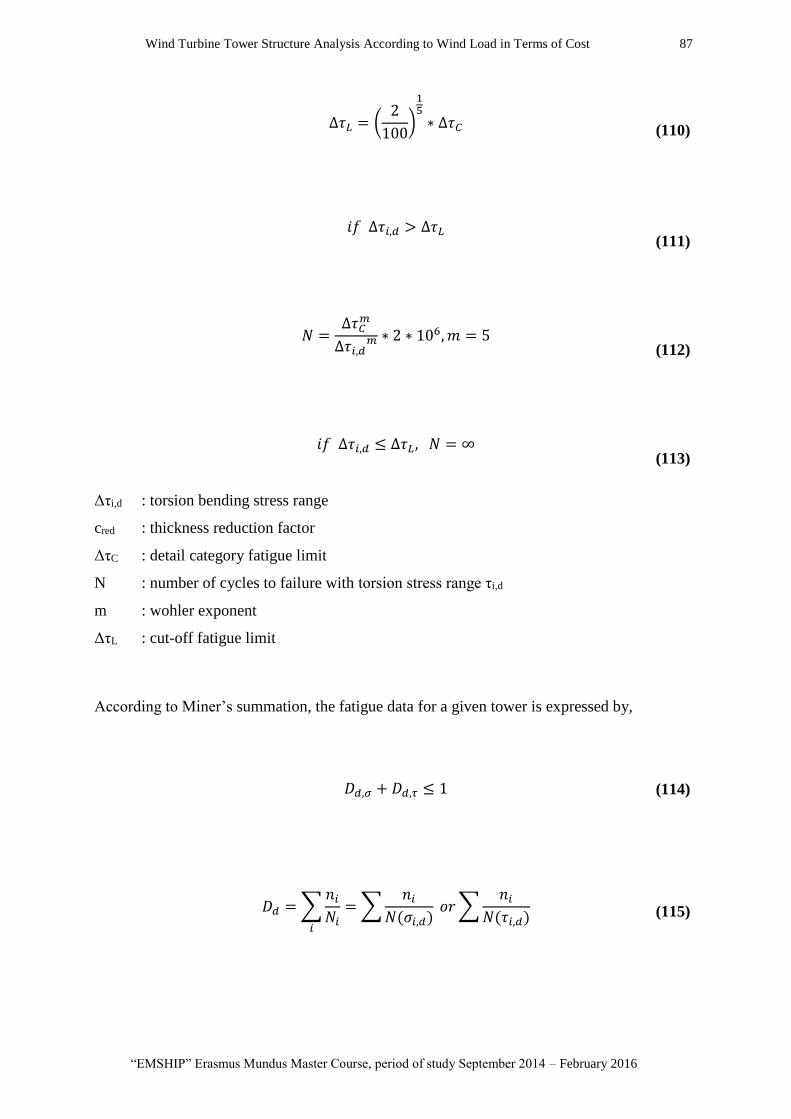
Wind Turbine Tower Structure Analysis According to Wind Load in Terms of Cost 87
“EMSHIP” Erasmus Mundus Master Course, period of study September 2014 – February 2016
∆𝜏𝐿 = (
2
100)
15∗ ∆𝜏𝐶
(110)
𝑖𝑓 ∆𝜏𝑖,𝑑 > ∆𝜏𝐿
(111)
𝑁 =
∆𝜏𝐶𝑚
∆𝜏𝑖,𝑑𝑚 ∗ 2 ∗ 106, 𝑚 = 5
(112)
𝑖𝑓 ∆𝜏𝑖,𝑑 ≤ ∆𝜏𝐿 , 𝑁 = ∞
(113)
Δτi,d : torsion bending stress range
cred : thickness reduction factor
ΔτC : detail category fatigue limit
N : number of cycles to failure with torsion stress range τi,d
m : wohler exponent
ΔτL : cut-off fatigue limit
According to Miner’s summation, the fatigue data for a given tower is expressed by,
𝐷𝑑,𝜎 + 𝐷𝑑,𝜏 ≤ 1 (114)
𝐷𝑑 =∑𝑛𝑖𝑁𝑖
𝑖
=∑𝑛𝑖
𝑁(𝜎𝑖,𝑑) 𝑜𝑟∑
𝑛𝑖𝑁(𝜏𝑖,𝑑)
(115)
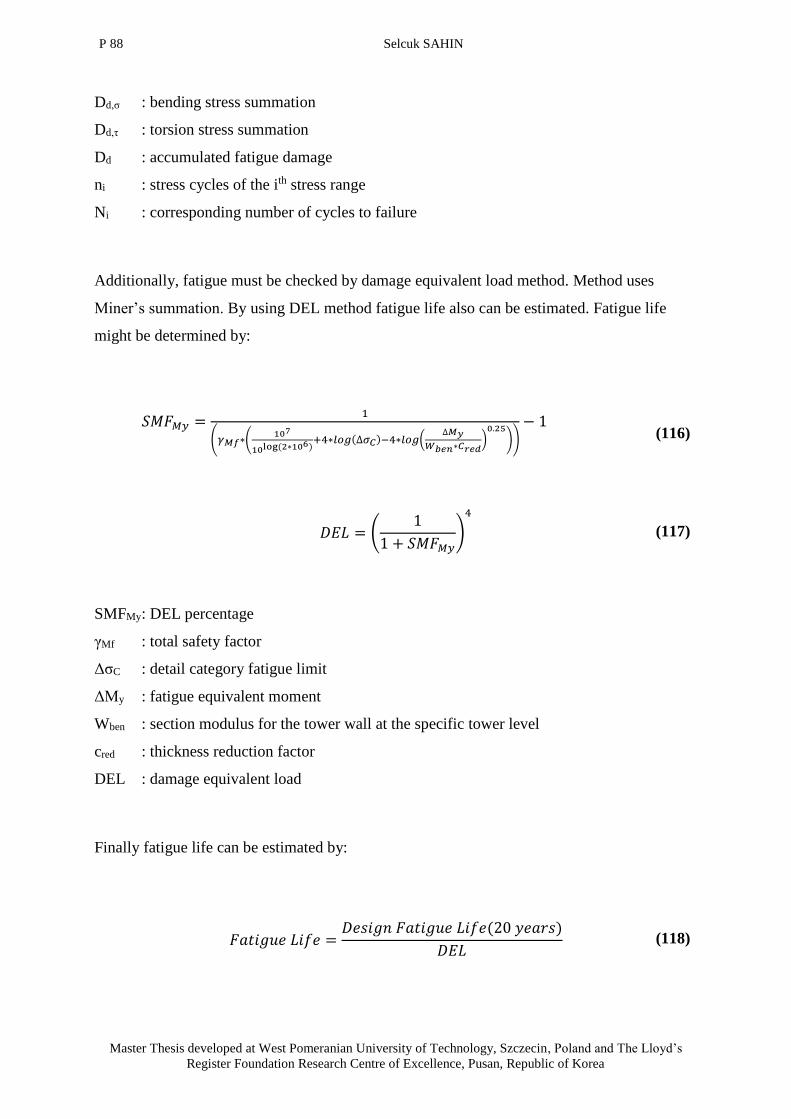
P 88 Selcuk SAHIN
Master Thesis developed at West Pomeranian University of Technology, Szczecin, Poland and The Lloyd’s
Register Foundation Research Centre of Excellence, Pusan, Republic of Korea
Dd,σ : bending stress summation
Dd,τ : torsion stress summation
Dd : accumulated fatigue damage
ni : stress cycles of the ith stress range
Ni : corresponding number of cycles to failure
Additionally, fatigue must be checked by damage equivalent load method. Method uses
Miner’s summation. By using DEL method fatigue life also can be estimated. Fatigue life
might be determined by:
𝑆𝑀𝐹𝑀𝑦 =
1
(𝛾𝑀𝑓∗(107
10log (2∗106)+4∗𝑙𝑜𝑔(∆𝜎𝐶)−4∗𝑙𝑜𝑔(
∆𝑀𝑦
𝑊𝑏𝑒𝑛∗𝐶𝑟𝑒𝑑)0.25
))
− 1 (116)
𝐷𝐸𝐿 = (1
1 + 𝑆𝑀𝐹𝑀𝑦)
4
(117)
SMFMy : DEL percentage
γMf : total safety factor
ΔσC : detail category fatigue limit
ΔMy : fatigue equivalent moment
Wben : section modulus for the tower wall at the specific tower level
cred : thickness reduction factor
DEL : damage equivalent load
Finally fatigue life can be estimated by:
𝐹𝑎𝑡𝑖𝑔𝑢𝑒 𝐿𝑖𝑓𝑒 =𝐷𝑒𝑠𝑖𝑔𝑛 𝐹𝑎𝑡𝑖𝑔𝑢𝑒 𝐿𝑖𝑓𝑒(20 𝑦𝑒𝑎𝑟𝑠)
𝐷𝐸𝐿 (118)

Wind Turbine Tower Structure Analysis According to Wind Load in Terms of Cost 89
“EMSHIP” Erasmus Mundus Master Course, period of study September 2014 – February 2016
Based on the calculations done so far, SRF must be checked. As a result of this check, one can
guess, whether the structure is resistant enough. If it is not, as it was mentioned above, design
should be modified until whole SRF exceed or equal to “1.0”.
SRF can be obtained by:
∆𝜎𝑅 = (𝑎
𝑁𝑅)(1𝑚)
(119)
∆𝜎𝑙𝑖𝑚 = ∆𝜎𝑅 ∗ 𝛾𝑀𝑓 (120)
𝑆𝑅𝐹 =∆𝜎𝑙𝑖𝑚∆𝜎𝑖
(121)
ΔσR : design stress range
a : constant comes from m
NR : number cycles assumed as a reference value
m : wohler exponent
Δσlim : allowable stress
γMf : safety factor
SRF : stress reserve factor
Δσi : bending stress range
To sum up, after one modification, the tower provided all necessities which were obtained by
EC3. Results for SRF and DEL can be seen in Figure 50,

P 90 Selcuk SAHIN
Master Thesis developed at West Pomeranian University of Technology, Szczecin, Poland and The Lloyd’s
Register Foundation Research Centre of Excellence, Pusan, Republic of Korea
Figure 50: DEL and SRF corresponding to tower height
Figure 51: SRF for fatigue and buckling
Figure 51 summarizes all the results obtained from fatigue and ultimate buckling calculations.
For each can and connection, stress reserve factor is equal or greater than “1”. Basically, this
figure shows that all sections of the tower satisfy ultimate and fatigue conditions according to
(CEN (European Commitee for Standardization) 2005a).

Wind Turbine Tower Structure Analysis According to Wind Load in Terms of Cost 91
“EMSHIP” Erasmus Mundus Master Course, period of study September 2014 – February 2016
4.3.4. Dynamic
During the wind turbine design, main dynamic characteristic of turbine must be obtained. In
order to avoid resonance, natural frequency value of the tower should be further from the turbine
operating frequency (1P and 3P). In following subtitles, dynamic character of the tower will be
checked.
4.3.4.1. Determining Tower Natural Frequency
According to (Amirouche 2006), Baumeister’s natural frequency for a simple straight
cylindrical steel tower can be found by following formula:
In order to see importance of the tower mass in natural frequency, Baumeister’s natural
frequency value corresponding to mass can be seen in Figure 52,
Figure 52: Baumeister frequency value corresponding to tower mass

P 92 Selcuk SAHIN
Master Thesis developed at West Pomeranian University of Technology, Szczecin, Poland and The Lloyd’s
Register Foundation Research Centre of Excellence, Pusan, Republic of Korea
Table 19: Characteristic data of turbine
E 2.10E+08 kN/m2
Iave 0.318 m4
mtower 105.157 t
mrotor 112.671 t
L 65.000 m
Table 19 illustrates data of turbine that is necessary for calculation.
𝑓𝑛 =1
2𝜋∗ √
3 ∗ 𝐸 ∗ 𝐼
ℎ3 ∗ (0.23 ∗ 𝑚𝑡𝑜𝑤𝑒𝑟 +𝑚𝑟𝑜𝑡𝑜𝑟) (122)
fn : estimated natural frequency of the tower
h : height of the tower
E : elastic modulus
Iave : moment of inertia (average inertia of all the cans)
mrotor : weight of rotor mass
mtower : tower mass
As a result of these calculations, fn = 0.684 Hz
Due to production defect and different conditions, natural frequency can be changed ±%5.
4.3.4.2. Determining Operation Frequency and Working Frequency
Firstly operation speed of the turbine must be provided by nacelle producer. In this thesis, a
specific nacelle was not chosen, therefore (Lanier and Way 2005)’s samples were interpolated
for further calculations. Samples for interpolation can be seen in Table 20. At the end operation
frequency was found approximately 16 rpm.

Wind Turbine Tower Structure Analysis According to Wind Load in Terms of Cost 93
“EMSHIP” Erasmus Mundus Master Course, period of study September 2014 – February 2016
Table 20: Nacelle operation speed for 1.5 and 3.6 MW wind turbines
Turbine Operation Speed
rpm Hz
1.5 MW(EQ) 20.5 0.342
1.5 MW(Wind) 20.5 0.342
3.6 MW(EQ) 13.2 0.220
3.6 MW(Wind) 13.2 0.220
5.0 MW(EQ) 11.2 0.187
5.0 MW(Wind) 11.2 0.187
Frequency limits can be calculated by:
1𝑃𝐻𝑧 =1𝑃𝑟𝑝𝑚
60 (123)
3𝑃𝐻𝑧 = 3 ∗ 1𝑃𝐻𝑧 (124)
1.1𝑃𝐻𝑧 = 1.1 ∗ 1𝑃𝐻𝑧 (125)
2.7𝑃𝐻𝑧 = 2.7 ∗ 1𝑃𝐻𝑧 (126)
1PHz : block frequency in Hz
1Prpm : block frequency in rpm
3PHz : 3 blades block frequency in Hz
1.1PHz : min. working frequency in Hz
2.7PHz : max. working frequency in Hz

P 94 Selcuk SAHIN
Master Thesis developed at West Pomeranian University of Technology, Szczecin, Poland and The Lloyd’s
Register Foundation Research Centre of Excellence, Pusan, Republic of Korea
Figure 53: Frequency analyses of the tower
As it can be seen in Figure 53, 1PHz = 0.26, 3PHz = 0.80, 1.1PHz = 0.29 and 2.7PHz = 0.72 Hertz.
Tower frequency was stated above as an fn = 0.684 Hz. To sum up, tower is in safe region.
Additionally, fn is in between 1.1PHz and 2.7PHz, it means, the tower that is stated in this thesis
is “soft” class wind tower.
Figure 54: Campbell Diagram
Figure 54 illustrates to fn value is in between 1PHz and 3PHz. According to (Lanier and Way
2005), soft wind turbine frequency value should be inside to this range when turbine is working.

Wind Turbine Tower Structure Analysis According to Wind Load in Terms of Cost 95
“EMSHIP” Erasmus Mundus Master Course, period of study September 2014 – February 2016
4.4. Tower Flange Design
In order to connect each segment in the cylindrical tower, flange connection might be used.
Circular flanges is welded two segments. There are holes on the flanges. Using these holes and
bolts, connection might be satisfied.
For three main segments tower, one segment connection between nacelle and tower, two middle
level segment connections among the cans and one bottom level segment connection between
tower and foundation might be used.
Due to load differences in the each level of the tower, accident scenarios on the flanges can be
different. Basically, one cannot expect same ultimate flange behavior on the top and bottom.
Therefore, for each condition different formula will be used considering geometry and level.
Loads on the flange also very important factor. Estimation of the load can be seen in following
passage.
Loads on the flange can be calculated by:
𝐹𝑧,𝑓𝑙 = (𝐹𝑧,𝑡𝑜𝑝
𝛾𝑓+𝐹𝑧,𝑡𝑜𝑤𝑒𝑟(ℎ)
𝛾𝑓𝑒,𝑢) ∗ 0.9 (127)
Fz,fl : normal force – Design
Fz,top : design Load on the top
Fz,top : design Load on the h level
γf : safety factor
γfe,u : safety factor in the level
In order to simplified solution, only one flange connection will be discussed as it can be seen
in Figure 55,

P 96 Selcuk SAHIN
Master Thesis developed at West Pomeranian University of Technology, Szczecin, Poland and The Lloyd’s
Register Foundation Research Centre of Excellence, Pusan, Republic of Korea
Figure 55: Segment approach for design of ring flange connection (Achmus et al. n.d.)
Figure 56: Section view of connection (Kanbur 2014)
Geometrical values that will be used in the calculation can be seen in Figure 56. The yielding
stress of the flange material is depend on thickness. Basically thickness is defined as the
smallest value of the nominal height of the final machined flange that is measured on the outer
diameter side, also nominal width of the finished machined surface might be considered.
The ultimate limit state condition of the flange connection is performed based on both Petersen
and Seidel sections. The bolt pretension is disregarded. This is for simplification of the problem.

Wind Turbine Tower Structure Analysis According to Wind Load in Terms of Cost 97
“EMSHIP” Erasmus Mundus Master Course, period of study September 2014 – February 2016
This approach is quite conservative, due to opening of the flange connection and accompanying
plastic deformation will lead to some redistribution of forces and thereby decreased bolt
stresses.
In order to solve flange problems, some simplification were done. Therefore, basically 3
different failure mode assumptions were developed until now by Petersen. These failure modes
may be examined in Figure 57,
Figure 57: Failure modes of the simlified calculation method acc. to Petersen (Schaumann and Seidel
2000)
Figure 57 shows there are three main failure modes. These are shown by A, B and C. In mode
A; the bolt is yielding, in mode B; the bold and tower is yielding and in mode C; the flange is
yielding and the tower is yielding. In the following calculation method mode C is changed with
failure mode D and E. Mode D and E were developed by Seidel.
As it can be seen in Figure 58, L-flange (single sided) and T-flange (double sided) have different
geometries as well as conditions. As a result of these, same formulas cannot be applied to
foundation. Therefore, following calculations will be examined in two different conditions.
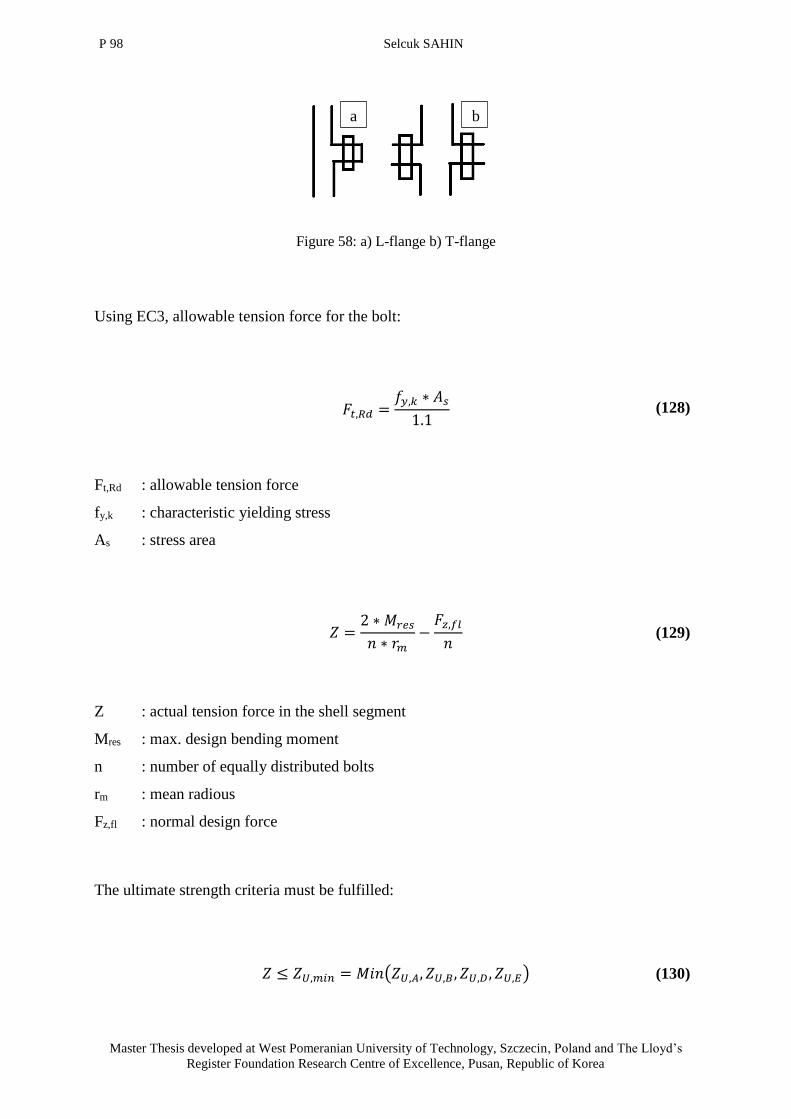
P 98 Selcuk SAHIN
Master Thesis developed at West Pomeranian University of Technology, Szczecin, Poland and The Lloyd’s
Register Foundation Research Centre of Excellence, Pusan, Republic of Korea
Figure 58: a) L-flange b) T-flange
Using EC3, allowable tension force for the bolt:
𝐹𝑡,𝑅𝑑 =𝑓𝑦,𝑘 ∗ 𝐴𝑠
1.1 (128)
Ft,Rd : allowable tension force
fy,k : characteristic yielding stress
As : stress area
𝑍 =2 ∗ 𝑀𝑟𝑒𝑠
𝑛 ∗ 𝑟𝑚−𝐹𝑧,𝑓𝑙
𝑛 (129)
Z : actual tension force in the shell segment
Mres : max. design bending moment
n : number of equally distributed bolts
rm : mean radious
Fz,fl : normal design force
The ultimate strength criteria must be fulfilled:
𝑍 ≤ 𝑍𝑈,𝑚𝑖𝑛 = 𝑀𝑖𝑛(𝑍𝑈,𝐴, 𝑍𝑈,𝐵, 𝑍𝑈,𝐷 , 𝑍𝑈,𝐸) (130)
a b
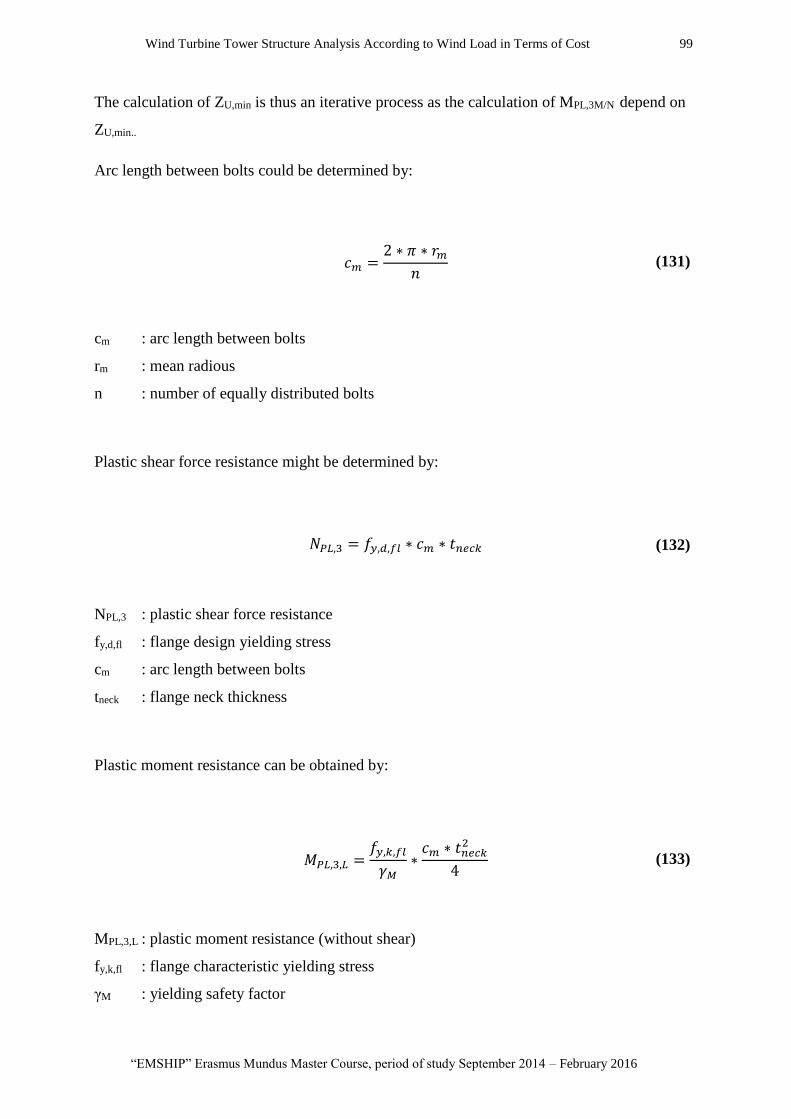
Wind Turbine Tower Structure Analysis According to Wind Load in Terms of Cost 99
“EMSHIP” Erasmus Mundus Master Course, period of study September 2014 – February 2016
The calculation of ZU,min is thus an iterative process as the calculation of MPL,3M/N depend on
ZU,min..
Arc length between bolts could be determined by:
𝑐𝑚 =2 ∗ 𝜋 ∗ 𝑟𝑚
𝑛 (131)
cm : arc length between bolts
rm : mean radious
n : number of equally distributed bolts
Plastic shear force resistance might be determined by:
𝑁𝑃𝐿,3 = 𝑓𝑦,𝑑,𝑓𝑙 ∗ 𝑐𝑚 ∗ 𝑡𝑛𝑒𝑐𝑘 (132)
NPL,3 : plastic shear force resistance
fy,d,fl : flange design yielding stress
cm : arc length between bolts
tneck : flange neck thickness
Plastic moment resistance can be obtained by:
𝑀𝑃𝐿,3,𝐿 =𝑓𝑦,𝑘,𝑓𝑙
𝛾𝑀∗𝑐𝑚 ∗ 𝑡𝑛𝑒𝑐𝑘
2
4 (133)
MPL,3,L : plastic moment resistance (without shear)
fy,k,fl : flange characteristic yielding stress
γM : yielding safety factor
P 100 Selcuk SAHIN
Master Thesis developed at West Pomeranian University of Technology, Szczecin, Poland and The Lloyd’s
Register Foundation Research Centre of Excellence, Pusan, Republic of Korea
cm : arc length between bolts
tneck : flange neck thickness
Plastic moment resistance could be expressed by:
𝑀𝑃𝐿,3,𝑀/𝑁 = (1 − (𝑍𝑈,𝑚𝑖𝑛
𝑁𝑃𝐿,3)
2
) ∗ 𝑀𝑃𝐿,3𝐿 (134)
MPL,3,M/N: plastic moment resistance
ZU,min : minimum allowable segment force
NPL,3 : plastic shear force resistance
MPL,3,L : plastic moment resistance (without shear)
Arc length between bolt center might be determined by:
𝑐 =2 ∗ 𝜋 ∗ 𝑟𝐵𝐶
𝑛 (135)
c : arc length between bolts
rBC : radious from bolt center
n : number of equally distributed bolts
Plastic moment resistance could be expressed by:
𝑀′𝑃𝐿,2 = 𝑓𝑦,𝑑,𝑓𝑙 ∗(𝑐 − 𝑑𝐻) ∗ 𝑡𝑓𝑙
2
4 (136)
Wind Turbine Tower Structure Analysis According to Wind Load in Terms of Cost 101
“EMSHIP” Erasmus Mundus Master Course, period of study September 2014 – February 2016
M’PL,2 : plastic moment resistance
fy,d,fl : flange design yielding stress
c : arc length between bolts
dH : hole size
tfl : flange thickness
∆𝑀𝑃𝐿,2 =𝐹𝑡,𝑅𝑑2
∗𝐷𝑤 + 𝑑𝐻
4 (137)
ΔMPL,2 : permutation of plastic moment resistance
Ft,Rd : allowable tension force
Dw : washer outer diameter
dH : hole size
tfl : flange thickness
Plastic moment resistance could be expressed by:
𝑀𝑃𝐿,2 =𝑐 ∗ 𝑡𝑓𝑙
2
2∗ 𝑓𝑦,𝑑,𝑓𝑙 (138)
MPL,2 : plastic moment resistance
c : arc length between bolts
tfl : flange thickness
fy,d,fl : flange design yielding stress
Correction factor resistance:
𝑏′𝐸 = 𝑏 −𝐷𝑤 + 𝑑𝐻
4 (139)

P 102 Selcuk SAHIN
Master Thesis developed at West Pomeranian University of Technology, Szczecin, Poland and The Lloyd’s
Register Foundation Research Centre of Excellence, Pusan, Republic of Korea
b’E : correction factor
b : distance from bolt center to mean radious of shell
Dw : washer outer diameter
dH : hole size
𝑉𝑃𝐿,3 =𝑓𝑦,𝑑,𝑓𝑙
√3∗ 𝑐𝑚 ∗ 𝑡𝑓𝑙 (140)
VPL,3 : plastic shear force resistance
fy,d,fl : flange design yielding stress
cm : arc length between bolts
tfl : flange thickness
𝑀𝑃𝐿,3,𝑇 =𝑓𝑦,𝑘,𝑓𝑙
𝛾𝑀∗𝑐𝑚 ∗ 𝑡𝑓𝑙
2
4 (141)
MPL,3,T : plastic moment resistance (without shear)
fy,k,fl : flange characteristic yielding stress
γM : yielding safety factor
cm : arc length between bolts
tfl : flange thickness
Plastic moment resistance could be expressed by:
𝑀𝑃𝐿,3,𝑀/𝑉 = (1 − (𝑍𝑈,𝑚𝑖𝑛
2 ∗ 𝑉𝑃𝐿,3)
2
) ∗ 𝑀𝑃𝐿,3𝑇 (142)
MPL,3,M/V: plastic moment resistance
ZU,min : minimum allowable segment force
Wind Turbine Tower Structure Analysis According to Wind Load in Terms of Cost 103
“EMSHIP” Erasmus Mundus Master Course, period of study September 2014 – February 2016
VPL,3 : plastic shear force resistance
MPL,3,T : plastic moment resistance (without shear)
4.4.1. L-flange (Single Sided) Calculations
Failure mode A, bolt rupture can be determined by:
𝑍𝑈,𝐴 = 𝐹𝑟,𝑅𝑑 (143)
Failure mode B, bolt rupture and plastic “hinges” in shell can be determined by:
𝑍𝑈,𝐵 =𝐹𝑟,𝑅𝑑 ∗ 𝑎 + 𝑀𝑃𝐿,3𝑀/𝑁
𝑏 (144)
Failure mode D, plastic “hinges” in shell and flange can be determined by:
𝑍𝑈,𝐷 =𝑀′𝑃𝐿,2 + ∆𝑀𝑃𝐿,2 ∗ 𝑎 + 𝑀𝑃𝐿,3𝑀/𝑁
𝑏 (145)
Failure mode E, plastic “hinges” in shell and flange can be determined by:
𝑍𝑈,𝐸 =𝑀𝑃𝐿,2 +𝑀𝑃𝐿,3𝑀/𝑁
𝑏′𝐸 (146)
ZU,A : allowable segment force mode A
ZU,B : allowable segment force mode B
ZU,D : allowable segment force mode D
ZU,E : allowable segment force mode E

P 104 Selcuk SAHIN
Master Thesis developed at West Pomeranian University of Technology, Szczecin, Poland and The Lloyd’s
Register Foundation Research Centre of Excellence, Pusan, Republic of Korea
Ft,Rd : allowable tension force
a : distance between bolt center and inner diameter of section
MPL,3,M/N: plastic moment resistance
b : distance from bolt center to mean radious of shell
M’PL,2 : plastic moment resistance
ΔMPL,2 : permutation of plastic moment resistance
b’E : correction factor
4.4.2. T-flange (Double Sided) Calculations
As it may observed in Figure 59, T-flange failure behavior has some similarity with L-flange
however there are some different also. Therefore failure modes formulas have to be modified.
Calculations can be seen in below.
Figure 59: T-flange failure modes (CEN (European Commitee for Standardization) 2007b)
Failure mode A, bolt rupture can be determined by:
𝑍𝑈,𝐴 = 2 ∗ 𝐹𝑟,𝑅𝑑 (147)

Wind Turbine Tower Structure Analysis According to Wind Load in Terms of Cost 105
“EMSHIP” Erasmus Mundus Master Course, period of study September 2014 – February 2016
Failure mode B, bolt rupture and plastic “hinges” in flange can be determined by:
𝑍𝑈,𝐵 = 2 ∗𝐹𝑟,𝑅𝑑 ∗ 𝑎 + 𝑀𝑃𝐿,3𝑀/𝑉
𝑎 + 𝑏 (148)
Failure mode D, plastic “hinges” in flange can be determined by:
𝑍𝑈,𝐷 = 2 ∗𝑀′𝑃𝐿,2 + ∆𝑀𝑃𝐿,2 +𝑀𝑃𝐿,3𝑀/𝑉
𝑏 (149)
Failure mode E, plastic “hinges” in flange can be determined by:
𝑍𝑈,𝐸 =𝑀𝑃𝐿,2 +𝑀𝑃𝐿,3𝑀/𝑉
𝑏′𝐸 (150)
ZU,A : allowable segment force mode A
ZU,B : allowable segment force mode B
ZU,D : allowable segment force mode D
ZU,E : allowable segment force mode E
Ft,Rd : allowable tension force
a : distance between bolt center and inner diameter of section
MPL,3,M/V: plastic moment resistance
b : distance from bolt center to mean radious of shell
M’PL,2 : plastic moment resistance
ΔMPL,2 : permutation of plastic moment resistance
b’E : correction factor

P 106 Selcuk SAHIN
Master Thesis developed at West Pomeranian University of Technology, Szczecin, Poland and The Lloyd’s
Register Foundation Research Centre of Excellence, Pusan, Republic of Korea
4.4.3. Geometric Restrictions
Geometric restrictions which were developed by Seidel must be satisfied. Therefore, each bolt
design must fulfill following criteria.
Characteristic yield strength of the bolt could be determined by:
𝐹𝑡,𝑅 = 𝑓𝑦,𝑘 ∗ 𝐴𝑠 (151)
Ft,R : characteristic yielding stress of the bolt
fy,k : characteristic yielding stress
As : stress area
Resistance for L-flange:
𝑀𝑝𝑙,3 = 𝑓𝑦,𝑘,𝑓𝑙 ∗𝑐𝑚 ∗ 𝑡𝑛𝑒𝑐𝑘
2
4 (152)
Resistance for T-flange:
𝑀𝑝𝑙,3 = 𝑓𝑦,𝑘,𝑓𝑙 ∗𝑐𝑚 ∗ 𝑡𝑓𝑙
2
4 (153)
Mpl,3 : plastic moment resistance
fy,k,fl : flange characteristic yielding stress
cm : arc length between bolts
tneck : flange neck thickness
𝑡𝑓𝑙,𝑚𝑖𝑛 = 𝑡𝐵 ∗ √𝑎
1.25 ∗ 𝑏 (154)

Wind Turbine Tower Structure Analysis According to Wind Load in Terms of Cost 107
“EMSHIP” Erasmus Mundus Master Course, period of study September 2014 – February 2016
𝑡𝐵 ≥ √
𝐹𝑡,𝑅 ∗ 𝑀𝑝𝑙,3
𝑎 + 𝑏∗ 8 ∗ 𝑏 − 𝐹𝑡,𝑅 ∗ (𝐷𝑤 + 𝑑𝐻) − 8 ∗ 𝑀𝑝𝑙,3
2 ∗ (𝑐 − 𝑑𝐻) ∗ 𝑓𝑦,𝑘,𝑓𝑙
(155)
Maximum flange width must be:
𝑎 ≤ 3 ∗ 𝑏 (156)
tfl,min : minimum flange thickness
tB : bolt ratio
a : distance between bolt center and inner diameter of section
b : distance from bolt center to mean radious of shell
Ft,R : characteristic yielding stress of the bolt
Mpl,3 : plastic moment resistance
Dw : washer outer diameter
dH : hole size
c : arc length between bolts
fy,k,fl : flange characteristic yielding stress
If below condition is satisfied, above restrictions have not need to provided:
𝑍𝑈,𝐴 ≤ 𝑍𝑈,𝐵 ≤ 𝑍𝑈,𝐷 ≤ 𝑍𝑈,𝐸 (157)
4.4.4. Results
Regarding all these restrictions and rules presented above, following table was generated.
Minimum forces for different failure modes can be seen in Table 21,
Table 21: Failure mode calculation results

P 108 Selcuk SAHIN
Master Thesis developed at West Pomeranian University of Technology, Szczecin, Poland and The Lloyd’s
Register Foundation Research Centre of Excellence, Pusan, Republic of Korea
Bottom Bottom
Middle
Top
Middle
Min. Allow. Force Failure Mode A 1176 588 588 [kN]
Min. Allow. Force Failure Mode B 1072 425 378 [kN]
Min. Allow. Force Failure Mode C - - - [kN]
Min. Allow. Force Failure Mode D 416 450 671 [kN]
Min. Allow. Force Failure Mode E 735 1657 1993 [kN]
ZU,min Minimum Allowable Seg. Force Min.
ZU
416 425 378 [kN]
Eurocode Restriction 1 ok ok ok
Eurocode Restriction 2 ok ok ok
Using Table 21, stress reserve factors might be drawn like Figure 60,
Figure 60: SRF’s for bolt and flange

Wind Turbine Tower Structure Analysis According to Wind Load in Terms of Cost 109
“EMSHIP” Erasmus Mundus Master Course, period of study September 2014 – February 2016
5. ULTIMATE STRENGTH OF CYLINDRICAL TOWERS WITH
OPENING IN WIND TURBINE STRUCTURES
Door opening is one of the most critical aspects of the tower. Lack of proper estimation for door
openings may lead to severe accidents that may result in huge damages. It can be stated that
when a tower is considered to be a tube, an opening is the gap on the tower. The analyses were
done based on the assumption that a door opening is a hole on the tower. The importance of the
door opening on a tower can be understand clearly from Figure 61.
Figure 61: Wind tower accident due to wrong door opening estimatiıon (“WindAction | Wind
Turbines and Public Safety: Setbacks Matter” n.d.)
The aims of this study are to numerically evaluate the effect of design parameters such as door
shape, height, width, with or without stiffeners on the ultimate strength of cylindrical wind
turbine structures and to efficiently find ideal dimensions of door openings.
The findings of the research have the potential to enhance the structural design and safety
assessment of wind turbine structures with door openings.
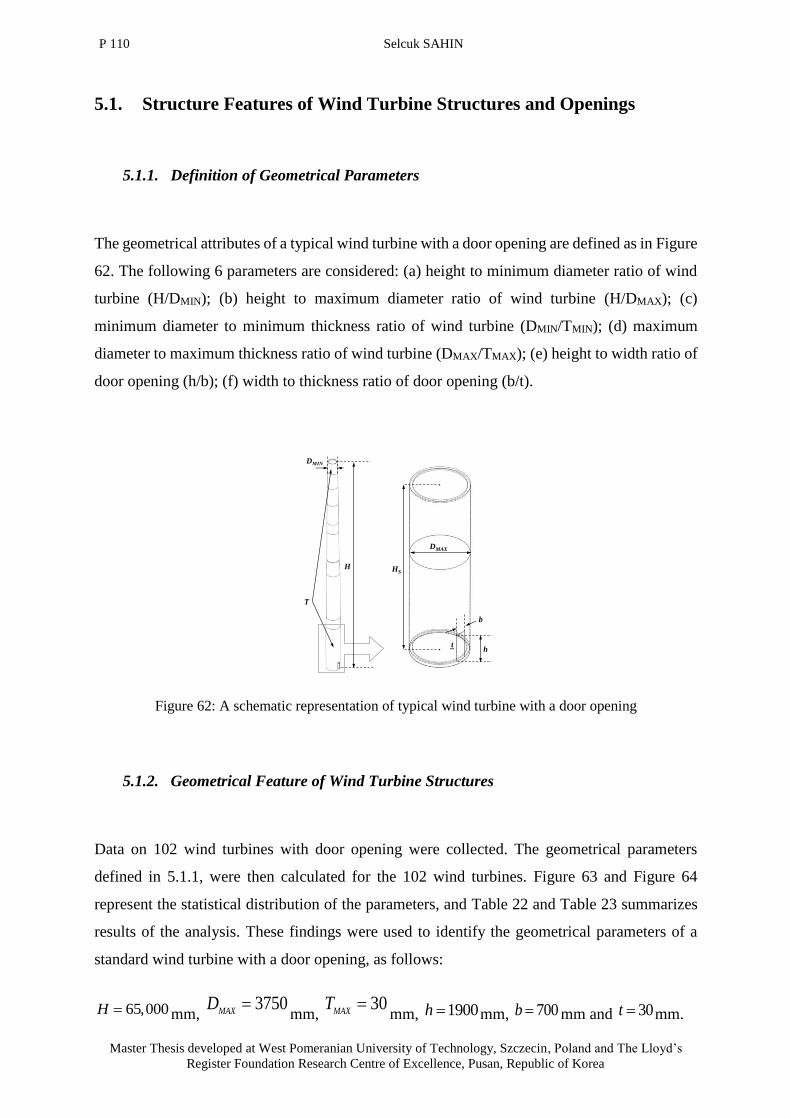
P 110 Selcuk SAHIN
Master Thesis developed at West Pomeranian University of Technology, Szczecin, Poland and The Lloyd’s
Register Foundation Research Centre of Excellence, Pusan, Republic of Korea
5.1. Structure Features of Wind Turbine Structures and Openings
5.1.1. Definition of Geometrical Parameters
The geometrical attributes of a typical wind turbine with a door opening are defined as in Figure
62. The following 6 parameters are considered: (a) height to minimum diameter ratio of wind
turbine (H/DMIN); (b) height to maximum diameter ratio of wind turbine (H/DMAX); (c)
minimum diameter to minimum thickness ratio of wind turbine (DMIN/TMIN); (d) maximum
diameter to maximum thickness ratio of wind turbine (DMAX/TMAX); (e) height to width ratio of
door opening (h/b); (f) width to thickness ratio of door opening (b/t).
Figure 62: A schematic representation of typical wind turbine with a door opening
5.1.2. Geometrical Feature of Wind Turbine Structures
Data on 102 wind turbines with door opening were collected. The geometrical parameters
defined in 5.1.1, were then calculated for the 102 wind turbines. Figure 63 and Figure 64
represent the statistical distribution of the parameters, and Table 22 and Table 23 summarizes
results of the analysis. These findings were used to identify the geometrical parameters of a
standard wind turbine with a door opening, as follows:
65,000H mm, 3750
MAXD
mm, 30
MAXT
mm, 1900h mm, 700b mm and 30t mm.
H
DMAX
DMIN
h
b
HS
T
t~

Wind Turbine Tower Structure Analysis According to Wind Load in Terms of Cost 111
“EMSHIP” Erasmus Mundus Master Course, period of study September 2014 – February 2016
Figure 63 and Figure 64 illustrate data management, one can figure out how values are
managed.
Figure 63: Geometrical characteristics of wind turbine and door opening: (a) capacity; (b) height of
wind turbine; (c) maximum diameter of wind turbine; (d) minimum diameter of wind turbine; (e)
minimum thickness of wind turbine; (f) maximum thickness of wind turbine; (g) height of door
opening; (h) width of door opening; (i) thickness of door opening
-1 0 1 2 3 4 5 6 7
0.0
0.1
0.2
0.3
0.4
0.5
Rel
ati
ve
freq
uen
cy
Capacity (MW)
Rel
ati
ve
freq
uen
cy
DMIN (m)
1.2 1.6 2.0 2.4 2.8 3.2 3.6
0.0
0.1
0.2
0.3
0.4
0.5
Rel
ati
ve
freq
uen
cy
DMAX (m)
2 3 4 5 6 7
0.0
0.1
0.2
0.3
0.4
0.5
Rel
ati
ve
freq
uen
cy
TMIN (mm)
8 12 16 20 24
0.0
0.1
0.2
0.3
0.4
0.5
Rel
ati
ve
freq
uen
cy
h (m)
1.2 1.6 2.0 2.4 2.8 3.2 3.6
0.0
0.1
0.2
0.3
0.4
0.5
Rel
ati
ve
freq
uen
cy
t (mm)
12 16 20 24 28 32 36 40 44 48
0.0
0.2
0.4
0.6
(a) (b) (c)
(d) (e) (f)
(g) (h) (i)
20 40 60 80 100 120
0.0
0.1
0.2
0.3
0.4
0.5
Rel
ati
ve
freq
uen
cy
H (m)
10 20 30 40 50
0.0
0.2
0.4
0.6
0.8
Rel
ati
ve
freq
uen
cy
TMAX (mm)
480 600 720 840 960 1080 1200
0.0
0.1
0.2
0.3
0.4
0.5
Rel
ati
ve
freq
uen
cy
b (mm)

P 112 Selcuk SAHIN
Master Thesis developed at West Pomeranian University of Technology, Szczecin, Poland and The Lloyd’s
Register Foundation Research Centre of Excellence, Pusan, Republic of Korea
Figure 64: Geometrical characteristics of wind turbine and door opening: (a) height to minimum
diameter ratio of wind turbine; (b) height to maximum diameter ratio of wind turbine; (c) minimum
diameter to minimum thickness ratio of wind turbine; (d) maximum diameter to maximum thickness
ratio of wind turbine; (e) height to width ratio of door opening; (f) width to thickness ratio of door
opening
Most probable results of turbine and door opening can be observed in Table 22 and Table 23,
Table 22: Actual range and the most probable dimensions of wind turbine and door opening
Variable Range Most probable
Capacity (MW) 0.5~5.0 2.5
H (mm) 37,000~100,000 65,000
MIND
(mm) 1,600~3,000 2,300
MAXD
(mm) 2,610~6,000 3,750
MINT
(mm) 10~20 15
MAXT
(mm) 16~40 30
Rel
ati
ve
freq
uen
cy
H/DMIN
16 24 32 40 48
0.0
0.1
0.2
0.3
0.4
0.5
Rel
ati
ve
freq
uen
cy
H/DMAX
12 18 24 30
0.0
0.1
0.2
0.3
0.4
0.5
Rel
ati
ve
freq
uen
cy
DMIN/TMIN
80 120 160 200 240 280
0.0
0.1
0.2
0.3
0.4
0.5
Rel
ati
ve
freq
uen
cy
DMAX/TMAX
80 120 160 200 240
0.0
0.1
0.2
0.3
0.4
0.5
Rel
ati
ve
freq
uen
cy
h/b
2.0 2.5 3.0 3.5 4.0
0.0
0.1
0.2
0.3
0.4
0.5
16 20 24 28 32 36
0.0
0.1
0.2
0.3
0.4
0.5
Rel
ati
ve
freq
uen
cy
b/t
(a) (b) (c)
(d) (e) (f)

Wind Turbine Tower Structure Analysis According to Wind Load in Terms of Cost 113
“EMSHIP” Erasmus Mundus Master Course, period of study September 2014 – February 2016
h (mm) 1,640~2,900 1,900
b (mm) 620~1,100 700
t (mm) 16~40 30.0
Table 23: Actual range and the most probable ratio of wind turbine and door opening
Variable Range Most probable
/MIN
H D
17.5~42.1 30.0
/MAX
H D
12.0~27.7 19.0
/MIN MIN
D T
100.0~250.0 170.0
/MAX MAX
D T
95.7~222.2 110.0
/h b 2.2~3.8 2.875
/b t 19.1~43.8 25.0
5.2. Nonlinear Finite Element Modelling
In this part of the report, door opening analyses of the tower will be investigated. During the
analyses, welded parts are neglected therefore strength of the connection is more than normal.
However, lifetime decreases.
5.2.1. Finite Element Model
A wind turbine with the door opening detailed in section 5.1.2 is regarded as subjected to
bending moment in x-axis as shown in Figure 65,

P 114 Selcuk SAHIN
Master Thesis developed at West Pomeranian University of Technology, Szczecin, Poland and The Lloyd’s
Register Foundation Research Centre of Excellence, Pusan, Republic of Korea
Figure 65: A schematic representations of typical and applied geometries for the standard turbine with
the door opening: (a) nomenclature; (b) typical geometry and applied loading.
Nonlinear finite element analysis is performed using ANSYS (2015), to accommodate both
geometrical and material nonlinearities. The SOLID185 element, which has eight nodes with
three degrees of freedom at each node, is used to model the wind turbine. The wind turbine is
modelled based on the result of quasi-static material test as shown in Figure 65. The material is
mild steel with an elastic modulus E of 205.8 GPa; a Poisson’s ratio of ν 0.3; and a yield strength
σY of 299 MPa.
The maximum magnitude of initial deflection w0 is assumed to be 30% of the thickness of the
wind turbine; that is, the eigenvalue buckling mode is used to determine the shape of the initial
deflection. Figure 66 provides an example of the smallest buckling mode near the door opening
obtained from the eigenvalue buckling analysis.
Figure 66: An example of 1st buckling mode under pure bending moment in x-axis
xy
h
b
HS
t~
DMAX
R
z
O
Mx
x
zMx
O
(a) (b)
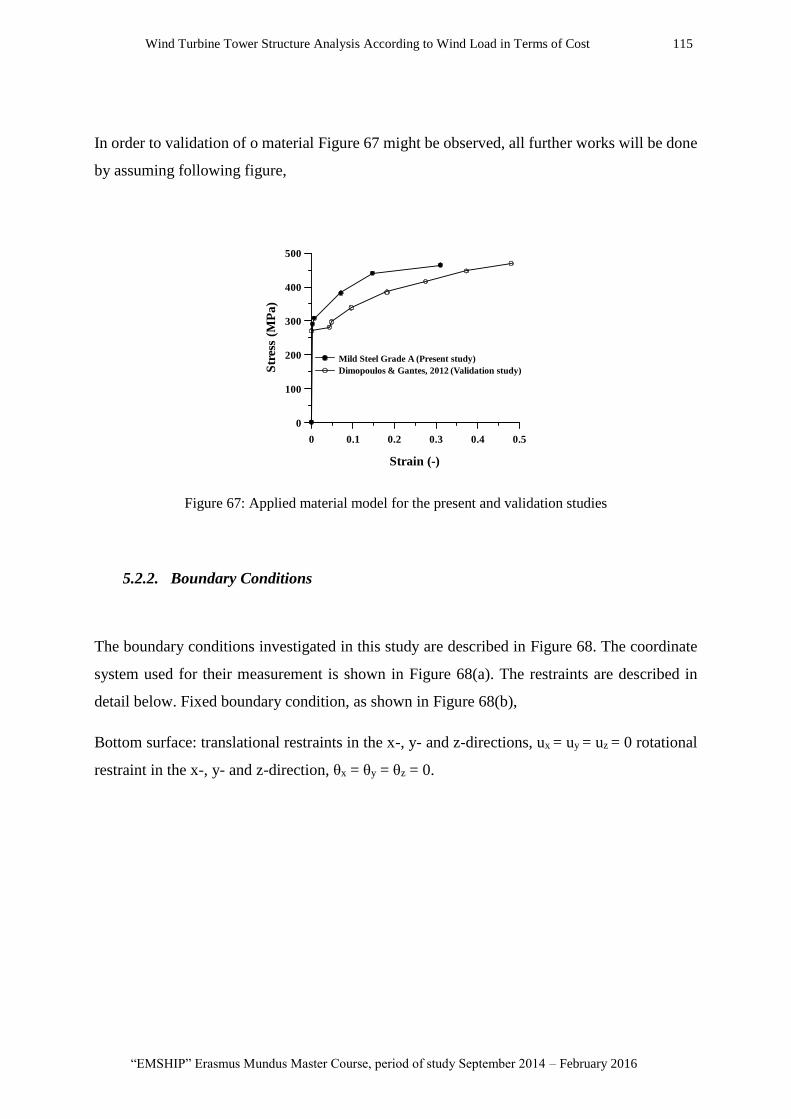
Wind Turbine Tower Structure Analysis According to Wind Load in Terms of Cost 115
“EMSHIP” Erasmus Mundus Master Course, period of study September 2014 – February 2016
In order to validation of o material Figure 67 might be observed, all further works will be done
by assuming following figure,
Figure 67: Applied material model for the present and validation studies
5.2.2. Boundary Conditions
The boundary conditions investigated in this study are described in Figure 68. The coordinate
system used for their measurement is shown in Figure 68(a). The restraints are described in
detail below. Fixed boundary condition, as shown in Figure 68(b),
Bottom surface: translational restraints in the x-, y- and z-directions, ux = uy = uz = 0 rotational
restraint in the x-, y- and z-direction, θx = θy = θz = 0.
0 0.1 0.2 0.3 0.4 0.5
0
100
200
300
400
500
Str
ess
(MP
a)
Strain (-)
Mild Steel Grade A (Present study)
Dimopoulos & Gantes, 2012 (Validation study)

P 116 Selcuk SAHIN
Master Thesis developed at West Pomeranian University of Technology, Szczecin, Poland and The Lloyd’s
Register Foundation Research Centre of Excellence, Pusan, Republic of Korea
Figure 68: Coordinate system and applied boundary conditions of the wind turbine: (a) coordinate
system; (b) fixed.
5.2.3. Mesh-Convergence Study
This section presents the results of mesh-convergence analysis of the wind turbine for 6-type
of element sizes when σY = 299 MPa and W0 = 0.3tb, as shown in Figure 69. The ultimate
bending moments about each element size are summarized in Figure 70. Approximately 35,000
elements are sufficient to estimate the ultimate bending moment of the wind turbine.
Figure 69: Results of mesh-convergence study for DMAX x HS = 3750 x 12655 mm, h x b x t x R =
1950 x 700 x 30 x 100 mm, σY = 299 MPa, w0 = 0.3t : (a) bending moment; (b) deformation
x
zMx
ux=uy=uz=θx=θy=θz= 0x y
z
Oθx
θy
θz
0.0 0.5 1.0 1.5 2.0 2.5 3.0
0
30
60
90
120
Ben
din
g m
om
ent
(MN
m)
Angle (deg)
Element size= 100mmElement size= 80mmElement size= 70mmElement size= 60mmElement size= 40mmElement size= 20mm
σY= 299 MPa, E= 205.8 GPa, ν= 0.3, wo/t= 0.3
(a) (b)
0.0 0.5 1.0 1.5 2.0 2.5 3.0
0
60
120
180
240
300
Def
orm
ati
on
(m
m)
Angle (deg)
Element size= 100mmElement size= 80mmElement size= 70mmElement size= 60mmElement size= 40mmElement size= 20mm
DMAX x HS x b x h x t x R=
3750 x 12655 x 1900 x 700 x 30 x 100 mm
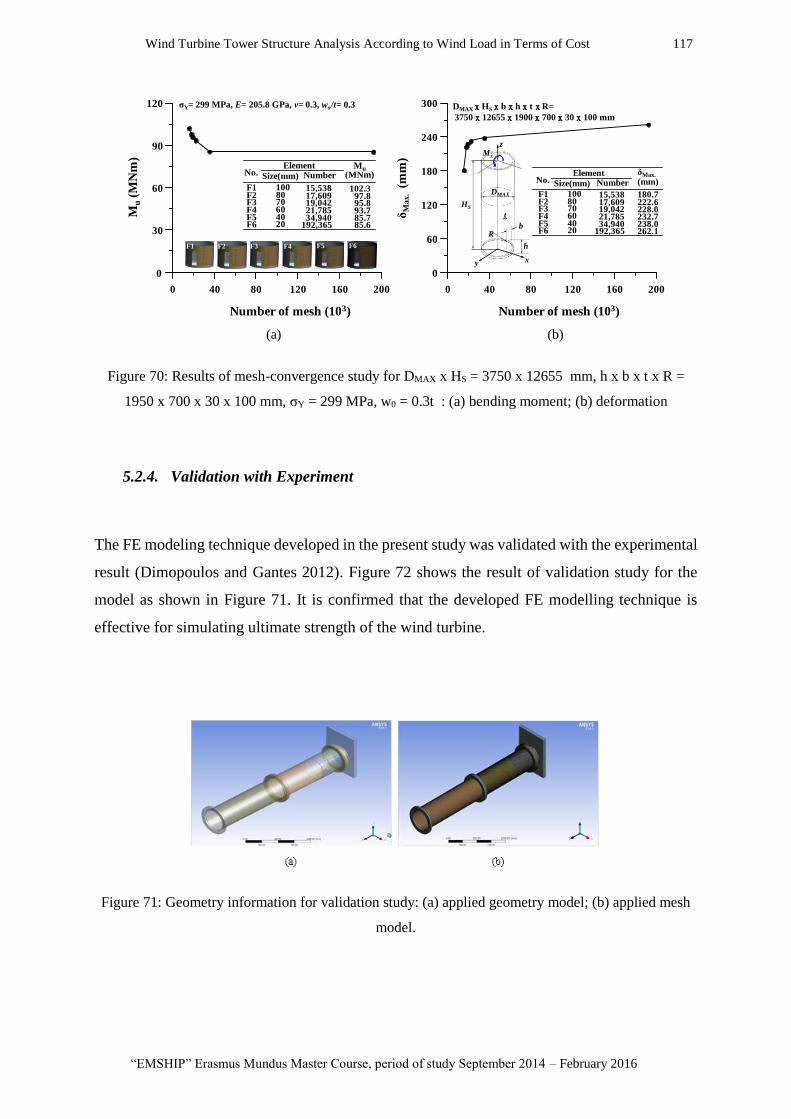
Wind Turbine Tower Structure Analysis According to Wind Load in Terms of Cost 117
“EMSHIP” Erasmus Mundus Master Course, period of study September 2014 – February 2016
Figure 70: Results of mesh-convergence study for DMAX x HS = 3750 x 12655 mm, h x b x t x R =
1950 x 700 x 30 x 100 mm, σY = 299 MPa, w0 = 0.3t : (a) bending moment; (b) deformation
5.2.4. Validation with Experiment
The FE modeling technique developed in the present study was validated with the experimental
result (Dimopoulos and Gantes 2012). Figure 72 shows the result of validation study for the
model as shown in Figure 71. It is confirmed that the developed FE modelling technique is
effective for simulating ultimate strength of the wind turbine.
Figure 71: Geometry information for validation study: (a) applied geometry model; (b) applied mesh
model.
0 40 80 120 160 200
0
30
60
90
120
Mu
(MN
m)
Number of mesh (103)
No. NumberMu
(MNm)
F1F2F3F4F5F6
15,53817,60919,04221,78534,940
192,365
102.397.895.893.785.785.6
Size(mm)
1008070604020
Element
F1 F2 F3 F4 F5 F6
σY= 299 MPa, E= 205.8 GPa, ν= 0.3, wo/t= 0.3
(a) (b)
0 40 80 120 160 200
0
60
120
180
240
300
δM
ax
.(m
m)
Number of mesh (103)
δMax.
(mm)
180.7222.6228.0232.7238.0262.1
No. Number
F1F2F3F4F5F6
15,53817,60919,04221,78534,940
192,365
Size(mm)
1008070604020
Element
DMAX x HS x b x h x t x R=
3750 x 12655 x 1900 x 700 x 30 x 100 mm
y x
zMx
h
b
HS
t~
DMAX
R

P 118 Selcuk SAHIN
Master Thesis developed at West Pomeranian University of Technology, Szczecin, Poland and The Lloyd’s
Register Foundation Research Centre of Excellence, Pusan, Republic of Korea
Figure 72: Validation study on developed FE modelling technique (Dimopoulos and Gantes 2012)
5.3. Effect of Opening Shapes
To investigate the effect of opening shape on the ultimate strength of the wind turbine, four-
type of shapes including no opening, rectangular, elliptical and combination of half-rectangular
and half-elliptical were considered. To examine accurate comparison, the shape varied from
dimensions of the standard door opening, h x b x t = 30 mm. Applied geometries are presented
in Figure 73.
Figure 74 illustrates the numerical results for four-type of the door opening shapes in terms of
1st buckling mode, stress distribution and total deformation. Figure 75 describes the
comparison of the bending moment against the no opening model. It is found that the reduction
rate of ultimate strength occurs significantly and the elliptical shape appears the lowest
reduction rate. However, it is surmised that the half-rectangular and elliptical model is more
proper for considering practical purposes.
0.00 0.02 0.04 0.06 0.08 0.10 0.12
0
10
20
30
40
50
60
70
Exp1 (Dimopoulos& Gantes, 2012)
Exp2 (Dimopoulos & Gantes, 2012)
ANSYS (Present study)F
orc
e (k
N)
Displacement (m)
σY= 270 MPa, E= 208 GPa, ν= 0.3, wo/t= 0.3
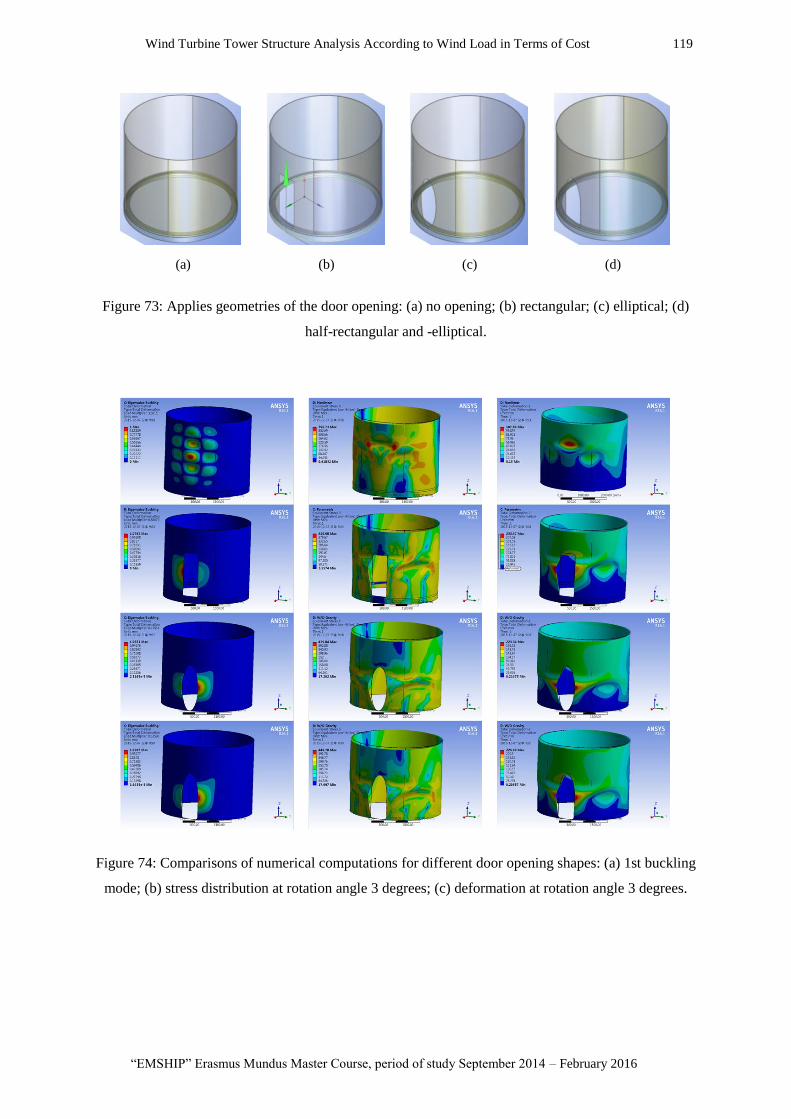
Wind Turbine Tower Structure Analysis According to Wind Load in Terms of Cost 119
“EMSHIP” Erasmus Mundus Master Course, period of study September 2014 – February 2016
Figure 73: Applies geometries of the door opening: (a) no opening; (b) rectangular; (c) elliptical; (d)
half-rectangular and -elliptical.
Figure 74: Comparisons of numerical computations for different door opening shapes: (a) 1st buckling
mode; (b) stress distribution at rotation angle 3 degrees; (c) deformation at rotation angle 3 degrees.
(a) (c)(b) (d)

P 120 Selcuk SAHIN
Master Thesis developed at West Pomeranian University of Technology, Szczecin, Poland and The Lloyd’s
Register Foundation Research Centre of Excellence, Pusan, Republic of Korea
Figure 75: Comparisons of bending moment for different shapes of the door opening.
5.4. Effect of Stiffeners
To identity the effect of stiffener on the ultimate strength of half-rectangular and -elliptical door
opening, three-type of stiffeners including edge stiffener, flat bar stiffener and door-shaped
stiffener were considered. Applied geometries are presented in Figure 76. For simplicity, the
cross section of the stiffener is assumed as a flat-bar and its dimension is hw x tw = 50 x 30 mm.
Figure 77 illustrates the numerical results for three-type of the door opening shapes with
different stiffeners in terms of 1st buckling mode, stress distribution and total deformation.
Figure 78 describes the comparison of the bending moment against the no opening model. It is
found that the reduction rate of ultimate strength could be decreased by adding stiffeners. It is
observed that approximately, 10% of ultimate strength has been enhanced in case of edge-
stiffener and flat-bar stiffener.

Wind Turbine Tower Structure Analysis According to Wind Load in Terms of Cost 121
“EMSHIP” Erasmus Mundus Master Course, period of study September 2014 – February 2016
Figure 76: Applied stiffener geometries of the door opening: (a) no stiffener; (b) edge stiffener; (c)
flat-bar stiffener; (d) door-shaped stiffener
Figure 77: Comparisons of numerical computations for different stiffeners: (a) 1st buckling mode; (b)
stress distribution at rotation angle 3 degrees; (c) deformation at rotation angle 3 degrees

P 122 Selcuk SAHIN
Master Thesis developed at West Pomeranian University of Technology, Szczecin, Poland and The Lloyd’s
Register Foundation Research Centre of Excellence, Pusan, Republic of Korea
Figure 78: Comparisons of bending moment for different stiffeners of the door opening
5.5. Ideal Door Opening
As a result of all these FEM analysis, ideal door shape of the tower has been decided and it can
be seen in Figure 79. As it was mentioned above the geometrical parameters of a standard wind
turbine with a door opening, as follows:
65,000H mm, 3750
MAXD
mm, 30
MAXT
mm, 1900h mm, 700b mm and 30t mm.
These values were chosen because of the Figure 63 and Figure 64. For details Table 22 and
Table 23 might be seen. As it can be seen above, total length of the tower is too high. Therefore,
meshing is quite important. In Figure 70, converged mesh size has been found and it is around
35000 elements. In order to understand, results that was found is acceptable and applicable,
validation was done. Figure 72 illustrates that tower values are strong enough compare with
real cases. Then effect of the door opening was examined. As it is shown in Figure 73, four
different types of door opening were examined. As a result of this evaluation, “elliptical” and
“half rectangular and half elliptical” models gave best two results. For details, Figure 75 might
be seen. Considering to accessibility of door opening and production “half rectangular and half
elliptical” model was the most satisfied model. In order to improve door strength, stiffeners
should be applied on the door opening. Figure 76 illustrates stiffener types that were being
h x b x R = 1950 x 700 x 100 mm
hw x tw= 50 x 30 mm
σY= 299 MPa, E= 205.8 GPa, ν= 0.3, wo/t= 0.3
0.0 0.5 1.0 1.5 2.0 2.5 3.0
0
40
80
120
160
Ben
din
g m
om
ent
(MN
m)
Angle (deg)
Model Mu (MNm)
No openingRectangular + EllipticalWith Stiffener IWith Stiffener II
105.6688.37 / 83.6%98.45 / 93.2%99.23 / 93.9%
With Stiffener III 95.22 / 90.1%

Wind Turbine Tower Structure Analysis According to Wind Load in Terms of Cost 123
“EMSHIP” Erasmus Mundus Master Course, period of study September 2014 – February 2016
planned to apply. Figure 78 shows that most considerable result is stiffener II. This model also
easiest applicable model. Chosen model can be seen in Figure 79.
Figure 79: Final door model
6. COST ANALYSIS
This section of thesis covers cost analysis. However it should be stated that calculations and
estimations were done rather roughly. This fact is resulted from the time limitation of the work
and strict confidentiality policies of the companies. Despite the fact that several companies were
contacted, internal regulations and market condition, the companies were reluctant to share
these information. Therefore estimations and analysis presented in this section were done
theoretically. Also final results were obtained based on a similar wind tower which has similar
dimensions and features. It is fair to state that results may be misleading, further research is
required for more valid outcomes.
According to (Lanier and Way 2005), main costs for wind turbine:
Construction of a road to the tower locations
Construction of site construction offices and furnishings
Recruitment of management personnel and labor for the tower construction effort
Design of any special construction equipment needed
Mobilization, monthly rental, and operating costs for cranes
Equipment move-in costs

P 124 Selcuk SAHIN
Master Thesis developed at West Pomeranian University of Technology, Szczecin, Poland and The Lloyd’s
Register Foundation Research Centre of Excellence, Pusan, Republic of Korea
Construction project mobilization costs
Foundation construction
Steel tube tower fabrication, shipping, site assembly, and erection
Precast concrete fabrication, shipping, site erection, and integration
Semi-self-erection of hybrid steel/concrete tower
Erection and installation of turbine nacelle, hub and rotor (but not the procurement cost
for these elements)
Final installation and touch up.
As it can be seen above, many different aspects make sense on the cost. Therefore, there is no
chance to talk about only one cost. This situation effects market in a competitive way. As a
result of this, companies are not open to share their cost approach so much. On the other hand,
prices for articles that might be seen above, it may illustrate big different due to location. For
instance, labor cost in Germany and labor cost in Kenya has big difference.
6.1. Fabrication Cost
According to (Jármai and Farkas 1999), fabrication cost of welded structures can be estimated
by following method.
𝐾 = 𝐾𝑚 + 𝐾𝑓 = 𝑘𝑚 ∗ 𝜌 ∗ 𝑉 + 𝑘𝑓∑𝑇𝑖𝑖
(158)
Where,
K : cost function
Km : material cost
Kf : fabrication cost
km : material cost factor
kf : fabrication cost factor
ρ : density of the material
V : volume of the structure
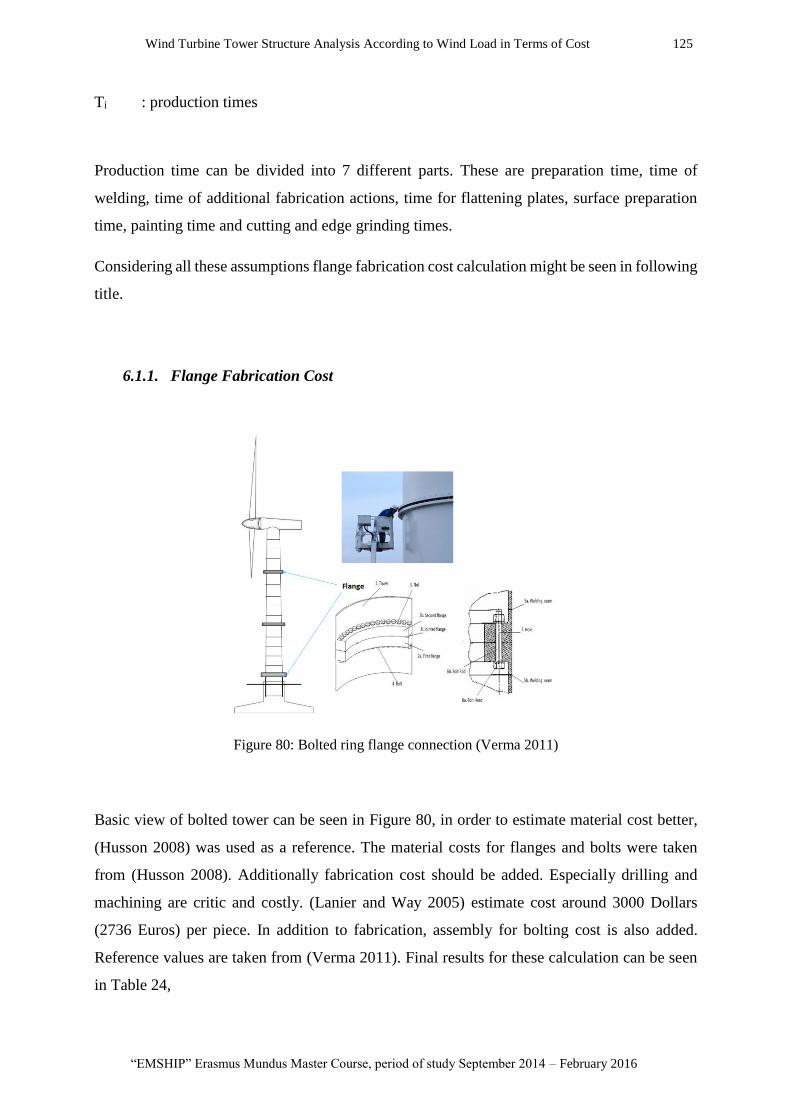
Wind Turbine Tower Structure Analysis According to Wind Load in Terms of Cost 125
“EMSHIP” Erasmus Mundus Master Course, period of study September 2014 – February 2016
Ti : production times
Production time can be divided into 7 different parts. These are preparation time, time of
welding, time of additional fabrication actions, time for flattening plates, surface preparation
time, painting time and cutting and edge grinding times.
Considering all these assumptions flange fabrication cost calculation might be seen in following
title.
6.1.1. Flange Fabrication Cost
Figure 80: Bolted ring flange connection (Verma 2011)
Basic view of bolted tower can be seen in Figure 80, in order to estimate material cost better,
(Husson 2008) was used as a reference. The material costs for flanges and bolts were taken
from (Husson 2008). Additionally fabrication cost should be added. Especially drilling and
machining are critic and costly. (Lanier and Way 2005) estimate cost around 3000 Dollars
(2736 Euros) per piece. In addition to fabrication, assembly for bolting cost is also added.
Reference values are taken from (Verma 2011). Final results for these calculation can be seen
in Table 24,
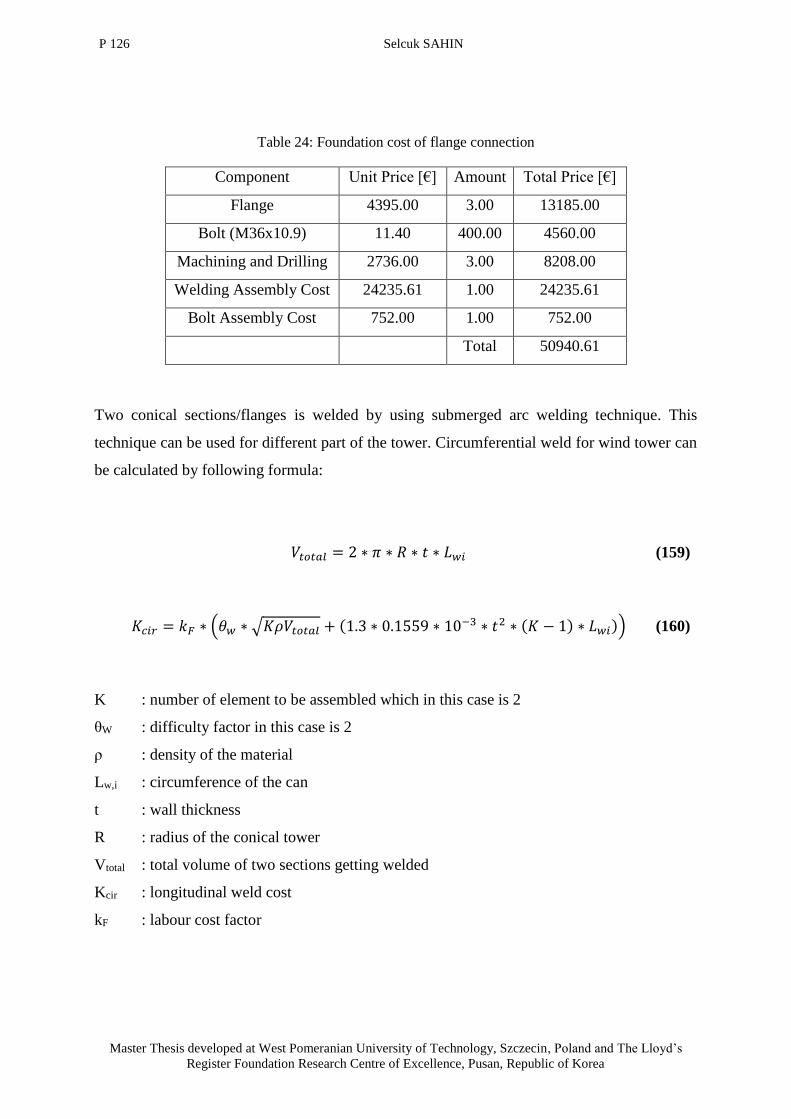
P 126 Selcuk SAHIN
Master Thesis developed at West Pomeranian University of Technology, Szczecin, Poland and The Lloyd’s
Register Foundation Research Centre of Excellence, Pusan, Republic of Korea
Table 24: Foundation cost of flange connection
Component Unit Price [€] Amount Total Price [€]
Flange 4395.00 3.00 13185.00
Bolt (M36x10.9) 11.40 400.00 4560.00
Machining and Drilling 2736.00 3.00 8208.00
Welding Assembly Cost 24235.61 1.00 24235.61
Bolt Assembly Cost 752.00 1.00 752.00
Total 50940.61
Two conical sections/flanges is welded by using submerged arc welding technique. This
technique can be used for different part of the tower. Circumferential weld for wind tower can
be calculated by following formula:
𝑉𝑡𝑜𝑡𝑎𝑙 = 2 ∗ 𝜋 ∗ 𝑅 ∗ 𝑡 ∗ 𝐿𝑤𝑖 (159)
𝐾𝑐𝑖𝑟 = 𝑘𝐹 ∗ (𝜃𝑤 ∗ √𝐾𝜌𝑉𝑡𝑜𝑡𝑎𝑙 + (1.3 ∗ 0.1559 ∗ 10−3 ∗ 𝑡2 ∗ (𝐾 − 1) ∗ 𝐿𝑤𝑖)) (160)
K : number of element to be assembled which in this case is 2
θW : difficulty factor in this case is 2
ρ : density of the material
Lw,i : circumference of the can
t : wall thickness
R : radius of the conical tower
Vtotal : total volume of two sections getting welded
Kcir : longitudinal weld cost
kF : labour cost factor
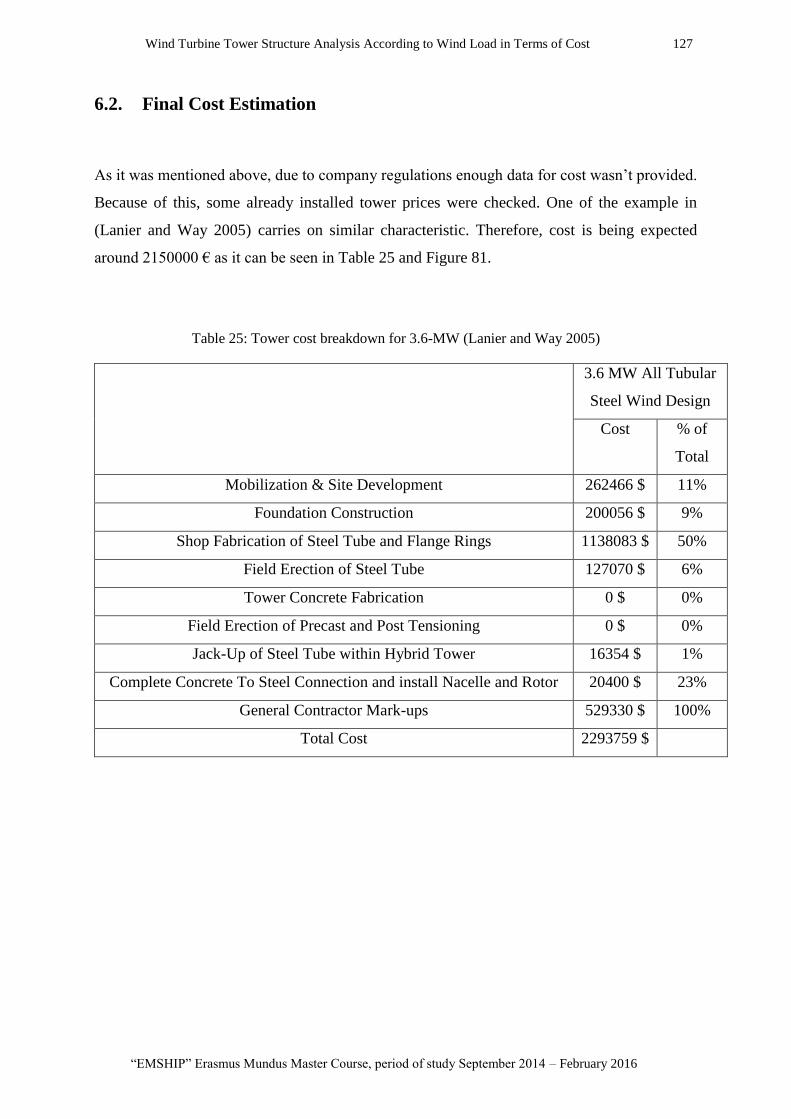
Wind Turbine Tower Structure Analysis According to Wind Load in Terms of Cost 127
“EMSHIP” Erasmus Mundus Master Course, period of study September 2014 – February 2016
6.2. Final Cost Estimation
As it was mentioned above, due to company regulations enough data for cost wasn’t provided.
Because of this, some already installed tower prices were checked. One of the example in
(Lanier and Way 2005) carries on similar characteristic. Therefore, cost is being expected
around 2150000 € as it can be seen in Table 25 and Figure 81.
Table 25: Tower cost breakdown for 3.6-MW (Lanier and Way 2005)
3.6 MW All Tubular
Steel Wind Design
Cost % of
Total
Mobilization & Site Development 262466 $ 11%
Foundation Construction 200056 $ 9%
Shop Fabrication of Steel Tube and Flange Rings 1138083 $ 50%
Field Erection of Steel Tube 127070 $ 6%
Tower Concrete Fabrication 0 $ 0%
Field Erection of Precast and Post Tensioning 0 $ 0%
Jack-Up of Steel Tube within Hybrid Tower 16354 $ 1%
Complete Concrete To Steel Connection and install Nacelle and Rotor 20400 $ 23%
General Contractor Mark-ups 529330 $ 100%
Total Cost 2293759 $

P 128 Selcuk SAHIN
Master Thesis developed at West Pomeranian University of Technology, Szczecin, Poland and The Lloyd’s
Register Foundation Research Centre of Excellence, Pusan, Republic of Korea
Figure 81: Wind turbine tower cost comparisons for 3.6-MW (Lanier and Way 2005)

Wind Turbine Tower Structure Analysis According to Wind Load in Terms of Cost 129
“EMSHIP” Erasmus Mundus Master Course, period of study September 2014 – February 2016
7. CONCLUSION AND DISCUSSION
The presented work covers the design of wind turbine tower and its door opening based on
standards and present models in the market. The calculations and results are already presented
in the thesis and appendices. As a summary, it can be stated that data is gathered and based on
the conducted research, the most common tower was selected. The selected tower is modelled
and modified based on the standards. Calculations based on previous experimental
measurements were carried out on yielding, buckling, dynamic and fatigue providing the
standards. The most critical location of the tower was assumed to be door opening. FEM
calculation was done for the most widely used types used in market. The ideal one was decided.
Finally a rough cost estimation was conducted and presented within the context of thesis.
Several notes can be mentioned regarding the work. First of all, number of initial data might be
more. Also it might be gathered directly from the companies for better accuracy of information.
However due to limited time of the internship and overall preparation of the thesis, it is fair to
state that current data is quite acceptable. Furthermore, initial research covered data from first
applications of this technology. Therefore recent trend is not fully represented in the selection
of the most common wind turbine tower. The selected height was between 60 to 80 meters,
however in current applications higher towers are seen, which are around 100 meters.
It may be noted regarding the wind turbine tower selection that Class B type was selected as
production technology. As it is already present in the 4.2 section, selection of Class B reduced
the costs of production. However it also resulted in the lower quality of structure. Still all the
standards were satisfied and this fact resulted in no problems.
The calculations were done based on experimental results instead of theoretical calculations.
This fact results in more valid and realistic design of the tower. The calculations for foundation
of the structure were done based on the assumption that both on-shore and off-shore structures
have the same characteristics. Based on this assumption, all calculations were done according
to on-shore foundation.
The door opening selection was done in a similar fashion with tower selection. Data was
gathered and the most common ones were selected. Still it should be noted that in recent
applications several other types of door openings are present in the market due to development
of production technologies.

P 130 Selcuk SAHIN
Master Thesis developed at West Pomeranian University of Technology, Szczecin, Poland and The Lloyd’s
Register Foundation Research Centre of Excellence, Pusan, Republic of Korea
Cost estimation part was already briefly criticized in respective section. It can be mentioned
that due to limited time and confidentiality policies of companies, the results presented should
be evaluated as roughly made for the initial state of the work. Therefore for better estimation
of cost, this part should be covered with more data.
Overall, despite the assumptions made, it can be clearly stated that the calculations and designs
presented within the work are valid and acceptable. The objectives that were presented initially
were satisfied mainly, except the cost estimation part.
As it was mentioned before, the first objective fulfilled was to design a wind turbine tower and
an ideal door opening satisfying the standards. In the recent part, with door and without door
analyses were done and big strength difference can be observed, further researchers can figure
out that door opening important subject for towers. Furthermore it was aimed to create a work
that can be used as a guideline for future works in the same filed. It can be suggested that steps
of designing a tower are clearly presented within the thesis and it may be used as stepping stone
with certain developments. The other goal was to underline the importance of the subject. It can
be clearly seen from the literature search and detailed calculations and design steps presented
that the subject of wind turbine tower is highly important in recent years and will draw more
attention in future.
7.1. Future Research
The thesis aimed to show producers, how to design a wind tower by using standards in order to
avoid costly production resulting from non-standard-satisfactory production. The second
purpose is to prove the importance of the door opening in wind turbine tower design.
Fundamentals of these two goals were completed within the thesis. However some parts of the
report still needs further improvement.
Firstly, instead of the probabilistic design of the tower, some optimization program could be
used such as “EOLOS”. Therefore, according to the loads, better geometry of the tower can be
found. It would also take less time compared to probabilistic design.
During the calculation flanges was assumed same as cans. Then failure modes of flanges was
calculated. For buckling, flanges can be evaluated individually.

Wind Turbine Tower Structure Analysis According to Wind Load in Terms of Cost 131
“EMSHIP” Erasmus Mundus Master Course, period of study September 2014 – February 2016
Number of experimental data may be increased which will eventually lead to generation of
other tower types. In this case, the analysis approach presented in the thesis may be
implemented for these types as well. Especially, fatigue data may be improved. Furthermore,
not only wind loads but also wave loads may be considered in the offshore wind towers. One
sample can be developed by using wave loads on the foundation.
In this thesis bolts-flanges fatigue calculations were not done. Fatigue values for bolt and flange
must be evaluated. It is also another crucial point of view, which is neglected in this work.
3 types of door openings and 3 types of stiffeners were examined in this thesis. In reality, one
can see more than 3 types, therefore data of door opening and stiffeners may be increased to
have results for several types. As a result of that, most ideal opening can be found. Also
considering fatigue connections, door fatigue calculation can be done.
Cost estimation should be studied in details. A basic software may be developed in EXCEL,
then cost can be estimated clearly. Nevertheless, confidentiality problem is still an obstacle for
this work.

P 132 Selcuk SAHIN
Master Thesis developed at West Pomeranian University of Technology, Szczecin, Poland and The Lloyd’s
Register Foundation Research Centre of Excellence, Pusan, Republic of Korea
8. REFERENCES
“ACCIONA Windpower Inaugurates the First Concrete Tower Production Plant in Mexico.”
http://www.acciona.com/news/acciona-windpower-inaugurates-first-concrete-tower-
production-plant-mexico (October 19, 2015).
Achmus, Prof M et al. “Work Package 2 : Ocean Energy System Test – Standardisation and Best
Practice Testing D2 . 6 : Report on Offshore Wind System Monitoring Practice and
Normalisation Procedures.”
Amirouche, Farid. 2006. Mark’s Standard Handbook for Mechanical Engineers Introduction to
the Finite-Element Method.
Aydin, Can. 2007. “Analysis and Optimization of Monopile Type Offshore Wind and Wave
Loading.” Bogazici University.
CEN (European Commitee for Standardization). 2005a. “ENV 1993-1-1: 2005, Design of Steel
Structures-Part 1-1.” General Rules and Rules for Buildings,CEN.
———. 2005b. “ENV 1993-1-9: 2005, Design of Steel Structures-Part 1-9.” Eurocode 3 9(2005).
———. 2007a. “ENV 1993-1-1: 2005, Design of Steel Structures-Part 1-3.”
———. 2007b. “ENV 1993-1-6: 2005, Design of Steel Structures-Part 1-6.” Eurocode 3 6(2007).
Det Norske Veritas. 2011. “DNV-OS-J101 Design of Offshore Wind Turbine Structures.”
(September): 213.
“Development of the Cost of Wind-Generated Power.” http://www.wind-energy-the-
facts.org/development-of-the-cost-of-wind-generated-power.html (December 13,
2015).
Dimopoulos, C. A., and C. J. Gantes. 2012. “Experimental Investigation of Buckling of Wind
Turbine Tower Cylindrical Shells with Opening and Stiffening under Bending.” Thin-
Walled Structures 54: 140–55.
http://linkinghub.elsevier.com/retrieve/pii/S0263823112000419.
“EngrApps: Burst and Collapse - Pressure Vessel Design.” http://engrapps.com/mechanical-
systems-and-materials/mechanical-components/pressure-vessels/burst-collapse-

Wind Turbine Tower Structure Analysis According to Wind Load in Terms of Cost 133
“EMSHIP” Erasmus Mundus Master Course, period of study September 2014 – February 2016
analysis.php (October 23, 2015).
“Everything You Need to Know About Small Wind Turbines.”
http://greenterrafirma.com/small_turbines.html (October 19, 2015).
“Excel Interpolation Formulas - Peltier Tech Blog.” http://peltiertech.com/excel-interpolation-
formulas/ (October 20, 2015).
“Force and Strength.”
http://www.pt.ntu.edu.tw/hmchai/bm02/bm02method/ForceMeasure.htm (October
21, 2015).
Germanischer Lloyd Industrial Services GmbH. 2010. “Guidline for the Certification of Wind
Turbines.” Germanischer Lloyd: 384.
GWEC. 2012. “Global Wind Report.” Wind energy technology: 72.
“Heavy Lift Vessel ‘Atlantic’ Delivered to Her Owners - CONOSHIP.”
http://www.conoship.com/en_heavy-lift-vessel-atlantic-delivered-to-her-
owners,120.html (October 19, 2015).
Husson, Wylliam. 2008. “Friction Connections with Slotted Holes for Wind Towers.” : 213.
http://pure.ltu.se/portal/files/36285679/LTU_LIC_0845_SE.pdf.
Jármai, K., and J. Farkas. 1999. “Cost Calculation and Optimisation of Welded Steel Structures.”
Journal of Constructional Steel Research 50: 115–35.
Kanbur, Faik Alper. 2014. “500 KW Enerji Kapasiteli Bir Ruzgar Turbinin Çelik Kule Tasarimi.”
Istanbul Technical University.
Karimirad, Madjid. 2014. Offshore Energy Structures: For Wind Power, Wave Energy and
Hybrid Marine Platforms.
Lanier, M W, and Federal Way. 2005. “LWST Phase I Project Conceptual Design Study :
Evaluation of Design and Construction Approaches for Economical Hybrid Steel /
Concrete Wind Turbine Towers LWST Phase I Project Conceptual Design Study :
Evaluation of Design and Construction Approaches for .” (January).
“New Wind and Solar Sectors Won’t Solve China’s Water Scarcity | Circle of Blue WaterNews.”
http://www.circleofblue.org/waternews/2011/world/new-wind-and-solar-sectors-

P 134 Selcuk SAHIN
Master Thesis developed at West Pomeranian University of Technology, Szczecin, Poland and The Lloyd’s
Register Foundation Research Centre of Excellence, Pusan, Republic of Korea
wont-solve-chinas-water-scarcity/ (October 19, 2015).
“Prefabricated DYWIDAG Tendons Secure Innovative ATS Hybrid Wind Tower - DYWIDAG-
Systems International.” https://www.dywidag-systems.com/emea/projects/project-
details/article/innovative-ats-hybrid-wind-tower-germany.html (October 19, 2015).
Schaumann, P, and M Seidel. 2000. “Failure Analysis of Bolted Steel Flanges.” Proceedings of
the 7th International Symposium on Structural Failure and Plasticity (Implast 2000)
(Implast): 1–6.
Shakya, Anil. “Wind Load Assessment for Steel Lattice.” : 1–7.
“SPECIFIC ACTION OF STRESSES - 14014_74.”
http://navyaviation.tpub.com/14014/css/14014_74.htm (October 21, 2015).
Standard, European. 2004. “S355 European Standard Steel.” 1(7): 1–7.
“Steel Grades according to American Standards - A36, A572, A588, A709, A913, A992.” : 992.
“Stress Strain Diagram For Ductile And Brittle Materials - Transtutors.”
http://www.transtutors.com/homework-help/mechanical-engineering/simple-stresses-
and-strain/stress-strain-diagram-for-ductile-and-brittle-materials.aspx (October 19,
2015).
“The Inside of a Wind Turbine | Department of Energy.” http://energy.gov/eere/wind/inside-
wind-turbine-0 (October 19, 2015).
“Theory -8.” https://courses.cit.cornell.edu/virtual_lab/chalktalks/theory/8.shtml (October
21, 2015).
“Torsion (mechanics) - Wikipedia, the Free Encyclopedia.”
https://en.wikipedia.org/wiki/Torsion_(mechanics) (January 9, 2016).
Travanty, By Frank. 2001. “Tower and Antenna Wind Loading as a.” : 23–33.
US DOE. 2014. “2013 Wind Technologies Market Report (Presentation).” (August).
http://energy.gov/sites/prod/files/2014/08/f18/2013 Wind Technologies Market Report
Presentation.pdf.
Verma, Ankit. 2011. “Adhesive Bonded Towers for Wind Turbines. Design, Optimization and
Cost Analysis.” (November): 83.

Wind Turbine Tower Structure Analysis According to Wind Load in Terms of Cost 135
“EMSHIP” Erasmus Mundus Master Course, period of study September 2014 – February 2016
“Wind Basics - Hill Country Wind Power.” http://www.hillcountrywindpower.com/wind-
basics.php (December 13, 2015).
“Wind Farm | Riley Group.” http://www.riley-group.com/wind-farm/ (October 19, 2015).
“Wind Turbine Risks to Seabirds: New Tool Maps Birds’ Sensitivity to Offshore Farms
(Constantine Alexander's Blog).” http://www.constantinealexander.net/2014/11/wind-
turbine-risks-to-seabirds-new-tool-maps-birds-sensitivity-to-offshore-farms.html
(October 19, 2015).
“WindAction | Wind Turbines and Public Safety: Setbacks Matter.”
http://www.windaction.org/posts/31986-wind-turbines-and-public-safety-setbacks-
matter#.Vmmqf_mrTIU (December 10, 2015).

P 136 Selcuk SAHIN
Master Thesis developed at West Pomeranian University of Technology, Szczecin, Poland and The Lloyd’s
Register Foundation Research Centre of Excellence, Pusan, Republic of Korea
9. APPENDIX
9.1. Experimental Load Input Data
Sensor NoSensor
Height
Ext. Des.
Bending
Moment
Partial
Coefficient
Max. Char.
Bending
Moment
Max. Des.
Torsion
Max.
Des.
Shear
Force
Des.
Normal
Force
Tower
Top
Wind
Speed
- - Mresd Mresc Mzd Fresp, d Fzc V
[#] [m] [kNm] [-] [kNm] [kNm] [kN] [kN] [m/s]
1 0 57898 1.35 - -1069 -98 -1284.6 56.5
2 0.2 57702 1.35 - -1069 -98 -1284.6 56.5
3 7.4 50667 1.35 - -1069 -98 -1284.7 56.5
4 12.6 45684 1.35 - -1069 -98 -1283.5 56.6
5 18.3 40242 1.35 - -1069 -98 -1284.2 56.6
6 28.8 30562 1.35 - -1069 -98 -1282.1 56.6
7 33 26818 1.35 - -1069 -98 -1240.8 57.5
8 41.7 19392 1.35 - -1069 -98 -1470.4 13.8
9 50.2 13008 1.35 - -1069 -98 -1480.8 13.7
10 55.4 9418 1.35 - -1069 -98 -1487.7 13.7
11 63 5539 1.35 - -1015 -44 -1442.6 23.4
𝛾𝑓
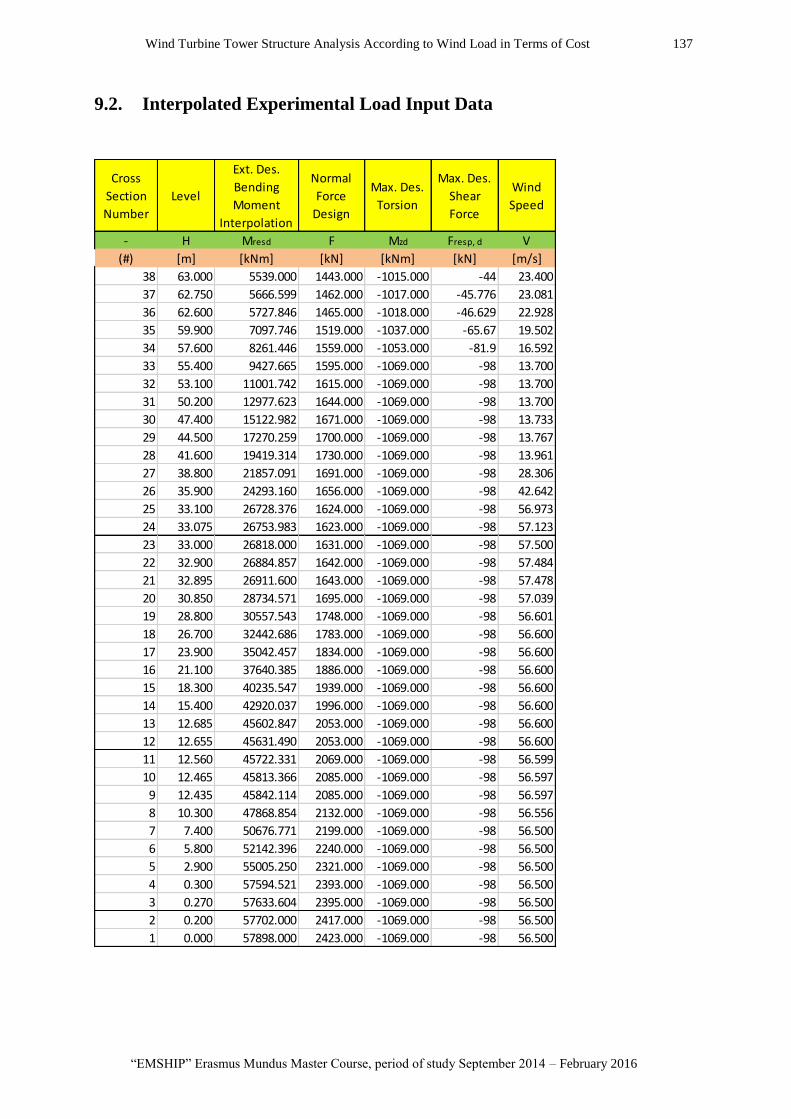
Wind Turbine Tower Structure Analysis According to Wind Load in Terms of Cost 137
“EMSHIP” Erasmus Mundus Master Course, period of study September 2014 – February 2016
9.2. Interpolated Experimental Load Input Data
Cross
Section
Number
Level
Ext. Des.
Bending
Moment
Interpolation
Normal
Force
Design
Max. Des.
Torsion
Max. Des.
Shear
Force
Wind
Speed
- H Mresd F Mzd Fresp, d V
(#) [m] [kNm] [kN] [kNm] [kN] [m/s]
38 63.000 5539.000 1443.000 -1015.000 -44 23.400
37 62.750 5666.599 1462.000 -1017.000 -45.776 23.081
36 62.600 5727.846 1465.000 -1018.000 -46.629 22.928
35 59.900 7097.746 1519.000 -1037.000 -65.67 19.502
34 57.600 8261.446 1559.000 -1053.000 -81.9 16.592
33 55.400 9427.665 1595.000 -1069.000 -98 13.700
32 53.100 11001.742 1615.000 -1069.000 -98 13.700
31 50.200 12977.623 1644.000 -1069.000 -98 13.700
30 47.400 15122.982 1671.000 -1069.000 -98 13.733
29 44.500 17270.259 1700.000 -1069.000 -98 13.767
28 41.600 19419.314 1730.000 -1069.000 -98 13.961
27 38.800 21857.091 1691.000 -1069.000 -98 28.306
26 35.900 24293.160 1656.000 -1069.000 -98 42.642
25 33.100 26728.376 1624.000 -1069.000 -98 56.973
24 33.075 26753.983 1623.000 -1069.000 -98 57.123
23 33.000 26818.000 1631.000 -1069.000 -98 57.500
22 32.900 26884.857 1642.000 -1069.000 -98 57.484
21 32.895 26911.600 1643.000 -1069.000 -98 57.478
20 30.850 28734.571 1695.000 -1069.000 -98 57.039
19 28.800 30557.543 1748.000 -1069.000 -98 56.601
18 26.700 32442.686 1783.000 -1069.000 -98 56.600
17 23.900 35042.457 1834.000 -1069.000 -98 56.600
16 21.100 37640.385 1886.000 -1069.000 -98 56.600
15 18.300 40235.547 1939.000 -1069.000 -98 56.600
14 15.400 42920.037 1996.000 -1069.000 -98 56.600
13 12.685 45602.847 2053.000 -1069.000 -98 56.600
12 12.655 45631.490 2053.000 -1069.000 -98 56.600
11 12.560 45722.331 2069.000 -1069.000 -98 56.599
10 12.465 45813.366 2085.000 -1069.000 -98 56.597
9 12.435 45842.114 2085.000 -1069.000 -98 56.597
8 10.300 47868.854 2132.000 -1069.000 -98 56.556
7 7.400 50676.771 2199.000 -1069.000 -98 56.500
6 5.800 52142.396 2240.000 -1069.000 -98 56.500
5 2.900 55005.250 2321.000 -1069.000 -98 56.500
4 0.300 57594.521 2393.000 -1069.000 -98 56.500
3 0.270 57633.604 2395.000 -1069.000 -98 56.500
2 0.200 57702.000 2417.000 -1069.000 -98 56.500
1 0.000 57898.000 2423.000 -1069.000 -98 56.500

P 138 Selcuk SAHIN
Master Thesis developed at West Pomeranian University of Technology, Szczecin, Poland and The Lloyd’s
Register Foundation Research Centre of Excellence, Pusan, Republic of Korea
9.3. Load Input Data
Cross
Section
Number
LevelMean
DiameterThickness
Dimensionless
Length
Parameter
Cross
Section
Area
Moment
of Inertia
Ext. Des.
Bending
Moment
Normal
Force
Design
Max.
Des.
Torsion
Max.
Des.
Shear
Force
Wind
Speed
Drag
Coefficient
Section
Length
Buckling
Load
Case
- H Dmi ti ω A I Mresd Fzd Mz Fres p,d V kw qwmax qeq L -
(#) [m] [m] [mm] [-] [m2] [m4] [kNm] [kN] [kNm] [kN] [m/s] [-] [kN/m2] [kN/m2] [m] [-]
38 63.000 2.300 130 197.814 0.9393 0.6231 5539.0 1443 -1015 -44.00 23.4 0.65 335.381 0.436 30000 -
37 62.750 2.300 20 197.814 0.1445 0.0956 5666.6 1462 -1017 -45.78 23.081 0.65 326.299 0.424 30000 -
36 62.600 2.300 20 197.814 0.1445 0.0956 5727.8 1465 -1018 -46.63 22.928 0.65 321.987 0.419 30000 -
35 59.900 2.600 15 214.834 0.1225 0.1035 7097.7 1519 -1037 -65.67 19.502 0.65 232.951 0.303 30000 -
34 57.600 2.600 15 214.834 0.1225 0.1035 8261.4 1559 -1053 -81.90 16.592 0.65 168.618 0.219 30000 -
33 55.400 2.700 15 210.819 0.1272 0.1159 9427.7 1595 -1069 -98.00 13.7 0.65 114.960 0.149 30000 -
32 53.100 2.700 15 210.819 0.1272 0.1159 11001.7 1615 -1069 -98.00 13.7 0.65 114.960 0.149 30000 -
31 50.200 2.800 15 207.020 0.1319 0.1293 12977.6 1644 -1069 -98.00 13.7 0.65 114.960 0.149 30000 -
30 47.400 2.800 15 207.020 0.1319 0.1293 15123.0 1671 -1069 -98.00 13.733 0.65 115.515 0.150 30000 -
29 44.500 3.000 15 200.000 0.1414 0.1590 17270.3 1700 -1069 -98.00 13.767 0.65 116.087 0.151 30000 -
28 41.600 3.000 18 182.574 0.1696 0.1909 19419.3 1730 -1069 -98.00 13.961 0.65 119.382 0.155 30000 -
27 38.800 3.000 18 182.574 0.1696 0.1909 21857.1 1691 -1069 -98.00 28.306 0.65 490.753 0.638 30000 -
26 35.900 3.000 18 182.574 0.1696 0.1909 24293.2 1656 -1069 -98.00 42.642 0.65 1113.733 1.448 30000 -
25 33.100 3.100 18 179.605 0.1753 0.2106 26728.4 1624 -1069 -98.00 56.973 0.65 1988.128 2.585 30000 -
24 33.075 3.100 170 179.605 1.6556 1.9948 26754.0 1623 -1069 -98.00 57.123 0.65 1998.610 2.598 30000 -
23 33.000 3.100 170 122.371 1.6556 1.9948 26818.0 1631 -1069 -98.00 57.5 0.65 2025.078 2.633 20440 -
22 32.900 3.100 18 122.371 0.1753 0.2106 26884.9 1642 -1069 -98.00 57.484 0.65 2023.951 2.631 20440 -
21 32.895 3.100 18 122.371 0.1753 0.2106 26911.6 1643 -1069 -98.00 57.478 0.65 2023.529 2.631 20440 -
20 30.850 3.100 18 122.371 0.1753 0.2106 28734.6 1695 -1069 -98.00 57.039 0.65 1992.737 2.591 20440 -
19 28.800 3.500 20 109.256 0.2199 0.3368 30557.5 1748 -1069 -98.00 56.601 0.65 1962.250 2.551 20440 -
18 26.700 3.500 20 109.256 0.2199 0.3368 32442.7 1783 -1069 -98.00 56.6 0.65 1962.181 2.551 20440 -
17 23.900 3.500 20 109.256 0.2199 0.3368 35042.5 1834 -1069 -98.00 56.6 0.65 1962.181 2.551 20440 -
16 21.100 3.500 20 109.256 0.2199 0.3368 37640.4 1886 -1069 -98.00 56.6 0.65 1962.181 2.551 20440 -
15 18.300 3.500 20 109.256 0.2199 0.3368 40235.5 1939 -1069 -98.00 56.6 0.65 1962.181 2.551 20440 -
14 15.400 3.600 20 107.728 0.2262 0.3664 42920.0 1996 -1069 -98.00 56.6 0.65 1962.181 2.551 20440 -
13 12.685 3.750 20 105.552 0.2356 0.4142 45602.8 2053 -1069 -98.00 56.6 0.65 1962.181 2.551 20440 -
12 12.655 3.750 190 105.552 2.2384 3.9448 45631.5 2053 -1069 -98.00 56.6 0.65 1962.181 2.551 20440 -
11 12.560 3.750 190 59.519 2.2384 3.9448 45722.3 2069 -1069 -98.00 56.599 0.65 1962.111 2.551 12360 -
10 12.465 3.750 23 59.519 0.2710 0.4763 45813.4 2085 -1069 -98.00 56.597 0.65 1961.973 2.551 12360 -
9 12.435 3.750 25 57.088 0.2945 0.5177 45842.1 2085 -1069 -98.00 56.597 0.65 1961.973 2.551 12360 -
8 10.300 3.750 25 57.088 0.2945 0.5177 47868.9 2132 -1069 -98.00 56.556 0.65 1959.131 2.547 12360 -
7 7.400 3.750 30 52.114 0.3534 0.6213 50676.8 2199 -1069 -98.00 56.5 0.65 1955.253 2.542 12360 -
6 5.800 3.750 30 52.114 0.3534 0.6213 52142.4 2240 -1069 -98.00 56.5 0.65 1955.253 2.542 12360 -
5 2.900 3.750 30 52.114 0.3534 0.6213 55005.3 2321 -1069 -98.00 56.5 0.65 1955.253 2.542 12360 -
4 0.300 3.750 30 52.114 0.3534 0.6213 57594.5 2393 -1069 -98.00 56.5 0.65 1955.253 2.542 12360 -
3 0.270 3.750 200 52.114 2.3562 4.1535 57633.6 2395 -1069 -98.00 56.5 0.65 1955.253 2.542 12360 -
2 0.200 3.750 30 0.843 0.3534 0.6213 57702.0 2417 -1069 -98.00 56.5 0.65 1955.253 2.542 200 -
1 0.000 3.750 30 0.843 0.3534 0.6213 57898.0 2423 -1069 -98.00 56.5 0.65 1955.253 2.542 200 -
Wind Pressure

Wind Turbine Tower Structure Analysis According to Wind Load in Terms of Cost 139
“EMSHIP” Erasmus Mundus Master Course, period of study September 2014 – February 2016
9.4. Stress Calculation
Cross
Section
Number
LevelMean
RadiusThickness
Normal
Stress
Bending
Stress
Shear
Stress
Torsion
Shear
Stress
Force
Total
Normal
Stress
Total
Shear
Stress
Hoop
Stress
Total Ref.
Stress (Von
Misses)
- H rmi t
(#) [m] [m] [m] [N/mm2] [N/mm2] [N/mm2] [N/mm2] [N/mm2] [N/mm2] [N/mm2] [N/mm2]
38 63.000 1.150 0.13 10.0 67.8 -6.2 -0.61 77.8 -6.8 0.0251 78.68
37 62.750 1.150 0.02 10.1 69.4 -6.2 -0.63 79.5 -6.9 0.0244 80.36
36 62.600 1.150 0.02 10.1 70.1 -8.3 -0.65 80.3 -8.9 0.0241 81.72
35 59.900 1.300 0.015 12.4 90.1 -6.6 -1.07 102.5 -7.7 0.0262 103.39
34 57.600 1.300 0.015 12.7 104.9 -6.7 -1.34 117.7 -8.0 0.0190 118.46
33 55.400 1.350 0.015 12.5 111.0 -6.3 -1.54 123.5 -7.8 0.0135 124.26
32 53.100 1.350 0.015 12.7 129.5 -6.3 -1.54 142.2 -7.8 0.0135 142.85
31 50.200 1.400 0.015 12.5 142.0 -5.8 -1.49 154.5 -7.3 0.0139 154.98
30 47.400 1.400 0.015 12.7 165.5 -5.8 -1.49 178.1 -7.3 0.0140 178.59
29 44.500 1.500 0.015 12.0 164.5 -4.3 -1.39 176.5 -5.6 0.0151 176.79
28 41.600 1.500 0.018 10.2 154.5 -4.3 -1.16 164.6 -5.4 0.0129 164.91
27 38.800 1.500 0.018 10.0 173.8 -4.3 -1.16 183.8 -5.4 0.0532 184.02
26 35.900 1.500 0.018 9.8 193.2 -4.3 -1.16 203.0 -5.4 0.1207 203.13
25 33.100 1.550 0.018 9.3 199.0 -0.5 -1.12 208.3 -1.6 0.2226 208.19
24 33.075 1.550 0.17 9.3 199.2 -0.5 -1.12 208.5 -1.6 0.2237 208.37
23 33.000 1.550 0.17 9.3 199.7 -4.0 -1.12 209.0 -5.1 0.2267 209.06
22 32.900 1.550 0.018 9.4 200.2 -4.0 -1.12 209.5 -5.1 0.2266 209.62
21 32.895 1.550 0.018 9.4 200.4 -4.0 -1.12 209.8 -5.1 0.2265 209.82
20 30.850 1.550 0.018 9.7 214.0 -3.6 -1.12 223.6 -4.7 0.2231 223.66
19 28.800 1.750 0.02 7.9 160.6 -2.8 -0.89 168.6 -3.7 0.2232 168.57
18 26.700 1.750 0.02 8.1 170.5 -2.8 -0.89 178.6 -3.7 0.2232 178.63
17 23.900 1.750 0.02 8.3 184.2 -2.8 -0.89 192.5 -3.7 0.2232 192.52
16 21.100 1.750 0.02 8.6 197.8 -2.8 -0.89 206.4 -3.7 0.2232 206.41
15 18.300 1.750 0.02 8.8 211.5 -2.8 -0.89 220.3 -3.7 0.2232 220.28
14 15.400 1.800 0.02 8.8 213.2 -2.7 -0.87 222.0 -3.5 0.2296 221.96
13 12.685 1.875 0.02 8.7 208.6 -0.3 -0.83 217.4 -1.1 0.2391 217.25
12 12.655 1.875 0.19 8.7 208.8 -0.3 -0.83 217.5 -1.1 0.2391 217.38
11 12.560 1.875 0.19 7.6 182.2 -2.1 -0.72 189.8 -2.9 0.2079 189.79
10 12.465 1.875 0.023 7.7 182.6 -2.0 -0.72 190.2 -2.7 0.2079 190.20
9 12.435 1.875 0.025 7.1 168.2 -2.0 -0.67 175.3 -2.6 0.1913 175.27
8 10.300 1.875 0.025 7.2 175.7 -1.6 -0.67 182.9 -2.3 0.1910 182.86
7 7.400 1.875 0.03 6.2 155.4 -1.6 -0.55 161.6 -2.2 0.1589 161.57
6 5.800 1.875 0.03 6.3 159.9 -1.6 -0.55 166.2 -2.2 0.1589 166.18
5 2.900 1.875 0.03 6.6 168.7 -1.6 -0.55 175.2 -2.2 0.1589 175.18
4 0.300 1.875 0.03 6.8 176.6 -0.3 -0.55 183.4 -0.8 0.1589 183.29
3 0.270 1.875 0.2 1.0 176.7 -1.6 -0.55 177.7 -2.2 0.1589 177.69
2 0.200 1.875 0.03 6.8 176.9 -1.6 -0.55 183.8 -2.2 0.1589 183.72
1 0.000 1.875 0.03 6.9 177.5 -1.6 -0.55 184.4 -2.2 0.1589 184.34
𝜎𝑛 𝜎𝑏 𝜏𝑡𝑜𝑟𝑠 𝜏𝑠ℎ𝑒𝑎𝑟 𝜎𝑧 𝜎𝜃 𝜎𝑟𝑒𝑓𝜎𝑧𝜃

P 140 Selcuk SAHIN
Master Thesis developed at West Pomeranian University of Technology, Szczecin, Poland and The Lloyd’s
Register Foundation Research Centre of Excellence, Pusan, Republic of Korea
9.5. Meridional Buckling Stress
Cro
ss S
ect
ion
Nu
mb
er
Leve
lM
ean
Rad
ius
Thic
kne
ss
Dim
en
sio
nle
ss
Len
gth
Par
ame
ter
Co
rre
ctio
n
Fact
or
Elas
tic
Cri
tica
l
Me
rid
ion
al
Bu
ckli
ng
Stre
ss
Ch
arac
teri
stic
Imp
erf
ect
ion
Am
pli
tud
e
Elas
tic
Imp
erf
ect
ion
Re
du
ctio
n F
acto
r
Pla
stic
Lim
it
Re
lati
ve
Sle
nd
ern
es
Re
lati
ve
Sle
nd
ern
ess
Bu
ckli
ng
Re
du
ctio
n
Fact
or
Ch
arac
teri
stic
Yie
ld S
tre
ngt
h
Me
rid
ion
al
Ch
arac
teri
stic
Bu
ckli
ng
Stre
ss
Par
tial
Fac
tor
Me
rid
ion
al
De
sign
Bu
ckli
ng
Stre
ss
-H
rmi
tiω
(#)
[m]
[mm
][m
m]
[-]
[-]
[N/m
m2]
[-]
[-]
[-]
[-]
[-]
[N/m
m2]
[N/m
m2]
[-]
[N/m
m2]
3863
.000
1150
.000
20.0
0019
7.81
40.
804
1776
.454
6.06
60.
462
1.07
40.
441
0.83
534
5.00
028
8.02
11.
200
240.
018
3762
.750
1150
.000
20.0
0019
7.81
40.
804
1776
.454
6.06
60.
462
1.07
40.
441
0.83
534
5.00
028
8.02
11.
200
240.
018
3662
.600
1150
.000
20.0
0019
7.81
40.
804
1776
.454
6.06
60.
462
1.07
40.
441
0.83
534
5.00
028
8.02
11.
200
240.
018
3559
.900
1300
.000
15.0
0021
4.83
40.
868
1272
.566
5.58
60.
425
1.03
00.
521
0.76
834
5.00
026
5.04
11.
200
220.
867
3457
.600
1300
.000
15.0
0021
4.83
40.
868
1272
.566
5.58
60.
425
1.03
00.
521
0.76
834
5.00
026
5.04
11.
200
220.
867
3355
.400
1350
.000
15.0
0021
0.81
90.
877
1238
.274
5.69
20.
421
1.02
60.
528
0.76
234
5.00
026
2.81
51.
200
219.
013
3253
.100
1350
.000
15.0
0021
0.81
90.
877
1238
.274
5.69
20.
421
1.02
60.
528
0.76
234
5.00
026
2.81
51.
200
219.
013
3150
.200
1400
.000
15.0
0020
7.02
00.
885
1205
.335
5.79
70.
417
1.02
10.
535
0.75
534
5.00
026
0.57
51.
200
217.
146
3047
.400
1400
.000
15.0
0020
7.02
00.
885
1205
.335
5.79
70.
417
1.02
10.
535
0.75
534
5.00
026
0.57
51.
200
217.
146
2944
.500
1500
.000
15.0
0020
0.00
00.
900
1143
.450
6.00
00.
410
1.01
30.
549
0.74
234
5.00
025
6.06
51.
200
213.
388
2841
.600
1500
.000
18.0
0018
2.57
40.
887
1352
.738
6.57
30.
428
1.03
50.
505
0.78
134
5.00
026
9.36
11.
200
224.
468
2738
.800
1500
.000
18.0
0018
2.57
40.
887
1352
.738
6.57
30.
428
1.03
50.
505
0.78
134
5.00
026
9.36
11.
200
224.
468
2635
.900
1500
.000
18.0
0018
2.57
40.
887
1352
.738
6.57
30.
428
1.03
50.
505
0.78
134
5.00
026
9.36
11.
200
224.
468
2533
.100
1550
.000
18.0
0017
9.60
50.
894
1319
.444
6.68
10.
425
1.03
10.
511
0.77
534
5.00
026
7.43
81.
200
222.
865
2433
.075
1550
.000
18.0
0017
9.60
50.
894
1319
.444
6.68
10.
425
1.03
10.
511
0.77
534
5.00
026
7.43
81.
200
222.
865
2333
.000
1550
.000
18.0
0012
2.37
10.
939
1384
.820
6.68
10.
425
1.03
10.
499
0.78
434
5.00
027
0.48
11.
200
225.
401
2232
.900
1550
.000
18.0
0012
2.37
10.
939
1384
.820
6.68
10.
425
1.03
10.
499
0.78
434
5.00
027
0.48
11.
200
225.
401
2132
.895
1550
.000
18.0
0012
2.37
10.
939
1384
.820
6.68
10.
425
1.03
10.
499
0.78
434
5.00
027
0.48
11.
200
225.
401
2030
.850
1550
.000
18.0
0012
2.37
10.
939
1384
.820
6.68
10.
425
1.03
10.
499
0.78
434
5.00
027
0.48
11.
200
225.
401
1928
.800
1750
.000
20.0
0010
9.25
60.
950
1379
.531
7.48
30.
424
1.02
90.
500
0.78
334
5.00
027
0.07
41.
200
225.
062
1826
.700
1750
.000
20.0
0010
9.25
60.
950
1379
.531
7.48
30.
424
1.02
90.
500
0.78
334
5.00
027
0.07
41.
200
225.
062
1723
.900
1750
.000
20.0
0010
9.25
60.
950
1379
.531
7.48
30.
424
1.02
90.
500
0.78
334
5.00
027
0.07
41.
200
225.
062
1621
.100
1750
.000
20.0
0010
9.25
60.
950
1379
.531
7.48
30.
424
1.02
90.
500
0.78
334
5.00
027
0.07
41.
200
225.
062
1518
.300
1750
.000
20.0
0010
9.25
60.
950
1379
.531
7.48
30.
424
1.02
90.
500
0.78
334
5.00
027
0.07
41.
200
225.
062
1415
.400
1800
.000
20.0
0010
7.72
80.
954
1346
.073
7.58
90.
421
1.02
60.
506
0.77
734
5.00
026
8.22
41.
200
223.
520
1312
.685
1875
.000
20.0
0010
5.55
20.
958
1298
.653
7.74
60.
417
1.02
10.
515
0.76
934
5.00
026
5.45
81.
200
221.
215
1212
.655
1875
.000
20.0
0010
5.55
20.
958
1298
.653
7.74
60.
417
1.02
10.
515
0.76
934
5.00
026
5.45
81.
200
221.
215
1112
.560
1875
.000
20.0
0063
.827
0.98
813
38.8
647.
746
0.41
71.
021
0.50
80.
775
345.
000
267.
425
1.20
022
2.85
4
1012
.465
1875
.000
23.0
0059
.519
0.98
515
34.5
738.
307
0.43
01.
037
0.47
40.
804
345.
000
277.
220
1.20
023
1.01
6
912
.435
1875
.000
25.0
0057
.088
0.98
316
64.5
048.
660
0.43
81.
047
0.45
50.
819
345.
000
282.
586
1.20
023
5.48
9
810
.300
1875
.000
25.0
0057
.088
0.98
316
64.5
048.
660
0.43
81.
047
0.45
50.
819
345.
000
282.
586
1.20
023
5.48
9
77.
400
1875
.000
30.0
0052
.114
0.97
819
87.5
599.
487
0.45
51.
066
0.41
70.
850
345.
000
293.
221
1.20
024
4.35
1
65.
800
1875
.000
30.0
0052
.114
0.97
819
87.5
599.
487
0.45
51.
066
0.41
70.
850
345.
000
293.
221
1.20
024
4.35
1
52.
900
1875
.000
30.0
0052
.114
0.97
819
87.5
599.
487
0.45
51.
066
0.41
70.
850
345.
000
293.
221
1.20
024
4.35
1
40.
300
1875
.000
30.0
0052
.114
0.97
819
87.5
599.
487
0.45
51.
066
0.41
70.
850
345.
000
293.
221
1.20
024
4.35
1
30.
270
1875
.000
18.0
0067
.279
0.99
012
07.8
187.
348
0.40
61.
008
0.53
40.
752
345.
000
259.
309
1.20
021
6.09
1
20.
200
1875
.000
30.0
000.
843
2.10
142
70.5
569.
487
0.45
51.
066
0.28
40.
942
345.
000
324.
868
1.20
027
0.72
3
10.
000
1875
.000
30.0
000.
843
2.10
142
70.5
569.
487
0.45
51.
066
0.28
40.
942
345.
000
324.
868
1.20
027
0.72
3
𝜎𝑥,𝑅𝑑
𝑓 𝑦𝑘
χ 𝑥𝜆 𝑝
𝑎𝑥
∆𝑤𝑘
𝜆 𝑥
𝜎𝑥,𝑅𝑐𝑟
𝜎𝑥,𝑅𝑘
𝐶𝑥
𝛾𝑀1
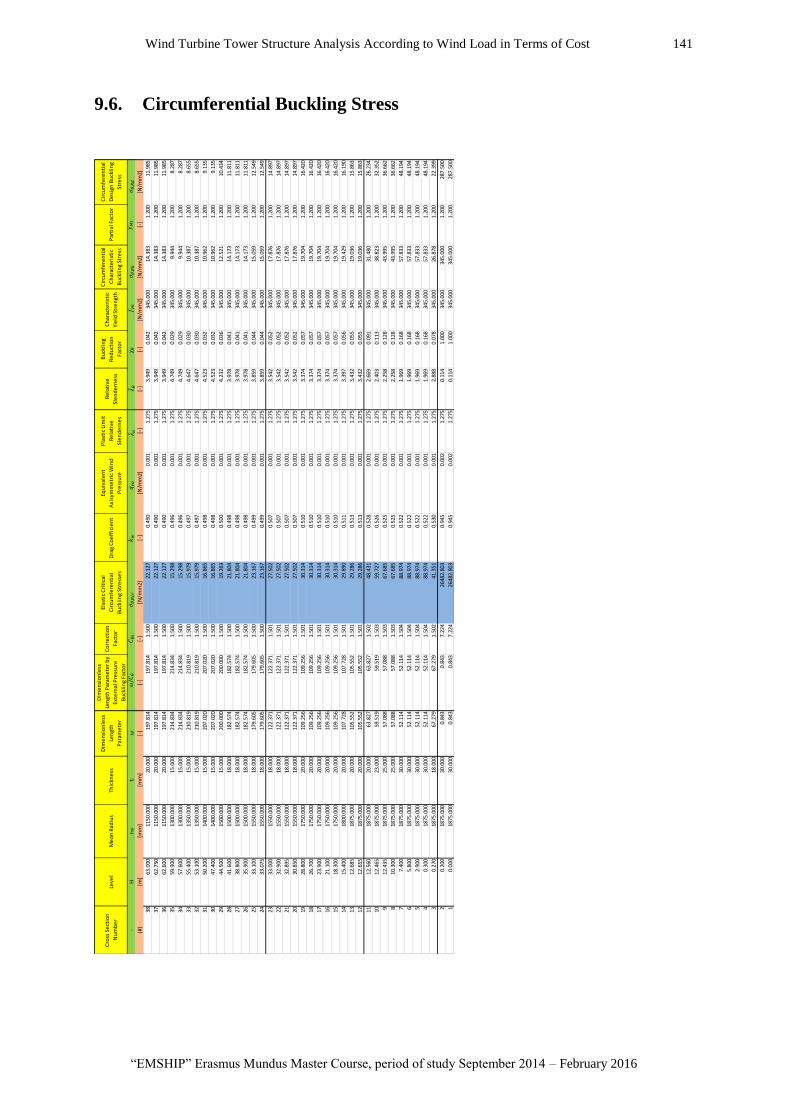
Wind Turbine Tower Structure Analysis According to Wind Load in Terms of Cost 141
“EMSHIP” Erasmus Mundus Master Course, period of study September 2014 – February 2016
9.6. Circumferential Buckling Stress
Cro
ss S
ect
ion
Nu
mb
er
Leve
lM
ean
Rad
ius
Thic
kne
ss
Dim
en
sio
nle
ss
Len
gth
Par
ame
ter
Dim
en
sio
nle
ss
Len
gth
Par
ame
ter
by
Exte
rnal
Pre
ssu
re
Bu
ckli
ng
Fact
or
Co
rre
ctio
n
Fact
or
Elas
tic
Cri
tica
l
Cir
cum
fere
nti
al
Bu
ckli
ng
Stre
sse
s
Dra
g C
oe
ffic
ien
t
Equ
ival
en
t
Axi
sym
me
tric
Win
d
Pre
ssu
re
Pla
stic
Lim
it
Re
lati
ve
Sle
nd
ern
es
Re
lati
ve
Sle
nd
ern
ess
Bu
ckli
ng
Re
du
ctio
n
Fact
or
Ch
arac
teri
stic
Yie
ld S
tre
ngt
h
Cir
cum
fere
nti
al
Ch
arac
teri
stic
Bu
ckli
ng
Stre
ss
Par
tial
Fac
tor
Cir
cum
fere
nti
al
De
sign
Bu
ckli
ng
Stre
ss
-H
rmi
tiω
(#)
[m]
[mm
][m
m]
[-]
[-]
[-]
[N/m
m2]
[-]
[N/m
m2]
[-]
[-]
[-]
[N/m
m2]
[N/m
m2]
[-]
[N/m
m2]
3863
.000
1150
.000
20.0
0019
7.81
419
7.81
41.
500
22.1
270.
490
0.00
11.
275
3.94
90.
042
345.
000
14.3
831.
200
11.9
85
3762
.750
1150
.000
20.0
0019
7.81
419
7.81
41.
500
22.1
270.
490
0.00
11.
275
3.94
90.
042
345.
000
14.3
831.
200
11.9
85
3662
.600
1150
.000
20.0
0019
7.81
419
7.81
41.
500
22.1
270.
490
0.00
11.
275
3.94
90.
042
345.
000
14.3
831.
200
11.9
85
3559
.900
1300
.000
15.0
0021
4.83
421
4.83
41.
500
15.2
980.
496
0.00
11.
275
4.74
90.
029
345.
000
9.94
41.
200
8.28
7
3457
.600
1300
.000
15.0
0021
4.83
421
4.83
41.
500
15.2
980.
496
0.00
11.
275
4.74
90.
029
345.
000
9.94
41.
200
8.28
7
3355
.400
1350
.000
15.0
0021
0.81
921
0.81
91.
500
15.9
790.
497
0.00
11.
275
4.64
70.
030
345.
000
10.3
871.
200
8.65
5
3253
.100
1350
.000
15.0
0021
0.81
921
0.81
91.
500
15.9
790.
497
0.00
11.
275
4.64
70.
030
345.
000
10.3
871.
200
8.65
5
3150
.200
1400
.000
15.0
0020
7.02
020
7.02
01.
500
16.8
650.
498
0.00
11.
275
4.52
30.
032
345.
000
10.9
621.
200
9.13
5
3047
.400
1400
.000
15.0
0020
7.02
020
7.02
01.
500
16.8
650.
498
0.00
11.
275
4.52
30.
032
345.
000
10.9
621.
200
9.13
5
2944
.500
1500
.000
15.0
0020
0.00
020
0.00
01.
500
19.2
630.
500
0.00
11.
275
4.23
20.
036
345.
000
12.5
211.
200
10.4
34
2841
.600
1500
.000
18.0
0018
2.57
418
2.57
41.
500
21.8
040.
498
0.00
11.
275
3.97
80.
041
345.
000
14.1
731.
200
11.8
11
2738
.800
1500
.000
18.0
0018
2.57
418
2.57
41.
500
21.8
040.
498
0.00
11.
275
3.97
80.
041
345.
000
14.1
731.
200
11.8
11
2635
.900
1500
.000
18.0
0018
2.57
418
2.57
41.
500
21.8
040.
498
0.00
11.
275
3.97
80.
041
345.
000
14.1
731.
200
11.8
11
2533
.100
1550
.000
18.0
0017
9.60
517
9.60
51.
500
23.1
670.
499
0.00
11.
275
3.85
90.
044
345.
000
15.0
591.
200
12.5
49
2433
.075
1550
.000
18.0
0017
9.60
517
9.60
51.
500
23.1
670.
499
0.00
11.
275
3.85
90.
044
345.
000
15.0
591.
200
12.5
49
2333
.000
1550
.000
18.0
0012
2.37
112
2.37
11.
501
27.5
020.
507
0.00
11.
275
3.54
20.
052
345.
000
17.8
761.
200
14.8
97
2232
.900
1550
.000
18.0
0012
2.37
112
2.37
11.
501
27.5
020.
507
0.00
11.
275
3.54
20.
052
345.
000
17.8
761.
200
14.8
97
2132
.895
1550
.000
18.0
0012
2.37
112
2.37
11.
501
27.5
020.
507
0.00
11.
275
3.54
20.
052
345.
000
17.8
761.
200
14.8
97
2030
.850
1550
.000
18.0
0012
2.37
112
2.37
11.
501
27.5
020.
507
0.00
11.
275
3.54
20.
052
345.
000
17.8
761.
200
14.8
97
1928
.800
1750
.000
20.0
0010
9.25
610
9.25
61.
501
30.3
140.
510
0.00
11.
275
3.37
40.
057
345.
000
19.7
041.
200
16.4
20
1826
.700
1750
.000
20.0
0010
9.25
610
9.25
61.
501
30.3
140.
510
0.00
11.
275
3.37
40.
057
345.
000
19.7
041.
200
16.4
20
1723
.900
1750
.000
20.0
0010
9.25
610
9.25
61.
501
30.3
140.
510
0.00
11.
275
3.37
40.
057
345.
000
19.7
041.
200
16.4
20
1621
.100
1750
.000
20.0
0010
9.25
610
9.25
61.
501
30.3
140.
510
0.00
11.
275
3.37
40.
057
345.
000
19.7
041.
200
16.4
20
1518
.300
1750
.000
20.0
0010
9.25
610
9.25
61.
501
30.3
140.
510
0.00
11.
275
3.37
40.
057
345.
000
19.7
041.
200
16.4
20
1415
.400
1800
.000
20.0
0010
7.72
810
7.72
81.
501
29.8
900.
511
0.00
11.
275
3.39
70.
056
345.
000
19.4
291.
200
16.1
90
1312
.685
1875
.000
20.0
0010
5.55
210
5.55
21.
501
29.2
860.
513
0.00
11.
275
3.43
20.
055
345.
000
19.0
361.
200
15.8
63
1212
.655
1875
.000
20.0
0010
5.55
210
5.55
21.
501
29.2
860.
513
0.00
11.
275
3.43
20.
055
345.
000
19.0
361.
200
15.8
63
1112
.560
1875
.000
20.0
0063
.827
63.8
271.
502
48.4
310.
528
0.00
11.
275
2.66
90.
091
345.
000
31.4
801.
200
26.2
34
1012
.465
1875
.000
23.0
0059
.519
59.5
191.
503
59.7
270.
526
0.00
11.
275
2.40
30.
113
345.
000
38.8
231.
200
32.3
52
912
.435
1875
.000
25.0
0057
.088
57.0
881.
503
67.6
850.
525
0.00
11.
275
2.25
80.
128
345.
000
43.9
951.
200
36.6
62
810
.300
1875
.000
25.0
0057
.088
57.0
881.
503
67.6
850.
525
0.00
11.
275
2.25
80.
128
345.
000
43.9
951.
200
36.6
62
77.
400
1875
.000
30.0
0052
.114
52.1
141.
504
88.9
740.
522
0.00
11.
275
1.96
90.
168
345.
000
57.8
331.
200
48.1
94
65.
800
1875
.000
30.0
0052
.114
52.1
141.
504
88.9
740.
522
0.00
11.
275
1.96
90.
168
345.
000
57.8
331.
200
48.1
94
52.
900
1875
.000
30.0
0052
.114
52.1
141.
504
88.9
740.
522
0.00
11.
275
1.96
90.
168
345.
000
57.8
331.
200
48.1
94
40.
300
1875
.000
30.0
0052
.114
52.1
141.
504
88.9
740.
522
0.00
11.
275
1.96
90.
168
345.
000
57.8
331.
200
48.1
94
30.
270
1875
.000
18.0
0067
.279
67.2
791.
502
41.3
510.
530
0.00
11.
275
2.88
80.
078
345.
000
26.8
781.
200
22.3
99
20.
200
1875
.000
30.0
000.
843
0.84
37.
224
2648
2.80
30.
945
0.00
21.
275
0.11
41.
000
345.
000
345.
000
1.20
028
7.50
0
10.
000
1875
.000
30.0
000.
843
0.84
37.
224
2648
2.80
30.
945
0.00
21.
275
0.11
41.
000
345.
000
345.
000
1.20
028
7.50
0
𝜎𝜃,𝑅𝑑
𝜎𝜃,𝑅𝑘
𝑓 𝑦𝑘
χ 𝜃𝜆 𝜃
𝜎𝜃,𝑅𝑐𝑟
𝜔/𝐶
𝜃𝐶𝜃𝑠
𝑘𝑤
𝑞𝑒𝑞
𝜆 𝑝
𝛾𝑀1

P 142 Selcuk SAHIN
Master Thesis developed at West Pomeranian University of Technology, Szczecin, Poland and The Lloyd’s
Register Foundation Research Centre of Excellence, Pusan, Republic of Korea
9.7. Shear Buckling Stress
Cro
ss S
ect
ion
Nu
mb
er
Leve
lM
ean
Rad
ius
Thic
kne
ss
Dim
en
sio
nle
ss
Len
gth
Par
ame
ter
Co
rre
ctio
n
Fact
or
Elas
tic
Cri
tica
l Sh
ear
Bu
ckli
ng
Stre
ss
Pla
stic
Lim
it
Re
lati
ve
Sle
nd
ern
es
Re
lati
ve
Sle
nd
ern
ess
Bu
ckli
ng
Re
du
ctio
n
Fact
or
Ch
arac
teri
stic
Yie
ld S
tre
ngt
h
She
ar
Ch
arac
teri
stic
Bu
ckli
ng
Stre
ss
Par
tial
Fac
tor
She
ar D
esi
gn
Bu
ckli
ng
Stre
ss
-H
rmi
tiω
(#)
[m]
[mm
][m
m]
[-]
[-]
[N/m
m2]
[-]
[-]
[-]
[N/m
m2]
[N/m
m2]
[-]
[N/m
m2]
3863
.000
1150
.000
20.0
0019
7.81
41.
000
194.
753
1.27
51.
011
0.58
134
5.00
011
5.66
61.
200
96.3
88
3762
.750
1150
.000
20.0
0019
7.81
41.
000
194.
753
1.27
51.
011
0.58
134
5.00
011
5.66
61.
200
96.3
88
3662
.600
1150
.000
20.0
0019
7.81
41.
000
194.
753
1.27
51.
011
0.58
134
5.00
011
5.66
61.
200
96.3
88
3559
.900
1300
.000
15.0
0021
4.83
41.
000
123.
987
1.27
51.
267
0.40
534
5.00
080
.668
1.20
067
.224
3457
.600
1300
.000
15.0
0021
4.83
41.
000
123.
987
1.27
51.
267
0.40
534
5.00
080
.668
1.20
067
.224
3355
.400
1350
.000
15.0
0021
0.81
91.
000
120.
527
1.27
51.
286
0.39
334
5.00
078
.342
1.20
065
.285
3253
.100
1350
.000
15.0
0021
0.81
91.
000
120.
527
1.27
51.
286
0.39
334
5.00
078
.342
1.20
065
.285
3150
.200
1400
.000
15.0
0020
7.02
01.
000
117.
284
1.27
51.
303
0.38
334
5.00
076
.234
1.20
063
.529
3047
.400
1400
.000
15.0
0020
7.02
01.
000
117.
284
1.27
51.
303
0.38
334
5.00
076
.234
1.20
063
.529
2944
.500
1500
.000
15.0
0020
0.00
01.
000
111.
369
1.27
51.
337
0.36
334
5.00
072
.390
1.20
060
.325
2841
.600
1500
.000
18.0
0018
2.57
41.
000
139.
876
1.27
51.
193
0.45
634
5.00
090
.800
1.20
075
.666
2738
.800
1500
.000
18.0
0018
2.57
41.
000
139.
876
1.27
51.
193
0.45
634
5.00
090
.800
1.20
075
.666
2635
.900
1500
.000
18.0
0018
2.57
41.
000
139.
876
1.27
51.
193
0.45
634
5.00
090
.800
1.20
075
.666
2533
.100
1550
.000
18.0
0017
9.60
51.
000
136.
478
1.27
51.
208
0.44
634
5.00
088
.783
1.20
073
.986
2433
.075
1550
.000
18.0
0017
9.60
51.
000
136.
478
1.27
51.
208
0.44
634
5.00
088
.783
1.20
073
.986
2333
.000
1550
.000
18.0
0012
2.37
11.
000
165.
342
1.27
51.
098
0.52
234
5.00
010
3.88
01.
200
86.5
66
2232
.900
1550
.000
18.0
0012
2.37
11.
000
165.
342
1.27
51.
098
0.52
234
5.00
010
3.88
01.
200
86.5
66
2132
.895
1550
.000
18.0
0012
2.37
11.
000
165.
342
1.27
51.
098
0.52
234
5.00
010
3.88
01.
200
86.5
66
2030
.850
1550
.000
18.0
0012
2.37
11.
000
165.
342
1.27
51.
098
0.52
234
5.00
010
3.88
01.
200
86.5
66
1928
.800
1750
.000
20.0
0010
9.25
61.
000
172.
206
1.27
51.
075
0.53
734
5.00
010
6.89
91.
200
89.0
83
1826
.700
1750
.000
20.0
0010
9.25
61.
000
172.
206
1.27
51.
075
0.53
734
5.00
010
6.89
91.
200
89.0
83
1723
.900
1750
.000
20.0
0010
9.25
61.
000
172.
206
1.27
51.
075
0.53
734
5.00
010
6.89
91.
200
89.0
83
1621
.100
1750
.000
20.0
0010
9.25
61.
000
172.
206
1.27
51.
075
0.53
734
5.00
010
6.89
91.
200
89.0
83
1518
.300
1750
.000
20.0
0010
9.25
61.
000
172.
206
1.27
51.
075
0.53
734
5.00
010
6.89
91.
200
89.0
83
1415
.400
1800
.000
20.0
0010
7.72
81.
000
168.
606
1.27
51.
087
0.52
934
5.00
010
5.33
91.
200
87.7
82
1312
.685
1875
.000
20.0
0010
5.55
21.
000
163.
522
1.27
51.
104
0.51
734
5.00
010
3.04
81.
200
85.8
73
1212
.655
1875
.000
20.0
0010
5.55
21.
000
163.
522
1.27
51.
104
0.51
734
5.00
010
3.04
81.
200
85.8
73
1112
.560
1875
.000
20.0
0063
.827
1.00
021
0.28
51.
275
0.97
30.
607
345.
000
120.
867
1.20
010
0.72
2
1012
.465
1875
.000
23.0
0059
.519
1.00
025
0.42
61.
275
0.89
20.
663
345.
000
131.
989
1.20
010
9.99
1
912
.435
1875
.000
25.0
0057
.088
1.00
027
7.93
61.
275
0.84
70.
694
345.
000
138.
176
1.20
011
5.14
7
810
.300
1875
.000
25.0
0057
.088
1.00
027
7.93
61.
275
0.84
70.
694
345.
000
138.
176
1.20
011
5.14
7
77.
400
1875
.000
30.0
0052
.114
1.00
034
9.07
81.
275
0.75
50.
756
345.
000
150.
632
1.20
012
5.52
7
65.
800
1875
.000
30.0
0052
.114
1.00
034
9.07
81.
275
0.75
50.
756
345.
000
150.
632
1.20
012
5.52
7
52.
900
1875
.000
30.0
0052
.114
1.00
034
9.07
81.
275
0.75
50.
756
345.
000
150.
632
1.20
012
5.52
7
40.
300
1875
.000
30.0
0052
.114
1.00
034
9.07
81.
275
0.75
50.
756
345.
000
150.
632
1.20
012
5.52
7
30.
270
1875
.000
18.0
0067
.279
1.00
018
4.33
61.
275
1.03
90.
561
345.
000
111.
816
1.20
093
.180
20.
200
1875
.000
30.0
000.
843
8.42
823
129.
495
1.27
50.
093
1.00
034
5.00
019
9.18
61.
200
165.
988
10.
000
1875
.000
30.0
000.
843
8.42
823
129.
495
1.27
50.
093
1.00
034
5.00
019
9.18
61.
200
165.
988
𝜏 𝑥𝜃,𝑅𝑑
𝑓 𝑦𝑘
𝜏 𝑥𝜃,𝑅𝑘
χ 𝜏𝜆 𝜏
𝜏 𝑥𝜃,𝑅𝑐𝑟
𝜆 𝑝
𝐶𝜏
𝛾𝑀1
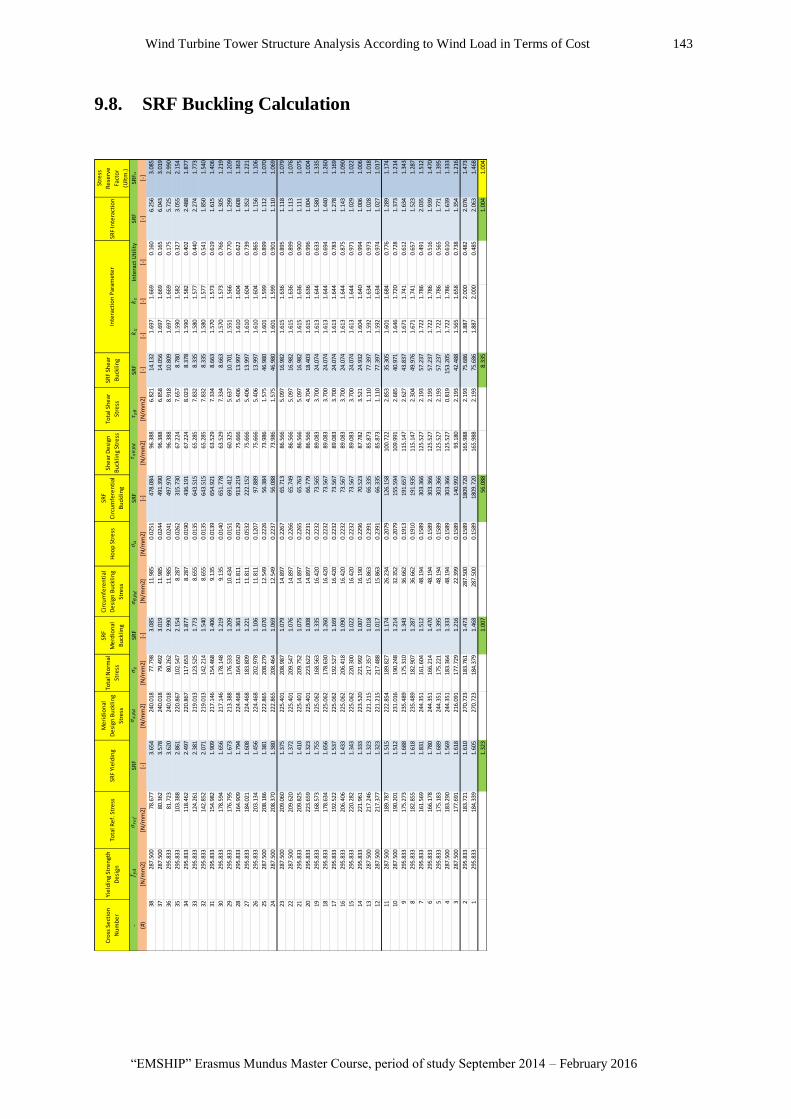
Wind Turbine Tower Structure Analysis According to Wind Load in Terms of Cost 143
“EMSHIP” Erasmus Mundus Master Course, period of study September 2014 – February 2016
9.8. SRF Buckling Calculation
Cro
ss S
ect
ion
Nu
mb
er
Yie
ldin
g St
ren
gth
De
sign
Tota
l Re
f. S
tre
ssSR
F Yi
eld
ing
Me
rid
ion
al
De
sign
Bu
ckli
ng
Stre
ss
Tota
l No
rmal
Stre
ss
SRF
Me
rdio
nal
Bu
ckli
ng
Cir
cum
fere
nti
al
De
sign
Bu
ckli
ng
Stre
ss
Ho
op
Str
ess
SRF
Cir
cum
fere
nti
al
Bu
ckli
ng
She
ar D
esi
gn
Bu
ckli
ng
Stre
ss
Tota
l Sh
ear
Stre
ss
SRF
She
ar
Bu
ckli
ng
SRF
Inte
ract
ion
Stre
ss
Re
serv
e
Fact
or
(Ult
m.)
-SR
FSR
FSR
FSR
FIn
tera
ct U
tili
tySR
FSR
Fu
(#)
[N/m
m2]
[N/m
m2]
[-]
[N/m
m2]
[N/m
m2]
[-]
[N/m
m2]
[N/m
m2]
[-]
[N/m
m2]
[N/m
m2]
[-]
[-]
[-]
[-]
[-]
[-]
3828
7.50
078
.677
3.65
424
0.01
877
.798
3.08
511
.985
0.02
5147
8.08
496
.388
6.82
114
.132
1.69
71.
669
0.16
06.
256
3.08
5
3728
7.50
080
.362
3.57
824
0.01
879
.492
3.01
911
.985
0.02
4449
1.39
096
.388
6.85
814
.056
1.69
71.
669
0.16
56.
043
3.01
9
3629
5.83
381
.723
3.62
024
0.01
880
.262
2.99
011
.985
0.02
4149
7.97
096
.388
8.91
810
.809
1.69
71.
669
0.17
55.
725
2.99
0
3529
5.83
310
3.38
82.
861
220.
867
102.
547
2.15
48.
287
0.02
6231
5.73
067
.224
7.65
78.
780
1.59
01.
582
0.32
73.
055
2.15
4
3429
5.83
311
8.46
22.
497
220.
867
117.
653
1.87
78.
287
0.01
9043
6.19
167
.224
8.02
38.
378
1.59
01.
582
0.40
22.
488
1.87
7
3329
5.83
312
4.26
12.
381
219.
013
123.
525
1.77
38.
655
0.01
3564
3.51
565
.285
7.83
28.
335
1.58
01.
577
0.44
02.
274
1.77
3
3229
5.83
314
2.85
22.
071
219.
013
142.
214
1.54
08.
655
0.01
3564
3.51
565
.285
7.83
28.
335
1.58
01.
577
0.54
11.
850
1.54
0
3129
5.83
315
4.98
21.
909
217.
146
154.
468
1.40
69.
135
0.01
3965
4.92
163
.529
7.33
48.
663
1.57
01.
573
0.61
91.
615
1.40
6
3029
5.83
317
8.59
41.
656
217.
146
178.
148
1.21
99.
135
0.01
4065
1.77
863
.529
7.33
48.
663
1.57
01.
573
0.76
61.
305
1.21
9
2929
5.83
317
6.79
51.
673
213.
388
176.
533
1.20
910
.434
0.01
5169
1.41
260
.325
5.63
710
.701
1.55
11.
566
0.77
01.
299
1.20
9
2829
5.83
316
4.90
91.
794
224.
468
164.
650
1.36
311
.811
0.01
2991
3.21
975
.666
5.40
613
.997
1.61
01.
604
0.62
21.
608
1.36
3
2729
5.83
318
4.02
11.
608
224.
468
183.
809
1.22
111
.811
0.05
3222
2.15
275
.666
5.40
613
.997
1.61
01.
604
0.73
91.
352
1.22
1
2629
5.83
320
3.13
41.
456
224.
468
202.
978
1.10
611
.811
0.12
0797
.889
75.6
665.
406
13.9
971.
610
1.60
40.
865
1.15
61.
106
2528
7.50
020
8.18
61.
381
222.
865
208.
279
1.07
012
.549
0.22
2656
.384
73.9
861.
575
46.9
801.
601
1.59
90.
899
1.11
21.
070
2428
7.50
020
8.37
01.
380
222.
865
208.
464
1.06
912
.549
0.22
3756
.088
73.9
861.
575
46.9
801.
601
1.59
90.
901
1.11
01.
069
2328
7.50
020
9.06
01.
375
225.
401
208.
987
1.07
914
.897
0.22
6765
.713
86.5
665.
097
16.9
821.
615
1.63
60.
895
1.11
81.
079
2228
7.50
020
9.62
01.
372
225.
401
209.
547
1.07
614
.897
0.22
6665
.749
86.5
665.
097
16.9
821.
615
1.63
60.
899
1.11
31.
076
2129
5.83
320
9.82
51.
410
225.
401
209.
752
1.07
514
.897
0.22
6565
.763
86.5
665.
097
16.9
821.
615
1.63
60.
900
1.11
11.
075
2029
5.83
322
3.65
91.
323
225.
401
223.
622
1.00
814
.897
0.22
3166
.779
86.5
664.
704
18.4
031.
615
1.63
60.
996
1.00
41.
004
1929
5.83
316
8.57
31.
755
225.
062
168.
563
1.33
516
.420
0.22
3273
.565
89.0
833.
700
24.0
741.
613
1.64
40.
633
1.58
01.
335
1829
5.83
317
8.63
41.
656
225.
062
178.
630
1.26
016
.420
0.22
3273
.567
89.0
833.
700
24.0
741.
613
1.64
40.
694
1.44
01.
260
1729
5.83
319
2.52
21.
537
225.
062
192.
527
1.16
916
.420
0.22
3273
.567
89.0
833.
700
24.0
741.
613
1.64
40.
783
1.27
81.
169
1629
5.83
320
6.40
61.
433
225.
062
206.
418
1.09
016
.420
0.22
3273
.567
89.0
833.
700
24.0
741.
613
1.64
40.
875
1.14
31.
090
1529
5.83
322
0.28
21.
343
225.
062
220.
300
1.02
216
.420
0.22
3273
.567
89.0
833.
700
24.0
741.
613
1.64
40.
971
1.02
91.
022
1429
5.83
322
1.96
11.
333
223.
520
221.
992
1.00
716
.190
0.22
9670
.523
87.7
823.
521
24.9
321.
604
1.64
00.
994
1.00
61.
006
1328
7.50
021
7.24
61.
323
221.
215
217.
357
1.01
815
.863
0.23
9166
.335
85.8
731.
110
77.3
971.
592
1.63
40.
973
1.02
81.
018
1228
7.50
021
7.37
71.
323
221.
215
217.
488
1.01
715
.863
0.23
9166
.335
85.8
731.
110
77.3
971.
592
1.63
40.
974
1.02
71.
017
1128
7.50
018
9.78
71.
515
222.
854
189.
827
1.17
426
.234
0.20
7912
6.15
810
0.72
22.
853
35.3
051.
601
1.68
40.
776
1.28
91.
174
1028
7.50
019
0.20
11.
512
231.
016
190.
248
1.21
432
.352
0.20
7915
5.59
410
9.99
12.
685
40.9
711.
646
1.72
00.
728
1.37
31.
214
929
5.83
317
5.27
31.
688
235.
489
175.
310
1.34
336
.662
0.19
1319
1.65
711
5.14
72.
627
43.8
371.
671
1.74
10.
612
1.63
41.
343
829
5.83
318
2.85
51.
618
235.
489
182.
907
1.28
736
.662
0.19
1019
1.93
511
5.14
72.
304
49.9
761.
671
1.74
10.
657
1.52
31.
287
729
5.83
316
1.56
91.
831
244.
351
161.
604
1.51
248
.194
0.15
8930
3.36
612
5.52
72.
193
57.2
371.
722
1.78
60.
491
2.03
51.
512
629
5.83
316
6.17
81.
780
244.
351
166.
214
1.47
048
.194
0.15
8930
3.36
612
5.52
72.
193
57.2
371.
722
1.78
60.
516
1.93
91.
470
529
5.83
317
5.18
31.
689
244.
351
175.
221
1.39
548
.194
0.15
8930
3.36
612
5.52
72.
193
57.2
371.
722
1.78
60.
565
1.77
11.
395
428
7.50
018
3.29
01.
569
244.
351
183.
364
1.33
348
.194
0.15
8930
3.36
612
5.52
70.
819
153.
205
1.72
21.
786
0.61
01.
639
1.33
3
328
7.50
017
7.69
11.
618
216.
091
177.
729
1.21
622
.399
0.15
8914
0.99
293
.180
2.19
342
.488
1.56
51.
658
0.73
81.
354
1.21
6
229
5.83
318
3.72
11.
610
270.
723
183.
761
1.47
328
7.50
00.
1589
1809
.720
165.
988
2.19
375
.686
1.88
72.
000
0.48
22.
076
1.47
3
129
5.83
318
4.33
91.
605
270.
723
184.
379
1.46
828
7.50
00.
1589
1809
.720
165.
988
2.19
375
.686
1.88
72.
000
0.48
52.
063
1.46
8
1.32
31.
007
56.0
888.
335
1.00
41.
004
Inte
ract
ion
Par
ame
ter
𝑓 𝑦𝑑
𝜎𝑟𝑒𝑓
𝜎𝑥,𝑅𝑑
𝜎𝑧
𝜎𝜃,𝑅𝑑
𝜎𝑎
𝜏 𝑥𝜃,𝑅𝑑
𝜏 𝑧𝜃
𝑘𝑥
𝑘𝜏

P 144 Selcuk SAHIN
Master Thesis developed at West Pomeranian University of Technology, Szczecin, Poland and The Lloyd’s
Register Foundation Research Centre of Excellence, Pusan, Republic of Korea
9.9. Fatigue Details
Sensor No Sensor Height
Experimental
Fatigue
Equivalent
Moment
Equivalent
Cycles
- -
[#] [m] [kNm] [#]
1 0 12329 1.00E+07
2 0.2 12281 1.00E+07
3 7.4 10601 1.00E+07
4 12.6 9424 1.00E+07
5 18.3 8181 1.00E+07
6 28.8 6225 1.00E+07
7 33 5536 1.00E+07
8 41.7 4239 1.00E+07
9 50.2 3200 1.00E+07
10 55.4 2886 1.00E+07
11 63 3024 1.00E+07
𝑛𝑒𝑞∆𝑀𝑥′𝑦.𝑒𝑞
Endurance
Number of
Cycles
N 36s 40s 45s 50s 56s 63s 71s 80s 90s 100s 112s 125s 140s 160s
[#] [MPa] [MPa] [MPa] [MPa] [MPa] [MPa] [MPa] [MPa] [MPa] [MPa] [MPa] [MPa] [MPa] [MPa]
1.00E+04 136.5809 151.7565 170.7261 189.6957 212.4592 239.0166 269.3679 303.5131 341.4522 379.3914 424.9183 474.2392 531.1479 607.0262
2.00E+06 36 40 45 50 56 63 71 80 90 100 112 125 140 160
5.00E+06 26.532 29.48 33.165 36.85 41.272 46.431 52.327 58.96 66.33 73.7 82.544 92.125 103.18 117.92
1.00E+08 14.566068 16.18452 18.207585 20.23065 22.658328 25.490619 28.727523 32.36904 36.41517 40.4613 45.316656 50.576625 56.64582 64.73808
1.09E+08 14.566068 16.18452 18.207585 20.23065 22.658328 25.490619 28.727523 32.36904 36.41517 40.4613 45.316656 50.576625 56.64582 64.73808
Detail Category

Wind Turbine Tower Structure Analysis According to Wind Load in Terms of Cost 145
“EMSHIP” Erasmus Mundus Master Course, period of study September 2014 – February 2016
9.10. Fatigue Calculation 1
Cro
ss
Sect
ion
Nu
mb
er
Leve
lM
ean
Dia
me
ter
Thic
kne
ss
Thic
kne
ss
Re
du
ctio
n
Fact
or
Stre
ss
Co
nce
ntr
atio
n
Fact
or
Be
nd
ing
Stre
ss
Ran
ge
De
sign
Be
nd
ing
Stre
ss
Ran
ge
Tors
ion
Stre
ss
Ran
ge
De
sign
Tors
ion
Stre
ss
Ran
ge
-H
Dm
iti
Wb
en
din
gW
tors
ion
Cre
d5*
10^6
1*10
^710
^85*
10^6
1*10
^710
^85*
10^6
1*10
^710
^82*
10^6
2*10
^6SC
F
(#)
[m]
[m]
[m]
[m3]
[m3]
[-]
[Mp
a][M
pa]
[Mp
a][M
pa]
[Mp
a][M
pa]
[Mp
a][M
pa]
[Mp
a][M
pa]
[Mp
a][-
][k
Nm
][k
Nm
][M
pa]
[Mp
a][M
pa]
[Mp
a]
3863
.000
2.30
00.
135.
129E
-01
1.02
6E+0
00.
7252
.31
51.0
728
.74
58.9
457
.55
32.3
966
.31
64.7
436
.43
71.0
071
.00
1.00
3024
.00
-101
5.00
5.90
7.46
0.49
0.63
32.4
7
3762
.750
2.30
00.
028.
239E
-02
1.64
8E-0
11.
0052
.31
51.0
728
.74
58.9
457
.55
32.3
966
.31
64.7
436
.43
71.0
080
.00
1.00
3019
.46
-101
7.00
36.6
546
.36
3.09
3.90
36.5
8
3662
.600
2.30
00.
028.
239E
-02
1.64
8E-0
11.
0052
.31
51.0
728
.74
58.9
457
.55
32.3
966
.31
64.7
436
.43
71.0
080
.00
1.00
3017
.28
-101
8.00
36.6
246
.33
3.09
3.91
36.5
8
3559
.900
2.60
00.
015
7.91
9E-0
21.
584E
-01
1.00
52.3
151
.07
28.7
458
.94
57.5
532
.39
66.3
164
.74
36.4
371
.00
80.0
01.
0029
68.5
5-1
037.
0037
.49
47.4
23.
274.
1436
.58
3457
.600
2.60
00.
015
7.91
9E-0
21.
584E
-01
1.00
52.3
151
.07
28.7
458
.94
57.5
532
.39
66.3
164
.74
36.4
371
.00
80.0
01.
0029
27.1
5-1
053.
0036
.97
46.7
63.
324.
2136
.58
3355
.400
2.70
00.
015
8.54
1E-0
21.
708E
-01
1.00
52.3
151
.07
28.7
458
.94
57.5
532
.39
66.3
164
.74
36.4
371
.00
71.0
01.
0028
86.8
5-1
069.
0033
.80
42.7
63.
133.
9632
.47
3253
.100
2.70
00.
015
8.54
1E-0
21.
708E
-01
1.00
52.3
151
.07
28.7
458
.94
57.5
532
.39
66.3
164
.74
36.4
371
.00
71.0
01.
0030
24.5
2-1
069.
0035
.41
44.8
03.
133.
9632
.47
3150
.200
2.80
00.
015
9.18
7E-0
21.
837E
-01
1.00
52.3
151
.07
28.7
458
.94
57.5
532
.39
66.3
164
.74
36.4
371
.00
71.0
01.
0031
97.3
4-1
069.
0034
.80
44.0
22.
913.
6832
.47
3047
.400
2.80
00.
015
9.18
7E-0
21.
837E
-01
1.00
52.3
151
.07
28.7
458
.94
57.5
532
.39
66.3
164
.74
36.4
371
.00
80.0
01.
0035
44.2
2-1
069.
0038
.58
48.8
02.
913.
6836
.58
2944
.500
3.00
00.
015
1.05
5E-0
12.
110E
-01
1.00
52.3
151
.07
28.7
458
.94
57.5
532
.39
66.3
164
.74
36.4
371
.00
80.0
01.
0038
93.6
9-1
069.
0036
.91
46.6
92.
533.
2036
.58
2841
.600
3.00
00.
018
1.26
5E-0
12.
530E
-01
1.00
52.3
151
.07
28.7
458
.94
57.5
532
.39
66.3
164
.74
36.4
371
.00
71.0
01.
0042
43.7
7-1
069.
0033
.55
42.4
42.
112.
6732
.47
2738
.800
3.00
00.
018
1.26
5E-0
12.
530E
-01
1.00
52.3
151
.07
28.7
458
.94
57.5
532
.39
66.3
164
.74
36.4
371
.00
80.0
01.
0046
69.5
4-1
069.
0036
.92
46.7
02.
112.
6736
.58
2635
.900
3.00
00.
018
1.26
5E-0
12.
530E
-01
1.00
52.3
151
.07
28.7
458
.94
57.5
532
.39
66.3
164
.74
36.4
371
.00
80.0
01.
0050
95.0
2-1
069.
0040
.28
50.9
62.
112.
6736
.58
2533
.100
3.10
00.
018
1.35
1E-0
12.
702E
-01
1.00
52.3
151
.07
28.7
458
.94
57.5
532
.39
66.3
164
.74
36.4
380
.00
90.0
01.
0055
20.3
5-1
069.
0040
.87
51.7
01.
982.
5041
.16
2433
.075
3.10
00.
171.
220E
+00
2.44
0E+0
00.
6852
.31
51.0
728
.74
58.9
457
.55
32.3
966
.31
64.7
436
.43
71.0
071
.00
1.00
5524
.82
-106
9.00
4.53
5.73
0.22
0.28
32.4
7
2333
.000
3.10
00.
171.
220E
+00
2.44
0E+0
00.
6852
.31
51.0
728
.74
58.9
457
.55
32.3
966
.31
64.7
436
.43
71.0
071
.00
1.00
5536
.00
-106
9.00
4.54
5.74
0.22
0.28
32.4
7
2232
.900
3.10
00.
018
1.35
1E-0
12.
702E
-01
1.00
52.3
151
.07
28.7
458
.94
57.5
532
.39
66.3
164
.74
36.4
380
.00
90.0
01.
0055
48.3
0-1
069.
0041
.07
51.9
61.
982.
5041
.16
2132
.895
3.10
00.
018
1.35
1E-0
12.
702E
-01
1.00
52.3
151
.07
28.7
458
.94
57.5
532
.39
66.3
164
.74
36.4
380
.00
90.0
01.
0055
53.2
3-1
069.
0041
.11
52.0
11.
982.
5041
.16
2030
.850
3.10
00.
018
1.35
1E-0
12.
702E
-01
1.00
52.3
151
.07
28.7
458
.94
57.5
532
.39
66.3
164
.74
36.4
380
.00
90.0
01.
0058
88.7
0-1
069.
0043
.59
55.1
51.
982.
5041
.16
1928
.800
3.50
00.
021.
913E
-01
3.82
7E-0
11.
0052
.31
51.0
728
.74
58.9
457
.55
32.3
966
.31
64.7
436
.43
71.0
071
.00
1.00
6224
.18
-106
9.00
32.5
341
.15
1.40
1.77
32.4
7
1826
.700
3.50
00.
021.
913E
-01
3.82
7E-0
11.
0052
.31
51.0
728
.74
58.9
457
.55
32.3
966
.31
64.7
436
.43
71.0
071
.00
1.00
6605
.02
-106
9.00
34.5
243
.67
1.40
1.77
32.4
7
1723
.900
3.50
00.
021.
913E
-01
3.82
7E-0
11.
0052
.31
51.0
728
.74
58.9
457
.55
32.3
966
.31
64.7
436
.43
71.0
080
.00
1.00
7130
.35
-106
9.00
37.2
747
.14
1.40
1.77
36.5
8
1621
.100
3.50
00.
021.
913E
-01
3.82
7E-0
11.
0052
.31
51.0
728
.74
58.9
457
.55
32.3
966
.31
64.7
436
.43
71.0
080
.00
1.00
7655
.30
-106
9.00
40.0
150
.61
1.40
1.77
36.5
8
1518
.300
3.50
00.
021.
913E
-01
3.82
7E-0
11.
0052
.31
51.0
728
.74
58.9
457
.55
32.3
966
.31
64.7
436
.43
80.0
090
.00
1.00
8179
.70
-106
9.00
42.7
554
.08
1.40
1.77
41.1
6
1415
.400
3.60
00.
022.
025E
-01
4.04
9E-0
11.
0052
.31
51.0
728
.74
58.9
457
.55
32.3
966
.31
64.7
436
.43
80.0
090
.00
1.00
8792
.69
-106
9.00
43.4
354
.94
1.32
1.67
41.1
6
1312
.685
3.75
00.
022.
197E
-01
4.39
5E-0
11.
0052
.31
51.0
728
.74
58.9
457
.55
32.3
966
.31
64.7
436
.43
80.0
090
.00
1.00
9405
.46
-106
9.00
42.8
154
.15
1.22
1.54
41.1
6
1212
.655
3.75
00.
192.
002E
+00
4.00
5E+0
00.
6752
.31
51.0
728
.74
58.9
457
.55
32.3
966
.31
64.7
436
.43
71.0
071
.00
1.00
9412
.01
-106
9.00
4.70
5.95
0.13
0.17
32.4
7
1112
.560
3.75
00.
192.
002E
+00
4.00
5E+0
00.
6752
.31
51.0
728
.74
58.9
457
.55
32.3
966
.31
64.7
436
.43
71.0
071
.00
1.00
9433
.05
-106
9.00
4.71
5.96
0.13
0.17
32.4
7
1012
.465
3.75
00.
023
2.52
5E-0
15.
050E
-01
1.00
52.3
151
.07
28.7
458
.94
57.5
532
.39
66.3
164
.74
36.4
371
.00
80.0
01.
0094
54.5
6-1
069.
0037
.45
47.3
71.
061.
3436
.58
912
.435
3.75
00.
025
2.74
3E-0
15.
486E
-01
1.00
52.3
151
.07
28.7
458
.94
57.5
532
.39
66.3
164
.74
36.4
371
.00
71.0
01.
0094
61.3
5-1
069.
0034
.49
43.6
30.
971.
2332
.47
810
.300
3.75
00.
025
2.74
3E-0
15.
486E
-01
1.00
52.3
151
.07
28.7
458
.94
57.5
532
.39
66.3
164
.74
36.4
371
.00
80.0
01.
0099
40.0
7-1
069.
0036
.24
45.8
40.
971.
2336
.58
77.
400
3.75
00.
033.
287E
-01
6.57
5E-0
10.
9652
.31
51.0
728
.74
58.9
457
.55
32.3
966
.31
64.7
436
.43
71.0
071
.00
1.00
1060
3.33
-106
9.00
32.2
640
.80
0.81
1.03
32.4
7
65.
800
3.75
00.
033.
287E
-01
6.57
5E-0
10.
9652
.31
51.0
728
.74
58.9
457
.55
32.3
966
.31
64.7
436
.43
71.0
071
.00
1.00
1095
6.33
-106
9.00
33.3
342
.16
0.81
1.03
32.4
7
52.
900
3.75
00.
033.
287E
-01
6.57
5E-0
10.
9652
.31
51.0
728
.74
58.9
457
.55
32.3
966
.31
64.7
436
.43
71.0
071
.00
1.00
1163
7.00
-106
9.00
35.4
044
.78
0.81
1.03
32.4
7
40.
300
3.75
00.
033.
287E
-01
6.57
5E-0
10.
9652
.31
51.0
728
.74
58.9
457
.55
32.3
966
.31
64.7
436
.43
71.0
080
.00
1.00
1225
5.33
-106
9.00
37.2
847
.16
0.81
1.03
36.5
8
30.
270
3.75
00.
22.
103E
+00
4.20
6E+0
00.
6652
.31
51.0
728
.74
58.9
457
.55
32.3
966
.31
64.7
436
.43
71.0
071
.00
1.00
1226
4.67
-106
9.00
5.83
7.38
0.13
0.16
32.4
7
20.
200
3.75
00.
033.
287E
-01
6.57
5E-0
10.
9652
.31
51.0
728
.74
58.9
457
.55
32.3
966
.31
64.7
436
.43
71.0
080
.00
1.00
1228
1.00
-106
9.00
37.3
647
.26
0.81
1.03
36.5
8
10.
000
3.75
00.
033.
287E
-01
6.57
5E-0
10.
9652
.31
51.0
728
.74
58.9
457
.55
32.3
966
.31
64.7
436
.43
71.0
080
.00
1.00
1232
9.00
-106
9.00
37.5
047
.44
0.81
1.03
36.5
8
Sect
ion
Mo
du
lus
Fati
gue
Eq
uiv
ale
nt
Mo
me
nt
De
tail
Cat
ego
ry 7
1-80
-90
In T
erm
s o
f C
ycle
De
tail
Cat
ego
ry
∆𝑀𝑦
∆𝜎𝑖
∆𝜎𝑖,𝑑
∆𝜎 𝑓
𝑎𝑡 0
∆𝜎 𝑓
𝑎𝑡71
∆𝜎 𝑓
𝑎𝑡 0
∆𝑀𝑧
∆𝜏 𝑖
∆𝜏 𝑖,𝑑

P 146 Selcuk SAHIN
Master Thesis developed at West Pomeranian University of Technology, Szczecin, Poland and The Lloyd’s
Register Foundation Research Centre of Excellence, Pusan, Republic of Korea
9.11. Fatigue Calculation 2
Nu
mb
er
of
Cyc
les
to
Fail
ure
wit
h
De
sign
Str
.
Nu
mb
er
of
Cyc
les
to
Fail
ure
wit
h
De
sign
Str
.
Be
nd
ing
Stre
ss
Sum
mat
ion
Tors
ion
Str
ess
Sum
mat
ion
PM
-Su
mm
atio
n
Nu
mb
er
of
Cyc
les
to
Fail
ure
Fati
gue
Lif
e -
De
l
5*10
^610
^85*
10^6
1*10
^710
^8m
mN
ND
dσ
Dd
τD
amag
eLo
gaLo
gaa
a∆
σR
∆σ
R∆
σli
m∆
σli
mN
iSM
F M
ySM
F M
yD
amag
eD
amag
eSR
FSR
FYr
[Mp
a][M
pa]
[Mp
a][M
pa]
[Mp
a][-
][-
][#
][#
][M
pa]
[Mp
a][-
][-
][-
][-
][-
][M
pa]
[Mp
a][M
pa]
[Mp
a][#
][%
][%
][-
][-
]∆
σli
m/σ
i∆
σli
m/σ
iYe
ar
52.3
128
.74
52.3
151
.07
28.7
45.
005.
006.
53E+
090.
00E+
000.
000.
000.
000
15.2
8615
.286
1.93
E+15
1.93
E+15
45.4
245
.42
35.9
035
.90
1.50
E+11
357.
76%
357.
76%
0.00
20.
002
6.08
96.
089
8781
.81
52.3
128
.74
58.9
457
.55
32.3
95.
005.
006.
64E+
060.
00E+
000.
300.
000.
301
15.2
8615
.536
1.93
E+15
3.44
E+15
45.4
250
.96
35.9
040
.28
8.42
E+07
2.41
%15
.39%
0.90
90.
564
0.98
01.
099
35.4
6
52.3
128
.74
58.9
457
.55
32.3
95.
005.
006.
67E+
060.
00E+
000.
300.
000.
300
15.2
8615
.536
1.93
E+15
3.44
E+15
45.4
250
.96
35.9
040
.28
8.45
E+07
2.48
%15
.48%
0.90
70.
562
0.98
01.
100
35.5
6
52.3
128
.74
58.9
457
.55
32.3
95.
005.
005.
93E+
060.
00E+
000.
340.
000.
337
15.2
8615
.536
1.93
E+15
3.44
E+15
45.4
250
.96
35.9
040
.28
7.52
E+07
0.12
%12
.81%
0.99
50.
617
0.95
81.
075
32.3
9
52.3
128
.74
58.9
457
.55
32.3
95.
005.
006.
36E+
060.
00E+
000.
310.
000.
314
15.2
8615
.536
1.93
E+15
3.44
E+15
45.4
250
.96
35.9
040
.28
8.07
E+07
1.54
%14
.41%
0.94
10.
584
0.97
11.
090
34.2
7
52.3
128
.74
52.3
151
.07
28.7
45.
005.
005.
48E+
060.
00E+
000.
360.
000.
365
15.2
8615
.286
1.93
E+15
1.93
E+15
45.4
245
.42
35.9
035
.90
1.26
E+08
11.0
5%11
.05%
0.65
80.
658
1.06
21.
062
30.4
2
52.3
128
.74
52.3
151
.07
28.7
45.
005.
004.
34E+
060.
00E+
000.
460.
000.
460
15.2
8615
.286
1.93
E+15
1.93
E+15
45.4
245
.42
35.9
035
.90
1.00
E+08
5.99
%5.
99%
0.79
20.
792
1.01
41.
014
25.2
4
52.3
128
.74
52.3
151
.07
28.7
45.
005.
004.
74E+
060.
00E+
000.
420.
000.
422
15.2
8615
.286
1.93
E+15
1.93
E+15
45.4
245
.42
35.9
035
.90
1.09
E+08
7.85
%7.
85%
0.73
90.
739
1.03
21.
032
27.0
6
52.3
128
.74
58.9
457
.55
32.3
95.
005.
005.
14E+
060.
00E+
000.
390.
000.
389
15.2
8615
.536
1.93
E+15
3.44
E+15
45.4
250
.96
35.9
040
.28
6.52
E+07
-2.7
0%9.
63%
1.11
60.
692
0.93
11.
044
28.8
9
52.3
128
.74
58.9
457
.55
32.3
95.
005.
006.
42E+
060.
00E+
000.
310.
000.
312
15.2
8615
.536
1.93
E+15
3.44
E+15
45.4
250
.96
35.9
040
.28
8.14
E+07
1.70
%14
.59%
0.93
50.
580
0.97
31.
091
34.4
9
52.3
128
.74
52.3
151
.07
28.7
45.
005.
005.
69E+
060.
00E+
000.
350.
000.
352
15.2
8615
.286
1.93
E+15
1.93
E+15
45.4
245
.42
35.9
035
.90
1.31
E+08
11.8
7%11
.87%
0.63
90.
639
1.07
01.
070
31.3
2
52.3
128
.74
58.9
457
.55
32.3
95.
005.
006.
41E+
060.
00E+
000.
310.
000.
312
15.2
8615
.536
1.93
E+15
3.44
E+15
45.4
250
.96
35.9
040
.28
8.12
E+07
1.67
%14
.55%
0.93
60.
581
0.97
21.
091
34.4
4
52.3
128
.74
58.9
457
.55
32.3
95.
005.
004.
14E+
060.
00E+
000.
480.
000.
483
15.2
8615
.536
1.93
E+15
3.44
E+15
45.4
250
.96
35.9
040
.28
5.25
E+07
-6.8
2%4.
99%
1.32
70.
823
0.89
11.
000
24.3
0
58.9
432
.39
66.3
164
.74
36.4
35.
005.
006.
94E+
060.
00E+
000.
290.
000.
288
15.5
3615
.786
3.44
E+15
6.11
E+15
50.9
657
.17
40.2
845
.20
8.87
E+07
3.48
%16
.42%
0.87
20.
544
0.98
61.
106
36.7
4
52.3
128
.74
52.3
151
.07
28.7
45.
005.
001.
87E+
100.
00E+
000.
000.
000.
000
15.2
8615
.286
1.93
E+15
1.93
E+15
45.4
245
.42
35.9
035
.90
4.30
E+11
464.
92%
464.
92%
0.00
10.
001
7.92
87.
928
2036
9.15
52.3
128
.74
52.3
151
.07
28.7
45.
005.
001.
85E+
100.
00E+
000.
000.
000.
000
15.2
8615
.286
1.93
E+15
1.93
E+15
45.4
245
.42
35.9
035
.90
4.26
E+11
463.
78%
463.
78%
0.00
10.
001
7.91
27.
912
2020
5.09
58.9
432
.39
66.3
164
.74
36.4
35.
005.
006.
77E+
060.
00E+
000.
300.
000.
295
15.5
3615
.786
3.44
E+15
6.11
E+15
50.9
657
.17
40.2
845
.20
8.65
E+07
2.96
%15
.83%
0.89
00.
555
0.98
11.
100
36.0
1
58.9
432
.39
66.3
164
.74
36.4
35.
005.
006.
74E+
060.
00E+
000.
300.
000.
297
15.5
3615
.786
3.44
E+15
6.11
E+15
50.9
657
.17
40.2
845
.20
8.61
E+07
2.87
%15
.73%
0.89
30.
557
0.98
01.
099
35.8
8
58.9
432
.39
66.3
164
.74
36.4
35.
005.
005.
03E+
060.
00E+
000.
400.
000.
398
15.5
3615
.786
3.44
E+15
6.11
E+15
50.9
657
.17
40.2
845
.20
6.42
E+07
-2.9
9%9.
14%
1.12
90.
705
0.92
41.
037
28.3
7
52.3
128
.74
52.3
151
.07
28.7
45.
005.
006.
64E+
060.
00E+
000.
300.
000.
301
15.2
8615
.286
1.93
E+15
1.93
E+15
45.4
245
.42
35.9
035
.90
1.53
E+08
15.3
8%15
.38%
0.56
40.
564
1.10
41.
104
35.4
5
52.3
128
.74
52.3
151
.07
28.7
45.
005.
004.
93E+
060.
00E+
000.
410.
000.
405
15.2
8615
.286
1.93
E+15
1.93
E+15
45.4
245
.42
35.9
035
.90
1.14
E+08
8.73
%8.
73%
0.71
60.
716
1.04
01.
040
27.9
5
52.3
128
.74
58.9
457
.55
32.3
95.
005.
006.
11E+
060.
00E+
000.
330.
000.
327
15.2
8615
.536
1.93
E+15
3.44
E+15
45.4
250
.96
35.9
040
.28
7.75
E+07
0.72
%13
.49%
0.97
20.
603
0.96
31.
081
33.1
7
52.3
128
.74
58.9
457
.55
32.3
95.
005.
004.
29E+
060.
00E+
000.
470.
000.
467
15.2
8615
.536
1.93
E+15
3.44
E+15
45.4
250
.96
35.9
040
.28
5.43
E+07
-6.1
9%5.
70%
1.29
10.
801
0.89
71.
007
24.9
7
58.9
432
.39
66.3
164
.74
36.4
35.
005.
005.
54E+
060.
00E+
000.
360.
000.
361
15.5
3615
.786
3.44
E+15
6.11
E+15
50.9
657
.17
40.2
845
.20
7.08
E+07
-1.0
7%11
.29%
1.04
40.
652
0.94
21.
057
30.6
8
58.9
432
.39
66.3
164
.74
36.4
35.
005.
005.
12E+
060.
00E+
000.
390.
000.
390
15.5
3615
.786
3.44
E+15
6.11
E+15
50.9
657
.17
40.2
845
.20
6.55
E+07
-2.6
2%9.
55%
1.11
20.
694
0.92
81.
041
28.8
1
58.9
432
.39
66.3
164
.74
36.4
35.
005.
005.
51E+
060.
00E+
000.
360.
000.
363
15.5
3615
.786
3.44
E+15
6.11
E+15
50.9
657
.17
40.2
845
.20
7.04
E+07
-1.2
0%11
.15%
1.04
90.
655
0.94
11.
056
30.5
3
52.3
128
.74
52.3
151
.07
28.7
45.
005.
001.
39E+
100.
00E+
000.
000.
000.
000
15.2
8615
.286
1.93
E+15
1.93
E+15
45.4
245
.42
35.9
035
.90
3.19
E+11
432.
27%
432.
27%
0.00
10.
001
7.63
87.
638
1605
3.50
52.3
128
.74
52.3
151
.07
28.7
45.
005.
001.
37E+
100.
00E+
000.
000.
000.
000
15.2
8615
.286
1.93
E+15
1.93
E+15
45.4
245
.42
35.9
035
.90
3.16
E+11
431.
09%
431.
09%
0.00
10.
001
7.62
17.
621
1591
0.70
52.3
128
.74
58.9
457
.55
32.3
95.
005.
005.
97E+
060.
00E+
000.
340.
000.
335
15.2
8615
.536
1.93
E+15
3.44
E+15
45.4
250
.96
35.9
040
.28
7.57
E+07
0.24
%12
.94%
0.99
10.
615
0.95
91.
076
32.5
4
52.3
128
.74
52.3
151
.07
28.7
45.
005.
004.
95E+
060.
00E+
000.
400.
000.
404
15.2
8615
.286
1.93
E+15
1.93
E+15
45.4
245
.42
35.9
035
.90
1.14
E+08
8.82
%8.
82%
0.71
30.
713
1.04
11.
041
28.0
4
52.3
128
.74
58.9
457
.55
32.3
95.
005.
007.
03E+
060.
00E+
000.
280.
000.
284
15.2
8615
.536
1.93
E+15
3.44
E+15
45.4
250
.96
35.9
040
.28
8.91
E+07
3.58
%16
.71%
0.86
90.
539
0.99
11.
112
37.1
0
52.3
128
.74
52.3
151
.07
28.7
45.
005.
005.
77E+
060.
00E+
000.
350.
000.
346
15.2
8615
.286
1.93
E+15
1.93
E+15
45.4
245
.42
35.9
035
.90
1.33
E+08
12.2
0%12
.20%
0.63
10.
631
1.11
31.
113
31.6
9
52.3
128
.74
52.3
151
.07
28.7
45.
005.
004.
90E+
060.
00E+
000.
410.
000.
408
15.2
8615
.286
1.93
E+15
1.93
E+15
45.4
245
.42
35.9
035
.90
1.13
E+08
8.58
%8.
58%
0.71
90.
719
1.07
71.
077
27.8
0
52.3
128
.74
52.3
151
.07
28.7
45.
005.
003.
63E+
060.
00E+
000.
550.
000.
552
15.2
8615
.286
1.93
E+15
1.93
E+15
45.4
245
.42
35.9
035
.90
8.35
E+07
2.23
%2.
23%
0.91
50.
915
1.01
41.
014
21.8
5
52.3
128
.74
58.9
457
.55
32.3
95.
005.
005.
08E+
060.
00E+
000.
390.
000.
393
15.2
8615
.536
1.93
E+15
3.44
E+15
45.4
250
.96
35.9
040
.28
6.45
E+07
-2.9
3%9.
38%
1.12
60.
699
0.96
31.
081
28.6
3
52.3
128
.74
52.3
151
.07
28.7
45.
005.
004.
48E+
090.
00E+
000.
000.
000.
000
15.2
8615
.286
1.93
E+15
1.93
E+15
45.4
245
.42
35.9
035
.90
1.03
E+11
324.
62%
324.
62%
0.00
30.
003
6.15
66.
156
6501
.85
52.3
128
.74
58.9
457
.55
32.3
95.
005.
005.
03E+
060.
00E+
000.
400.
000.
398
15.2
8615
.536
1.93
E+15
3.44
E+15
45.4
250
.96
35.9
040
.28
6.38
E+07
-3.1
3%9.
15%
1.13
60.
705
0.96
11.
078
28.3
9
52.3
128
.74
58.9
457
.55
32.3
95.
005.
004.
93E+
060.
00E+
000.
410.
000.
405
15.2
8615
.536
1.93
E+15
3.44
E+15
45.4
250
.96
35.9
040
.28
6.25
E+07
-3.5
1%8.
73%
1.15
30.
716
0.95
71.
074
27.9
5
0.55
1.32
70.
915
0.89
11.
000
21.8
5
Fati
gue
dam
age
(be
nd
ing)
- D
ELW
oh
ler
Log
Wo
hle
r a
All
ow
able
Str
ess
De
sign
Str
ess
Ran
ge
(Exp
)
Fati
gue
dam
age
(be
nd
ing)
- D
ELD
eta
il C
ate
gory
71-
80-9
0 In
Te
rms
of
Cyc
leW
oh
ler
Exp
on
en
tSt
ress
Re
serv
e F
acto
r
Fati
gue

Wind Turbine Tower Structure Analysis According to Wind Load in Terms of Cost 147
“EMSHIP” Erasmus Mundus Master Course, period of study September 2014 – February 2016
9.12. Flange Failure Modes 1
Bo
tto
m
Flan
ge
Bo
tto
m
Mid
dle
Mid
dle
Top
Bo
tto
mB
ott
om
Mid
dle
1
Top
Mid
dle
1
Min
or
She
et
Thic
kne
ssts
min
3020
18[m
m]
Min
. All
ow
. Fo
rce
Fai
lure
Mo
de
A11
7658
858
8[k
N]
Maj
or
She
et
Thic
kne
ssts
ma
j30
2018
[mm
]M
in. A
llo
w. F
orc
e F
ailu
re M
od
eB
1072
425
378
[kN
]
She
et
Mat
eri
al-
[-]
Min
. All
ow
. Fo
rce
Fai
lure
Mo
de
C-
--
[kN
]
Ou
ter
Flan
ge D
iam
ete
rD
o37
8037
7031
18[m
m]
Min
. All
ow
. Fo
rce
Fai
lure
Mo
de
D41
645
067
1[k
N]
Flan
ge W
idth
Wf
200
190
170
[mm
]M
in. A
llo
w. F
orc
e F
ailu
re M
od
eE
735
1657
1993
[kN
]
Inn
er
Flan
ge D
iam
ete
rD
i33
8033
9027
78[m
m]
ZU,m
inM
inu
mu
m A
llo
wab
le S
eg.
Fo
rce
Min
. ZU
416
425
378
[kN
]
Thic
kne
ss-w
idth
rat
ioR
tw2.
862.
001.
70[-
]Eu
roco
de
Re
stri
ctio
n 1
ok
ok
ok
Flan
ge T
hic
kne
sstf
7095
100
[mm
]Eu
roco
de
Re
stri
ctio
n 2
ok
ok
ok
Bo
lt C
ircl
e D
iam
ete
rD
bc
3455
3529
2982
[mm
]35
65
Qu
alit
y o
f b
olt
10.9
10.9
10.9
10.9
[-]
Bo
lt F
orc
e M
od
e A
-BSe
gme
nt
Forc
eZ
384.
6833
8.68
360.
46[k
N]
Bo
lt S
ize
M36
M36
M36
M36
mm
Min
um
um
All
ow
able
Se
g. F
orc
eZa
ll41
642
537
8[k
N]
Nu
mb
er
of
Bo
lts
n16
014
496
[#]
Extr
em
e
SRF
1.08
1.25
1.05
Ho
le s
ize
dH
4239
39[m
m]
Dis
tan
ce B
etw
ee
n B
olt
sc
6879
98[m
m]
Flan
ge L
eve
lh
f0.
212
.56
33[m
]Fl
ange
Be
nd
ing
Mo
de
C-D
-ESe
gme
nt
Forc
eZ
384.
6833
8.68
360.
46[k
N]
Pre
-str
ess
Fo
rce
Fv51
051
051
0[k
N]
All
ow
able
Se
gme
nt
Forc
e -
Bo
ltZa
ll41
645
067
1[k
N]
No
rmal
fo
rce
-De
sign
Fz,f
l17
8314
9811
47[k
N]
Extr
em
e
SRF
1.08
1.33
1.86
Max
. be
nd
ing
mo
me
nt-
De
sign
Mre
s57
702
4572
2.33
2681
8[k
Nm
]

P 148 Selcuk SAHIN
Master Thesis developed at West Pomeranian University of Technology, Szczecin, Poland and The Lloyd’s
Register Foundation Research Centre of Excellence, Pusan, Republic of Korea
9.13. Flange Failure Modes 2
Bold Size 36 36 36 36 [-]
Bold Quality 10.9 10.9 10.9 10.9 [-]
Ultimate tensile stress fub 1000 1000 1000 [N/mm2]
Ultimate tensile force Gub 817 817 817 [kN]
Characteristic Yield Stress Bolt fyk 900 900 900 [N/mm2]
Characteristic Yield Strength Bolt Ft,R 735 735 735 [kN]
Pre-stress force -char. Fvc 510 510 510 [kN]
Pre-stress/yield force ratio Rv 69% 69% 69% %
Pre-stress force - design Fvd 510 510 510 [kN]
Young Modulus - bolt E 210000 210000 210000 [N/mm2]
Shaft Diameter d 36 36 36 [mm]
Contact Surface Diameter dw 57 57 57 [mm]
Height Triangle on the thread H 3.46 3.46 3.46 [mm]
Basic Minor Diameter d1 31.67 31.67 31.67 [mm]
Middle Diameter d2 33.40 33.40 33.40 [mm]
Core Diameter d3 31.09 31.09 31.09 [mm]
Stress Area As 816.7 816.7 816.7 [mm2]
Shaft Area AN 1018 1018 1018 [mm2]
Bolt Length I 245 245 205 [mm]
Thread Length Ithr 48 48 48 [mm]
Ftrd 668.22759 668.2276 668.2276
Yield Stress - flange - character fy,k,fl 290 290 290
Yield Stress - flange - design fy,d,fl 264 264 264
Partial Safety Coef. -yield. -fl. gM 1.1 1.1 1.1
Arc Length Between Bolts (m) cm 74 82 101
Mean Radious rmi 1875 1875 1550 [mm]
Number of Bolts n 160 144 96 [#]
Flange Neck Thickness tneck 30 20 18 [mm]
Plastic Moment Resistance MPL,3,L 4.37E+06 2.16E+06 2.17E+06 [Nmm]
423.148 372.5523 396.5027
Segment Force Z 384.68 338.6839 360.457 [kN]
Plastic Shear Force Resistance NPL,3 582 431 481
Plastic Moment Resistance MP,L,3,M/N 2.46E+06 8.27E+05 9.52E+05 [Nmm]
Distance (DDC-DI) a 37.5 139 102 [mm]
Distance (Dm-DDC) b 147.5 55.25 59 [mm]
13545.863 4.68E+03 6284.657
Radious from Bolt Center rbc 1727.5 1819.75 1491 [mm]
Arc Length Between Bolt Cn (m) c 68 79 98
Plastic Moment Resistance MPL,2 2.19E+07 4.72E+07 6.43E+07
Plastic Moment Resistance M'PL,2 8.34E+06 2.40E+07 3.86E+07
Washer Thickness tw 6 6 6 [mm]
Washer Outer Diameter Dw 66 66 66 [mm]
Washer Inner Diameter dw 37 37 37 [mm]
ΔMPL,2 15877.087 7718.029 7718.029
Plastic Moment Resistance MPL,3,T 2.38E+07 4.87E+07 6.69E+07 [Nmm]
Segment Force Z 384.68 338.6839 360.457 [kN]
Plastic Shear Force Resistance VPL,3 785 1183 1544
Plastic Moment Resistance MP,L,3,M/V 2.24E+07 4.87E+07 6.69E+07 [Nmm]
b'E 120.5 29 32.75