(Wide) Soil Flushing. Innovative Technology Summary Report
30
DOE/EM-0577 Well Injection Depth Extraction (WIDE) Soil Flushing Industry Programs Prepared for U.S. Department of Energy Office of Environmental Management Office of Science and Technology May 2001
Transcript of (Wide) Soil Flushing. Innovative Technology Summary Report

DOE/EM-0577
Well Injection DepthExtraction (WIDE)
Soil Flushing
Industry Programs
Prepared forU.S. Department of Energy
Office of Environmental ManagementOffice of Science and Technology
May 2001
Well Injection DepthExtraction (WIDE)
Soil Flushing
OST/TMS ID 2172
Industry Programs
Demonstrated atDOE Ohio Field Office
Ashtabula Environmental Management Project (AEMP)Ashtabula, Ohio

Purpose of this document
Innovative Technology Summary Reports are designed to provide potential users with theinformation they need to quickly determine whether a technology would apply to a particularenvironmental management problem. They are also designed for readers who may recommendthat a technology be considered by prospective users.
Each report describes a technology, system, or process that has been developed and testedwith funding from DOE’s Office of Science and Technology (OST). A report presents the fullrange of problems that a technology, system, or process will address and its advantages to theDOE cleanup in terms of system performance, cost, and cleanup effectiveness. Most reportsinclude comparisons to baseline technologies as well as other competing technologies.Information about commercial availability and technology readiness for implementation is alsoincluded. Innovative Technology Summary Reports are intended to provide summaryinformation. References for more detailed information are provided in an appendix.
Efforts have been made to provide key data describing the performance, cost, and regulatoryacceptance of the technology. If this information was not available at the time of publication, theomission is noted.
All published Innovative Technology Summary Reports are available on the OST Web site athttp://ost.em.doe.gov under “Publications.”

TABLE OF CONTENTS
1. SUMMARY page 1
2. TECHNOLOGY DESCRIPTION page 4
3. PERFORMANCE page 7
4. TECHNOLOGY APPLICABILITY AND ALTERNATIVES page 12
5. COST page 15
6. REGULATORY AND POLICY ISSUES page 21
7. LESSONS LEARNED page 22
APPENDICES
A. REFERENCES page 23
B. PERFORMANCE FIGURES page 24
C. ACRONYMS AND ABBREVIATIONS page 26

1
SECTION 1SUMMARY
Technology Summary
Problem:
Contamination in low-permeability, high-clay-fraction soils poses a significant technical challenge to in situremediation efforts. Conventional technologies such as pump and treat groundwater remediation, and vaporextraction using conventional well fields, are typically ineffective when applied to sites with low permeabilitysoils.
Solution:
An innovative subsurface remediation technology, termed Well Injection Depth Extraction (WIDE), has beendeveloped by researchers from North Carolina State University (NCSU). The WIDE system is a hybrid soilflushing/soil gas extraction system that uses Prefabricated Vertical Wells (PVWs) for the in situ remediationof contaminated fine-grained soils with hydraulic conductivities ranging from 10-3 to 10-8 cm/s. The WIDEsystem has been field demonstrated as suitable for removal of dissolved-phase contaminants, dense non-aqueous phase liquids (DNAPLs), and light non-aqueous phase liquids (LNAPLs). A photograph of thedemonstration system at DOE’s Ashtabula Environmental Management Project (AEMP) is presented inFigure 1 below.
How it Works
The WIDE system utilizes PVWs in lieu of conventional wells or sumps to extract groundwater and injectliquid flushing agents. PVWs are constructed of a geosynthetic composite system consisting of an innercore, and an outer filter jacket. A typical PVW measures 4 inches (100mm) in width by 0.15 inches (4mm)in thickness. The PVWs are used for extraction of groundwater and soil gase and injection of flushingliquids. Installed at relatively close spacing (< 3 ft), the PVWs shorten groundwater drainage paths andaccelerate the soil flushing process. The PVWs are installed using direct push technology (e.g.hydraulically driven mandrel) at fast rates of 10 ft/s into firm clay soils. After installation, the PVWs are
Figure 1. WIDETM demonstration system.

2
connected at the surface with manifold piping, and a vacuum is applied to extract the groundwater andvolatilize contaminants. Appropriate surface treatment trains are utilized to treat extracted groundwater andsoil gas.
Potential Markets
• Remediation of low permeability soils (clays/silts) by removal of contaminated groundwater and gases• Delivery of various flushing/treatment agents (e.g. surfactant, oxidation agents, and biological nutrients)• Leaking Underground Storage Tank (UST) sites
Advantages over baseline
The WIDE technology has the following advantages over the baseline technology (conventional pump andtreat remediation):
• Applicable to soils with low hydraulic conductivities (k : 10-3 to 10-8 cm/s)• PVWs can be utilized for soil gas extraction, air injection, liquid extraction, and liquid injection• Installation of PVWs is rapid and inexpensive with no drilling required• PVWs can be economically installed at relatively close spacings (< 3 ft), thereby shortening
contaminant transport pathways• Shorten typical pump and treat remediation duration• Depth specific injection and extraction capability• Targets the source points of a plume, thereby minimizing the volume of liquids being extracted• Expedited contaminant recovery with reduced long-term operating costs
Demonstration Summary
The WIDE system was demonstrated at DOE's AEMP, which is located at a former uranium manufacturingsite owned by RMI Environmental Services (RMIES). The site's groundwater and soils are contaminated withtrichloroethylene (TCE), uranium (U), and technetium-99 (99Tc) as a result of long-term uraniummanufacturing operations for the DOE’s weapons complex. Subsurface remediation at AEMP is technicallychallenging due to the site’s glacial till soil exhibiting low hydraulic conductivity and having a high clayfraction. The proposed corrective action to address the site’s soil and groundwater contamination is ex situvapor stripping for source control combined with a groundwater interceptor trench with traditional pump andtreat for migration control. The overall remediation time frame for this option is estimated between 18 to 87years.
The field-scale demonstration of the WIDE system measured 70 ft by 70 ft and included a grid of over 480PVWs installed to a depth of 15 ft. The system utilized a vacuum extraction unit to remove the groundwaterand simultaneously volatilize the TCE. An above-ground treatment system was constructed to treat TCE-contaminated groundwater and soil gas. The site’s existing wastewater treatment plant (WTP) was utilizedto treat the radioactive constituents.
The WIDE system successfully extracted TCE, U, and 99Tc from the subsurface, thereby reducing theconcentration of these contaminants in the groundwater. Under extraction only operation, TCE removal wasenhanced by volatilizing TCE from the soil. The system was able to exchange one pore volume ofgroundwater through the sites low permeability soils in 258 hours of operation. Injection of liquids throughPVWs with concurrent extraction was found to increase groundwater extraction flowrates and enhance theremoval of dissolved contaminants. The WIDE system is ready for deployment and commercial application.

3
Contacts
Technical John D. Quaranta, Ph.D., P.E., Principal Investigator, Department of Civil Engineering, North Carolina StateUniversity, e-mail: [email protected], Telephone: (919) 513-2040,
Mohammed A. Gabr, Ph.D., P.E., Principal Investigator, Department of Civil Engineering, North CarolinaState University, e-mail:[email protected], Telephone: (919) 515-7904, Management Karl-Heinz Frohne, Project Manager, National Energy Technology Laboratory (NETL), e-mail:[email protected], Telephone: (304)-286-4412.
Robert C. Bedick, Product Manager, NETL, e-mail: [email protected], Telephone: (304)-285-4504
Mark A. Gilbertson, Program Director, OST (EM-52),e-mail:[email protected], Telephone: (202)586-7150. Other John Ganz, Environmental Manager, Ashtabula Environmental Management Project, U.S. DOE Ohio FieldOffice, e-mail: [email protected], Telephone (440) 993-2017
James M. Cramer, Vice President, Nilex Corporation, e-mail: [email protected], Telephone: (303) 766-2000 All published Innovative Technology Summary Reports are available on the OST Web site athttp://ost.em.doe.gov under “Publications.” The Technology Management System (TMS), also availablethrough the OST Web site, provides information about OST programs, technologies, and problems. TheOST/TMS ID for Well Injection Depth Extraction (WIDE) Soil Flushing is 2172.

4
SECTION 2 TECHNOLOGY DESCRIPTION
Overall Process Definition
WIDE was developed for in situ remediation of low-permeability and high clay-fraction subsurface soils andgroundwater. The goals of the demonstration project were to: • Design, construct, and operate a full-scale WIDE system in a low permeability, high clay-fraction,
glacial till soil.• Evaluate the capabilities of WIDE to remediate soil and groundwater contaminated with trichloroethylene
(TCE), uranium (U), and technetium (99Tc).• Investigate the WIDE system’s capabilities to reduce contaminant concentrations to desired levels
Major elements of the WIDE technology include:
• PVWs• Groundwater and soil gas vacuum extraction system• Liquid injection system• Above-ground treatment system
PVWs
The development of PVWs was based on the existing technology of prefabricated vertical drains (PVD), orknown more commonly as wick or strip drains. The prefabricated vertical drain is a geotechnical engineeringtechnology that has been routinely used since the mid-50's for soil (silt and clay) improvement anddewatering of mine tailings.
The PVW is manufactured as a compositesystem of an inner core, an outer permeablefilter jacket, and at specified positions, animpermeable barrier sleeve. This geosyntheticcomposite is illustrated in Figure 2. The PVWtypically measures 4 inches (100 mm) wideby 0.15 inches (4 mm) thick. The core isconstructed of extruded polypropylene andthe filter jacket is a durable, non-wovenpolypropylene geotextile. The impermeablesleeving is a reinforced high-densitypolyethylene, and is a unique distinction ofthe PVW. This design feature enables depthspecific extraction and injection capability.
The WIDE system utilizes PVWs as theconduit for vacuum extraction of thecontaminated liquids and gasses, concurrentwith pressurized injection of a flushingsolution. The PVWs shorten the groundwaterdrainage path, promoting subsurfaceliquid/gas movement and thus expediting thesoil flushing process (illustrated in Figure 3).
The WIDE system offers advantages over conventional well galleries and deep excavation cut-off trenches.The PVWs are designed for depth-specific extraction of contaminated plumes with or without concurrentliquid injection. The WIDE technology has been designed to target the areal and depth source points of aplume, thereby controlling and minimizing the volumes of liquids being extracted.
Figure 2. PVW cross-section.

5
The PVWs are installed using adevice patented by the NilexCorporation of Denver, Colorado,which is illustrated in Figure 4. TheNilex process uses a hollow steelmandrel which typically measuresapproximately 4.6 in wide by 1.17 indeep with lengths exceeding 98 ft.The PVWs are positioned within thehollow core of the mandrel. Then, thesteel mandrel is pushed into the soilunder hydraulic or vibratory forces atrates of greater than 10 ft/s in firmclay. Typically, a 23 ft deep PVWinstallation can be accomplished inapproximately 4 seconds.
Field construction typically entails agrid of PVWs in offset rows ofinjection/extraction lines at relativelyclose spacing (< 3 ft). The intervalspacing and offset between theinjection/extraction dedicated PVWsare based on engineering design and
modeling. The PVWs are connected to a surface network of piping that is used for distributing the airvacuum, receiving theextracted groundwater, andintroducing the injectionliquids.
Groundwater and Soil GasVacuum Extraction System
The primary components ofthis system are a vacuumcompressor and cycloneair/water separator. Thevacuum extraction systemsimultaneously removesgroundwater and soil gas,promoting volatilization ofcontaminants. The vacuumextraction system and thePVW field are pictured inFigure 5.
Liquid Injection System
The injection system uses aliquid storage tank and apositive displacement pumpto inject liquids into thesubsurface through thePVWs. At the AEMP project,water was used as theflushing agent, but otherflushing solutions, such as
Figure 3. WIDETM soil flushing system.
Figure 4. PVW mandrel installation system.

6
surfactant, or reagents may be injected.
Above-Ground treatment system
Treatment train design is contaminant-specific and site-specific. The WIDE technology demonstration at theAEMP utilized vapor-phase granular activated carbon (GAC) to remove TCE from the air phase. Liquid-phaseGAC was used to remove the non-volatilized trace concentrations of TCE from the groundwater. The on-siteWTP was employed to remove any remaining U and 99Tc from the liquid phase.
System Operation
The WIDE system may function under the following operational approaches:
Concurrent injection/extraction: This mode is for an aggressive soil flushing scheme. Injection of liquids tothe subsurface through the PVWs maintains saturated conditions and develops pressure gradients in theaquifer, promoting advective and diffusive transport of contaminants to the extraction PVWs.
Extraction Only: All of the PVWs operate under air vacuum, specifically to lower the groundwater table andpromote soil gas extraction. This technique has proven to be effective for removing volatile contaminants.
Injection Only: This technique addresses aquifer recharge and saturation of the vadose zone promotingcontaminant diffusion.
Operational Issues
Parameters affecting operation of the WIDE system deal mostly with developing adequate vacuum on thePVWs required for groundwater extraction. A major physical limitation to the WIDE technology is extractiondepth. The PVWs are limited to extracting groundwater from a maximum depth of 33 ft (assuming a liquidspecific gravity of 1, at 1 atmosphere). In practice, the actual depth for groundwater extraction isapproximately 31 to 32 ft, accounting for hydraulic head losses within the PVWs, vacuum compressor, andsurface piping system (Quaranta and Gabr, 2000).
Cold temperatures impact operation. Low ambient air temperatures (<30 degrees F.) cause icing of theextracted groundwater within the PVWs and surface piping. This problem may be addressed by a number ofengineering controls, such as insulation/heat tracing, or heated enclosures.
Figure 5. PVW field with extraction piping.

7
SECTION 3 PERFORMANCE
Demonstration Plan
The DOE's AEMP is located at RMI Titanium Plant, a former uranium metals processing facility whichsupplied extruded and milled uranium products for use within the DOE’s weapons complex. As a result oflong-term uranium manufacturing operations, the site's groundwater and soils were contaminated with TCE,U, and 99Tc.
A former evaporation pond at the site is credited as the source of the TCE and U contamination. The pondmeasured approximately 30 ft in length and 20 ft in width. The WIDE demonstration test area is positionedover the former pond. The TCE concentration gradients in the groundwater below the 70 ft by 70 ftdemonstration pad are illustrated in Figure 6. The demonstration pad was divided into four equal quadrants(measuring 35 ft by 35 ft), each of which was capable of operating independently. Maximum U and TCEconcentrations in the groundwater below that demonstration area were measured during the baselinesampling (December 1998) and showed concentrations as high as 13,000 ppb U and 632,000 ppb TCE.
The site soil is a low permeability glacial till, classified as Ashtabula Till, and is underlain by DevonianChagrin shale bedrock (Dames & Moore, 1985). The till is composed of approximately 82 percent clay/siltwith an average specific gravity of 2.73 (Eckenfelder, 1996). Shale fragments, pebbles, silt, and sand arefound in differing degrees within the clay matrix (Dames & Moore, 1985). The piezometric surface is 2 to 3feet below the ground surface, depending upon seasonal changes. Groundwater moves in three zones: thetill zone, the till/bedrock zone, and the bedrock zone (Eckenfelder, 1996).
0.00 1 0 . 0 0 2 0 . 0 0 3 0 . 0 0 4 0 . 0 0 5 0 . 0 0 6 0 . 0 00.00
1 0 . 0 0
2 0 . 0 0
3 0 . 0 0
4 0 . 0 0
5 0 . 0 0
6 0 . 0 0
7 0 . 0 0
508
504
500501
505
507
506
503
Quadrant 2 Quadrant 1
Quadrant 3 Quadrant 4
Figure 6. TCE concentrations (ppb) in groundwater.

8
A subsurface investigation was performed to determine the characteristics of the soil matrix. Keycharacteristics are provided in Table 1.
Table 1: Subsurface and soil characteristicsParameter ValueSoil Classification CLClay Content 42 to 78 %Moisture Content 20 %Hydraulic Conductivity 10-6 cm/sCation Exchange Capacity 30 - 60 meq/100gTotal Organic Carbon Content 5 %Depth to groundwater 2-3 ft
Demonstration Objectives and Approach
The objectives of the technology demonstration were to design, construct, operate, and monitor theperformance of the WIDE system. The performance of the WIDE system was evaluated under the followingmodes of operation:
1) Extraction only: Under the extraction only mode, a 42 kPa vacuum was applied to all 15- ft deep PVWsin a single quadrant. For the demonstration, the system was typically operated for 6 hours per day andshutdown overnight. The operation schedule during the demonstration was constrained by the siteoperations schedule and environmental discharge permit restrictions. A full-scale system would beexpected to operate 24 hours a day and 7 days a week.
2) Injection only: Under the injection only operation, water was injected through selected PVWs in aspecific quadrant to raise the groundwater table and saturate the previously unsaturated (vadose) zone.This was performed to assess the groundwater recharge capacity and to observe the TCE diffusionresponse.
3) Injection/Extraction: Under injection/extraction operation, selected PVWs within a quadrant operated ineither a concurrent injection/extraction mode, or in an extraction mode with pulsed injection. The totalvolume of liquid injected and extracted was balanced under this operational scheme.
During demonstration, groundwater and air extraction rates were measured. Groundwater elevations andcontaminant concentrations where monitored at the groundwater monitoring wells. Contaminant removalrates where calculated based on TCE and U concentrations of grab samples collected from extracted soilgas and groundwater.
Results
The results presented in this report are based on operation of the WIDE system from January throughAugust of 1999. The demonstration was scheduled to continue through December of 1999. During the firsteight-month operating period, the WIDE system was brought on-line, and tested under the modes ofoperation noted above.
The performance data presented in the following section was generated from operation of Quadrant 4. Thisparticular quadrant exhibited the lowest range of TCE and U concentrations and was therefore operated thelongest to assess the performance of the WIDE system at relatively low contaminant concentrations. Thegroundwater extraction rates, air flowrates, and contaminant removal rates presented below are based onthe performance of the system in Quadrant 4, which measures 35 ft by 35 ft. The results of groundwatermonitoring for all four quadrants are presented later in this section.

9
Extraction Only Operation
Observations of system performance indicated the following:
• The groundwater extraction flowrate ranged from 25 gal/hr to 150 gal/hr. Typically, the flowrate woulddecrease over a six hour operation period as the groundwater level was lowered.
• As the groundwater extraction flowrate decreased, the air flow rate increased from an initial rate of 120cfm to 350 cfm over the 6 hr operation.
• The local groundwater elevation was lowered during the 6 hr operation period with subsequent recoveryoccurring over night while the system was shut down.
• At a flowrate of 125 gal/hr, the WIDE system was able to exchange one pore volume of groundwater in258 hours of non-continuous operation (6 hours per day for 43 days).
Under the extraction only mode, TCE was removed first with the extracted groundwater in the soluble phase,then as the groundwater elevation was lowered, TCE was volatilized from the soil surface, and was removedin the gas phase. TCE recovery from Quadrant 4 produced removal rates as high as 6,975 mg/hr of TCE(gas and liquid phase). Over a 50 hour operation period, a total of 140,000 mg of TCE was extracted from thequadrant (2,800 mg/hr). A graph presenting cumulative TCE removal versus cumulative operation time forextraction only operation is presented as Figure B-1 in Appendix B.
Remediation of the uranium constituent occurred as a result of groundwater extraction. Uranium recoveryincreased with increasing groundwater extraction rates. Uranium removal rates as high as 600 mg/hr wereobserved.
Injection Only Operation
Injection only testing indicated that a total of 4,000 gallons could be injected into the ground during a 6 hourperiod. Injection rates between 300 to 500 gal/hr were readily sustainable and rates as high as 1,100 gal/hrwere achieved.
Injection/Extraction Operation
Under injection/extraction operation, groundwater extraction rates were greater than observed during theextraction only scenario. Groundwater injection and extraction rates were balanced at approximately 120gal/hr from Quadrant 4. A total of 6,000 gallons of groundwater was extracted from the quadrant, over acumulative operation time of 50 hours.
Over 50 hours of operation, approximately 65,450 mg of TCE was recovered from the subsurface. ObservedTCE removal rates ranged from 1,200 to 1,800 mg/hr. Most of the TCE removed was volatilized by theextraction process. A total of 64,000 mg of TCE was measured in the gas phase, and 1,450 g wasmeasured in the dissolved liquid phase. Typically, greater than 95 percent of the TCE was volatilized by thevacuum process. A graph presenting cumulative TCE removal, versus cumulative operation time forinjection/extraction operation is presented as Figure B-2 in Appendix B. The uranium recovery rates for thesame quadrant were approximately 640 mg/hr.
The results of the testing in Quadrant 4 are summarized in Table 2.
For remediation of the TCE plume, the extraction only mode achieved the best results. TCE removaldecreased when shifting from extraction only operation to concurrent injection/extraction mode. A maximumremoval rate of 6,935 mg/hr was achieved under the extraction only mode, while only 1,800 mg/hr wasobserved under the injection/extraction mode. Based on these findings, the primary removal mechanism forthe TCE contamination was determined to be soil gas extraction.

10
Table 2. Summary of Demonstration Results, Quadrant 4
Parameter Extraction OnlyOperation
Injection/ExtractionOperation
Groundwater extraction flow-rate range (gal/hr) 25-120 100-1,100
Operation period for exchange of 1 pore volume ofgroundwater exchange (cumulative hours)
258 96
TCE recovery rate range (mg/hr) 787 - 6,935 1,200 - 1800
Uranium recovery rate range (mg/hr) 386 - 428 642
For remediation of the uranium contamination in the groundwater, concurrent injection/extraction was thepreferred mode of operation. The uranium removal rate increased from 420 mg/hr under extraction only to640 mg/hr under concurrent injection/extraction, a 33 percent increase in uranium removal. The increased Uremoval was attributed to the greater volume of groundwater extracted under the injection/extraction modeand advective transport of the U towards the extraction PWVs. Therefore, the primary removal mechanismfor the U removal was groundwater flushing.
Results of Groundwater Monitoring
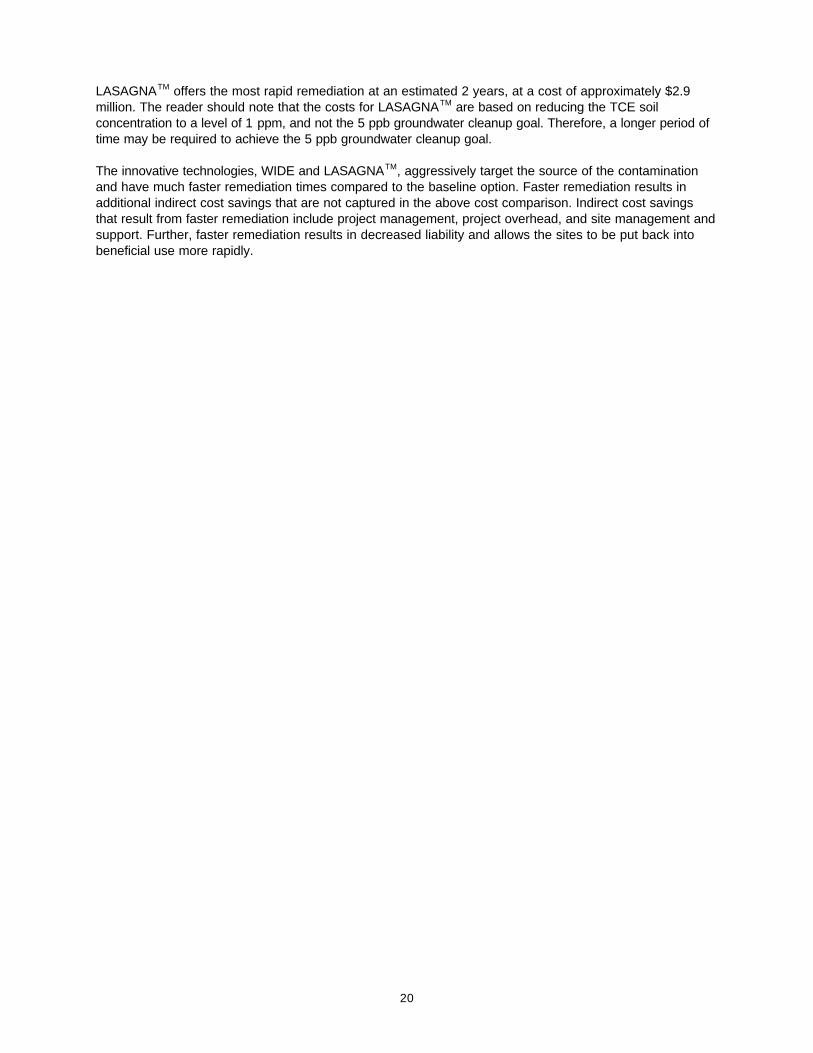
The TCE concentrations in the groundwater were monitored over the course of the demonstration throughseveral monitoring wells installed throughout the demonstration area. The groundwater well locations areillustrated in Figure 4. The results of groundwater monitoring for the first eight month operating period for allfour quadrants are summarized in Table 3.
Table 3. Groundwater monitoring resultsQuadrant # Groundwater
MonitoringWell #
Vacuum SystemOperating Time
(hours)
TCE Contaminant Reduction
Range - Groundwater
TCE PercentReduction
1 506 54 Initial: 105,000 pp
Final: 45,000 ppb
57%
2 507 89 Initial: 70,000 ppb
Final: 38,000 ppb
46%
3 503 31 Initial: 400,000 ppb
Final: 160,000 ppb
60%
4 502 380 Initial: 2,800 ppb
Final: 1,200 ppb
57%
ppb=µg/l Significant reductions in the TCE groundwater concentrations were observed in all quadrants. The resultsfrom Quadrant 4 are significant because Quadrant 4 has a relatively low initial TCE concentration. Lowerconcentrations are typically more difficult to remediate. The WIDE technology was able to reduce the TCEconcentration in Quadrant 4 by 57 percent, but notably these reductions took longer to achieve.
Figure 7 presents the results of the groundwater monitoring for Quadrant 3. Figure 7 is presented to illustratethe fluctuations in TCE concentration resulting from operation of the WIDE system. The figure contains aplot of the TCE concentration measured from well 503 within the quadrant and a plot of the TCEconcentration measured in monitoring well 501 located outside of the quadrant. The x-axis represents themonitoring period in days. A note is provided on the graph indicating the cumulative hours of operation inthat quadrant during the monitoring period (31 hrs). Graphs of the groundwater monitoring results for theQuadrants 1, 2, and 4 are included in Appendix B.

11
The TCE concentration in monitoring well 503 prior to operation of the WIDE system was 400,000 ppb(µg/L). After 31 hours of operation (over a 261 day period) the groundwater contaminant level was reduced to160,000 ppb, a net reduction of 60%. As evident in Figure 6, the TCE concentration in the groundwaterwould rebound after decreasing. This effect was observed in all four quadrants and is attributed to thecontinued desorption of TCE from the clay soil and is a result of the soil’s relatively high cation exchangecapacity (CEC). Increases in TCE concentration may also be attributed to mobilization of TCE from thevadose zone due to the injection of liquid.
Conclusions
Demonstration of the WIDE system in the glacial till soil showed that this innovative system did removesubsurface TCE and U contamination by extracting groundwater and soil gas from the low-permeability, highclay fraction soil. The WIDE technology has demonstrated its effectiveness and success in reducing thesource of the contamination by achieving large contaminant concentration reductions within relatively shortoperational times. The WIDE system also proved capable of injecting liquids into the subsurface to enhancethe soil flushing process.
Other notable findings are:
• Groundwater extraction rates were higher under concurrent and pulsed injection/extraction operatingmodes.
• TCE removal rates were highest under the extraction only mode where gas extraction enhanced theremoval of TCE contamination from the moist soil particle surface.
• Groundwater extraction was the optimum removal mechanism for U contamination• TCE concentrations in the groundwater would rebound after decreasing, suggesting that TCE was
continually desorbing from the soil.
Quadrant IIITCE Well Data
0 50 100 150 200 250 3000
50000
100000
150000
200000
250000
300000
350000
400000
450000
500000Well 501
Well 503
System Operation Time, days
TCE
Con
cent
ratio
n, p
pb
Quadrant III RunTime = 31.2 hours
501
III
III IV503
Figure 7. Quadrant 3 monitoring well results.

12
SECTION 4 TECHNOLOGY APPLICABILITY AND ALTERNATIVES
Competing Technologies
The baseline method for remediation of TCE contaminated groundwater is pump and treat remediation.Competing innovative technologies addressed in this section include LasagnaTM and In Situ ChemicalOxidation With Deep Soil Mixing.
Pump and Treat
Pump and treat refers to pumping contaminated groundwater from an aquifer followed by above-groundtreatment of the groundwater. Conventional pump and treat remediation utilizes groundwater wells orinterceptor trenches to access the groundwater. This is the baseline method for controlling groundwater andremoving dissolved-phase contaminants. Various surface treatment trains can be utilized to treat thegroundwater depending on the contaminants present. For groundwater contaminated with TCE, air strippingand granular activated carbon are typically used. Uranium can be removed by adsorption methods (e.g. ionexchange) or precipitation methods.
Lasagna™
Lasagna™ is an integrated, in situ technology which remediates soils and soil pore water contaminated withsoluble organic compounds. Lasagna™ is especially suited to sites with low permeability soils whereelectroosmosis can move water faster and more uniformly than conventional hydraulic methods. TheLasagna™ process combines electrokinetics with treatment zones that are installed directly in thecontaminated soils to form an integrated in situ remedial process. The process uses electrokinetics totransport contaminants in soil pore water into treatment zones where they can be captured or decomposed.Lasagna™ is designed to treat soil and groundwater contaminants completely in situ, without the use ofinjection or extraction wells. It has proven to be effective for the in-situ remediation of fine-grained soilscontaminated with organics, inorganics, and mixed wastes.
In Situ Chemical Oxidation with Deep Soil Mixing
In situ chemical oxidation delivers oxidants to the subsurface to rapidly degrade organic contaminants.Deep soil mixing is an in situ remediation technology that utilizes large diameter augers to inject andaggressively mix reactants with subsurface soil.
In situ chemical oxidation can be applied to the subsurface with relatively stable oxidants such aspotassium permanganate (KMnO4). Chemical oxidation using KMnO4 has been widely used for treatment ofpollutants in drinking water and wastewater applications for over 50 years. In situ chemical oxidation hasmore recently been used to remediate hazardous waste sites with soils and groundwater contaminated withorganics. Delivery processes that have been demonstrated include: deep soil mixing, hydraulic fracturing,multi-point vertical lancing, horizontal well recirculation, and vertical well recirculation.
Deep soil mixing is attractive for contaminated sites that contain low permeability soils. Contaminants areeither removed from the soils or stabilized in place. The mixing process allows good access for reagentdelivery to all soil particles and the interstices between particles. However, this technology requires surfaceaccess at all locations where soils are contaminated.
A comparison of the baseline technology (pump and treat), WIDE, LASAGNATM, and in situ chemicaloxidation with deep soil mixing is provided in Table 4.

13
Table 4. Comparison of technologies
Technology Advantages Disadvantages
Pump and Treat - Established technology which isaccepted by regulators
- Slow (remediation times oftenprojected for 20-30 years)- Dependent on hydraulic conductivity ofsoil- Process often limited by slowcontaminant diffusion rates
WIDE - Applicable to low permeability soils- Installation is relatively simple andinexpensive with no drilling required- Expedites contaminant recoveryand reduce long-term operatingcosts- Targets the source points of aplume, thereby controlling andminimizing the volumes of liquidsbeing extracted
- Direct push installation of PVWs isdependent on subsurface geology and isnot applicable to sites where subsurfacerock, boulders, or cemented layers exist(pre-drilling is required at these sites)- limited to depths less than 33 ft- experiences freezing problems atambient temperatures below 30 - 35EF
Lasagna™ - Applicable to low permeability soils- Reduces time required forremediation compared to baseline- Use of treatment zones eliminatesthe need for above ground wastehandling- Treatment zones are more costeffective than other electrokineticmethods
- Process is energy (electric) intensive- Process is complex
In-situ chemical oxidationwith deep soil mixing
- Applicable to low permeability soils- Reduces time required forremediation compared to baseline- The reagent (KMnO4) is readilyavailable, inexpensive, and results ingeneration of innocuous materialssuch as carbon dioxide, manganesedioxide solids, potassium andchloride (when treating chlorinatedcompounds) -No secondary waste steamproduced
- Not as effective at sites containingsaturated organic compounds (e.g.,TCA) or media with a high naturaloxidant demand- Oxidation chemicals can causeformation of particulate MNO2 in soilpores, thus reducing soil permeability- Deep soil mixing requires surfaceaccess at all locations where soils arecontaminated- Technology is limited to oxidizablecontaminants
Technology Applicability
The WIDE technology is applicable for the in situ remediation of contaminated fine-grain fraction soils(clay/silts) with hydraulic conductivities ranging from 10-3 to 10-8 cm/s. Its soil flushing capabilities aresuitable for removal of dissolved-phase contaminants, DNAPLs, and LNAPLs. The technology hasdemonstrated the capability of segregating the hazardous and radioactive constituents of a subsurfacemixed waste (e.g. separation of TCE from U and 99Tc). The WIDE system is also effective for vaporextraction of volatile contaminants from the vadose zone.
The PVW is the heart of the WIDE technology and has potential application in a number of environmentalremediation schemes. Potential applications include:

14
• injection of nutrients for bio-remediation• injection/extraction of chemical reagents for in situ treatment (.e.g. oxidation agents)• injection of surfactant to mobilize contaminants• injection of air (i.e. air sparging)
Patents/Commercialization/Sponsor
Patents
Patent disclosures and applications are in process with the US Patent and Trademark Office. A DisclosureDocument (No. 422400) has been filed for “Prefabricated Well Injection Depth Extraction (WIDE) System forEnhanced Soil Flushing” under 37 CFR Section 1.21(c) , 1997.
Commercialization
The project has industry commercialization support from the Nilex Corporation. The Nilex Corporation is themanufacturer of the PVWs and has worked with NCSU throughout development of the WIDE system.
Sponsors Research and development on the WIDE system was sponsored by the US DOE’s NETL, through acooperative agreement with West Virginia University (WVU) and subcontracts to NCSU, RMI EnvironmentalServices (RMIES), and The Nilex Corporation. This project has involved ongoing laboratory research andfield-scale development under the direction of principal investigators Dr. J. Quaranta and Dr. M. Gabr ofNCSU’s Civil Engineering Department and formerly of WVU. The DOE's AEMP was the host for thetechnology demonstration. RMIES of Ashtabula, OH, the site owner and prime contractor was contracted forsite support services, including construction, O&M, analytical sampling, QA/QC oversight, engineeringsupport, regulatory interface, and cost documentation.
15
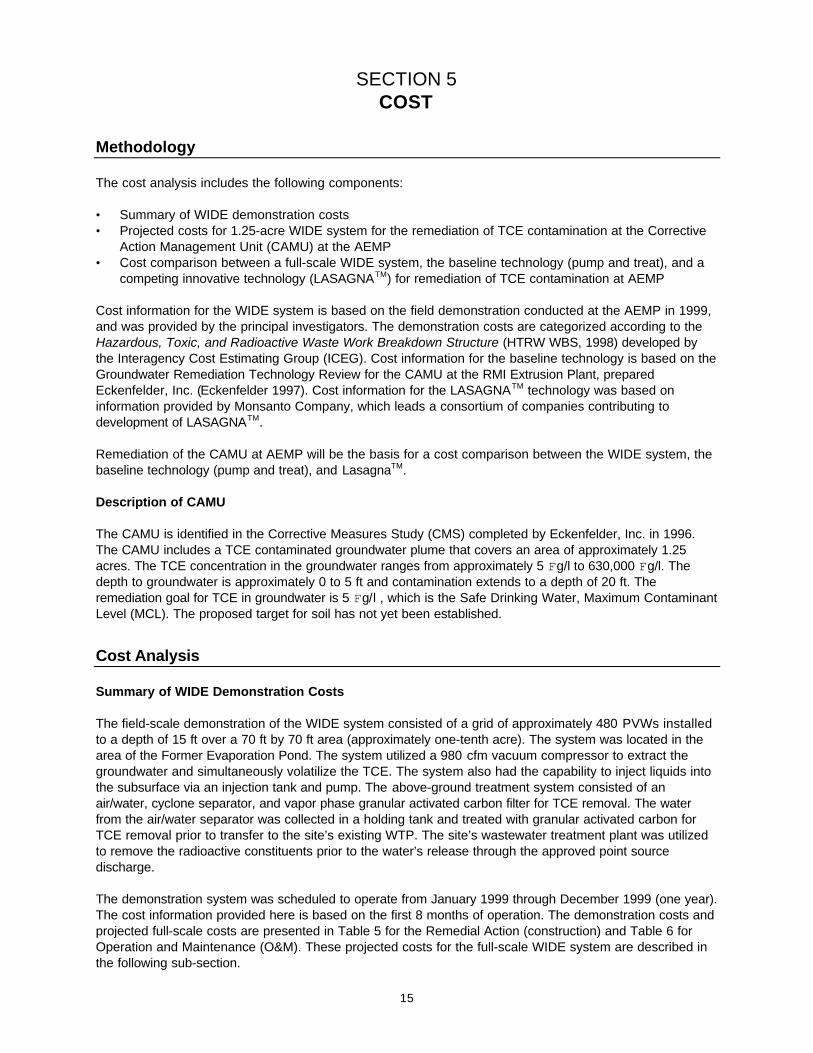
SECTION 5 COST
Methodology
The cost analysis includes the following components:
• Summary of WIDE demonstration costs• Projected costs for 1.25-acre WIDE system for the remediation of TCE contamination at the Corrective
Action Management Unit (CAMU) at the AEMP• Cost comparison between a full-scale WIDE system, the baseline technology (pump and treat), and a
competing innovative technology (LASAGNATM) for remediation of TCE contamination at AEMP
Cost information for the WIDE system is based on the field demonstration conducted at the AEMP in 1999,and was provided by the principal investigators. The demonstration costs are categorized according to theHazardous, Toxic, and Radioactive Waste Work Breakdown Structure (HTRW WBS, 1998) developed bythe Interagency Cost Estimating Group (ICEG). Cost information for the baseline technology is based on theGroundwater Remediation Technology Review for the CAMU at the RMI Extrusion Plant, preparedEckenfelder, Inc. (Eckenfelder 1997). Cost information for the LASAGNATM technology was based oninformation provided by Monsanto Company, which leads a consortium of companies contributing todevelopment of LASAGNATM.
Remediation of the CAMU at AEMP will be the basis for a cost comparison between the WIDE system, thebaseline technology (pump and treat), and LasagnaTM.
Description of CAMU
The CAMU is identified in the Corrective Measures Study (CMS) completed by Eckenfelder, Inc. in 1996.The CAMU includes a TCE contaminated groundwater plume that covers an area of approximately 1.25acres. The TCE concentration in the groundwater ranges from approximately 5 Fg/l to 630,000 Fg/l. Thedepth to groundwater is approximately 0 to 5 ft and contamination extends to a depth of 20 ft. Theremediation goal for TCE in groundwater is 5 Fg/l , which is the Safe Drinking Water, Maximum ContaminantLevel (MCL). The proposed target for soil has not yet been established.
Cost Analysis
Summary of WIDE Demonstration Costs
The field-scale demonstration of the WIDE system consisted of a grid of approximately 480 PVWs installedto a depth of 15 ft over a 70 ft by 70 ft area (approximately one-tenth acre). The system was located in thearea of the Former Evaporation Pond. The system utilized a 980 cfm vacuum compressor to extract thegroundwater and simultaneously volatilize the TCE. The system also had the capability to inject liquids intothe subsurface via an injection tank and pump. The above-ground treatment system consisted of anair/water, cyclone separator, and vapor phase granular activated carbon filter for TCE removal. The waterfrom the air/water separator was collected in a holding tank and treated with granular activated carbon forTCE removal prior to transfer to the site’s existing WTP. The site’s wastewater treatment plant was utilizedto remove the radioactive constituents prior to the water’s release through the approved point sourcedischarge.
The demonstration system was scheduled to operate from January 1999 through December 1999 (one year).The cost information provided here is based on the first 8 months of operation. The demonstration costs andprojected full-scale costs are presented in Table 5 for the Remedial Action (construction) and Table 6 forOperation and Maintenance (O&M). These projected costs for the full-scale WIDE system are described inthe following sub-section.

16
The total core cost to construct the WIDE demonstration system was approximately $386,458. O&M corecosts for the one year demonstration were projected to be $199,798 based on extension of the costs for thefirst six months of operation. For the purposes of cost comparison with other technologies, only core costsare included in this report. Non-core costs such as project management, permitting support, qualityassurance, cost accounting, technical reporting, and health and safety are not included.
Estimated Full-Scale WIDE Remediation Costs
The proposed full-scale WIDE system for remediation of the CAMU’s 1.25 acre TCE plume will be similar indesign to the demonstration-scale system. The costs for the full-scale WIDE system presented in Tables 5and 6 are conceptual in nature and are based on input from the technology developer and extension of thedemonstration costs. A detailed engineering design and cost estimate for the full-scale system has notbeen completed. The full-scale cost projections are based on the assumption that an economy of scale willbe gained in certain areas for the larger application. The following additional assumptions will apply to thefull-scale system:
• 6,000 PVWs will be utilized• PVWs will be installed at 3 ft spacing and at an average depth of 20 ft• The PVW field will be divided into 20 zones• Each zone will be comprised of 300 PVWs• Four vacuum extraction units will be utilized• Treatment equipment will include air/water separation, and vapor-phase granular activated carbon• Effluent will be piped to site WTP for treatment prior to discharge
Table 5. Remedial action (construction) costs: demonstration and full-scale
WBSNumber
Description DemoCost ($)
Full-ScaleCost ($)
331 REMEDIAL ACTION
331 01 MOBILIZATION AND PREPARATORY WORK
Mobilization of PVW installation subcontractor $10,000 $10,000
331 02 MONITORING AND SAMPLING
Pre-construction sampling and analysis $35,000 $35,000
Soil borings, monitoring well installation, sediment sampling $13,400 $25,000
331 03 SITE WORK
Grading and crushed stone pad $4,558 NA
331 06 GROUNDWATER COLLECTION AND CONTROL
Vacuum extraction units $129,187 $516,748
Piping materials (pvc, gauges, sampling ports, fittings) $15,107 $181,824
PVW installation subcontract (materials, labor, equipment) $60,000 $170,000
331 13 PHYSICAL TREATMENT
Piping, trenching, electrical, instrumentation (labor andmaterials)
$36,414 $218,484
Groundwater treatment (materials and labor) $30,724 $61,488
331 22 GENERAL REQUIREMENTS
Engineering (design and construction oversight) $52,068 $109,070

17
Total $386,458 $1,327,614
Based on the assumptions above, the total estimated core cost to construct a full-scale WIDE system forthe remediation of the 1.25 acre TCE plume is $1,327,614.
Full-Scale O&M Costs
O&M costs for the full-scale system were also projected based on the demonstration costs. Full-scaleoperation procedures would be similar to those employed during the demonstration. A primary difference willbe in regard to sampling frequency. Extensive performance sampling was required during the demonstrationphase for modeling purposes due to the R&D nature of the project. Performance sampling frequencies forthe full scale system will be significantly less.
The following assumptions will apply to the O&M costs for the full-scale system:
• System will operate 24 hours per day, 7 days per week, and 10 months per year• Four vacuum extraction units will service five zones each (operating one zone at a time in a rotational
scheme)• The system will operate in an “extraction only” mode for TCE removal• One full-time operating technician will be utilized• Non-core costs such as project management, health and safety, permitting and QA/QC are excluded
Table 6. Annual operation and maintenance costs for WIDE system
WBSNumber
Description DemoCost
Full-ScaleCost
342 OPERATION AND MAINTENANCE
342 02 SAMPLING AND MONITORING
Sampling and analysis $90,000 $25,000
342 06 GROUNDWATER COLLECTION AND CONTROL
O&M of PVW and vacuum extraction units $63,493 $114,968
Equipment maintenance (compressor oil) $4,000 -
342 13 PHYSICAL TREATMENT
O&M of groundwater treatment $22,855 $40,000
342 22 GENERAL REQUIREMENTS
Engineering oversight $19,450 $25,000
O&M Total $199,798 $204,968
Cost Comparison
Remediation of the CAMU at AEMP is the basis for a cost comparison between the WIDE system, thebaseline technology (pump and treat), and LasagnaTM.
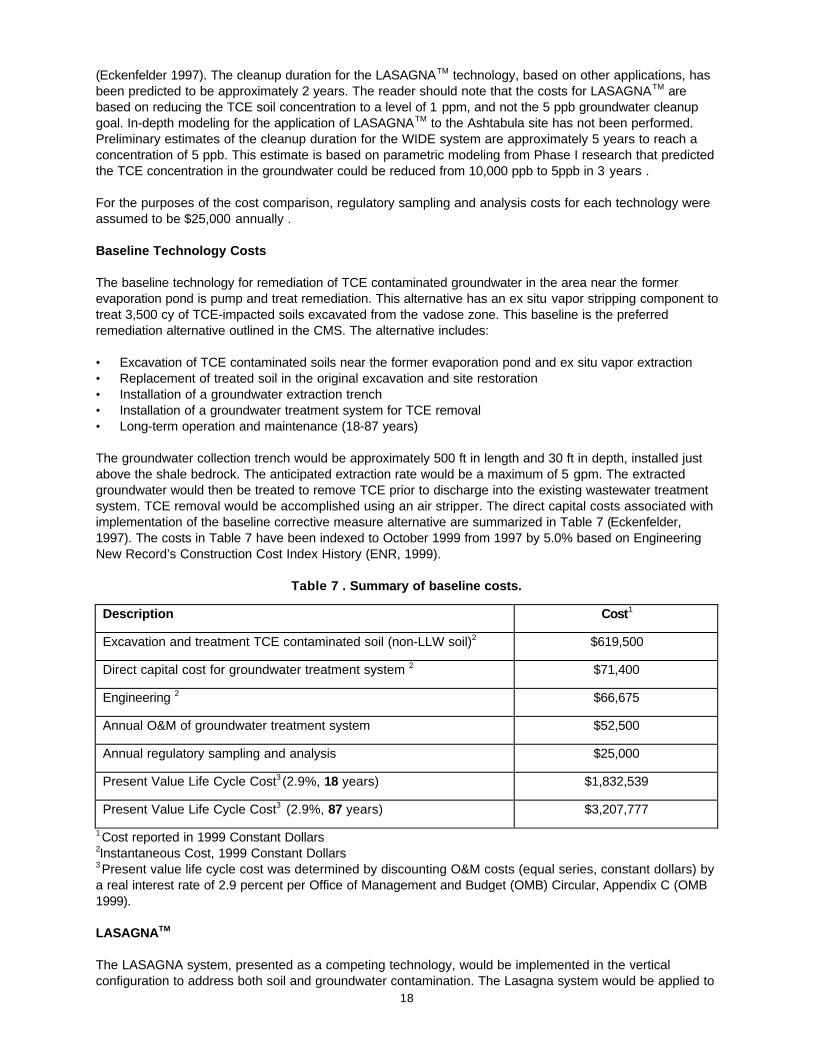
Each technology will be operated and maintained for a period of time after construction. The cleanupduration is dependent on the performance of the technology with respect to achieving prescribed clean-upgoals. The cleanup duration greatly affects the life cycle cost. Accurate prediction of cleanup duration isdifficult and many environmental cleanups take longer than predicted. In the Groundwater RemediationTechnology Review, the baseline technology has an estimated cleanup duration of 18-87 years, with afootnote that the remediation time frame could increase significantly if remediation is diffusion limited
18
(Eckenfelder 1997). The cleanup duration for the LASAGNATM technology, based on other applications, hasbeen predicted to be approximately 2 years. The reader should note that the costs for LASAGNATM arebased on reducing the TCE soil concentration to a level of 1 ppm, and not the 5 ppb groundwater cleanupgoal. In-depth modeling for the application of LASAGNATM to the Ashtabula site has not been performed.Preliminary estimates of the cleanup duration for the WIDE system are approximately 5 years to reach aconcentration of 5 ppb. This estimate is based on parametric modeling from Phase I research that predictedthe TCE concentration in the groundwater could be reduced from 10,000 ppb to 5ppb in 3 years .
For the purposes of the cost comparison, regulatory sampling and analysis costs for each technology wereassumed to be $25,000 annually .
Baseline Technology Costs
The baseline technology for remediation of TCE contaminated groundwater in the area near the formerevaporation pond is pump and treat remediation. This alternative has an ex situ vapor stripping component totreat 3,500 cy of TCE-impacted soils excavated from the vadose zone. This baseline is the preferredremediation alternative outlined in the CMS. The alternative includes:
• Excavation of TCE contaminated soils near the former evaporation pond and ex situ vapor extraction• Replacement of treated soil in the original excavation and site restoration• Installation of a groundwater extraction trench• Installation of a groundwater treatment system for TCE removal• Long-term operation and maintenance (18-87 years)
The groundwater collection trench would be approximately 500 ft in length and 30 ft in depth, installed justabove the shale bedrock. The anticipated extraction rate would be a maximum of 5 gpm. The extractedgroundwater would then be treated to remove TCE prior to discharge into the existing wastewater treatmentsystem. TCE removal would be accomplished using an air stripper. The direct capital costs associated withimplementation of the baseline corrective measure alternative are summarized in Table 7 (Eckenfelder,1997). The costs in Table 7 have been indexed to October 1999 from 1997 by 5.0% based on EngineeringNew Record’s Construction Cost Index History (ENR, 1999).
Table 7 . Summary of baseline costs.
Description Cost1
Excavation and treatment TCE contaminated soil (non-LLW soil)2 $619,500
Direct capital cost for groundwater treatment system 2 $71,400
Engineering 2 $66,675
Annual O&M of groundwater treatment system $52,500
Annual regulatory sampling and analysis $25,000
Present Value Life Cycle Cost3 (2.9%, 18 years) $1,832,539
Present Value Life Cycle Cost3 (2.9%, 87 years) $3,207,777
1 Cost reported in 1999 Constant Dollars2Instantaneous Cost, 1999 Constant Dollars3 Present value life cycle cost was determined by discounting O&M costs (equal series, constant dollars) bya real interest rate of 2.9 percent per Office of Management and Budget (OMB) Circular, Appendix C (OMB1999).
LASAGNATM
The LASAGNA system, presented as a competing technology, would be implemented in the verticalconfiguration to address both soil and groundwater contamination. The Lasagna system would be applied to
19
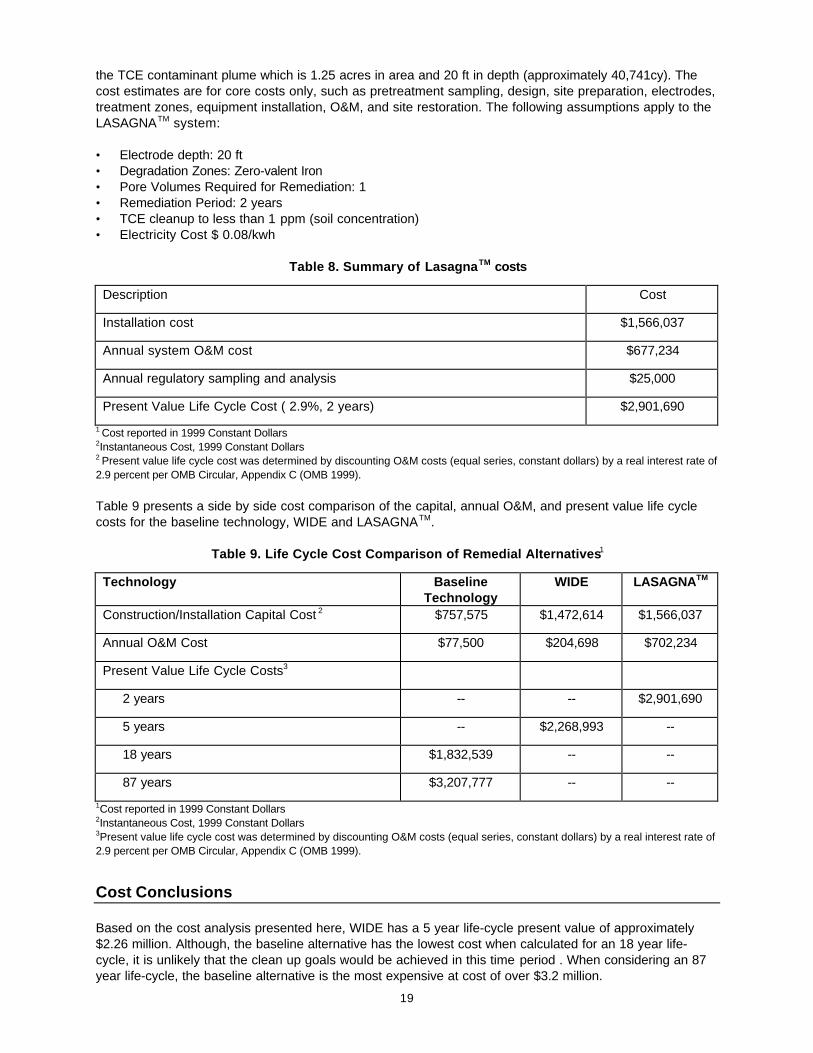
the TCE contaminant plume which is 1.25 acres in area and 20 ft in depth (approximately 40,741cy). Thecost estimates are for core costs only, such as pretreatment sampling, design, site preparation, electrodes,treatment zones, equipment installation, O&M, and site restoration. The following assumptions apply to theLASAGNATM system:
• Electrode depth: 20 ft• Degradation Zones: Zero-valent Iron• Pore Volumes Required for Remediation: 1• Remediation Period: 2 years• TCE cleanup to less than 1 ppm (soil concentration)• Electricity Cost $ 0.08/kwh
Table 8. Summary of LasagnaTM costs
Description Cost
Installation cost $1,566,037
Annual system O&M cost $677,234
Annual regulatory sampling and analysis $25,000
Present Value Life Cycle Cost ( 2.9%, 2 years) $2,901,690
1 Cost reported in 1999 Constant Dollars2Instantaneous Cost, 1999 Constant Dollars2 Present value life cycle cost was determined by discounting O&M costs (equal series, constant dollars) by a real interest rate of2.9 percent per OMB Circular, Appendix C (OMB 1999).
Table 9 presents a side by side cost comparison of the capital, annual O&M, and present value life cyclecosts for the baseline technology, WIDE and LASAGNATM.
Table 9. Life Cycle Cost Comparison of Remedial Alternatives1
Technology BaselineTechnology
WIDE LASAGNATM
Construction/Installation Capital Cost 2 $757,575 $1,472,614 $1,566,037
Annual O&M Cost $77,500 $204,698 $702,234
Present Value Life Cycle Costs3
2 years -- -- $2,901,690
5 years -- $2,268,993 --
18 years $1,832,539 -- --
87 years $3,207,777 -- --
1Cost reported in 1999 Constant Dollars2Instantaneous Cost, 1999 Constant Dollars3Present value life cycle cost was determined by discounting O&M costs (equal series, constant dollars) by a real interest rate of2.9 percent per OMB Circular, Appendix C (OMB 1999).
Cost Conclusions
Based on the cost analysis presented here, WIDE has a 5 year life-cycle present value of approximately$2.26 million. Although, the baseline alternative has the lowest cost when calculated for an 18 year life-cycle, it is unlikely that the clean up goals would be achieved in this time period . When considering an 87year life-cycle, the baseline alternative is the most expensive at cost of over $3.2 million.
20
LASAGNATM offers the most rapid remediation at an estimated 2 years, at a cost of approximately $2.9million. The reader should note that the costs for LASAGNATM are based on reducing the TCE soilconcentration to a level of 1 ppm, and not the 5 ppb groundwater cleanup goal. Therefore, a longer period oftime may be required to achieve the 5 ppb groundwater cleanup goal.
The innovative technologies, WIDE and LASAGNATM, aggressively target the source of the contaminationand have much faster remediation times compared to the baseline option. Faster remediation results inadditional indirect cost savings that are not captured in the above cost comparison. Indirect cost savingsthat result from faster remediation include project management, project overhead, and site management andsupport. Further, faster remediation results in decreased liability and allows the sites to be put back intobeneficial use more rapidly.

21
SECTION 6 REGULATORY AND POLICY ISSUES
Regulatory Considerations
Communication with regulators should be established early in the development process for new remediationtechnologies. Permits depend on the specific application and state/federal requirements. Early andcontinuous discussions with the regulators encourages more rapid permitting.
• At federal facilities a National Environmental Policy Act (NEPA) review is required.
• Comprehensive Environmental Recovery, Compensation, and Liability Act (CERCLA) or ResourceConservation and Recovery Act (RCRA) corrective action permitting may be required.
• A National Pollution Discharge Elimination System (NPDES) permit for the installation of thegroundwater treatment system will be required if extracted groundwater is treated and discharged tosurface water.
• An air permit may be required to govern emissions from the groundwater treatment system.
• An Underground Injection Permit may be required if flushing agents, surfactant, or other chemicals areintroduced into the groundwater.
Safety, Risks, Benefits, and Community Reaction
Worker Safety
Potential worker safety risks include those associated with standard construction operations as well asthose associated with work at a contaminated site and with potentially hazardous chemicals as regulatedby the Occupational Safety and Health Administration (OSHA)
Community Safety
• No unusual or significant safety concerns are associated with the transport of equipment, samples,waste, or other materials associated with WIDE.
• The WIDE technology has the potential to decrease the clean-up duration, thus reducing long-term risksto the nearby community.
Environmental Impact
• WIDE targets the areal and depth source of a plume, thereby minimizing the volumes of extractedliquids and minimizing remediation time, thereby freeing land for beneficial reuse.
Socioeconomic Impacts and Community Perception
• The general public has limited familiarity with the WIDE technology; however, the concept can be easilyexplained to the public.
• The technology should receive positive public support as it is an improvement over the baseline• WIDE has a minimal impact on the economy and labor

22
SECTION 7 LESSONS LEARNED
Implementation Considerations
Prior to implementation of the WIDE system at a particular site, the mode of operation (i.e. extraction onlyor concurrent injection/extraction) should be determined. The mode of operation is established based on thecontaminants being targeted and the subsurface conditions. Extraction only operation was demonstrated tobe more effective for targeting volatile contaminants and the injection/extraction mode was more effective fornon-volatile, dissolved contaminants.
Design of the vacuum system and surface treatment system is based on the mode of operation, subsurfaceconditions, and contaminants present. The WIDE system is primarily made up of off-the-shelf components,allowing rapid construction and deployment.
The WIDE technology was effective in dewatering a saturated subsurface under extraction only operation, aswell as saturating the vadose zone under and injection only mode. The system may be readily deployed invarious soil types, (sands, silts, and clays), as well as in the vadose or saturated zone. Adjusting the PVWgeotextile apparent opening size (AOS) will permit extraction of various low viscosity, free-product liquids,i.e., oils, sludges, fuel products (Gabr et. al. 1999).. The WIDE system may be installed on sloped surfaces,within existing facilities, or directionally to extend under buildings.
Technology Limitations
The primary limitation of the WIDE technology is related to depth of contamination. Though PVWs can beinstalled to depths of greater than 90 ft, vacuum extraction of liquids is limited in practice to depths ofapproximately 30 ft. The WIDE technology is predominantly a shallow depth (<30 ft) remediation system.
Needs for Future Limitation
One area for future development is in the “winterizing” the WIDE technology. At the Ashtabula site, thePVWs were connected above ground with PVC piping. This setup experienced icing problems attemperatures below 30 degrees F. For the WIDE system to be capable of operating in cold temperatures,this limitation needs to be addressed. This could be in the form of heat traced insulation, a heatedenclosure, or burying the piping.
Design and performance modeling is needed to further the development of the technology. Currently, long-term performance data for continuous operation is not available.
Technology Selection Considerations
The WIDE system is an effective shallow-depth soil flushing tool. For short-term source reduction, WIDEhas demonstrated its ability to significantly reduce contaminant concentrations in short time frames. Thesystem has also proven to be capable of free-product recovery. As a long-term remediation system, WIDE isproving its effectiveness for reducing contamination to low clean-up limits. The WIDE technology may beused to augment other existing technologies, i.e. bioremediation, surfactant flushing, soil vapor extraction,where subsurface soil discontinuities would benefit from the close spacing and redundancy of PVWs.

23
APPENDIX A REFERENCES
Dames and Moore, 1985. Geohydraulic Report, RMI Extrusion Plant. October 30, Eckenfelder, Inc., 1997. Groundwater Remediation Technology Review for the Corrective Action
Management Unit at the RMI Extrusion Plant, Ashtabula, OH. Eckenfelder, Inc., Nashville,Tennessee.
Eckenfelder, Inc., 1996. Corrective Measures Study for the Corrective Action Management Unit, RMI
Extrusion Plant, Ashtabula, Ohio. Eckenfelder, Inc., Nashville. Engineering News Record [online],1999 [cited 24 June 1999]. “Construction Cost Index History (1908-1999).”
Available from World Wide Web: <http://www.enr.com/cost/costcci.asp>. Gabr, M.A. and Quaranta, John D., 1998. Pilot Scale Study Demonstration of In Situ TCE Flushing Using
PVDs - Ashtabula RMI Facility, Draft Final Report, Contract DE-FC21-92MC29467. Gabr, M.A., Sobodish, M., Williamson, A., and Bowders, J., 1999, “BTEX extraction from Clay Soils using
Prefabricated Vertical Drains” Journal of Geotechnical and Geo-environmental Engineering”, ASCE ,125(7), pp. 615-618.
Hazardous, Toxic and Radioactive Waste (HTRW) Interagency Cost Engineering Group, 1996. HTRW
Remedial Action, Work Breakdown. Hazardous, Toxic and Radioactive Waste (HTRW) Interagency Cost Engineering Group, 1996. HTRW
Operation and Maintenance, Work Breakdown Hazardous, Toxic and Radioactive Waste (HTRW) Interagency Cost Engineering Group, 1996. HTRW
Operation and Maintenance, Work Breakdown Monsanto Company, 1998. Rapid Commercial Initiative Report (RCI) Final Report for an integrated in-situ
Remediation Technology, Monsanto Company, St. Louis Missouri. Office of Management and Budget. 1992. “Guidelines and Discount Rates for Benefit-Cost Analysis of
Federal Programs.” Circular No. A-94, Appendix C [Revised January 1999]. Available from WorldWide Web: http://www1.whitehouse.gov/WH/EOP/OMB/html/circulars/a094.html
Quaranta, J. and Gabr, M. (2000), “Prefabricated Vertical Drains Flow Resistance Under Vacuum
Conditions” ” Journal of Geotechnical and Geo-environmental Engineering”, ASCE, 126(1), 81-84. U.S. Department of Energy, 1996. Lasagna Soil Remediation, Innovative Technology Summary Report.

24
APPENDIX B PERFORMANCE FIGURES
Ashtabula Full ScaleCumulative TCE Mass, Air and Water vs. Cumulative Run Time
Extract ion Only
Cumulative Run Time, hours0 10 20 30 40 50 60C
umul
ativ
e T
CE
Mas
s, A
ir a
nd W
ater
, mg
0
20000
40000
60000
80000
100000
120000
140000
160000 2/3
2/4
2/5
2/8
2/9
2/1
0
2/1
12
/12
2/1
5
2/1
7
2/1
8
2/1
9
3/2
3/3
3/1
6
3/1
7
3/1
8
Figure B1. Mass TCE removed vs. time (extraction only).
3/2
9
3/3
0
3/3
1
4/1
5
4/1
6 &
4/2
1
4/2
2
4/2
3
5/3
5/4
5/5
5/6
5/7
Cumula t ive Ext rac t ion Time, hours
0 10 20 30 40 50 60
Cum
ulat
ive
TC
E M
ass
(Air
Pha
se),
mg
0
10000
20000
30000
40000
50000
60000
70000
Figure B2. Mass TCE removed vs. time (injection/extraction).System Operation Time, days
0 50 1 0 0 1 5 0 2 0 0 2 5 0 3 0 0
TC
E C
once
ntra
tion
, pp
b
0
20000
40000
60000
80000
100000
120000
well 506well 508
Quadrant I Run Time = 54 .3 hours
III
III IV
506
508
Figure B3. Quadrant 1 monitoring well results.
25
0 50 100 150 200 250 300
0
20000
40000
60000
80000
100000
120000
140000
160000
well 507well 508
System Operation Time, days
TC
E C
once
ntra
tion
, pp
b
Quadrant II RunTime = 88.8 hrs
III
III IV
507
508
Figure B4. Quadrant 2 monitoring well results.
0 50 1 0 0 1 5 0 2 0 0 2 5 0 3 0 00
1000
2000
3000
4000
5000
6000
7000
8000
well 500well 502
System Operat ion Time, days
TC
E C
on
cen
tra
tio
n,
pp
b
Quadrant IV Run Time = 380 hrs
III
III IV
500
502
Figure B5. Quadrant 4 monitoring well results.
26
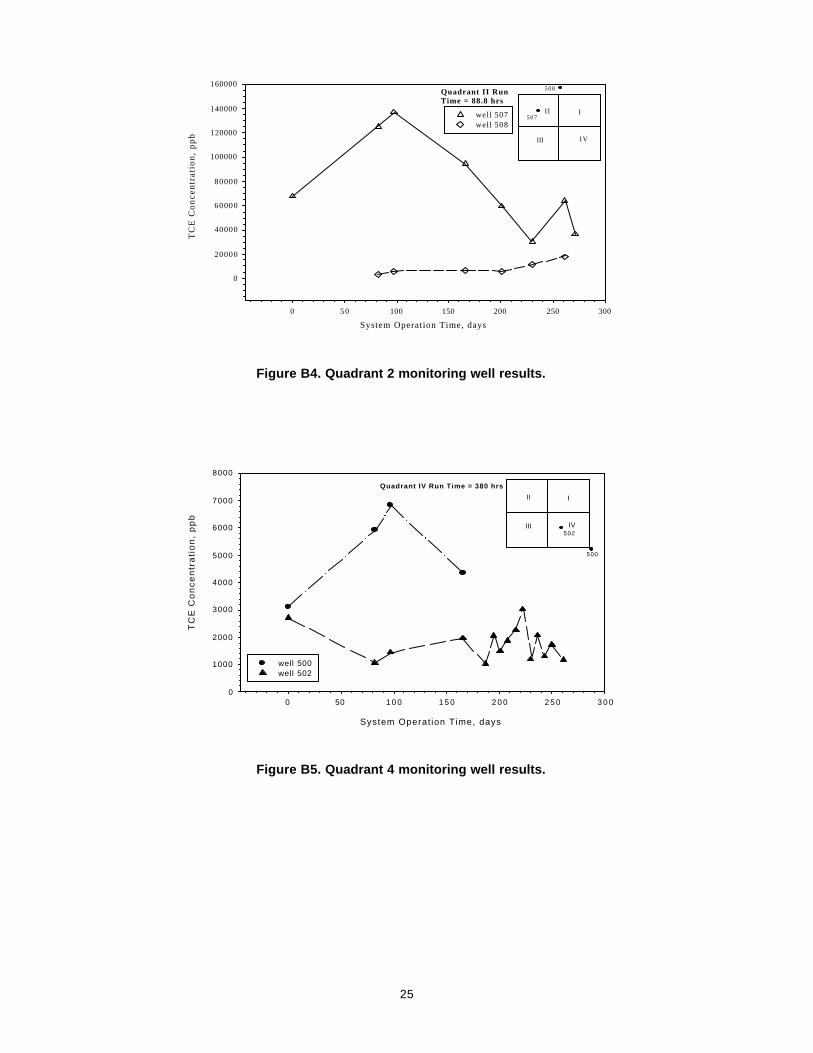
APPENDIX CACRONYMS AND ABBREVIATIONS
AEMP Ashtabula Environmental Management ProjectCAMU Corrective Action Management UnitCERCLA Comprehensive Environmental Recovery, Compensation and Liability Act
(CERCLA)DNAPL Dense Non-Aqueous Phase LiquidDOE Department of EnergyENR Engineering News RecordGAC Granular Activated CarbonHTRW WBS Hazardous , Toxic, and Radioactive Waste Work Breakdown StructureICEG Interagency Cost Estimating GroupLNAPL Light Non-Aqueous Phase LiquidMCL Maximum Contaminant LevelNCSU North Carolina State UniversityNEPA National Environmental Policy ActNETL National Environmental Technology LaboratoryNPDES National Pollution Discharge Elimination SystemO&M Operation and MaintenanceOSHA Occupational Safety and Health AdministrationOST Office of Science and TechnologyOMB Office of Management and BudgetPVD Prefabricated Vertical DrainPVW Prefabricated Vertical WellPCE PerchloroethyleneRMIES RMI Environmental ServicesTCE TrichloroethyleneTMS Technology Management SystemUST Underground Storage TankWIDETM Well Injection Depth Extraction


![Innovative Soil Opening C[1]](https://static.fdocuments.net/doc/165x107/559b21631a28abcf738b477b/innovative-soil-opening-c1.jpg)