Why Are Residential PV Prices in Germany So Much … Are Residential PV Prices in Germany So Much...
59
Why Are Residential PV Prices in Germany So Much Lower Than in the United States? A Scoping Analysis Joachim Seel, Galen Barbose, and Ryan Wiser Lawrence Berkeley National Laboratory February 2013 Revision (with Updated Data on Installation Labor Requirements) For offering comments and/or assistance, thanks to Kristen Ardani, Ted James, and Alan Goodrich (NREL), as well as Minh Le and Christina Nichols (U.S. DOE). This analysis was funded by the Solar Energy Technologies Program, Office of Energy Efficiency and Renewable Energy of the U.S. Department of Energy under Contract No. DE-AC02-05CH11231.
Transcript of Why Are Residential PV Prices in Germany So Much … Are Residential PV Prices in Germany So Much...
Why Are Residential PV Prices in Germany So Much Lower Than in the United States?
A Scoping Analysis
Joachim Seel, Galen Barbose, and Ryan Wiser Lawrence Berkeley National Laboratory
February 2013 Revision (with Updated Data on Installation Labor Requirements)
For offering comments and/or assistance, thanks to Kristen Ardani, Ted James, and Alan Goodrich (NREL), as well as Minh Le and Christina Nichols (U.S. DOE). This analysis was funded by the Solar Energy Technologies Program, Office of Energy
Efficiency and Renewable Energy of the U.S. Department of Energy under Contract No. DE-AC02-05CH11231.

Note for the February 2013 Revision
2
• The original September 2012 briefing included the results of a survey of 24 German PV installers conducted in early 2012
• One of the more surprising results was the extraordinarily low number of installation labor hours reported by survey respondents
• LBNL conducted a follow-up survey of 41 German installers in October 2012, focused solely on installation labor requirements
• The results of the follow-up survey are more in line with expectations (a mean response of 39 man-hours per system for on-site installation labor, compared to 7.5 hours per system in the original survey)
• This revised briefing includes the results of this follow-up survey, as well as a limited number of other updates (including Q3 2012 data on system pricing and market size)

Table of Contents
• Motivation, Scope, and Limitations • Background and Existing Literature
– Learning related to overall PV market size
• German Survey Results – Customer acquisition costs – Installation labor costs – Permitting, interconnection and inspection costs – Sales taxes – Other soft Balance of System (BoS) costs
• Secondary Analysis – Project development time – Economies of scale in residential system size – Chinese module market share
• Summary • Bibliography
3
Motivation, Scope, and Limitations
• The installed price of residential PV is significantly lower in Germany than in the U.S., due primarily to differences in “soft” costs – But relatively little is known about how/why soft cost components differ
• In order to better characterize the nature of these differences, LBNL: – Fielded two surveys of German PV installers, adapted from NREL’s survey of
U.S. installers, to collect data on residential PV soft costs – Comprehensively reviewed public and private consultant data relevant to the
cost structure of residential PV in Germany • Focus is the pre-incentive price paid for customer-owned systems
– Residential PV in Germany is almost entirely customer-owned; substantial third-party ownership in U.S. but pricing sometimes impacted by appraised values
• Analysis here is intended to be a “first cut” and serves to highlight specific areas where further research could reveal additional insights – Survey focus was on quantifying differences in specific business process costs – Additional research needed to confirm and characterize differences in more
detail, as well as to link observed differences to underlying market drivers
4

Germany’s 2011 Additions ~4x Greater, and Cumulative Additions More than 5x Greater, than United States
5 !"#"$%&'()*+,$$-%,$./0$"12$3456%/.07$3*(8"19,$:;*#<0$=>*2*("?$3(@2$0A*1)9B$
CD$ EC$ DF$ GH$ ID$ JKF$ JDI$ CJK$ EEF$ DHE$IJF$
JIKK$JIIC$
LE$ JJK$ JJK$JEI$ GHK$
ILJ$ FDE$JCHJ$
JILK$
EHID$
HDKF$ HDFL$
GCCH$
K$
LKKK$
JKKKK$
JLKKK$
CKKKK$
CLKKK$
EKKKK$
ELKKK$
K$
JKKK$
CKKK$
EKKK$
DKKK$
LKKK$
GKKK$
HKKK$
FKKK$
CKKK$ CKKJ$ CKKC$ CKKE$ CKKD$ CKKL$ CKKG$ CKKH$ CKKF$ CKKI$ CKJK$ CKJJ$ CKJC$MJNME$
!"#"$%&
'()*++
,&-.
)/012)
*.."
%$)%++
,&-.
3)/012))
45)6%7%6,89)%++,&-.3):01;)
3*(8"19$)'8'?"OP*$ -%0$)'8'?"OP*$ -%0$"11'"?$"22@O&1+$ 3*(8"19$"11'"?$"22@O&1+$

Annual Residential Installations in Germany 2.5x Greater (9.4x Greater on per Capita Basis) than in the United States
6
JCF$ JJL$
CGF$CIH$
GFF$
HGJ$
K$
JKK$
CKK$
EKK$
DKK$
LKK$
GKK$
HKK$
FKK$
CKJK$ CKJJ$
01)
Q0$-%0$3*(8"19$
ERD$ERK$
KRI$ JRK$
FRL$
IRD$
KRK$
JRK$
CRK$
ERK$
DRK$
LRK$
GRK$
HRK$
FRK$
IRK$
JKRK$
CKJK$ CKJJ$
1)<)6%7
,8%)
*.."%$)=(3,+(.&%$)45),.38%$$%&-.3)
!"#"$%&'()*+,$$-%,$3456%/.07$3*(8"19,$:;*#<0$=>*2*("?$3(@2$0A*1)9B$

Cumulative Residential Installations in Germany 3.6x Greater (14x on per Capita Basis) than in United States
7
EHE$ DFF$GEH$
IED$
CHEJ$
EDCK$
K$
LKK$
JKKK$
JLKK$
CKKK$
CLKK$
EKKK$
ELKK$
DKKK$
CKJK$ CKJJ$
01)
Q0$
-%0$
3*(8"19$
JK$JE$
C$ E$
ED$
DC$
K$
L$
JK$
JL$
CK$
CL$
EK$
EL$
DK$
DL$
CKJK$ CKJJ$
1)<)6%7
,8%)
!"#"$%&'()=(3,+(.&%$)45),.38%$$%&-.3)
!"#"$%&'()*+,$$-%,$3456%/.07$3*(8"19,$:;*#<0$=>*2*("?$3(@2$0A*1)9B$

Varied Data Sources Are Available for U.S. and German PV System Pricing
• LBNL Tracking the Sun (TTS): Installed prices for ~70% of PV capacity installed in the U.S. from 1998-2011
• NREL Cost Modeling Team: Quarterly bottom-up installed price benchmarks based on interviews with installers and modeling
• EuPD: Project-level price quotes collected through quarterly survey of German installers (since 2008); used for BSW price reports
• Photon, other consultants: Installed price benchmarks based on interviews with installers or other market research
• Miscellaneous: Schaeffer et al., 2004, “Learning from the Sun”; Haas, 2004, “Progress in Markets for Grid-Connected PV Systems in the Built Environment”; Credit Agency for Reconstruction (KfW); IEA National PVPS reports; Langen 2010
8

!"!"#$#">&)'+@1A$&1$+9+#*8+$SJKTU$+*(P*+$"+$"$V(&W9$X&($#Y*$(*+@2*1O"?$8"(T*#Z$"+$#Y*$V(&[*)#N?*P*?$@1+#"??*2$V(@)*$2"#"$X&($3*(8"1$+9+#*8+$'+*2$X&($#Y@+$\A'(*$2&$1&#$@1)?'2*$Y&+#$)'+#&8*($#9V*$
Residential PV System Prices Have Often Been Higher in the U.S. Than in Germany
!"#"$%&'()*+,))%&'&(')*#$+(,-./$*("(*$2*(@P*2$X(&8$]:;]^+$44%$2"#"+*#$"12$"(*$*_'"?$#&$#Y*$8*2@"1$&X$)'+#&8*(N&`1*2$+9+#*8+$SJKTU$@1+#"??*2$@1$*")Y$9*"(R$$0$-+12(')*#$+(,-./$*""(*$#Y*$"P*("A*+$&X$@12@P@2'"?$V(@)*$_'&#*+$@1$/'a!^+$2"#"+*#$=CKKFNCKJJB$&($#Y*$"P*("A*$&X$V(@)*+$(*V&(#*2$b9$./0Z$aY&#&1Z$cXUZ$"12$%)Y"*d*($$=CKKJNCKKHBR$3"456$(71/#"-)801#$(,-./$*""(*$#Y*$"P*("A*$&X$V(@)*+$(*V&(#*2$b9$./0Z$345Z$.e/;0Z$;"P@A"1#Z$"12$aY&#&1$="11'"?$)'((*1)9$*W)Y"1A*$("#*+$`*(*$'+*2$X&($8&2'?*$V(@)*+$*+O8"#*+B$
9
GRIJ$GRCJ$
DRCL$ERDC$
JRFJ$ JREL$
GRLG$LRFF$LRCG$
K$
C$
D$
G$
F$
JK$
JC$
CKKJ$ CKKC$ CKKE$ CKKD$ CKKL$ CKKG$ CKKH$ CKKF$ CKKI$ CKJK$ CKJJ$
>?@A
A<1)
0(+,%.)B.38%$$(+)4=,6()-C)!"38-#(=DEF.(+)45)G938(#3)HA@)I1J)
-%$+9+#*8$V(@)*+$
3*(8"1$+9+#*8$V(@)*+$
8&2'?*$X")#&(9NA"#*$V(@)*+$
Q0$
;f$
0g$

!"#"$%&'()*+,$-%,$44%Z$Q%.$`&(T@1A$2"#"b"+*$&X$!*)$L#Y$CKJC7$$3*(8"19,$/'a!$"12$:%U$
Installed Price Gap Was $2.8/W in Q4 2011 and Differential Continued Through 2012
10 9(!"#$#"3*(8"1$+9+#*8$V(@)*+$"(*$"P"@?"b?*$b9$_'&#*$2"#*Z$("#Y*($#Y"1$b9$@1+#"??"O&1$2"#*R$$h&`*P*(Z$#Y*$"P*("A*$O8*$?"A$b*#`**1$V(@)*$_'&#*$"12$@1+#"??"O&1$2"#*$@+$8')Y$+Y&(#*($@1$3*(8"19$#Y"1$@1$#Y*$-%RZ$"+$2*+)(@b*2$X'(#Y*($`@#Y@1$#Y*$+*)&12"(9$"1"?9+@+$
HREG$HRKL$
GRFK$GRLK$
GRDD$ GRCF$ GRJG$ LRIK$
DREF$ DREC$DRCK$ DRKI$
ERGH$ ERGJ$ERCG$ ERKF$
CRFH$CRGC$ CRLJ$
GRGL$ GRLI$ GRDG$GRCE$ GRCE$
LRFH$LRLC$
LRLG$LRJJ$
CRKK$
ERKK$
DRKK$
LRKK$
GRKK$
HRKK$
FRKK$
CKJK$MJ$
CKJK$MC$
CKJK$ME$
CKJK$MD$
CKJJ$MJ$
CKJJ$MC$
CKJJ$ME$
CKJJ$MD$
CKJC$MJ$
CKJC$MC$
CKJC$ME$
>?@A
A<1)
B.38%$$%&-.)K%8(J)
0(+,%.)B.38%$$(+)4=,6()-C)!"38-#(=DEF.(+)45)G938(#3)HA@)I1)
-%$+9+#*8$V(@)*+$
3*(8"1$+9+#*8$V(@)*+$
Q%.$+9+#*8$V(@)*+$
;f$
0g$

Ki$
Li$
JKi$
JLi$
CKi$
CLi$
EKi$
ELi$
DKi$
4(=6(.
8)-C)3938(#3)
>?@AA<1)
-%0$
3*(8"19$
Installed Prices in the U.S. Are Also Much More Varied Than in Germany
11
• Some U.S. systems have reached German prices already
• Greater variation in the U.S. indicative of greater market fragmentation across jurisdictions
!"#"$%&'()*+,$-%,$44%7$$3*(8"19,$/'a!$
L=(M"(.69)K,38=,N"&-.O)B.38%$$(+)4=,6()-C)HA@)I1)!"38-#(=DEF.(+)G938(#3)B.38%$$(+),.)?@AA)
9(!"#$O)3*(8"1$2"#"$)&8*$X(&8$"$_'"(#*(?9$+'(P*9$&X$+9+#*8$V(@)*$_'&#*+$X(&8$(&'AY?9$JKK$@1+#"??*(+Z$"12$"(*$#Y'+$b"+*2$&1$"$8')Y$+8"??*($+"8V?*$#Y"1$#Y*$-%$2"#"$"12$8"9$1&#$(*j*)#$#Y*$X'??$*W#*1#$&X$V(@)*$P"(@"b@?@#9$@1$#Y*$3*(8"1$8"(T*#R$

Learning Curve Analyses of BoS Costs
• Traditional PV learning curve analyses often focus on PV modules and relate global module production to module prices
• Some business process costs (e.g., installation labor, customer acquisition) may also be subject to local learning effects
• We compare the relative impact of local BoS learning in the U.S. and Germany based on implied non-module costs for <10 kW PV systems and cumulative national PV capacity installed
• BoS progress ratios may help predict future U.S. price reductions that accompany larger market scale
12
Question: To what extent are lower BoS costs in Germany potentially due to larger overall market scale and associated learning-induced cost reductions?

!"#"$%&'()*+,$$%**$+?@2*$IR$
$
Differences in Market Size Alone May Explain Roughly Half of the Price Gap
13
B#7$,(+)*'(=%P()*.."%$)Q-.D0-+"$()!-383J)'3R)!"#"$%&'()!%7%6,89O$
Q'+#&8*(Nk`1*2$%9+#*8+$SJK$TUZ$CKKJNCKJJ$
• Total non-module costs in 2011 were ~$2.8/W higher in the U.S. than in Germany
• But, at the same cumulative capacity that the U.S. had installed at the end of 2011 (4 GW), non-module costs for residential PV in Germany were only $1.3/W less than in the U.S.
• One might (crudely) infer that the remaining $1.5/W of the total gap in 2011 non-module costs may be due simply to the larger base of German experience
K$
J$
C$
E$
D$
L$
G$
H$
F$
I$
JK$
JKK$ JKKK$ JKKKK$
>?@A
A<1)
6"#"$%&'().%&-.%$)45)6%7%6,89),.38%$$(+)/012)
-%0$ 3*(8"19$
CKJJ$
CKJJ$
lJREK$
lJRLK$
9(!"#$O).8V?@*2$"P*("A*$"11'"?$1&1N8&2'?*$)&+#$m$$ $ $ $ $$$$$$$$$$$$$"P*("A*$"11'"?$+9+#*8$V(@)*$8@1'+$A?&b"?$"P*("A*$X")#&(9$A"#*$8&2'?*$V(@)*$
Soft-Cost Learning for <10 kW Systems Occurs More Slowly in the U.S. and Is Less Effective
14
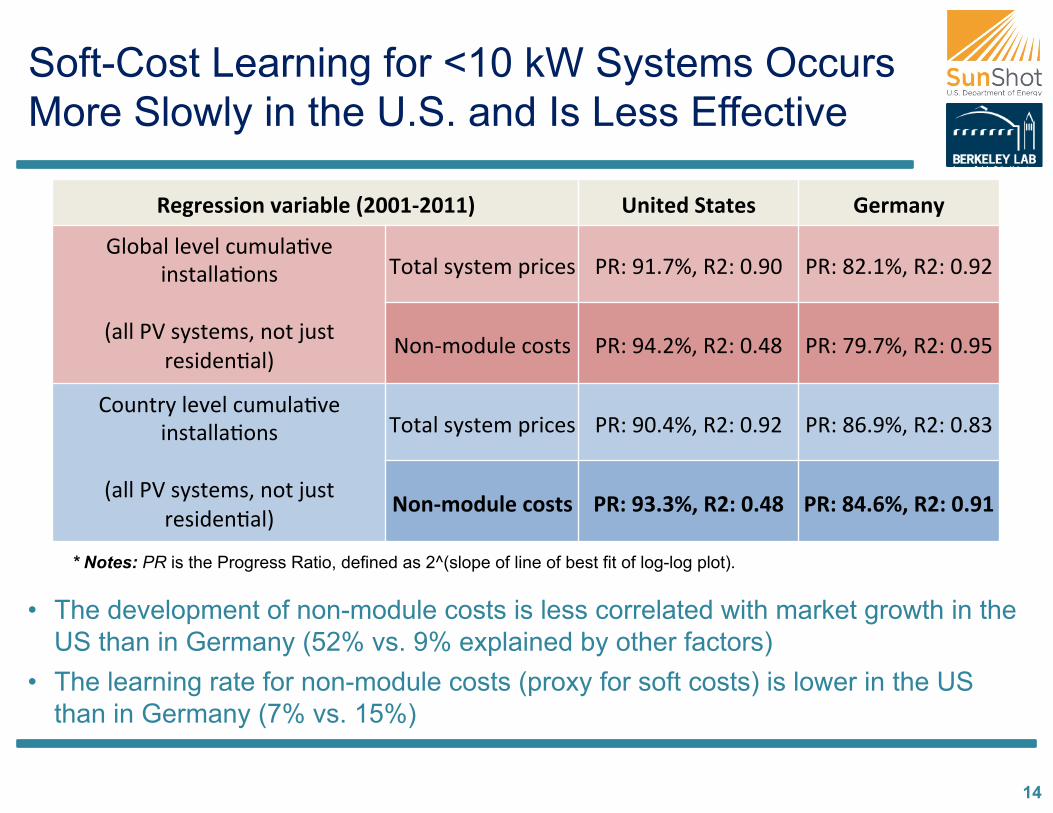
• The development of non-module costs is less correlated with market growth in the US than in Germany (52% vs. 9% explained by other factors)
• The learning rate for non-module costs (proxy for soft costs) is lower in the US than in Germany (7% vs. 15%)
S(P=(33,-.)'%=,%N$():?@@AD?@AA;) T.,8(+)G8%8(3) U(=#%.9)
3?&b"?$?*P*?$)'8'?"OP*$@1+#"??"O&1+$$
$="??$an$+9+#*8+Z$1&#$['+#$
(*+@2*1O"?B$
4&#"?$+9+#*8$V(@)*+$ ae,$IJRHiZ$eC,$KRIK$ ae,$FCRJiZ$eC,$KRIC$
;&1N8&2'?*$)&+#+$ ae,$IDRCiZ$eC,$KRDF$ ae,$HIRHiZ$eC,$KRIL$
Q&'1#(9$?*P*?$)'8'?"OP*$@1+#"??"O&1+$$
$="??$an$+9+#*8+Z$1&#$['+#$
(*+@2*1O"?B$
4&#"?$+9+#*8$V(@)*+$ ae,$IKRDiZ$eC,$KRIC$ ae,$FGRIiZ$eC,$KRFE$
Q-.D#-+"$()6-383) 4SO)VWRWXY)S?O)@RZ[) 4SO)[ZR\XY)S?O)@RVA)
* Notes: PR is the Progress Ratio, defined as 2^(slope of line of best fit of log-log plot)R$$

Regular FiT Adjustments Pressure German Installers to Reduce Prices
15 !"#"$%&'()*+,$/'a!$=CKKFNCKJJBZ$:%U$=CKJCB$./0Z$cXUZ$aY&#&1$
• BNEF (2012) indicates the presence of value-based pricing in both the US and Germany
• Following this hypothesis, the iterative reduction of the FiT presses German installers to lower system prices to maintain attractive investments for their customers
• Similar forces may operate less efficiently in the U.S., yielding higher “value-based” prices, even for customer-owned systems
KRKK$
KRJK$
KRCK$
KREK$
KRDK$
KRLK$
KRGK$
KRHK$
KRFK$
KRIK$
K$
C$
D$
G$
F$
JK$
JC$
JD$
f"1NKD
$
f'?NK
D$
f"1NKL
$
f'?NK
L$
f"1NKG
$
f'?NK
G$
f"1NKH
$
f'?NK
H$
f"1NKF
$
f'?NK
F$
f"1NKI
$
f'?NK
I$
f"1NJK
$
f'?NJ
K$
f"1NJJ
$
f'?NJ
J$
f"1NJC
$
f'?NJ
C$
f"1NJE
$
>)?@
AA<I1])
>?@A
A)<1
)
U(=#%.)L,^)%.+)3938(#)7=,6(3)):_A@I1)3938(#3;)
>@4$lCKJJ6U$o$FGK$TUY6TUp"$ >@4$lCKJJ6U$o$HEK$TUY6TUp"$
3*(8"1$+9+#*8$V(@)*$l6U$ >@4$lCKJJ6TUY$

Hypotheses Explored for Why German and U.S. Residential PV Prices Differ
• General: – Residential systems are larger in Germany! yes – US installers develop projects more slowly ! yes
(semi-addressed) – US installers have higher profit margins, after
recovering all overhead expenses ! uncertain (semi-addressed)
• Component costs: – Hardware component costs are lower in
Germany ! possibly true for inverters, but uncertain (semi-addressed)
– US has a lower share of cheaper Chinese modules ! no
• Customer acquisition: – US installers have higher customer acquisition
costs ! yes – US installers have lower customer success rates
! yes – US installers have higher marketing and
advertising costs ! yes
16
• Installation labor: – US installers need longer for the installation
process ! yes – US installers have higher wages ! yes for
installation labor, no for other labor (semi-addressed)
• Permitting, Interconnection and Inspection Costs – US installers have higher labor hour
requirements for PII ! yes – US has higher permitting and interconnection
fees ! yes
• Taxes – The US charges higher sales taxes on PV
systems than Germany ! yes
Additional Hypotheses Not Explored Here • Overhead costs
– US has higher business overhead costs (e.g. insurance costs, material storage costs)
– German installers have higher sales volume per year, spreading fixed costs over larger denominator and profiting from economies of scale, allowing for volume discounts
– US installers have higher cost of capital for their own business operations
– US installers face higher transaction costs associated with arranging financing for customers
– US has a longer supply chain for PV modules and other hardware
• Profit margins – US has a lower degree of competition
among installers, maintaining higher profit margins
– Value based pricing allows for higher prices in the US, given better irradiation, high retail rates in some regions, and more generous subsidies
17
• Regulatory issues – US requires each panel and rack component
to be grounded to the DC switchbox leading to higher material costs and installation labor hours
– Germany has less onerous requirements for roof mounting structures
• Installation timing – US systems are installed more steadily
throughout the year, whereas German installations were traditionally concentrated at the end of the year when prices are lower, leading to lower annual average prices
• Exchange rate dynamics are more beneficial for German system costs

A Small Body of Literature Explores the German-U.S. PV Price Gap • Few have sought to explain the underlying reasons behind the German-U.S. PV price
gap or to quantify differences in specific soft costs – Photon 2011a, Photon 2011b, BNEF 2012, Langen 2010, Podlowski 2008, Goodrich et al. 2012
• Possible reasons for the price gap that have been postulated: – “Value-based pricing” in the U.S. (e.g., associated with more generous subsidies and/or less competition
among installers) – Preference for premium products in the U.S. – Lower customer-acquisition costs in Germany due to simpler/more certain value proposition (FiT), critical
mass of demand, and economies of scale – Lower installation labor costs in Germany due to greater experience and economies of scale – Lower permitting costs in Germany due to fewer requirements and greater standardization – Less onerous electrical requirements and interconnection processes in Germany
• Our analysis complements that literature by: – Deriving estimates for specific business process costs via two surveys of German residential installers – Using large samples of system prices to compare price developments and distributions – Estimating the impact of differences in project development times on reported prices – Analyzing residential module market composition
• Complements NREL cost modeling team’s in-depth interviews with installers
18

%'(P*9$e*+'?#+$
AV)

LBNL Surveys of German PV Installers
• Overview of survey approach (original and follow-up surveys)
• Sample characterization
• Survey respondents’ build-up of installed price
• Individual business process costs (with comparisons to NREL survey of U.S. installers*) – Customer acquisition costs – Permitting, interconnection and inspection – Installation labor costs
• Sales/value-added tax for PV
20 !"!"#$""$+?@AY#$#*8V&("?$8@+"?@A18*1#Z$"+$#Y*$;e/]$+'(P*9$&X$-R%R$@1+#"??*(+$X&)'+*2$&1$CKJK$@1+#"??"O&1+Z$`Y*(*"+$#Y*$]:;]$+'(P*9+$&X$3*(8"1$@1+#"??*(+$X&)'+*2$V(@8"(@?9$&1$CKJJ6CKJC$@1+#"??"O&1+R$
Overview of Initial Survey Approach
U(=#%.9))?@AA)
TRGR)?@A@J)
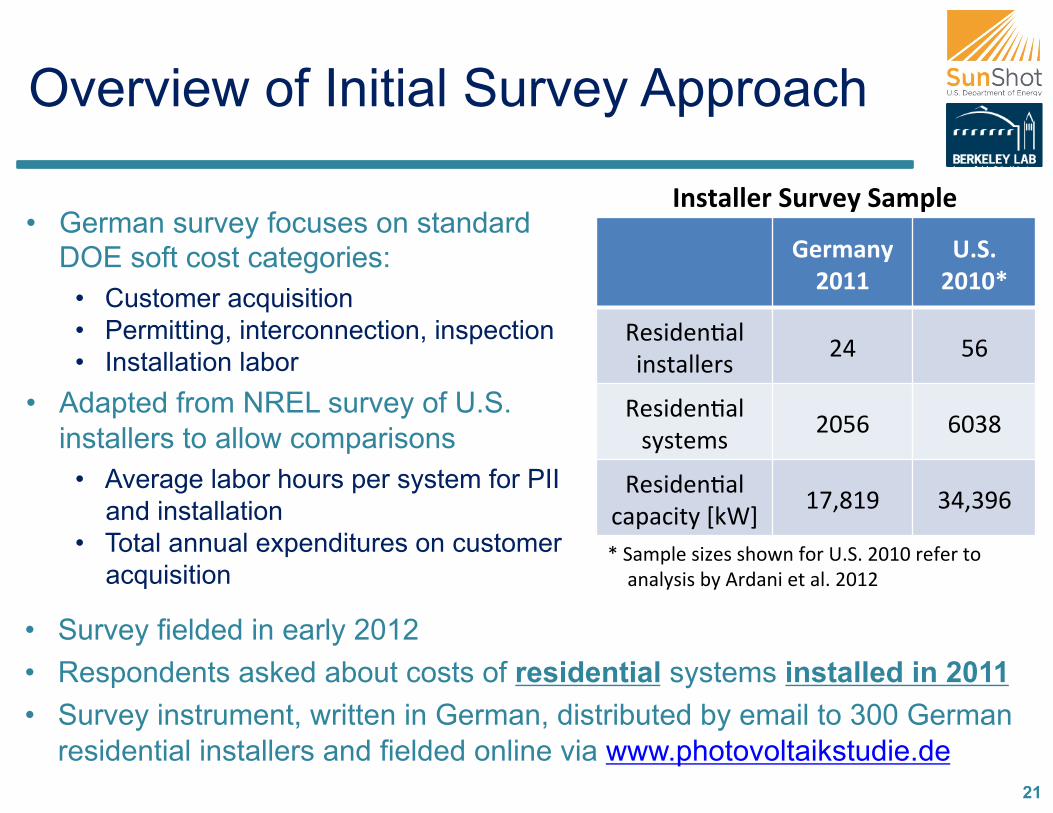
e*+@2*1O"?$@1+#"??*(+$ CD$ LG$
e*+@2*1O"?$+9+#*8+$ CKLG$ GKEF$
e*+@2*1O"?$)"V")@#9$qTUr$ JHZFJI$ EDZEIG$
21
• German survey focuses on standard DOE soft cost categories:
• Customer acquisition • Permitting, interconnection, inspection • Installation labor
• Adapted from NREL survey of U.S. installers to allow comparisons
• Average labor hours per system for PII and installation
• Total annual expenditures on customer acquisition
B.38%$$(=)G"='(9)G%#7$()
• Survey fielded in early 2012 • Respondents asked about costs of residential systems installed in 2011 • Survey instrument, written in German, distributed by email to 300 German
residential installers and fielded online via www.photovoltaikstudie.de
p$%"8V?*$+@<*+$+Y&`1$X&($-R%R$CKJK$(*X*($#&$"1"?9+@+$b9$0(2"1@$*#$"?R$CKJC$

Follow-Up Survey on German Installation Labor Hours
• LBNL conducted a second survey of German installers in October 2012, focused solely on installation labor requirements
• The survey asked 7 questions about German residential PV installations completed during the preceding 12 months.
• Survey was fielded online (between October 9th and November 5th 2012) in German in collaboration with www.photovoltaikstudie.de
22
U(=#%.)G"='(9)?@A?)
e*+@2*1O"?$@1+#"??*(+$ DJ$
e*+@2*1O"?$+9+#*8+$ JFDC$
e*+@2*1O"?$)"V")@#9$qTUr$ JJZICD$
• Participation requests were also sent to previous German soft-BoS survey respondents, a list of 300 German residential PV installers and a range of industry experts for further distribution.
;&#"O&1$X&($e*X*(*1)@1A$3*(8"1$%'(P*9+$#Y(&'AY&'#$e*8"@12*($&X$01"?9+@+,$$k(@A@1"?$3*(8"1$:&%$+'(P*9$&1$+9+#*8+$@1+#"??*2$@1$CKJJ$$$$$$$ $$$$$$$$$$$$$$$$$$$$$!$s$%&'()"*+&,%-"./00t$$>&??&`N'V$3*(8"1$?"b&($+'(P*9$&1$+9+#*8+$@1+#"??*2$k)#R$CKJJN%*V#R$CKJC$$$ $!$s$%&'()"*+&,%-"./0.t$

Raw Sample Characterization
• Most respondents in both surveys are small volume installers – Most installed <50 systems per
12-month period – Median installations/yr = 25 for
2011, 26 for 2012
• Average system sizes are a bit smaller in 2012 German survey – Average of 6 kW per system
(compared to 8 kW in German 2011 survey*)
– Less variation in average system size
23
G$JK$
E$ C$ E$I$
CC$
L$ C$ E$K$
L$
JK$
JL$
CK$
CL$
uI$ JKNDI$ LKNII$ JKKNJII$ vCKK$
Q"#
N(=)-
C)S(37-
.+(.
83)
Q"#N(=)-C)S(3,+(.&%$)G938(#3)B.38%$$(+)7(=)`(%=)
Q"#N(=)-C)S(3R)G938(#3<`=R)B.38%$$(+)3*(8"1$%'(P*9$CKJJ$
3*(8"1$%'(P*9$CKJC$
D$F$ H$ E$ C$E$
CG$
JK$C$ K$
K$
L$
JK$
JL$
CK$
CL$
EK$
uD$ DNF$ FNJC$ JCNJG$ vJG$
Q"#
N(=)-
C)S(37-
.+(.
83)
*'(=%P()G,a()-C)S(3,+(.&%$)G938(#3)B.38%$$(+)/I172)
*'(=%P()S(3,+(.&%$)G938(#)G,a()3*(8"1$+'(P*9$CKJJ$
3*(8"1$+'(P*9$CKJC$

Total Soft BoS Costs + Profit Represent Roughly $0.62/W or 20% of System Price
24
9(!"#$*:(%'(P*9$(*+'?#+$ $"(*$+'88"(@<*2$ @1$#*(8+$&X$ #Y*$"P*("A*$&X$(*+V&1+*+$")(&++$+'(P*9$(*+V&12*1#+Z$`*@AY#*2$b9$*")Y$(*+V&12*1#^+$(*V&(#*2$CKJJ$(*+@2*1O"?$)"V")@#9$@1+#"??*2R$$4Y@+$)Y"(#$+'88"(@<*+$(*+V&1+*+$#&$#Y*$+'(P*9$_'*+O&1$"+T@1A$ @1+#"??*(+$#&$ @2*1OX9$#Y*$"P*("A*$V(@)*$&X$(*+@2*1O"?$+9+#*8+$+&?2$ @1$CKJJZ$"12$#&$"??&)"#*$#Y"#$V(@)*$")(&++$#Y*$)"#*A&(@*+$@2*1O\*2$"?&1A$#Y*$WN"W@+R$!'*$#&$#Y*$(*P@+*2$@1+#"??"O&1$?"b&($)&+#$*+O8"#*+$b"+*2$&1$#Y*$+*)&12$+'(P*9Z$#Y*(*$ @+$ "$ +?@AY#$8@+"?@A18*1#$ b*#`**1$ #Y*$ )"#*A&(9$ s&#Y*($ V(&[*)#$ )&+#+t$ "12$ #Y*$ +'8Z$ (*V&(#*2$ ?"#*(Z$ &X$ a..Z$ 2@(*)#$)'+#&8*($")_'@+@O&1$)&+#$"12$?"b&($@1+#"??"O&1$)&+#+R$$
S(3,+(.&%$)45)G938(#)4=,6()b",$+DT7)S(7-=8(+)N9)U(=#%.)B.38%$$(=3))=0P*("A*+p$"12$CL#Y6HL#Y$a*()*1O?*+$X&($%9+#*8+$.1+#"??*2$@1$CKJJ$B$
JRFC$
KREE$KRCE$
KRJF$KRJL$
KRCF$
ERDD$
ERKL$CRHK$
KRK$
KRL$
JRK$
JRL$
CRK$
CRL$
ERK$
ERL$
8&2'?*$ @1P*(#*($ &#Y*($Y"(2`"(*$
&#Y*($V(&[*)#$)&+#$
&#Y*($1&1NV(&[*)#$)&+#$
1*#$V(&\#$ &#Y*($+9+#*8$V(@)*$
*+O8"#*+$
>)?@
AA<1
)
/'a!$CKJJ$
aY&#&1$CKJJ$
:;/>$MD$CKJJ$
e*V&(#*2$0P*("A*$%9+#*8$a(@)*$b9$CD$.1+#"??*(+,$lERKK6U$
.1)?'2*+$@1+#"??"O&1$
?"b&($)&+#Z$a..Z$$2@(*)#$
)'+#&8*($")_'@+@O&1$$
.1)?'2*+$&P*(Y*"2Z$
)&+#$&X$X"@?*2$b@2+Z$A*1*("?$"2P*(O+@1A$
/W)?'2*+$&P*(Y*"2$)&+#+$

Survey Responses Are Generally Consistent with Estimates Reported Elsewhere
25
!-#7%=,3-.)-C)G"='(9)S(37-.3(3)8-)E8](=)c3&#%8(3)C-=)S(3,+(.&%$)45),.)U(=#%.9))
(((!"#$:"sk#Y*($kP*(Y*"2t$@+$#Y*$+'8$&X$)'+#&8*($")_'@+@O&1$)&+#+Z$a..$"12$"22@O&1"?$&P*(Y*"2R$$$s4&#"?$%&w$:&%t$@+$#Y*$+'8$&X$)'+#&8*($")_'@+@O&1$)&+#+Z$@1+#"??"O&1$?"b&(Z$a..Z$&P*(Y*"2Z$"12$V(&\#$
JRFC$
KREE$ KRCE$ KRCE$ KRJJ$ KRCF$KRGC$
KRKK$
KRLK$
JRKK$
JRLK$
CRKK$
CRLK$
5&2'?*$ .1P*(#*($ k#Y*($h"(2`"(*$ .1+#"??"O&1$]"b&($
k#Y*($kP*(Y*"2$ a(&\#$ 4&#"?$%&w$:&%$
>?@A
A<1)
%'(P*9$
/'a!$?&`$
/'a!$Y@AY$
:;/>$MD$CKJJ$
ahk4k;$MC$CKJJ$+8"??$)&88*()@"?$

Soft Costs for Residential PV in Germany Are ~$2.7/W Lower Than in the U.S.
26
Total soft costs for residential PV in Germany, including margin, are just 19% of the implied soft costs for U.S. residential PV ($0.62/W vs. $3.34/W)
JRFE$ JRFC$
KRLL$ KREE$
KRDH$KRCE$
ERED$
KRGC$
KRKK$
JRKK$
CRKK$
ERKK$
DRKK$
LRKK$
GRKK$
HRKK$
-%0$CKJJ$ 3*(8"19$CKJJ$
>)?@
AA)<)1
) +&w$:&%$x$V(&\#$
&#Y*($Y"(2`"(*$
@1P*(#*($
8&2'?*$
>WR@@)
>\RAV)
.8V?@*2$+&wN:&%$x$V(&\#$$1&%234+(5"67"88*"2-29%'":&3;%2"()4"<(&4=(&%";6292>"
3456%/.0p$
;e/]$)&+#$8&2*?@1A$hC$CKJJ$
]:;]$44%,$e*+@2*1O"?$+9+#*8+$&X$"19$+@<*Z$*W)?'2@1A$E(2$V"(#9$&`1*2$+9+#*8+$$
9(!"#$:(-%$8&2'?*$"12$@1P*(#*($V(@)*+$"(*$b"+*2$&1$"P*("A*$X")#&(9$A"#*$V(@)*+$X&($MD$CKJKNME$CKJJ$"+$(*V&(#*2$b9$3456%/.0$`@#Y$"1$"22*($&X$JKi$#&$"))&'1#$X&($+'VV?9$)Y"@1$)&+#+R$.1P*(#*($*y)@*1)9$"++'8*2$#&$b*$FLiR$

Labor Rates Are Higher in Germany Than in the U.S. for Some Functions, but Lower for Others
27
• The results that follow this slide rely on German wage rates derived from the survey • In the above graphic, data from the German statistical agency (DeStatis) are also
shown for comparison (these data cover all sectors, so are not specific to PV) • U.S. labor rates are from RS Means (as used by NREL cost modeling team and as
used in NREL BoS survey analysis for the U.S.)
GC$
DC$EL$
EC$
CK$
Z[)
W[)Zd)
eW)
Z?)
CF$CJ$
LE$
CE$EC$
K$
JK$
CK$
EK$
DK$
LK$
GK$
HK$
*?*)#(@)@"1$@1+#"??"O&1$?"b&($
1&1N*?*)#(@)@"1$@1+#"??"O&1$?"b&($
+9+#*8$2*+@A1$*1A@1**($ +"?*+$(*V(*+*1#"OP*$ "28@1@+#("OP*$?"b&($
>)?@
AA)<])
L"$$9)N"=+(.(+)F%P(3)%8)45),.38%$$%&-.)6-#7%.,(3)/><]2)
-%0$ 3*(8"1$+'(P*9$CKJJ$ 3*(8"1$%#"O+O)"?$0A*1)9$CKJK$

Residential Customer Acquisition Costs Average $0.07/W in Germany
28
• Most respondents reported customer acquisition costs <$0.15/W; several small-volume installers reported somewhat higher costs
• On average, customer acquisition labor includes 3 hrs/system for sales representative and 2 hrs/system for design engineer
KRKD$
KRKC$
KRKJ$
lKRKK$
lKRKJ$
lKRKC$
lKRKE$
lKRKD$
lKRKL$
lKRKG$
lKRKH$
lKRKF$
3*(8"19$CKJJ$
>?@A
A<1)
%9+#*8$!*+@A1$
5"(T*O1A$"12$02P*(O+@1A$
k#Y*($Q'+#&8*($0)_'@+@O&1$
>R@d)
*'(=%P()!"38-#(=)*6M",3,&-.)!-383)*6=-33)B.38%$$(=3)
lKRK$
lKRJ$
lKRC$
lKRE$
lKRD$
lKRL$
lKRG$
lKRH$
lKRF$
K$ JKK$ CKK$ EKK$ DKK$ LKK$ GKK$
>?@A
A<1)
4&#"?$e*+@2*1O"?$.1+#"??"O&1+$=zB$
*'(=%P()!"38-#(=)*6M",3,&-.)!-383)C-=)c%6])B.38%$$(=)
!"#$*:(k#Y*($Q'+#&8*($0)_'@+@O&1$)&+#+$@1)?'2*$+')Y$@#*8+$"+,$+"?*+$)"??+Z$+@#*$P@+@#+Z$#("P*?$O8*$#&$"12$X(&8$#Y*$+@#*Z$)&1#(")#$1*A&O"O&1Z$b@2$V(*V"("O&1R$5"(T*O1A${$02P*(O+@1A$"12$k#Y*($Q'+#&8*($0)_'@+@O&1$)&+#+$"(*$b"+*2$&1$(*V&(#*2$"11'"?$*WV*12@#'(*+Z$`Y@?*$%9+#*8$!*+@A1$)&+#+$"(*$b"+*2$&1$(*V&(#*2$?"b&($Y&'(+$"12$`"A*+$X&($+9+#*8$2*+@A1$*1A@1**(@1AR$

Customer Acquisition Costs in Germany Are $0.6/W Less Than in the U.S.
29
• Mean bid success rate is slightly lower in the US (30% in US vs. 40% in Germany)
• German installers leverage partnerships with equipment manufacturers
• Langen (2010) points to simpler and more certain value proposition in Germany (i.e., FiT), installer learning, and critical mass for word of mouth
!"#$,$:"($)Y"(#$&X$-R%R$V(&)*++$)&+#+$"(*$2*(@P*2$X(&8$;e/]$+'(P*9$&X$-R%R$@1+#"??*(+$=0(2"1@$*#$"?R$CKJCBR$
KRCD$
KRKD$
KRED$
KRKC$
KRJJ$
KRFL$
JRJ$
KRD$
lKRKK$
lKRCK$
lKRDK$
lKRGK$
lKRFK$
lJRKK$
lJRCK$
-%0$CKJK$ 3*(8"19$CKJJ$
>?@A
A<1)
*'(=%P()!"38-#(=)*6M",3,&-.)!-383)
%9+#*8$!*+@A1$
;&1NV(&[*)#$+V*)@\)$5"(T*O1A${$02P*(O+@1A$
k#Y*($V(&[*)#N+V*)@\)$Q'+#&8*($0)_'@+@O&1$
U&&2?"`1$0++&)@"#*+$CKJC$
]"1A*1$CKJK$
>@R\V)
>@R@d)

PII Costs Are Negligible for Residential PV in Germany • Total PII costs of $0.03/W on average • Fewer than 10 hours of labor required for all PII activities, and no fee
– Average labor requirement of 5 hrs (confirmed by PV legal survey, lowest for all European countries)
– Permit requests and incentive application are done online; usually no permit inspection required • Grid upgrade costs for German residential PV systems are paid by Grid Operator (SEPA 2012)
K$J$C$E$D$L$G$H$F$I$JK$
K$ JKK$ CKK$ EKK$ DKK$ LKK$ GKK$
^-8%$)$%N
-=)]-"
=3<,.38%$$)
S(3,+(.&%$)45)3938(#3),.38%$$(+),.)?@AA):f;)
^-8%$)4BB)g%N-=)h-"=3))4(=)S(37-.+(.8)
KRKJ$
KRKKJ$KRKKJ$
KRKC$
KRKK$
lKRKK$
lKRKJ$
lKRKC$
lKRKE$
lKRKD$
3*(8"19$CKJJ$
>?@A
A<1)
a*(8@#$>**$
.1)*1OP*$0VV?@)"O&1$
Q&8V?*O1A$.1#*()&11*)O&1$
Q&8V?*O1A$a*(8@#$.1+V*)O&1$
%'b8@|1A$a*(8@#$a")T"A*$
a(*V"(@1A$a*(8@#$a")T"A*$
>@R@W)
*'(=%P()4BB)!-383)
30

FRL$
JRH$
ERC$
KRE$
DRE$
KRC$
CRI$
ERK$
ERH$
KRKG$
KRKJ$
KRKE$
KRKK$
KRKE$
KRKK$
KRKJ$
KRKC$
KRKC$
KRKK$
KRKI$
KRKK$
$Qa>$=CKJCB$$k1?9$V*(8@|1A$?"b&($O8*$$JDRLY$
%'1e'1$=CKJJB$lRCF6U$
$Qa>$=CKJCB$$k1?9$V*(8@|1A$?"b&($)&+#+$
=*W)?'2@1A$X**B$$$lRJJ6U$
KRKK$
KRKL$
KRJK$
KRJL$
KRCK$
KRCL$
KREK$
K$
L$
JK$
JL$
CK$
CL$
-%0$CKJK$qY6+9+#*8r$
3*(8"19$CKJJ$qY6+9+#*8r$
-%0$CKJK$ql6Ur$ 3*(8"19$CKJJ$ql6Ur$
>?@AA<1)]<3938(#) 4BB)=(M",=(#(.83)
a*(8@#$>**$
.1)*1OP*$0VV?@)"O&1$
Q&8V?*O1A$.1#*()&11*)O&1$
Q&8V?*O1A$a*(8@#$.1+V*)O&1$
%'b8@|1A$a*(8@#$a")T"A*$
a(*V"(@1A$a*(8@#$a")T"A*$
>R?Z<1)
>R@W<1)
??R\])
eR?])
an$3(@2$=CKJCB$$DRHY$
PII Costs Account for Roughly $0.2/W of the German-U.S. PV Price Gap
Differences due to both PII labor costs and permit fee • PII labor costs are $0.12/W lower in
Germany* • Remainder of gap ($0.09/W) is
associated with permit fee (assuming an average of $430 per system in the U.S.)
• Langen (2010) estimates PII costs for the US at $.80/W, and Germany at $.10/W
• PV Grid (2012) reports 2.5h for interconnection, 1.5h for interconnection permits and .7h for other legal-administrative processes in Germany
• SunRun (2011) estimate of $.50/W in the U.S. includes sales & marketing costs & variations in building requirements
31 J)Q-8(O$>'??9Nb'(2*1*2$?"b&($("#*+$"++'8VO&1+,$HKi$2*+@A1$*1A@1**($"12$EKi$"28@1@+#("OP*$?"b&(7$"P*("A@1A$lDJ6Y($X&($3*(8"19$=b"+*2$&1$+'(P*9$_'*+O&1+B$P+R$lCG6Y($X&($#Y*$-R%R$=b"+*2$&1$e%$5*"1+$2"#"B$
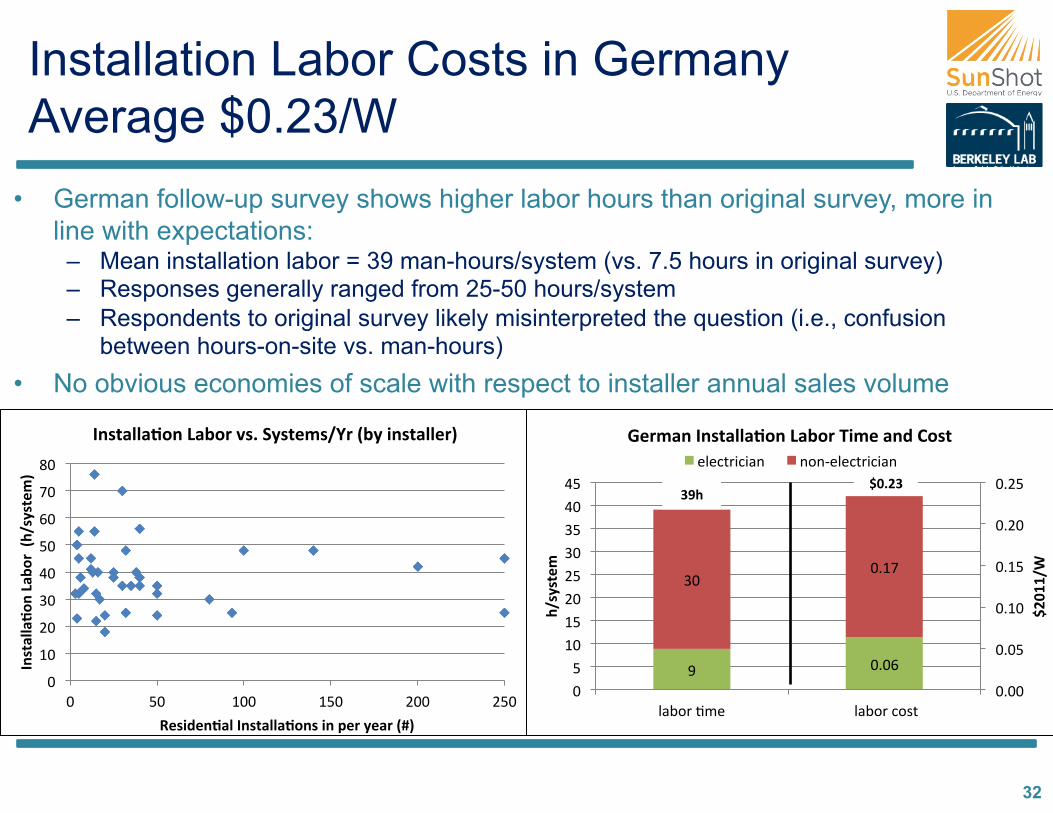
Installation Labor Costs in Germany Average $0.23/W
32
• German follow-up survey shows higher labor hours than original survey, more in line with expectations: – Mean installation labor = 39 man-hours/system (vs. 7.5 hours in original survey) – Responses generally ranged from 25-50 hours/system – Respondents to original survey likely misinterpreted the question (i.e., confusion
between hours-on-site vs. man-hours)
• No obvious economies of scale with respect to installer annual sales volume
K$
JK$
CK$
EK$
DK$
LK$
GK$
HK$
FK$
K$ LK$ JKK$ JLK$ CKK$ CLK$
B.38%$$%&-
.)g%N-
=)):]<3938(#;)
S(3,+(.&%$)B.38%$$%&-.3),.)7(=)9(%=):f;)
B.38%$$%&-.)g%N-=)'3R)G938(#3<`=):N9),.38%$$(=;)
I$
EK$
KRKG$
KRJH$
KRKK$
KRKL$
KRJK$
KRJL$
KRCK$
KRCL$
K$L$
JK$JL$CK$CL$EK$EL$DK$DL$
?"b&($O8*$ $?"b&($)&+#$
>?@A
A<1)
]<3938(#
)
U(=#%.)B.38%$$%&-.)g%N-=)^,#()%.+)!-38)*?*)#(@)@"1$ 1&1N*?*)#(@)@"1$
>@R?W)WV])

German Installations Are Faster and Cheaper than in the United States
• Updated survey results show a sizable gap between the United States and Germany in installation times (36h)
• Installers in Germany rely even more on (cheaper) non-electrician installation labor than in the US (77% vs. 65%)
33
CG$
I$
DI$
EK$KRCG$
KRKG$
KREE$
KRJH$
:;/>$$=CKJCB$CDY$
an$3(@2$$=CKJCB$CGY$
/'a!$$=CKJCB$
$lKRDC6U$
K$
KRJ$
KRC$
KRE$
KRD$
KRL$
KRG$
KRH$
K$
JK$
CK$
EK$
DK$
LK$
GK$
HK$
FK$
-%0$CKJK$qY6+9+#*8r$
3*(8"19$CKJJ$qY6+9+#*8r$
-%0$CKJK$ql6Ur$ 3*(8"19$CKJJ$ql6Ur$
>?@A
A<1)
]<3938(#
)
B.38%$$%&-.)g%N-=)*?*)#(@)@"1$@1+#"??"O&1$?"b&($ 1&1N*?*)#(@)@"1$@1+#"??"O&1$?"b&($
>@ReV)
de])
WV])
>@R?W)

Differences in Installation Labor Partly Stem from Different Mounting Practices
• Large majority of German installers either never or rarely install systems requiring roof-penetration
• Roof penetration is much more common in the United States, due to differences in roofing materials and higher wind speeds in some regions
• Follow-up survey also asked about the usage of roof-to-inverter conduits for wiring and about the location of grounding for German residential PV
– But no clear trend that might explain differences in labor requirements compared to U.S. systems
34
Ki$
JKi$
CKi$
EKi$
DKi$
LKi$
GKi$
HKi$
FKi$
IKi$
JKKi$
K$ L$ JK$ JL$ CK$ CL$ EK$ EL$ DK$ DL$,.38%$$(=)BK)
U(=#%.)B.38%$$(=3O)4(=6(.8%P()-C)3938(#3)7(=),.38%$$(=)=(M",=,.P)=--i-7)7(.(8=%&-.))

Nationwide Sales Tax Exemptions in Germany Further Reduce Soft Costs • Survey respondents confirmed that German residential PV systems are
effectively exempt from revenue taxes/ sales taxes/ value added taxes – Regular tax rate of 19% can be exempted either via “Kleinunternehmer”
or “Vorsteuererstattungs” clause
35
• In the United States, 23 states assess sales tax on residential PV systems, usually 4-8% of system prices, as do many local governments
• Given the spatial distribution of PV systems, and accounting for sales tax exemptions in some states, state and local sales taxes added $0.21/W to the median price of US residential PV in 2011

PII, Customer Acquisition, and Installation Labor Total Just $0.33/W for Residential PV in Germany
For residential PV in Germany, PII, customer acquisition, and installation labor are estimated to represent 53% of all non-hardware costs and 11% of the total system price.
36
h"(2`"(*,$lCREF6U$
;&1N$h"(2`"(*,$lKRGC6U$
lKRCE$
lKRKH$
lKRKE$
lKRCI$
Ki$
JKi$
CKi$
EKi$
DKi$
LKi$
GKi$
HKi$
FKi$
IKi$
JKKi$
&P*(Y*"2Z$V(&\#$"12$&#Y*($(*+@2'"?$+&w$)&+#+$
+"?*+$#"W$=lKB$
V*(8@|1A$X**$=lKB$
a..$?"b&($)&+#$
)'+#&8*($")_'@+@O&1$"12$+9+#*8$2*+@A1$
@1+#"??"O&1$?"b&($

!"#$*:(skP*(Y*"2Z$V(&\#Z$"12$&#Y*($(*+@2'"?$+&w$)&+#+t$@+$)"?)'?"#*2$"+$#Y*$2@d*(*1)*$b*#`**1$#&#"?$+&w$)&+#+$"12$#Y*$+'8$&X$#Y*$@12@P@2'"?$b'+@1*++$V(&)*++$)&+#+$_'"1O\*2$#Y(&'AY$#Y*$3*(8"1$"12$-R%R$@1+#"??*($+'(P*9+R$$4Y@+$(*+@2'"?$#*(8$@1)?'2*+$+')Y$@#*8+$"+$V(&V*(#9N(*?"#*2$*WV*1+*+$=(*1#Z$'O?@O*+Z$*#)RBZ$@1P*1#&(9N(*?"#*2$)&+#+Z$"22@O&1"?$@1+'("1)*+$"12$X**+Z$"12$A*1*("?$"28@1@+#("OP*$)&+#+R$k'($*+O8"#*$&X$lJRGJ6U$X&($s&P*(Y*"2Z$V(&\#$"12$(*+@2'"?$+&w$)&+#+t$@+$A*1*("??9$)&1+@+#*1#$`@#Y$#Y*$\12@1A+$&X$Qa>$=CKJCBR$e*+*"()Y$b9$U&&2?"`1$0++&)@"#*+$=CKJCB$+'AA*+#+$#Y"#$V(&\#$8"(A@1+$X&($8"19$-R%R$@1+#"??*(+$"(*$?&`$&($1&1N*W@+#*1#Z$@8V?9@1A$#Y"#$#Y*$2@d*(*1)*+$+Y&`1$X&($#Y*$s&P*(Y*"2Z$V(&\#Z$"12$&#Y*($(*+@2'"?$+&w$)&+#+t$)"#*A&(9$@+$1&#$#Y*$(*+'?#$&X$8')Y$Y@AY*($V(&\#$8"(A@1+$@1$#Y*$-R%R$
Summary of Soft Cost Differences for Residential PV in the U.S. and Germany
37
Comparison of Soft Costs for Residential PV in Germany and the U.S. (customer-owned systems)
KRED$
KRJJ$KRCD$
KRJL$KRKI$
KRLI$
KRCJ$
JRGJ$
KRKC$ KRKJ$ KRKD$ KRKE$ KRKK$
KRCE$
KRKK$
KRCI$
K$
KRC$
KRD$
KRG$
KRF$
J$
JRC$
JRD$
JRG$
JRF$
)'+#&8*($")_'@+O&1,$8"(T*O1A$x$
"2P*(O+*8*1#$
)'+#&8*($")_'@+@O&1,$
+9+#*8$2*+@A1$
)'+#&8*($")_'@+@O&1,$&#Y*($
a..$?"b&($)&+#$ V*(8@|1A$X**$ @1+#"??"O&1$?"b&($ +"?*+$#"W$ &P*(Y*"2Z$V(&\#Z$"12$&#Y*($
(*+@2'"?$+&w$)&+#+$
>)?@
AA)<)1
)
-%0$ 3*(8"19$

KRKJ$KRCC$ KRCD$
KREG$KRGC$
KRJC$ KRKI$ KRCJ$
JREC$
ERKK$
KRKK$
JRKK$
CRKK$
ERKK$
DRKK$
LRKK$
GRKK$
HRKK$
3*(8"1$+9+#*8$
8&2'?*$ @1P*(#*($ &#Y*($Y"(2`"(*$
@1+#"??"O&1$?"b&($
)'+#&8*($")_'@+@O&1$"12$+9+#*8$2*+@A1$
a..$ V*(8@|1A$X**$ +"?*+$#"W$ &P*(Y*"2Z$V(&\#$"12$
&#Y*($(*+@2'"?$)&+#+$
>)?@
AA<1
)
Summary of Soft Cost Differences for Residential PV in the U.S. and Germany
Q&+#$2@d*(*1)*$&X$lERJI6
U$
Build-Up of Cost Differential Between German and U.S. Residential PV (customer-owned systems)
!"#$*:(skP*(Y*"2Z$V(&\#Z$"12$&#Y*($(*+@2'"?$+&w$)&+#+t$@+$)"?)'?"#*2$"+$#Y*$2@d*(*1)*$b*#`**1$#&#"?$+&w$)&+#+$"12$#Y*$+'8$&X$#Y*$@12@P@2'"?$b'+@1*++$V(&)*++$)&+#+$_'"1O\*2$#Y(&'AY$#Y*$3*(8"1$"12$-R%R$@1+#"??*($+'(P*9+R$$4Y@+$(*+@2'"?$#*(8$@1)?'2*+$+')Y$@#*8+$"+$V(&V*(#9N(*?"#*2$*WV*1+*+$=(*1#Z$'O?@O*+Z$*#)RBZ$@1P*1#&(9N(*?"#*2$)&+#+Z$"22@O&1"?$@1+'("1)*+$"12$X**+Z$"12$A*1*("?$"28@1@+#("OP*$)&+#+R$k'($*+O8"#*$&X$lJRGJ6U$X&($s&P*(Y*"2Z$V(&\#$"12$(*+@2'"?$+&w$)&+#+t$@+$A*1*("??9$)&1+@+#*1#$`@#Y$#Y*$\12@1A+$&X$Qa>$=CKJCBR$e*+*"()Y$b9$U&&2?"`1$0++&)@"#*+$=CKJCB$+'AA*+#+$#Y"#$V(&\#$8"(A@1+$X&($8"19$-R%R$@1+#"??*(+$"(*$?&`$&($1&1N*W@+#*1#Z$@8V?9@1A$#Y"#$#Y*$2@d*(*1)*+$+Y&`1$X&($#Y*$s&P*(Y*"2Z$V(&\#Z$"12$&#Y*($(*+@2'"?$+&w$)&+#+t$)"#*A&(9$@+$1&#$#Y*$(*+'?#$&X$8')Y$Y@AY*($V(&\#$8"(A@1+$@1$#Y*$-R%R$ 38

%*)&12"(9$01"?9+*+$
WV)
Questions Explored through Secondary Data Sources
1. To what extent do shorter project development times in Germany contribute to the apparent price gap (i.e., quicker pass-through of module price declines)?
2. Are residential PV systems larger in Germany, leading to potential price differences due to economies of scale at the system level?
3. Are a larger percentage of German systems comprised of Chinese modules than in the U.S.?
40 !"#$*#".#*8$C$"22+$1&#$#&$#Y*$2@d*(*1)*+$@1$b'+@1*++$V(&)*++$)&+#+$V(*+*1#*2$V(*P@&'+?9Z$b'#$Y*?V+$*WV?"@1@1A$#Y&+*$2@d*(*1)*+$=*RAR$?"(A*($+9+#*8$+@<*+$@1$3*(8"19$V"(#?9$*WV?"@1$`Y9$8"(T*O1A$)&+#+$@1$l6U$"(*$?&`*(BR$
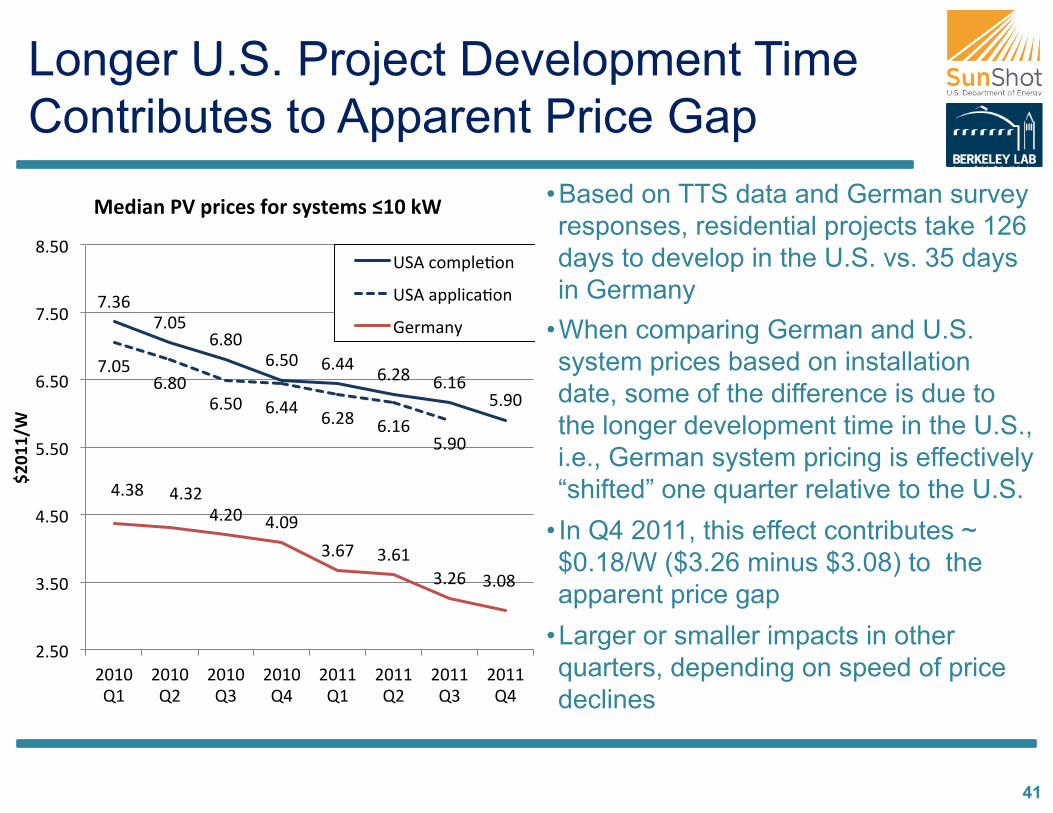
Longer U.S. Project Development Time Contributes to Apparent Price Gap
41
• Based on TTS data and German survey responses, residential projects take 126 days to develop in the U.S. vs. 35 days in Germany
• When comparing German and U.S. system prices based on installation date, some of the difference is due to the longer development time in the U.S., i.e., German system pricing is effectively “shifted” one quarter relative to the U.S.
• In Q4 2011, this effect contributes ~$0.18/W ($3.26 minus $3.08) to the apparent price gap
• Larger or smaller impacts in other quarters, depending on speed of price declines
HREG$HRKL$
GRFK$GRLK$ GRDD$ GRCF$ GRJG$
LRIK$
HRKL$GRFK$
GRLK$ GRDD$ GRCF$ GRJG$LRIK$
DREF$ DREC$DRCK$ DRKI$
ERGH$ ERGJ$ERCG$ ERKF$
CRLK$
ERLK$
DRLK$
LRLK$
GRLK$
HRLK$
FRLK$
CKJK$MJ$
CKJK$MC$
CKJK$ME$
CKJK$MD$
CKJJ$MJ$
CKJJ$MC$
CKJJ$ME$
CKJJ$MD$
>?@A
A<1)
0(+,%.)45)7=,6(3)C-=)3938(#3)HA@)I1)
-%0$)&8V?*O&1$
-%0$"VV?@)"O&1$
3*(8"19$

German Residential Systems Are Generally Larger Than U.S. Systems
42 !"#$*:"-%$2"#"$b"+*2$&1$44%7$3*(8"1$2"#"$(*j*)#+$"??$A(@2N)&11*)#*2$an$+9+#*8+$=@1$X(&1#$x$b*Y@12$#Y*$8*#*(B$$"+$)&??*)#*2$b9$#Y*$>*2*("?$3(@2$0A*1)9$=:'12*+1*#<"A*1#'(Z$:;*#<0B$
Ki$
Li$
JKi$
JLi$
CKi$
KNJTU$ JNCTU$ CNETU$ ENDTU$ DNLTU$ LNGTU$ GNHTU$ HNFTU$ FNITU$ INJKTU$
4(=6(.
8)-C)G
938(#3)
G,a()K,38=,N"&-.)-C)45)G938(#3)HA@I1)B.38%$$(+),.)?@AA)
-%0$ 3*(8"19$
TG)#(+,%.O)ZRVeI1)
U(=#%.)#(+,%.O)\R[I1)
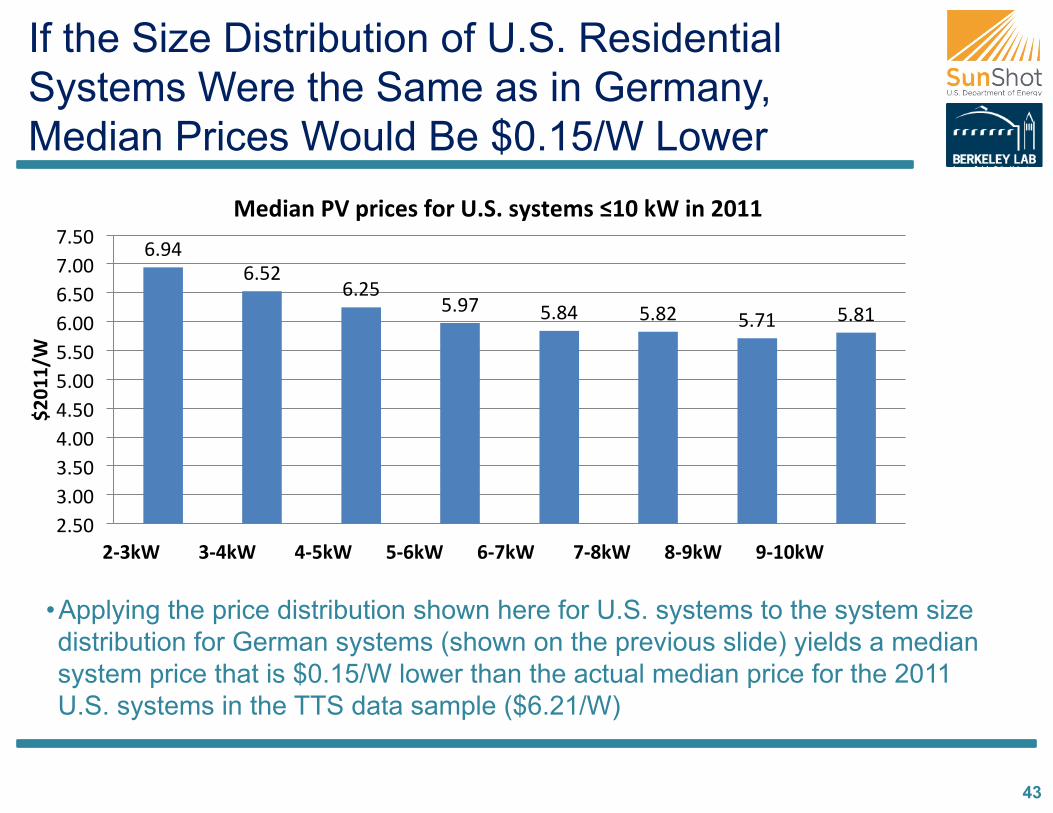
If the Size Distribution of U.S. Residential Systems Were the Same as in Germany, Median Prices Would Be $0.15/W Lower
43
GRID$GRLC$
GRCL$LRIH$ LRFD$ LRFC$ LRHJ$ LRFJ$
CRLK$ERKK$ERLK$DRKK$DRLK$LRKK$LRLK$GRKK$GRLK$HRKK$HRLK$
>?@A
A<1)
0(+,%.)45)7=,6(3)C-=)TRGR)3938(#3)HA@)I1),.)?@AA)
$$$$$$$$$$$$?DWI1$$$$$$$$WDZI1$$$$$$$$ZDeI1$$$$$$$eD\I1$$$$$$$\DdI1$$$$$$$$dD[I1$$$$$$$[DVI1$$$$$$$VDA@I1)$$$$$$$$$$$$1mEHIJ$$$$$$$1mEGEL$$$$$$1mDKDK$$$$$$1mDKKC$$$$$1mCHJI$$$$$1mCJGK$$$$$$1mJHKD$$$$$$1mJGJI$
• Applying the price distribution shown here for U.S. systems to the system size distribution for German systems (shown on the previous slide) yields a median system price that is $0.15/W lower than the actual median price for the 2011 U.S. systems in the TTS data sample ($6.21/W)

Installer Purchase Prices for Chinese Modules Are Lower than for Non-Chinese Modules in Germany
!"#"$+&'()*,$/'a!$
KRKK$
KRLK$
JRKK$
JRLK$
CRKK$
CRLK$
ERKK$
MJ$CKJK$ MC$CKJK$ ME$CKJK$ MD$CKJK$ MJ$CKJJ$ MC$CKJJ$ ME$CKJJ$ MD$CKJJ$
>)?@
AA<1
)
0-+"$()7"=6]%3()7=,6()C-=)U(=#%.),.38%$$(=3)
QY@1*+*$8&2'?*+$ 1&1NQY@1*+*$8&2'?*+$
44

The Price Gap Is Not Due to Differences in Chinese Module Market Share
45
Share of module manufacturers by country of headquarters for customer-owned !10kW systems in 2011
CLi$
CDi$CCi$
CKi$
Fi$
TG*)1mCKZHGJ$
QY@1"x4"@`"1$
-%0$
f"V"1$
3*(8"19$
e*+#$&X$#Y*$U&(?2$
LEi$
CHi$
Gi$
Li$
Ii$
U(=#%.9)1mEZKDJ$
Chinese modules are cheaper ($1.61/W vs. $2.01/W in 2011), but…
Among customer owned systems !10 kW, the U.S. and Germany had similar shares of Chinese modules*
Thus differences in Chinese module market share do not contribute significantly to the German-U.S. price gap.
!"#"$%&'()*+,$44%Z$/'a!$$$
!"#$:(4Y@(2NV"(#9$&`1*2$+9+#*8+$@1$#Y*$-R%R$Y"P*$"$Y@AY*($+Y"(*$&X$QY@1*+*$8&2'?*+$=*RAR$:;/>$CKJCBZ$b'#$X&($#Y*$V'(V&+*$&X$"++*++@1A$#Y*$V(@)*$A"V$@1$#Y@+$"1"?9+@+Z$`*$X&)'+$+V*)@\)"??9$&1$)'+#&8*(N&`1*2$+9+#*8+R$$
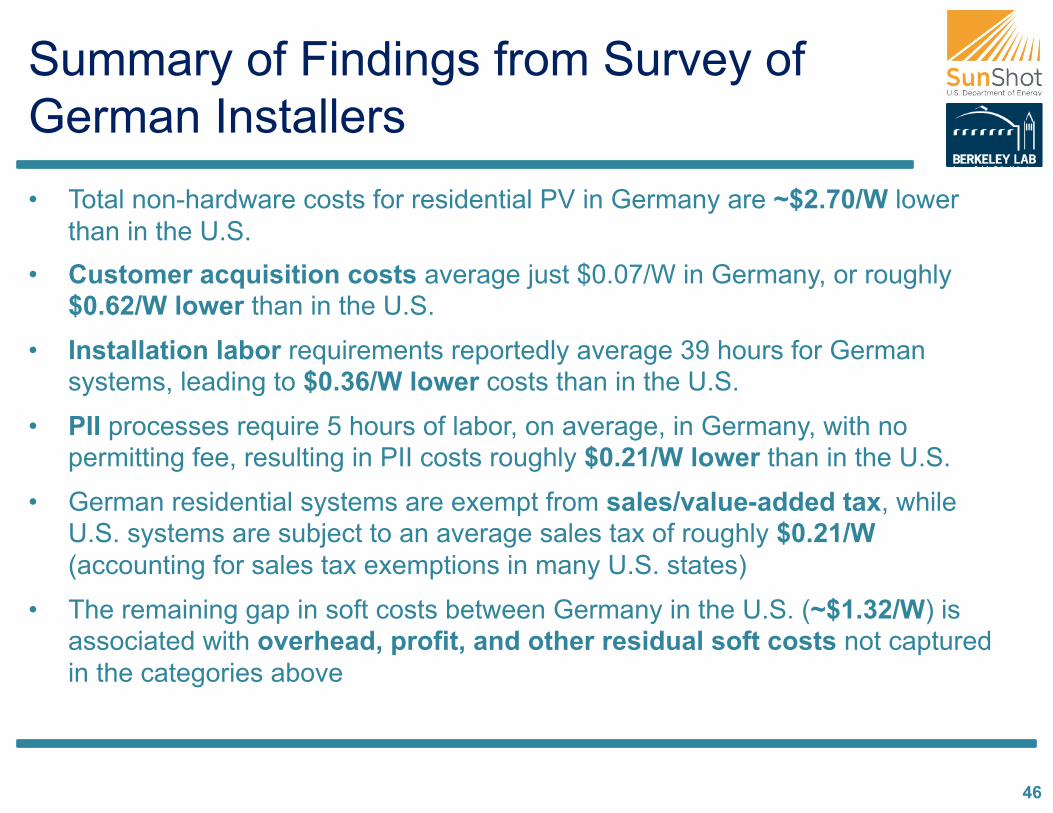
Summary of Findings from Survey of German Installers • Total non-hardware costs for residential PV in Germany are ~$2.70/W lower
than in the U.S. • Customer acquisition costs average just $0.07/W in Germany, or roughly
$0.62/W lower than in the U.S.
• Installation labor requirements reportedly average 39 hours for German systems, leading to $0.36/W lower costs than in the U.S.
• PII processes require 5 hours of labor, on average, in Germany, with no permitting fee, resulting in PII costs roughly $0.21/W lower than in the U.S.
• German residential systems are exempt from sales/value-added tax, while U.S. systems are subject to an average sales tax of roughly $0.21/W (accounting for sales tax exemptions in many U.S. states)
• The remaining gap in soft costs between Germany in the U.S. (~$1.32/W) is associated with overhead, profit, and other residual soft costs not captured in the categories above
46

Summary of Findings from Secondary Analysis
• Shorter project development times in Germany contribute to apparent price gap (e.g., ~$0.2/W effect for Q4 2011 installations)
• Residential PV systems are larger in Germany (partly due to differences in policy design), benefitting from economies of scale ($0.15/W effect) • Not additive to the differences in soft costs presented previously, but rather
helps to explain those differences (e.g. larger system sizes in Germany are partly why marketing costs, on a per Watt basis, are lower)
• Market share of Chinese modules is similar for customer-owned residential systems in Germany and U.S., and thus does not contribute to price gap
47

Possible Market Drivers for Soft Cost Differential between Germany and U.S. (1) • Greater market-wide deployment and longevity in Germany
allow for cost reductions based on installer experience
• Lower market fragmentation (one contiguous market and regulatory framework) and higher population density in Germany allow for lower overhead, transport, and supply chain costs. – In the US, at least 50 markets exist – many more when considering local
permitting-inspection-interconnection rules.
• Larger and more concentrated markets in Germany (as well as cultural differences with the US) facilitate bandwagon effects and customer acquisition by word of mouth, leading to lower customer acquisition costs
- 48 -

• Less onerous permitting-inspection-interconnection processes (e.g. online registration, no permitting fee or inspection by county officials) and installation practices (e.g. easier grounding, roof penetration) in Germany
• Simpler, more certain and more lasting value proposition in Germany allow for both lower customer acquisition + overhead costs, and larger average system sizes – FiT guaranteed for 20 years in Germany vs. varying value of net metering +
state incentives + federal tax incentives in the US
• Regular declining FiT and high competition among installers yield pressure for price reductions and lower margins in Germany, while larger incentives, opportunities for higher value-based pricing, and less installer competition allow for higher prices and margins in US
- 49 -
Possible Market Drivers for Soft Cost Differential between Germany and U.S. (2)
Policy Implications
*)$%=P()%.+)+"=%N$()#%=I(8)3,a($
*)6-.6(.8=%8(+)#%=I(8)!)#,.,#,a()C=%P#(.8%&-.$
*)3,#7$(Y)8=%.37%=(.8Y)6(=8%,.),.6(.&'()38="68"=()<)'%$"()7=-7-3,&-.$
G,#7$(),.8(=6-..(6&-.Y)7(=#,j.PY)%.+),.37(6&-.)=(M",=(#(.83$
S(P"$%=),.6(.&'()+(6$,.(3)8-)+=,'()k)C-$$-F)6-38)=(+"6&-.)
- 50 -
Reducing residential PV prices in the United States may require policies that enable:
Suggestions for Further Research
• Initiate a more refined analysis of overhead costs and margins among installers
• Better understand the pricing decision of installers and competition between installers (i.e., degree of “value-based pricing”)
• Further investigate installation practices and differing regulatory requirements (usage of grounding, roof-penetration and conduits)
• Compare supply-chain margins between the two countries and average prices paid by installers for modules and inverters
• Assess the role of FIT policies in Germany in stimulating price reductions and potential implications for U.S. solar policy
51
Questions?
Download LBNL Electricity Markets & Policy Publications: http://emp.lbl.gov/reports
Joachim Seel, Galen Barbose, Ryan Wiser [email protected] [email protected] [email protected]

>@(+#$3*(8"1$V(@)*+$`*(*$1&(8"?@<*+$X&($CKJJ$}Z$`Y@)Y$`*(*$#Y*1$)&1P*(#*2$#&$l$'+@1A$#Y*$"P*("A*$*W)Y"1A*$("#*$&X$#Y*$9*"($CKJJ$&X$lJREI6}R$$4Y*$"P*("A*$*W)Y"1A*$("#*$@1$CKJC$`"+$lJRCI6}Z$"1$*WV(*++@&1$&X$3*(8"1$+9+#*8$V(@)*+$@1$lCKJC$'+@1A$#Y*$CKJC$"P*("A*$*W)Y"1A*$("#*$`&'?2$#Y'+$b*$"b&'#$Hi$?&`*($#Y"1$#Y*$V(@)*+$*WV(*++*2$@1$lCKJJR$
Appendix: Currency Conversion
53
KRI$
J$
JRJ$
JRC$
JRE$
JRD$
JRL$
JRG$
JRH$
CKKK$
CKKJ$
CKKC$
CKKE$
CKKD$
CKKL$
CKKG$
CKKH$
CKKF$
CKKI$
CKJK$
CKJJ$
CKJC$
B.l%&-.)%.+)cm6]%.P()=%8()C%68-=3)
3*(8"1$@1j"O&1$x$CKJJ$WN("#*$ P"(@"b?*$WN("#*$"12$-%$@1j"O&1$ -%$@1j"O&1$X")#&($ 3*(8"1$@1j"O&1$X")#&($
Bibliography I • Ardani, Kristen. “Non-Hardware BoS Cost for PV Systems Database 2010”. National Renewable Energy
Laboratory (NREL), February 2012. • Darghouth,Naim, Barbose, Galen and Wiser, Ryan. The Impact of Rate Design and Net Metering on the
Bill Savings from Distributed PV for Residential Customers in California. Lawrence Berkeley National Laboratory (LBNL), April 2010.
• Barbose, Galen, Darghouth, Naim, and Wiser, Ryan. Tracking the Sun V- A Historical Summary of Installed Cost of Photovoltaics in the United States from 1998 to 2011. Berkeley, CA: Lawrence Berkeley National Laboratory, November 2012. http://emp.lbl.gov/publications/tracking-sun-v-historical-summary-installed-price-photovoltaics-united-states-1998-2011.
• Board of Governors of the Federal Reserve System. “Foreign Exchange Rates G.5”, January 8, 2012. http://www.federalreserve.gov/releases/g5/.
• Bolcar, Katie and Ardani, Kristen. National Survey Report of PV Power Applications in the US 2010. Exchange and Dissemination of PV Power Systems. International Energy Agency (IEA), 2011.
• Bromley, Hugh. California Versus German Solar Prices: Same Dope, Twice as High. Bloomberg New Energy Finance (BNEF), February 2012.
• Brooks, Bill. Expedited Permit Process for PV System - A Standardized Process for the Review of Small-scale PV Systems. Solar America Board for Codes and Standards, October 2011.
• Bundesnetzagentur (BNetzA). “Monthly PV System Interconnection Announcements 2009-2011”, 2012. http://www.bundesnetzagentur.de/DE/Sachgebiete/ElektrizitaetGas/AnzeigenMitteilungen/MeldungPhotovoltaikanlagen/MeldungPhotovoltaikanlagen_node.html.
• Bundesverband Solarwirtschaft e. V. (BSW-Solar). Statistische Zahlen Der Deutschen Solarstrombranche (PV). Berlin, 2012. http://www.solarwirtschaft.de/fileadmin/media/pdf/
54
Bibliography II • Clean Power Finance, Tong, James. Nationwide Analysis of Solar Permitting and the Implications for Soft
Costs. December 2012. http://www.solarpermit.org/CPF-DOE%20Permitting%20Study_Dec2012_Final.pdf
• DSIRE. “Solar Sales Tax Incentives”. Database of State Incentives for Renewables and Efficiency, n.d. http://www.dsireusa.org/solar/solarpolicyguide/?id=12.
• EuPD. “Database of Installer Offer Prices for German Residential PV Systems 2006-2011”, 2012.
• German Statistical Federal Agency. “Monthly Price Indices for Cost of Living and Index of Retail Prices 1991-2011”, January 8, 2012. www.destatis.de.
• Gipe, Paul. “Rate of Return Calculation of Solar PV Using Excel Rate Function”, April 2007. http://www.wind-works.org/Solar/RateofReturnCalculationofSolarPVUsingIRATEFunction.html
• GTM Research, and Solar Energy Industries Association (SEIA). US Solar Energy Trade Assessment 2011, November 2011.
• GTM Research. U.S. Solar Market Insight Report 2010. Solar Energy Industry Association (SEIA), 2011.
• ———. U.S. Solar Market Insight Report 2011. Solar Energy Industry Association (SEIA), 2012.
• ———. U.S. Solar Market Insight Report Q3 2012. Solar Energy Industry Association (SEIA), 2012.
• Goodrich, Alan, James, Ted and Woodhouse, Michael. Residential, Commercial and Utility-Scale PV System Prices in the US: Current Drivers and Cost-Reduction Opportunities. National Renewable Energy Laboratory (NREL), February 2012.
• Haas, Reinhard. Progress in Markets for Grid-Connected PV Systems in the built Environment. Progress in Photovoltaics: Research and Applications. 2004(12), pp.427-440.
• IHS Emerging Energy Research. Europe Solar PV, Markets and Strategies 2011-2025, September 2011.
55

Bibliography III
• International Weather for Energy Calculations (IWEC). “Insolation Rates for Hamburg, Germany”. U.S. Department of Energy: EnergyPlus Energy Simulation Software, December 2011. http://apps1.eere.energy.gov/buildings/energyplus/cfm/weather_data3.cfm/region=6_europe_wmo_region_6/country=DEU/cname=Germany.
• ———. “Insolation Rates for Munich, Germany”. http://apps1.eere.energy.gov/buildings/energyplus/cfm/weather_data3.cfm/region=6_europe_wmo_region_6/country=DEU/cname=Germany.
• IRENA. Renewable Energy - Power Sector Costing Study. International Renewable Energy Agency (IRENA), 2011.
• Junginger, Martin, van Sark, Wilfried and Faaji, André. Technological Learning in the Energy Sector. Northampton, Massachusetts, USA: Edward Elgar Publishing, Inc., 2010.
• King, Alison and Jolly, Margaret. Combining Permitting, Interconnection, and Incentive Applications: A New York City Case Study. NYC Solar City, 2011. www.nycsolarcity.com.
• Krämer-Eis, Helmut. Perspektiven Erneuerbarer Energien Teil 1: Photovoltaik. KfW Beiträge Zur Mittelstands- Und Strukturpolitik 12. Frankfurt am Main: Kreditanstalt für Wiederaufbau (KfW), November 1999.
• Langen, Christian. “Complexity cost and economies of scale, why residential customers in Germany pay 25% for a PV system than US customers”, SolarPower International 2010, Sovello AG
• Maycock, Paul and Bower, Ward. National Survey Report of PV Power Applications in the US 2002. Exchange and Dissemination of PV Power Systems. International Energy Agency (IEA), 2003.
56

Bibliography IV
• Maycock, Paul, Pedigo, Susannah and Bower, Ward. National Survey Report of PV Power Applications in the US 2006. Exchange and Dissemination of PV Power Systems. International Energy Agency (IEA), 2007.
• Maycock, Paul, Poole, Lauren and Bower, Ward. National Survey Report of PV Power Applications in the US 2007. Exchange and Dissemination of PV Power Systems. International Energy Agency (IEA), 2008.
• McFreely, David. Study of Solar Permitting and Inspection- A Study of Issues with Existing Procedures and the Need for an Industry Standard. San Jose: SolarTech, September 2011.
• Mills, Carl, and Newick, Kurt. Solar Electric Permit Fees in Northern California. Sierra Club, July 2011.
• Mints, Paula. “Capacity, Prices, and All That Solar Jazz”. Renewable Energy World, March 2011. http://www.renewableenergyworld.com/rea/news/article/2011/03/capacity--prices-.
• National Renewable Energy Laboratory (NREL). National Survey Report of PV Power Applications in the US 2008. Exchange and Dissemination of PV Power Systems. International Energy Agency (IEA), 2009.
• ———. National Survey Report of PV Power Applications in the US 2009. Exchange and Dissemination of PV Power Systems. International Energy Agency (IEA), 2010.
• ———. “Photovoltaic Solar Resource: United States and Germany”. May 2008. http://www.seia.org/galleries/default-file/PVMap_USandGermany.pdf.
• ———. System Advisor Model (SAM), n.d. https://sam.nrel.gov/.
• Oppermann, Klaus. Perspektiven Erneuerbarer Energien Teil 4: Fördergebnisse Des 100.000 Dächer-Solarstrom-Programms- Eine Zwischenbilanz. KfW Beiträge Zur Mittelstands- Und Strukturpolitik 28. Frankfurt am Main: Kreditanstalt für Wiederaufbau (KfW), August 2002.
57

Bibliography V • Oppermann, Klaus. Perspektiven Erneuerbarer Energien: Das 100.000 Dächer-Solarstrom-Programm: Eine
Schlussbilanz. KfW Beiträge Zur Mittelstands- Und Strukturpolitik 31. Frankfurt am Main: Kreditanstalt für Wiederaufbau (KfW), November 2004.
• Payne, Doug. “Overcoming US Market Barriers to PV” presented at the Intersolar, San Francisco, July 13, 2011.
• PHOTON Consulting, LLC. The Next Wave. Solar Annual, 2012.
• ———. The True Cost of Solar Power 2011, The Pressure Is On, 2011.
• Pitt, Damian. Taking the Red Tape Out of Green Power - How to Overcome Permitting Obstacles to Small-scale Distributed Renewable Energy. Network for New Energy Choices, 2008.
• Podlowski, Lars. “Applying German Design Practices in the US”. Solon, 2008.
• PV Legal. Reduction of Administrative Barriers for PV Systems in Germany at the National Level. Bundesverband der Solarwirtschaft (BSW), 2011. http://www.pvlegal.eu/results/advisory-papers/germany.html
• PV Grid. Time Estimates For Residential PV Systems in Germany. Bundesverband der Solarwirtschaft (BSW), 2012. http://www.pvgrid.eu/database/pvgrid/germany/national-profile-6/residential-systems/2404/standard-subsegment-1.html
• PvXchange. “pvX-Spotmarket Price Index for Modules”, December 1, 2011. http://www.pvxchange.com.
• Reichmuth, Matthias. Vorbereitung Und Begleitung Des EEG Erfahrungsberichtes 2011- IIc- Solare Strahlungsenergie. Berlin: Leipziger Institut für Energie, June 2011.
• Renewable Analytics. “Database of Survey Results 2010,2011”, February 2012.
• Schaeffer, Gerrit Jan, Erik Alsema, Ad Seebregts, Luuk Beurskens, Hugo de Moor, Wilfried van Sark, Michael Durstewitz, et al. Learning from the Sun. Energy Research Centre of the Netherlands (ECN), August 2004.
58

Bibliography VI • Solar Electric Power Association (SEPA). Fact Finding Mission to Germany- Can Germany count on solar. September 2012
• Statistisches Bundesamt. “Für 2011 Wird Mit Einer Leichten Bevölkerungszunahme Gerechnet”, January 13, 2012. https://www.destatis.de/DE/PresseService/Presse/Pressemitteilungen/2012/01/PD12_014_12411.html;jsessionid=6DFB56EB33FF754CAC381C7CC029C18D.cae2.
• Stubenrauch, Frank. National Survey Report of PV Power Applications in Germany 2002. International Energy Agency (IEA), 2003.
• SunRun, Sprague, Ethan. The Impact of Local Permitting on the Cost of Solar Power. January 2011. www.sunrunhome.com/permitting.
• Tweedie, A. and Dorris, E.. Comparing Germany’s and California’s Interconnection Processes for PV Systems. National Renewable Energy Laboratory (NREL), July 2011.
• Tepper, Marco. “Statistical Data of the German Solar Electric Industry (PV)”. Bundesverband der Solarwirtschaft (BSW), April 1, 2012. http://www.solarwirtschaft.de/fileadmin/media/pdf/bsw_solar_fakten_pv.pdf.
• U.S. Census Bureau, Population Division. “Annual Estimates of the Population for the United States, Regions, States, and Puerto Rico: April 1, 2010 to July 1, 2011 (NST-EST2011-01)”, December 2011.
• Wissing, Lothar. National Survey Report of PV Power Applications in Germany 2006. Exchange and Dissemination of PV Power Systems. International Energy Agency (IEA), May 2006.
• ———. National Survey Report of PV Power Applications in Germany 2008 Version 2. Exchange and Dissemination of PV Power Systems. International Energy Agency (IEA), May 2009.
• ———. National Survey Report of PV Power Applications in Germany 2010. Exchange and Dissemination of PV Power Systems. International Energy Agency (IEA), May 2011.
• Woodlawn Associates. The Economics of Residential Solar Installation. September 2012, http://www.woodlawnassociates.com/economics-solar-installation/.
59