An analysis of residential PV system price differences ... · An analysis of residential PV system...
11
An analysis of residential PV system price differences between the United States and Germany Joachim Seel a,b,n , Galen L. Barbose a , Ryan H. Wiser a a Lawrence Berkeley National Laboratory, Berkeley, United States b University of California, Berkeley, United States HIGHLIGHTS Residential PV system prices are twice as high in the USA than in Germany in 2012. Different cumulative national PV market sizes explain only 35% of price gap. Installer surveys show that price differences stem from non-module and soft costs. Largest cost differences stem from customer acquisition and installation labor. Incentives in the US are less effective in driving and following cost reductions. article info Article history: Received 11 October 2013 Received in revised form 12 February 2014 Accepted 13 February 2014 Available online 11 March 2014 Keywords: Photovoltaics Soft costs System pricing abstract Residential photovoltaic (PV) systems were twice as expensive in the United States as in Germany (median of $5.29/W vs. $2.59/W) in 2012. This price discrepancy stems primarily from differences in non- hardware or “soft” costs between the two countries, which can only in part be explained by differences in cumulative market size and associated learning. A survey of German PV installers was deployed to collect granular data on PV soft costs in Germany, and the results are compared to those of a similar survey of U.S. PV installers. Non-module hardware costs and all analyzed soft costs are lower in Germany, especially for customer acquisition, installation labor, and profit/overhead costs, but also for expenses related to permitting, interconnection, and inspection procedures. Additional costs occur in the United States due to state and local sales taxes, smaller average system sizes, and longer project-development times. To reduce the identified additional costs of residential PV systems, the United States could introduce policies that enable a robust and lasting market while minimizing market fragmentation. Regularly declining incentives offering a transparent and certain value proposition—combined with simple interconnection, permitting, and inspection requirements—might help accelerate PV cost reductions in the United States. Published by Elsevier Ltd. 1. Introduction Growing levels of greenhouse gases in Earth's atmosphere threaten the stability of global social, biological, and geophysical systems (Schneider et al., 2007) and require massive mitigation efforts (Betz et al., 2007). Photovoltaic (PV) technologies offer significant potential for decarbonizing the electricity industry, because direct solar energy is the most abundant of all energy resources (Arvizu et al., 2011). Although PV historically has contributed little to the electricity mix owing to its high cost relative to established generation technologies, technological improvements and robust industry growth have reduced global PV prices substantially over the past decade. Numerous sources document these price reductions, including the national survey xxxreports under Task 1 of the International Energy Agency's “Co- operative program on PV systems” and subscription-based trade publications such as those produced by Bloomberg New Energy Finance, Greentech Media (GTM), Photon Consulting, Navigant, and EuPD Research. In the academic literature, pricing analyses of PV modules and whole systems have been discussed primarily in the learning or experience curve literature (Maycock and Wakefield, 1975; Neij, 1997; Nemet, 2006; Van der Zwaan and Rabl, 2003; Watanabe et al., 2000). Haas (2004) and Schaeffer et al. (2004) expanded the field by comparing pricing trends between countries and by distinguishing among prices for complete systems and costs of modules as well as hardware and “soft” (non-hardware) balance of Contents lists available at ScienceDirect journal homepage: www.elsevier.com/locate/enpol Energy Policy http://dx.doi.org/10.1016/j.enpol.2014.02.022 0301-4215 Published by Elsevier Ltd. n Corresponding author. Energy Policy 69 (2014) 216–226
-
Upload
truongkhanh -
Category
Documents
-
view
219 -
download
2
Transcript of An analysis of residential PV system price differences ... · An analysis of residential PV system...

xxx
An analysis of residential PV system price differences betweenthe United States and Germany
Joachim Seel a,b,n, Galen L. Barbose a, Ryan H. Wiser a
a Lawrence Berkeley National Laboratory, Berkeley, United Statesb University of California, Berkeley, United States
H I G H L I G H T S
� Residential PV system prices are twice as high in the USA than in Germany in 2012.� Different cumulative national PV market sizes explain only 35% of price gap.� Installer surveys show that price differences stem from non-module and soft costs.� Largest cost differences stem from customer acquisition and installation labor.� Incentives in the US are less effective in driving and following cost reductions.
a r t i c l e i n f o
Article history:Received 11 October 2013Received in revised form12 February 2014Accepted 13 February 2014Available online 11 March 2014
Keywords:PhotovoltaicsSoft costsSystem pricing
a b s t r a c t
Residential photovoltaic (PV) systems were twice as expensive in the United States as in Germany(median of $5.29/W vs. $2.59/W) in 2012. This price discrepancy stems primarily from differences in non-hardware or “soft” costs between the two countries, which can only in part be explained by differences incumulative market size and associated learning. A survey of German PV installers was deployed to collectgranular data on PV soft costs in Germany, and the results are compared to those of a similar survey ofU.S. PV installers. Non-module hardware costs and all analyzed soft costs are lower in Germany,especially for customer acquisition, installation labor, and profit/overhead costs, but also for expensesrelated to permitting, interconnection, and inspection procedures. Additional costs occur in the UnitedStates due to state and local sales taxes, smaller average system sizes, and longer project-developmenttimes. To reduce the identified additional costs of residential PV systems, the United States couldintroduce policies that enable a robust and lasting market while minimizing market fragmentation.Regularly declining incentives offering a transparent and certain value proposition—combined withsimple interconnection, permitting, and inspection requirements—might help accelerate PV costreductions in the United States.
Published by Elsevier Ltd.
1. Introduction
Growing levels of greenhouse gases in Earth's atmospherethreaten the stability of global social, biological, and geophysicalsystems (Schneider et al., 2007) and require massive mitigationefforts (Betz et al., 2007). Photovoltaic (PV) technologies offersignificant potential for decarbonizing the electricity industry,because direct solar energy is the most abundant of all energyresources (Arvizu et al., 2011). Although PV historically hascontributed little to the electricity mix owing to its high costrelative to established generation technologies, technologicalimprovements and robust industry growth have reduced global
PV prices substantially over the past decade. Numerous sourcesdocument these price reductions, including the national surveyxxxreports under Task 1 of the International Energy Agency's “Co-operative program on PV systems” and subscription-based tradepublications such as those produced by Bloomberg New EnergyFinance, Greentech Media (GTM), Photon Consulting, Navigant,and EuPD Research.
In the academic literature, pricing analyses of PV modules andwhole systems have been discussed primarily in the learning orexperience curve literature (Maycock and Wakefield, 1975; Neij,1997; Nemet, 2006; Van der Zwaan and Rabl, 2003; Watanabeet al., 2000). Haas (2004) and Schaeffer et al. (2004) expanded thefield by comparing pricing trends between countries and bydistinguishing among prices for complete systems and costs ofmodules as well as hardware and “soft” (non-hardware) balance of
Contents lists available at ScienceDirect
journal homepage: www.elsevier.com/locate/enpol
Energy Policy
http://dx.doi.org/10.1016/j.enpol.2014.02.0220301-4215 Published by Elsevier Ltd.
n Corresponding author.
Energy Policy 69 (2014) 216–226

system (BoS) costs. Although PV system soft BoS costs werealready examined 35 years ago (Rosenblum, 1978), they havereceived increased attention from the private and public sectorsrecently as their share of total system prices rose in conjunctionwith a decline in hardware component prices. Today, soft costsseem to be a major attribute for PV system price differencesamong various international mature markets.
The price difference is particularly stark for residential PVsystems in Germany and the United States, averaging $14,000 fora 5-kW system in 2012. This article aims to explain the largeresidential system price differences between Germany and theUnited States to illuminate cost-reduction opportunities for U.S. PVsystems. This research was conducted in the context of the U.S.Department of Energy's SunShot Initiative, which aims to makeunsubsidized PV competitive with conventional generating tech-nologies by 2020 (enabling PV system prices of $1/W for utility-scale applications and $1.50/W for residential applications) (U.S.Department of Energy, 2012).
2. Overview of the U.S. and German PV markets
While the United States was a global leader in PV deploymentin the 1980s, the German PV market was significantly larger thanthe U.S. market from 2000 until 2012. Annual capacity additions(including residential, commercial, and utility-scale projects)accelerated in Germany since a reform of the German RenewableEnergy Sources Act (EEG) in 2004, after which annual German PVinstallations were three to nine times higher than U.S. installationsin terms of capacity. During 2010–2012, Germany added morethan 7.4 GW per year, producing a cumulative installed capacityacross all customer segments about four times greater (33.2 GWvs. 8.5 GW) than in the United States by the first quarter of 2013(Fig. 1) (Bundesnetzagentur, 2013; GTM Research and SEIA, 2011,2012, 2013; Wissing, 2006, 2011).
However, after the German Feed-in Tariff (FiT) was cut nearly40% in 2012 and FiT degressions transitioned to a monthlyschedule, German capacity additions slowed nearly to U.S. levels:776 MW in Germany vs. 723 MW in the United States across allcustomer segments in the first quarter of 2013. Extrapolating fromthe first 6 months of 2013, German PV capacity additions wouldtotal about 3.6 GW in 2013, significantly lower than in previousyears and close to the government target of 2.5–3.5 GW estab-lished in the 2010 EEG amendment.
A similar trend exists in the residential PV sector (defined here asany systems of 10 kW or smaller). Cumulative residential capacity
in Germany was about 2.5 times greater (4,230 MW vs. 1,631 MW)than in the United States by the first quarter of 2013 (Fig. 2)(Bundesnetzagentur, 2013; GTM Research and SEIA, 2011, 2012,2013). However, German residential additions have slowed since therecord year of 2011 and were for the first time smaller than U.S.residential additions in the first quarter of 2013 (136MW vs.164MW). The recent residential growth in the United States has beenspurred by new third-party-ownership business models, where eitherthe system is leased to the site-host or the generation output is sold tothe site-host under a power purchase agreement (quarterly marketshares of third-party ownership range from 43% in Massachusetts to91% in Arizona in Q4 2012) (GTM Research and SEIA, 2013). Incontrast, third-party-ownership is uncommon in Germany.
Despite this recent trend, residential PV systems remain muchmore ubiquitous in Germany than in the United States, especiallyin relation to each country's population; cumulative per capitaresidential PV capacity is 5 W in the United States, 20 W inCalifornia (the largest PV market in the United States), and 53 Win Germany in Q1 2013. This sizeable difference indicates that theGerman residential PV market is more mature than the growingU.S. residential PV market.
3. Historical residential PV system pricing
3.1. Data sources and methodology
For this article, information for complete U.S. PV systems (butnot individual soft-cost categories) and information on the countryof origin of modules are derived from the database underlying therecent Lawrence Berkeley National Laboratory “Tracking the SunVI” report, which reflects 70% of the U.S. PV capacity installedbetween 1998 and 2012 (Barbose et al., 2013). Systems larger than10 kW and data entries with explicit information about non-residential use were excluded. It is important to note that the USdata sample includes many third-party-owned projects. For sys-tems installed by integrated companies (that both perform theinstallation and customer financing) the installed price datarepresents an appraised value, which was often significantlyhigher than prices of non-integrated installers between the years2008 through 2011. The “appraised value prices” of many suchsystems stem from incentive applications that often utilize a “fairmarket value” methodology, which is based on a discounted cashflow from the project. This assessment can yield substantiallyhigher values than the prices that would be paid under a cash-saletransaction of non-integrated installers. In order to avoid any
Fig. 1. German and U.S. annual and cumulative PV capacity additions across all sectors.
J. Seel et al. / Energy Policy 69 (2014) 216–226 217

bias that such data would otherwise introduce, projects for whichreported installed prices were deemed likely to represent anappraised value—roughly 20,000 systems or 8% of the U.S. data-set—were removed from the sample to enable price comparisonswith customer-owned residential systems in Germany. Unlessotherwise noted, U.S. prices are reported as the statistical medianfrom the Tracking the Sun dataset.
German system prices for 2001–2006 are arithmetic averages ofdata from the International Energy Agency's national PV surveyreports (Wissing, 2011, 2006), the PV loan program of the Germanstate bank Kreditanstalt für Wiederaufbau (KfW) (Oppermann,2004, 2002), and a report comparing system prices between severalEuropean countries (Schaeffer et al., 2004). For 2007–2013, installedprice averages for systems of 10 kW or smaller were obtained fromquarterly surveys of 100 installers by the market research companyEuPD for the German Solar Industry Association (BSW) (Tepper, 2013).In addition, 6542 German price quotes for systems of 10 kWor smallerwere analyzed for price distributions andmodule brandmarket shares(EuPD, 2013).
Annual module prices reflect average sales prices for a blend ofmonocrystalline and polycrystalline silicon modules at the factory gatein a mix of representative geographic locations, based on data fromNavigant (Mints, 2013, 2012). Quarterly module prices from 2010 to2012 are a blend of UBS spot market prices for Chinese and non-Chinese modules (Meymandi et al., 2013), while quarterly residentialinverter prices are based on the U.S. Solar Market Insights report seriesby Greentech Media (GTM Research and SEIA, 2011, 2012, 2013).
Throughout the analysis all prices are reported in average 2011U.S. dollars (US$2011). German historical data were adjusted withGerman inflation data to average 2011 euros (€2011) and then
translated to US$2011 by using the mean dollar-euro exchangerate for 2011 ($1.39/€).
Focusing only on the upfront installed price of a PV system(with the metric $/W) has inherent limitations. A range ofimportant quality characteristics are not captured, such as long-evity and degradation rates of the hardware components, modulecapabilities (e.g., efficiency under diffuse light in cloudy Germany),inverter power-quality-management capabilities (e.g. reactivepower supply), and the ability to analyze generated and self-consumed electricity data remotely. In addition, the levelized costof solar electricity (which matters most to consumers) dependsnot only on installed price, but also on factors such as systemuptime and, more importantly, annual insolation. Nevertheless,capacity pricing in $/W (including sales tax if applicable) is auseful metric because it enables a direct comparison of residentialPV system prices between the two countries at a granular level.It is used for the remainder of the analysis, with the exception of abrief comparison of PV electricity generation costs in the resultssection. Operation, maintenance, and financing costs are outsidethe scope of this research.
3.2. Results
Average residential PV system prices have fallen significantly overthe past 11 years in both countries: about 75% in Germany (startingfrom $11.44/W in 2001) and about 50% in the United States (startingfrom $10.61/W). After initial fluctuation, prices became similar ineach country by 2005 (around $8.6/W). In the following years, pricesincreasingly diverged; during a time of nearly constant moduleprices from 2005 to 2008, U.S. system prices decreased only to
Fig. 2. Residential annual and cumulative PV capacity additions: United States, Germany, and California.
Fig. 3. Median installed price of non-appraised PV systems r10 kW, 2001–2012.
J. Seel et al. / Energy Policy 69 (2014) 216–226218

$8.03/W in 2009, while German non-module cost reductions yieldeda system price of $4.82/W in 2009 (Fig. 3).
Median system prices decreased largely in parallel from 2010through 2012, maintaining a price gap of about $2.8/W betweenresidential systems installed in Germany and the United States.As shown in Fig. 4, the price reductions in both countries wereaided by a decline in module and inverter costs.
System-level prices are also much more heterogeneous in theUnited States than in Germany (Fig. 5). For example, in 2012 theU.S. standard deviation was $1.54/W, compared with $0.45/W inGermany. Because of this wider spread of prices in the UnitedStates relative to Germany, the cheapest 15% of U.S. systems wereinstalled at prices found among the more expensive systems inGermany.
The wider distribution can be explained in part by significantsystem price differences among individual U.S. states and theabsence of clear price signals on the national level. For example,New Jersey (one of the lower-priced markets) had a medianresidential price of $4.38/W in the fourth quarter of 2012,compared with $5.16/W in California (one of the higher-pricedmarkets and the largest U.S. PV market). This difference is partlydue to varying business process costs (such as labor costs), but italso suggests the presence of value-based pricing and relativelyfragmented markets across states and local jurisdictions. Forexample, the electricity costs avoided by net-metering agreementsvary based on electricity rates and structures in different utilityservice territories and states, as do additional incentives.
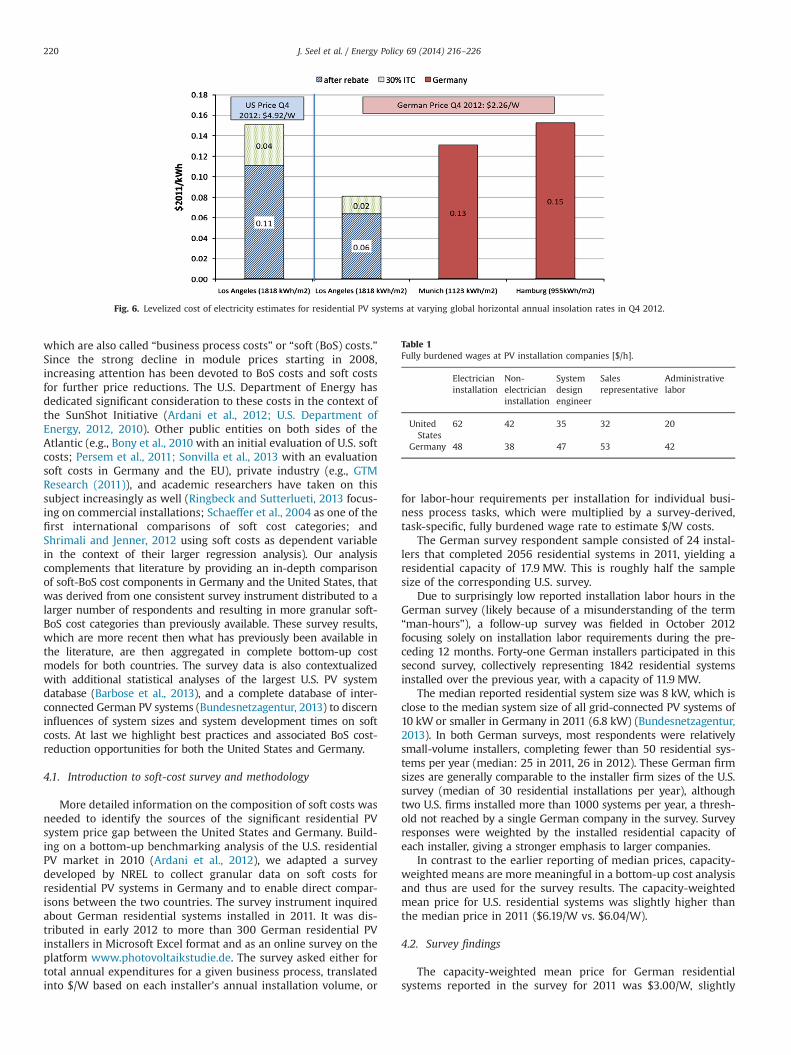
The system price differences between Germany and theUnited States affect the associated electricity generation costs,although they are partly offset by the different insolation re-sources. Germany's average insolation ranges between Alaska'sand the State of Washington's, the least sunny areas of the UnitedStates (900–1200 kWh/m2 annual global horizontal irradiationaverages). A levelized cost of electricity (LCoE) analysis based onthe National Renewable Energy Laboratory's (NREL's) SystemAdvisor Model showed that residential PV electricity generationcosts at PV system prices from the fourth quarter of 2012 ($2.26/Win Germany and $4.92/W in the United States) in the cloudier partsof Germany were comparable to costs in sunny regions of theUnited States such as California.1 If residential PV system prices inthe United States decreased to German levels, electricity could begenerated at very low costs in sunny areas in the United States.
Fig. 6 suggests that, with the 30% U.S. federal investment taxcredit (ITC), achieving German PV system prices could reduce PVelectricity generation cost to $0.06/kWh for residential installa-tions in Los Angeles.
4. Non-module costs as primary driver of price differences
With the significant growth and internationalization of PVmodule manufacturing, modules increasingly have become aglobal commodity that can be purchased at very similar prices inthe large and mature PV markets around the world. Previousanalyses have shown very little recent pricing discrepancy for PVmodules between Germany and the United States (Goodrich et al.,2012). Further, lower-cost Chinese and Taiwanese module brandspenetrated the residential markets of both countries similarly in2012 (increasing from 23% to 39% in Germany and from 32% to 40%in the United States from 2010 to 2012), even though Germanbrands were more popular in Germany (56% of all systems in 2010declining to 46% in 2012 (EuPD, 2013)) than were American brandsin the United States (relatively stable around 20% (Barbose et al.,2013)).2 This leaves non-module costs as the primary driver ofsystem price differences.
Non-module costs can be divided into two general categories:inverter and other BoS hardware costs and non-hardware costs,
Fig. 4. Median installed price of non-appraised PV systems r10 kW, 2010–2012.
Fig. 5. Price distribution of non-appraised PV systems r10 kW installed in theUnited States and Germany in 2011 and 2012.
1 LCoE assumptions: 25-year life span, nominal discount rate of 4.5%, O&M$100/year, one inverter replacement over the system lifetime for $1,200, deratefactor of 0.77, degradation rates of 0.5%/year.
2 Information is based on the country of the headquarter of the 25 mostubiquitous module brands in the U.S., derived from 106,472 systems installed in 20different U.S. states between 2010 and 2012.
J. Seel et al. / Energy Policy 69 (2014) 216–226 219
which are also called “business process costs” or “soft (BoS) costs.”Since the strong decline in module prices starting in 2008,increasing attention has been devoted to BoS costs and soft costsfor further price reductions. The U.S. Department of Energy hasdedicated significant consideration to these costs in the context ofthe SunShot Initiative (Ardani et al., 2012; U.S. Department ofEnergy, 2012, 2010). Other public entities on both sides of theAtlantic (e.g., Bony et al., 2010 with an initial evaluation of U.S. softcosts; Persem et al., 2011; Sonvilla et al., 2013 with an evaluationsoft costs in Germany and the EU), private industry (e.g., GTMResearch (2011)), and academic researchers have taken on thissubject increasingly as well (Ringbeck and Sutterlueti, 2013 focus-ing on commercial installations; Schaeffer et al., 2004 as one of thefirst international comparisons of soft cost categories; andShrimali and Jenner, 2012 using soft costs as dependent variablein the context of their larger regression analysis). Our analysiscomplements that literature by providing an in-depth comparisonof soft-BoS cost components in Germany and the United States, thatwas derived from one consistent survey instrument distributed to alarger number of respondents and resulting in more granular soft-BoS cost categories than previously available. These survey results,which are more recent then what has previously been available inthe literature, are then aggregated in complete bottom-up costmodels for both countries. The survey data is also contextualizedwith additional statistical analyses of the largest U.S. PV systemdatabase (Barbose et al., 2013), and a complete database of inter-connected German PV systems (Bundesnetzagentur, 2013) to discerninfluences of system sizes and system development times on softcosts. At last we highlight best practices and associated BoS cost-reduction opportunities for both the United States and Germany.
4.1. Introduction to soft-cost survey and methodology
More detailed information on the composition of soft costs wasneeded to identify the sources of the significant residential PVsystem price gap between the United States and Germany. Build-ing on a bottom-up benchmarking analysis of the U.S. residentialPV market in 2010 (Ardani et al., 2012), we adapted a surveydeveloped by NREL to collect granular data on soft costs forresidential PV systems in Germany and to enable direct compar-isons between the two countries. The survey instrument inquiredabout German residential systems installed in 2011. It was dis-tributed in early 2012 to more than 300 German residential PVinstallers in Microsoft Excel format and as an online survey on theplatform www.photovoltaikstudie.de. The survey asked either fortotal annual expenditures for a given business process, translatedinto $/W based on each installer's annual installation volume, or
for labor-hour requirements per installation for individual busi-ness process tasks, which were multiplied by a survey-derived,task-specific, fully burdened wage rate to estimate $/W costs.
The German survey respondent sample consisted of 24 instal-lers that completed 2056 residential systems in 2011, yielding aresidential capacity of 17.9 MW. This is roughly half the samplesize of the corresponding U.S. survey.
Due to surprisingly low reported installation labor hours in theGerman survey (likely because of a misunderstanding of the term“man-hours”), a follow-up survey was fielded in October 2012focusing solely on installation labor requirements during the pre-ceding 12 months. Forty-one German installers participated in thissecond survey, collectively representing 1842 residential systemsinstalled over the previous year, with a capacity of 11.9 MW.
The median reported residential system size was 8 kW, which isclose to the median system size of all grid-connected PV systems of10 kW or smaller in Germany in 2011 (6.8 kW) (Bundesnetzagentur,2013). In both German surveys, most respondents were relativelysmall-volume installers, completing fewer than 50 residential sys-tems per year (median: 25 in 2011, 26 in 2012). These German firmsizes are generally comparable to the installer firm sizes of the U.S.survey (median of 30 residential installations per year), althoughtwo U.S. firms installed more than 1000 systems per year, a thresh-old not reached by a single German company in the survey. Surveyresponses were weighted by the installed residential capacity ofeach installer, giving a stronger emphasis to larger companies.
In contrast to the earlier reporting of median prices, capacity-weighted means are more meaningful in a bottom-up cost analysisand thus are used for the survey results. The capacity-weightedmean price for U.S. residential systems was slightly higher thanthe median price in 2011 ($6.19/W vs. $6.04/W).
4.2. Survey findings
The capacity-weighted mean price for German residentialsystems reported in the survey for 2011 was $3.00/W, slightly
Fig. 6. Levelized cost of electricity estimates for residential PV systems at varying global horizontal annual insolation rates in Q4 2012.
Table 1Fully burdened wages at PV installation companies [$/h].
Electricianinstallation
Non-electricianinstallation
Systemdesignengineer
Salesrepresentative
Administrativelabor
UnitedStates
62 42 35 32 20
Germany 48 38 47 53 42
J. Seel et al. / Energy Policy 69 (2014) 216–226220

lower than the BSW estimate for 2011 of $3.38/W (Tepper, 2013,reported earlier in Fig. 3). Total non-hardware costs (includingmargin) were much lower in Germany, accounting in 2011 for only$0.62/W (21% of system price) versus $3.34/W in the UnitedStates (54%).
A comparison of fully burdened wages between the twocountries reveals that installation labor was cheaper in Germanybut that wages of system design engineers, sales representatives,and administrative workers were higher in Germany (Table 1). Thewage data includes taxes and welfare contributions but excludesemployment-related overhead costs incurred by human resourcesdepartments. Data for Germany was derived from the fieldedsurvey, while U.S. wage data was utilized that had been previouslyused in U.S. soft cost analyses by the U.S. National RenewableEnergy Laboratory (RSMeans, 2010). Some of the German wagedata derived from the survey are higher than estimates by theGerman federal statistical agency (Destatis), especially for saleslabor. This discrepancy can be explained by the fact that manyGerman residential installers are small businesses and local crafts-men—where the business owner is often involved in the salesprocess—while the Destatis numbers are not specific to the PVindustry and represent sales labor wages in larger companies.
Of the three specific soft cost categories examined, the largestdifference between the United States and Germany was associatedwith customer acquisition costs (a difference of $0.62/W). In Fig. 7,“Non-project-specific Marketing & Advertising” includes expensessuch as online and magazine ad campaigns, while “Other project-specific Customer Acquisition” includes categories such as salescalls, site visits, travel time, bid preparation, and contract negotia-tion (averaging about $400 for a German installation). Previousanalyses confirmed a similar degree of expense differencesbetween the two countries for 2010 and similar levels of U.S.customer acquisition costs in 2012 (Woodlawn Associates, 2012).“Non-project-specific Marketing and Advertising” costs averageabout $200 for a residential installation in Germany, althoughone third of the respondents reported no expenses for such broadadvertising activities for their businesses. “Other project-specific Custo-mer Acquisition” expenses are in comparison both more substantial(averaging about $400 per installation) andmore ubiquitous (only tworespondents reporting no costs for this category).
Customer acquisition costs may be lower in Germany becauseof partnerships between installers and both equipment manufac-turers and lead-aggregation websites, where potential customersare quickly linked to three to five installers in their zip code areas.
German residential PV installers also have a higher bid successrate, which lowers per-customer acquisition costs: 40% of leadstranslate into final contracts in Germany compared to 30% in theUnited States.
In addition, the large German market has transformed residen-tial PV systems from an early-adopter product into a more main-stream product, and new customers are recruited primarily byword of mouth. Peer effects in the diffusion of PV (Bollinger andGillingham, 2012), therefore, further explain the relatively lowcustomer acquisition costs in the more mature German market;about 1 of 32 German households owned PV systems in the firstquarter of 2013 compared with 1 of 83 California households and1 of 323 U.S. households. As explained later, the relativelystraightforward value proposition of PV systems under the FiT inGermany may further facilitate the sales process and contribute tolower customer acquisition costs compared to the United States.
The second-largest soft cost difference ($0.36/W) stems fromthe physical installation process (Fig. 8). According to the follow-up survey, German companies installed residential PV systems in39 man-hours, on average, while U.S. installers required abouttwice as many labor hours (75 man-hours per residential system).One possible contributor to the difference in installation laborhour requirements is the prevalence of roof penetrations. Mostsurveyed German installers either never or only rarely installresidential systems requiring rooftop penetration; this share islikely higher in the United States due to differences in roofingmaterials and climatic requirements.3 Other studies have reportedeven shorter installation times for Germany (Bromley, 2012;PV Grid, 2012). A recent field study by the Rocky MountainInstitute—using a time and motion methodology for residentialPV installations in both countries—confirmed our findings andprovided further details on differences in installation practices thathighlight remaining optimization opportunities for U.S. installers(Morris et al., 2013). The required installation labor hours forGerman installations are not strongly positively correlated withthe installed system size, suggesting further economies of scale forthe slightly larger German residential PV systems in comparisonto U.S. residential systems. The standard deviation in reportedtotal installation labor hours is only 12 h for German systems,
Fig. 7. Average customer acquisition costs in the United States and Germany.
3 Additional hypotheses about faster German installations due to less use of anextra conduit for wiring or much faster grounding practices could not beconfirmed.
J. Seel et al. / Energy Policy 69 (2014) 216–226 221

and even the 90th percentile of German labor hours (55 h) issignificantly less than what their American counterparts reportedfor the year 2010.
In Germany, the bulk of installation labor consisted of cheapernon-electrician labor (77% of total man-hours), whereas non-electrician labor represented only 65% of total installation laborhours for U.S. residential systems. Fully burdened wages were alsoslightly lower in Germany than in the United States. As a result ofthis combination of factors (fewer total installation labor hours,greater reliance on non-electrician labor, and lower overall wagerates), installation labor costs averaged $0.23/W in Germanycompared to $0.59/W in the United States (Fig. 8).
Costs associated with permitting, interconnection, inspection(PII) have been discussed widely in the United States. As shown inFig. 9, our survey indicated PII costs (including incentive applica-tion processes) were $0.21/W lower in Germany than in the UnitedStates. This difference is mostly due to lower PII labor hourrequirements in Germany (5.2 h vs. 22.6 h). In Germany, localpermits (structural, electrical, aesthetic) and inspection by countyofficials are not required for the construction of residential PVsystems. Incentive applications are done quickly online on oneunified national platform—all respondents of the German surveyreported zero labor hours for this activity, suggesting that this isdone by the owner of the PV system and no facilitation of theinstaller is required. In addition, no permit fee is required inGermany, while residential permitting fees in the United Statesaverage $0.09/W. As result, the only sizable PII activity in Germanyis the actual interconnection process to the distribution grid (therespondents are very consistent in their reports of 2–3.5 h) and anassociated notification to the local utility (20% of the respondentsstating that 0 h are required for this activity, while 12% report timebudgets of 3.5–4 h).
These survey results are very similar to other estimates of permittime requirements and total PII costs (Tong, 2012; PV Grid, 2012;Sprague, 2011; Dong and Wiser, 2013). Since the assessment of U.S.permitting time requirements in 2010 (Ardani et al., 2012), substan-tial efforts have been made across many U.S. jurisdictions to stream-line processes and make reporting requirements more transparent.Among the initiatives are online databases such as www.solarpermit.org, the U.S. Department of Energy's “Rooftop Solar Challenge” withbest practices shared in an online resource center, and state legisla-tion limiting permit fees in Vermont, Colorado, and California.
In addition to the soft cost categories explored through the survey,sales taxes are another reason for the divergence between residentialPV system prices in the United States and Germany. German PV
systems are effectively exempt from sales and value-added taxes(usually 19%) either due to the “Kleinunternehmer” or “Vorsteuerer-stattungs” clause (Bundesverband Solarwirtschaft (BSW-Solar), 2012).In the United States, 23 states assess sales taxes on residential PVsystems, usually ranging between 4% and 8% of the hardware costs. Inaddition, local sales taxes are often levied (The Tax Foundation, 2013).Given the spatial distribution of PV systems in the United States(Barbose et al., 2013), and accounting for PV sales tax exemptions insome states (DSIRE, 2012), state and local sales taxes added accordingto our analysis approximately $0.21/W to the median price of U.S.residential PV systems in 2011.
We devised a bottom-up cost model for U.S. systems usinghardware cost estimates for 2011 (GTM Research and SEIA, 2012;Goodrich et al., 2012) and soft cost benchmarks for 2010 (Ardaniet al., 2012). Fig. 10 summarizes the identified sources for the pricedifference of $3.19/W between U.S. and German residential sys-tems installed in 2011. Besides the residual costs, the largestdifference in soft costs stems from customer acquisition costs,followed by installation labor costs, sales taxes, and PII costs.
To our knowledge, no detailed national data are availableon additional overhead costs (e.g., property-related expenses,
Fig. 8. Installation labor hours and costs in the United States and Germany.
Fig. 9. Permitting, interconnection, inspection, and incentive application hours andcosts in the United States and Germany.
J. Seel et al. / Energy Policy 69 (2014) 216–226222

inventory-related costs, insurance, fees, and general administra-tive costs) and net profit margins of U.S. residential installers. Theadditional category “overhead, profit, and other residual costs” inFig. 10, therefore, accounts for the difference between the systemprices (Barbose et al., 2012) and the bottom-up cost estimates.German installers reported $0.29/W for overhead costs and profits,while the U.S. residual was $1.61/W (a difference of $1.32/W).Additional research is needed to understand the source of thislarge difference.
Two additional hypotheses may explain in part why residentialPV prices are higher in the United States, even though they do notadd directly to the numbers already represented in the bottom-upcost model: implications of longer development times and theeffect of differences in system sizes on final system prices.
According to the survey, German residential PV installersrequire on average 35 days between first contact with a potentialcustomer and the completion of the PV system installation andinterconnection. System development times are substantiallylonger in the United States, where the average time between thefirst application date for a future specific PV installation and thereported system completion is 126 days. This substantially longerperiod of nearly 3 months impacts an installer's financing costs forpurchased materials, the volume of annual installations, and theassociated relative burden of general business overhead costs perinstallation. It also influences the installer's ability to pass downmaterial price reductions to the final customer in a timely manner.For example, prices for systems completed in the fourth quarter of2012 may have been negotiated in that quarter in Germany but inthe third quarter of 2012 in the United States. The effects of thesetemporal misalignments vary with pricing dynamics in bothcountries over time. In the fourth quarter of 2012, they mayexplain $0.18/W of the system price difference (the price differ-ence between the third and fourth quarters of 2012 in Germany).
An analysis of German PV interconnection data (Bundesnetzagentur,2013) for systems of 10 kW or smaller shows that systems inGermany are also slightly larger than those in the United States,with respective medians of 6.80 kW and 4.95 kW in 2011. Althoughthe mode is in the 5–6 kW bin in both countries, the Germandistribution of system sizes is positively skewed, while the U.S.distribution is negatively skewed. This difference can be explainedby the fact that German residential system sizes historically havebeen constrained only by available roof area and the customers'willingness to pay for larger system sizes, because the FiT paymentsare not system-size dependent within each FiT bin (0–30 kW untilApril 2012, 0–10 kW since then). Because PV systems exhibiteconomies of scale, larger systems result in a higher rate of return,providing an incentive for larger systems. In the United States, bycontrast, PV customers size their systems predominantly accordingto their own electricity consumption, because excess generation isnot compensated favorably under most net-metering agreements(Darghouth et al., 2011). Thus, owing to economies of scale, the
larger German systems have lower average system prices than thesmaller U.S. systems. Applying the German system size distributionto the U.S. system price distribution quantifies this price advantageat $0.15/W for systems installed in 2011.
5. Discussion of findings
Our preceding empirical analysis shows that the primary sourcesof price differences between U.S. and German residential PVsystems are non-module costs, primarily soft costs such as businessprocess costs and “overhead costs and profit.” The followingdiscussion section contextualizes our quantitative results with afew general hypotheses that are not exclusively linked to individualbusiness process cost categories, but that may explain differences inthe broader market characteristics between the two countries. Asthe observed price disparities are likely of multi-causal origin, wefirst turn to structural market differences including market size andthe degree of market fragmentation. In a second step we examinedifferences in the economic valuation of the generated electricity ofPV systems to illuminate possible consequences on system pricingby installers and the customers' willingness to pay. We recognizehowever that the postulated hypotheses are by no means exhaus-tive and that a further analysis of market differences between bothcountries provides an excellent field for future research.
At first, some of the price discrepancy between the United Statesand Germany may be in part attributable to the smaller size of boththe annual residential PV market in the United States compared withGermany as well as a significantly lower amount of cumulativeinstallations. In general one would suppose that a larger marketgives installers more experience, enabling them, for example, tostreamline workflows during the physical installation process.
The transferability of the German experience to the UnitesStates may be limited due to a number of structural differencesbetween the two markets that are unlikely to change: Germanyhas a higher population density, leading to lower transportationcosts and travel times, while climatic differences such as higherwind loads and roofs not designed to withstand large snowmassesmay require a higher degree of scrutiny during the structuraldesign process for PV systems in the United States.
Some of the market fragmentation in the United States—particularly fragmented permitting processes among states, utilityservice territories, and cities—is politically induced and originatesin the substantial regulatory role that state and local governmentsassume. In contrast, the national Renewable Energy Sources Actand the German Energy Act primarily govern Germany's renew-able energy policy, which provides the country with a nationalincentive structure and one unified PV market with few PIIrequirements. One may postulate the hypothesis that four aspectsof the German PV market seem to work more effectively than in
Fig. 10. Components of cost difference between German and U.S. residential PV systems in 2011.
J. Seel et al. / Energy Policy 69 (2014) 216–226 223

the U.S. and enable thus a quicker project flow and lower customeracquisition costs: the relative simplicity of the German regulatoryframework, a large potential customer base that holds strongenvironmental values, bandwagon and diffusion effects amongcustomers, and a very competitive PV market.
German PVmarket growth and rapidly falling prices also may havebeen facilitated by the regularly adjusted FiT, which has provided asimpler, more certain, and more lasting value proposition to the finalcustomer (e.g. Haas et al., 2011; Klessmann et al., 2013; Mendonca,2009) compared to U.S. policies consisting of a combination of taxcredits, local incentives, and net-metering policies.
It is relatively easy to calculate the value of the FiT-paymentsrevenue stream in Germany; its decline for new systems isshown in Fig. 11 (blue line in $/kWh, right axis), along with itscorresponding net present value (NPV) in $/W. The modeledNPV accounts for module degradation and inflation but excludesadditional operation and maintenance costs—the FiT NPVshould thus be higher than corresponding system prices toallow for cost recuperation and the earning of a return on theinvestment. Because the NPV for a given FiT level is determinedprimarily by local insolation, a representative system for thesunny regions in the German south (generating roughly860 kWh/kW each year, light green dotted line, left axis) andone for the less sunny northern regions (generating roughly730 kWh/kW each year, dark green dotted line, left axis) aremodeled in Fig. 11.
This policy mechanism of regular incentive reductions hasforced residential installers to lower system prices (even in timesof stable module prices before 2008) to offer their customersattractive rates of return. In 2012, however, the FiT for Germanresidential PV systems reached “grid parity” as the remunerationamount was less than average residential electricity prices for thefirst time. Since then, the FiT has continued to decline while retailelectricity prices have risen (orange dashed line, right axis in Fig. 11)(Haller et al., 2013), leading to a difference of $0.17/kWh in July2013. This spread has motivated new German PV customersincreasingly to displace electricity purchased from the utility withself-generated electricity from the PV system. In contrast to mostU.S. net-metering policies, this displacement must occur on aninstantaneous basis and not on a net basis over a longer period(typically a year), which historically has limited the attractiveness of
this option for German customers. However, a new federal subsidyprogram for batteries (30% of the battery price up to a cap of 2€ perWatt PV capacity for new residential installations) and the growingvalue discrepancy between the purchase price of retail electricityand the set sales price of the FiT may overcome these hurdles. Theoverall price-decreasing pressure of the degressing FiT could thusbecome less effective over the coming years should Germanresidential PV customers rely increasingly on the higher value ofthe self-consumption option. That and a stagnation of moduleprices may explain the increase in German system prices in thesecond quarter of 2013, the first rise compared to the previousquarter since the second quarter of 2010. German customers havenot yet responded, however, to these new value propositions byoptimizing PV systems for self-consumption; size distributionsbetween the first quarter of 2010 (pre-FiT-grid parity) and the firstquarter of 2013 (post-FiT-grid parity) show no change in eithershape or average values (Bundesnetzagentur, 2013).
Similar pressures to reduce system prices may not exist to thesame degree in the United States. Even though state-level incentives(such as upfront rebates and performance-based incentives) havedeclined over time, they have done so with less consistency than theGerman FiT, while the largest national incentive (the federal Invest-ment Tax Credit) has remained stable at 30% of the total system price,at least until 2016. Furthermore, significant variation in PV customerbill savings can occur in the United States due to complicated ratestructures, such as changing marginal electricity prices for differentconsumption tiers in California (Darghouth et al., 2011; Mills et al.,2008), which make the true value proposition of the PV system lesstransparent to the average consumer. In addition, the NPV associatedwith electricity cost savings from net-metering agreements does notfall regularly and may even increase with rising electricity prices overtime (similar to the new reality in Germany after 2012). These factsmay explain higher customer acquisition costs and the potentiallymore prevalent above-cost, value-based pricing of PV systems. Only avery competitive installer market and the motivation to capture ahigher market share may drive installers to price their systems moreaggressively.
One subject still insufficiently understood is the composition ofoverhead costs and margins among U.S. residential PV installers.Studies analyzing pricing decisions—such as the degree of value-based-pricing—and competition between installers would fill an
Fig. 11. German residential PV system prices and the value of FiT payments in high- and low-solar regions in Germany. (For interpretation of the references to color in thisfigure legend, the reader is referred to the web version of this article.)
J. Seel et al. / Energy Policy 69 (2014) 216–226224

important gap in the current literature and help determine whetherstructural differences in incentive policies can explain the sizable pricegap between German and U.S. residential PV systems.
6. Conclusion
Residential PV systems in the United States were nearly twiceas expensive as those in Germany in 2011—recent price differencesof about $2.8/W continued through 2012 and then declinedslightly over the first half of 2013. Most of these differencesoriginated in high business process and overhead costs in theUnited States and cannot be explained by mere differences innational market size. To reduce these costs, actors in the UnitedStates could consider policy reforms that enable a larger residen-tial PV market with a stable growth trajectory while minimizingmarket fragmentation. Simpler PII requirements and regularlydecreasing incentives, which drive and follow price reductionsand offer a transparent and certain value proposition, might helpaccelerate residential PV price reductions in the United States.
Acknowledgments
This work would not have been possible without the assistance ofmany residential PV installers in the United States and Germany, datasupport by the firm EuPD, and collaboration and guidance by ourcolleagues at NREL, especially the work of surveying U.S. installers byKristen Ardani, Ted James, and Al Goodrich. We thank the sponsors ofthis work at the U.S. Department of Energy's Solar Energy Technolo-gies Office, in particular Minh Le, Christina Nichols, and Elaine Ulrich.In addition we are indebted to the helpful comments of our anon-ymous reviewers.
References
Ardani, K., Barbose, G., Margolis, R., Wiser, R., Feldman, D., Ong, S., 2012.Benchmarking Non-Hardware BoS costs for US PV Systems using a Data-driven Analysis from PV Installer Surveys (No. DOE/GO-10212-3834). USDepartment of Energy (DoE).
Arvizu, D., Balaya, P., Cabeza, L., Hollands, T., Jaeger-Waldau, A., Kondo, M.,Konseibo, M., Meleshko, W., Stein, W., Tamaura, Y., Xu, H., Zilles, R., 2011.Direct Solar Energy, in: Special Report on Renewable Energy Sources andClimate Change Mitigation. Intergovernmental Panel on Climate Change (IPCC).
Barbose, G., Wiser, R., Darghouth, N., 2012. Tracking the Sun V—A HistoricalSummary of Installed Cost of Photovoltaics in the United States from 1998 to2011, LBNL-5919E. Lawrence Berkeley National Laboratory (LBNL), Berkeley, CA.
Barbose, G., Wiser, R., Darghouth, N., Weaver, Samantha, 2013. Tracking the Sun VI—A Historical Summary of Installed Cost of Photovoltaics in the United Statesfrom 1998 to 2012, LBNL-6350E, Lawrence Berkeley National Laboratory (LBNL),Berkeley, CA.
Betz, M., Davidson, O., Bosch, P., Dave, R., Meyers, L., 2007. Climate Change 2007:Mitigation of Climate Change. Contribution of Working Group III to AR4., in:Fourth Assessment Report of the Intergovernmental Panel on Climate Change.Cambridge University Press, Cambridge, UK.
Bollinger, B., Gillingham, K., 2012. Peer effects in the diffusion of solar photovoltaicpanels. Mark. Sci. 31, 900–912.
Bony, L., Doig, S., Hart, C., Maurer, E., Newman, S., 2010. Achieving Low-Cost SolarPV. Rocky Mountain Institute (RMI), Snowmass, CO.
Bromley, H., 2012. California versus German Solar Prices: Same Dope, Twice as High(Research Note). Bloomberg New Energy Finance
Bundesnetzagentur, 2013. Monthly PV System Interconnection Announcements2009–2013.
Bundesverband Solarwirtschaft (BSW-Solar), 2012. Photovoltaik—Steuerrecht,Gewerberecht. Verguetungsrecht (No. 6. Auflage), Berlin.
Darghouth, N.R., Barbose, G., Wiser, R., 2011. The impact of rate design and netmetering on the bill savings from distributed PV for residential customers inCalifornia. Energy Policy 39, 5243–5253.
Dong, C., Wiser, R., 2013. The Impact of Local Permitting Processes on ResidentialPV Installation Prices and Development Times (No. LBNL 6140-E). LawrenceBerkeley National Laboratory (LBNL), Berkeley, CA.
DSIRE, 2012. Solar Sales Tax Incentives.EuPD, 2013. Database of Installer Offer Prices for German Residential PV Systems
2006–2012.Goodrich, A., James, T., Woodhouse, M., 2012. Residential, Commercial and Utility-
Scale PV System Prices in the US: Current Drivers and Cost-ReductionOpportunities. National Renewable Energy Laboratory (NREL).
GTM Research, 2011. Solar PV Balance of System (BOS). Technologies and Markets.GTM Research, SEIA, 2011. U.S. Solar Market Insight Report 2010.GTM Research, SEIA, 2012. U.S. Solar Market Insight Report 2011.GTM Research, SEIA, 2013. U.S. Solar Market Insight Report 2012.Haas, R., 2004. Progress in markets for grid-connected PV systems in the built
environment. Prog. Photovolt. Res. Appl. 12, 427–440.Haas, R., Resch, G., Panzer, C., Busch, S., Ragwitz, M., Held, A., 2011. Efficiency and
effectiveness of promotion systems for electricity generation from renewableenergy sources—Lessons from EU countries. Energy 36, 2186–2193.
Haller, M., Hermann, H., Loreck, C., Matthes, F., 2013. EEG-Umlage und die Kostender Stroversorgung fuer 2013, Eine Analyse von Trends, Ursachen und Wech-selwirkungen. Oeko-Institut.e.V, Berlin.
Klessmann, C., Rathmann, M., de Jager, D., Gazzo, A., Resch, G., Busch, S., Ragwitz,M., 2013. Policy options for reducing the costs of reaching the Europeanrenewables target. Renew. Energy 57, 390–403.
Maycock, P., Wakefield, G., 1975. Business analysis of solar photovoltaic conversion.Presented at the 11th IEEE PV Specialist Conference, Scottsdale, AZ, USA.
Mendonca, M., 2009. Powering the Green Economy: the Feed-in Tariff Handbook.Earthscan, Sterling, VA.
Meymandi, J.-F., Chin, S., Sanghavi, M., Prasad, S., 2013. UBS Global Solar IndustryUpdate. UBS Investment Research.
Mills, A., Wiser, R., Barbose, G., Golove, W., 2008. The impact of retail rate structureson the economics of commercial photovoltaic systems in California. EnergyPolicy 36, 3266–3277.
Mints, P., 2012. Photovoltaic Manufacturer Shipments, Capacity & CompetitiveAnalysis 2011/2012.
Mints, P., 2013. The Global Market for PV Technologies. Presented at the PVSAT-9,Paula Mints Solar PV Market Research. Swansea University.
Morris, J., Calhoun, K., Goodman, J., Seif, D., 2013. Reducing Solar PV Soft Costs.Rocky Mountain Institute (RMI), Snowmass, CO.
Neij, L., 1997. Use of experience curves to analyse the prospects for diffusion andadoption of renewable energy technology. Energy Policy 25, 1099–1107.
Nemet, G.F., 2006. Beyond the learning curve: factors influencing cost reductions inphotovoltaics. Energy Policy 34, 3218–3232.
Oppermann, K., 2002. Perspektiven Erneuerbarer Energien Teil 4: Fördergebnissedes 100.000 Dächer-Solarstrom-Programms—eine Zwischenbilanz, KfW Beit-räge zur Mittelstands-und Strukturpolitik 28. Kreditanstalt für Wiederaufbau(KfW), Frankfurt am Main.
Oppermann, K., 2004. Perspektiven Erneuerbarer Energien: Das 100.000 Dächer-Solarstrom-Programm: Eine Schlussbilanz, KfW Beiträge zur Mittelstands- undStrukturpolitik 31. Kreditanstalt für Wiederaufbau (KfW), Frankfurt am Main.
Persem, M., Chrometzka, T., Brennig, C., Brohm, R., Moch, F., Hielscher, T., 2011.Reduction of Administrative Barriers for PV Systems in Germany at the NationalLevel, PV Legal. Bundesverband der Solarwirtschaft (BSW).
Grid, P.V., 2012. Time Estimates for Residential PV Systems in Germany. Bundesver-band der Solarwirtschaft (BSW).
Ringbeck, S., Sutterlueti, J., 2013. BoS costs: status and optimization to reachindustrial grid parity. Prog. Photovolt. Res. Appl.
Rosenblum, L., 1978. Cost of Photovoltaic Energy Systems as Determined byBalance-of-System Costs (NASA Technical Memorandum No. NASA-TM-78957). Lewis Research Center, Cleveland, OH.
RSMeans, 2010. Building Construction Cost Data. Reed Construction Data, Norwell,Massachusetts.
Schaeffer, G.J., Alsema, E., Seebregts, A., Beurskens, L., Moor, H. de, Sark, W. van,Durstewitz, M., Perrin, M., Boulanger, P., Laukamp, H., Zuccaro, C., 2004.Learning from the Sun. Energy Research Centre of the Netherlands (ECN).
Schneider, S., Semenov, S., Patwardhan, A., Burton, I., Magadza, C., Oppenheimer,M., Pittock, A., Rahman, A., Smith, J., Suarez, A., Yamin, F., 2007. Climate Change2007: Impacts, Adaptation and Vulnerability. Contribution of Working Group IIto AR4., in: Fourth Assessment Report of the Intergovernmental Panel onClimate Change. Cambridge University Press, Cambridge, UK, pp. 779–810.
Shrimali, G., Jenner, S., 2012. The impact of state policy on deployment and cost ofsolar pv: a sector-specific empirical analysis. SSRN Electron. J. 60, 679–690.
Sonvilla, P., Zane, E., Poblocka, A., Brueckmann, R., 2013. PV Grid—Initial ProjectReport. PV Grid, Intelligent Energy Europe.
Sprague, E., 2011. The Impact of Local Permitting on the Cost of Solar Power, SunRun.Tepper, M., 2013. Serie der Statistischen Zahlen der Deutschen Solarstrombranche
(Photovoltaik). Bundesverband der Solarwirtschaft (BSW)The Tax Foundation, 2013. States and local sales tax rates 2011–2013. The Tax
Foundation, Washington, D.C., USA.Tong, J., 2012. Nationwide Analysis of Solar Permitting and the Implications for Soft
Costs. Clean Power Finance (CPF).U.S. Department of Energy, 2010. $1/W Photovoltaic Systems. White Paper to
explore a grand challenge for electricity from solar. U.S. Department of EnergyU.S. Department of Energy, 2012. SunShot Vision Study. Washington D.C.Van der Zwaan, B., Rabl, A., 2003. Prospects for PV: a learning curve analysis. Sol.
Energy 74, 19–31.
J. Seel et al. / Energy Policy 69 (2014) 216–226 225

Watanabe, C., Wakabayashi, K., Miyazawa, T., 2000. Industrial dynamism and thecreation of a “virtuous cycle” between R&D, market growth and pricereduction. Technovation 20, 299–312.
Wissing, L., 2006. National Survey Report of PV Power Applications in Germany2006, Exchange and Dissemination of PV Power Systems. International EnergyAgency (IEA).
Wissing, L., 2011. National Survey Report of PV Power Applications in Germany2010, Exchange and Dissemination of PV Power Systems. International EnergyAgency (IEA).
Woodlawn Associates, 2012. The economics of residential solar installations.Presented at the US Department of Energy (DoE), Sunshot Initiative.
J. Seel et al. / Energy Policy 69 (2014) 216–226226