
Wholesale & Investment Banking Outlook 2015
40
March 19, 2015 Morgan Stanley does and seeks to do business with companies covered in Morgan Stanley Research. As a result, investors should be aware that the firm may have a conflict of interest that could affect the objectivity of Morgan Stanley Research. Investors should consider Morgan Stanley Research as only a single factor in making their investment decision. For analyst certification and other important disclosures, refer to the Disclosure Section, located at the end of this report. * = This Research Report has been partially prepared by analysts employed by non-U.S. affiliates of the member. += Analysts employed by non-U.S. affiliates are not registered with FINRA, may not be associated persons of the member and may not be subject to NASD/NYSE restrictions on communications with a subject company, public appearances and trading securities held by a research analyst account. BLUE PAPER Wholesale & Investment Banking Outlook Liquidity Conundrum: Shifting risks, what it means Financial regulation and QE are at the heart of a huge shift in liquidity risk from banks to the buy-side, which is increasingly a concern for policy makers. This shift is far from over: we expect liquidity in sell-side markets to deteriorate further, as regulation shrinks banks’ capacity another 10-15% over the next two years. Our interviews with asset managers highlighted their concerns over scarcer secondary market liquidity, particularly in credit and in Europe. Regulatory risks are rising for asset managers, as policy makers worry about the risks to financial stability from US QE exit and market structure changes. Our base case is the initial set of reforms follow an incremental approach that involves stress testing of select funds and a range of micro reforms. This could add an extra cost of 1-5% to asset managers, albeit the largest firms are already well placed on this. To calibrate possible stress tests, we’ve analysed the periods of worst fund redemptions in the last 35 years. For instance, fixed income mutual fund outflows in 1994 were on average ~5% in the worst 3 months vs 4-7% fund cash holdings today, which gives us some reassurance. However regulators may wish to test for an even tougher scenario at a fund level. Our bear case is for a more profound longer-term change in regulation that would hit profits and investment flexibility. For the banks, diminishing returns on capital from market making demand even greater efficiency, dexterity and scale to achieve 10-12% returns. More firms will trim this business, ultimately leaving a potentially attractive prize for those able to endure. MORGAN STANLEY RESEARCH Global Huw van Steenis 1 +44 (0)20 7425 9747 Betsy Graseck 2 +1 212 761 8473 Bruce Hamilton 1 +44 (0)20 7425 7597 Vishwanath Tirupattur 2 +1 212 761 1043 Tom Whitehead 2 +1 212 761 5672 Canset Eroglu 1 +44 (0)20 7425 0477 Christian Edelmann +1 212 345 3589 Ted Moynihan +44 (0)20 7852 7555 James Davis +44 (0)20 7852 7631 Michael Turner +44 (0)20 7852 7845 Robert Rogers +44 (0)20 7852 7642 Maxim Olliver +44 (0)20 7852 7605 Oliver Wyman is a global leader in management consulting. For more information, visit www.oliverwyman.com. Oliver Wyman is not authorized or regulated by the PRA or the FCA and is not providing investment advice. Oliver Wyman authors are not research analysts and are neither FCA nor FINRA registered. Oliver Wyman authors have only contributed their expertise on business strategy within the report. Oliver Wyman’s views are clearly delineated. The securities and valuation sections of report are the work of Morgan Stanley only and not Oliver Wyman. For disclosures specifically pertaining to Oliver Wyman please see the Disclosure Section located at the end of this report. 1 Morgan Stanley & Co. International plc+ 2 Morgan Stanley & Co. Incorporated Morgan Stanley Blue Papers focus on critical investment themes that require coordinated perspectives across industry sectors, regions, or asset classes.
Transcript of Wholesale & Investment Banking Outlook 2015
March 19, 2015
Morgan Stanley does and seeks to do business with companies covered in Morgan Stanley Research. As a result, investors should be aware that the firm may have a conflict of interest that could affect the objectivity of Morgan Stanley Research. Investors should consider Morgan Stanley Research as only a single factor in making their investment decision. For analyst certification and other important disclosures, refer to the Disclosure Section, located at the end of this report. * = This Research Report has been partially prepared by analysts employed by non-U.S. affiliates of the member. += Analysts employed by non-U.S. affiliates are not registered with FINRA, may not be associated persons of the member and may not be subject to NASD/NYSE restrictions on communications with a subject company, public appearances and trading securities held by a research analyst account.
B L U E P A P E R
Wholesale & Investment Banking Outlook Liquidity Conundrum: Shifting risks, what it means Financial regulation and QE are at the heart of a huge shift in liquidity risk from banks to the buy-side, which is increasingly a concern for policy makers. This shift is far from over: we expect liquidity in sell-side markets to deteriorate further, as regulation shrinks banks’ capacity another 10-15% over the next two years. Our interviews with asset managers highlighted their concerns over scarcer secondary market liquidity, particularly in credit and in Europe.
Regulatory risks are rising for asset managers, as policy makers worry about the risks to financial stability from US QE exit and market structure changes. Our base case is the initial set of reforms follow an incremental approach that involves stress testing of select funds and a range of micro reforms. This could add an extra cost of 1-5% to asset managers, albeit the largest firms are already well placed on this.
To calibrate possible stress tests, we’ve analysed the periods of worst fund redemptions in the last 35 years. For instance, fixed income mutual fund outflows in 1994 were on average ~5% in the worst 3 months vs 4-7% fund cash holdings today, which gives us some reassurance. However regulators may wish to test for an even tougher scenario at a fund level. Our bear case is for a more profound longer-term change in regulation that would hit profits and investment flexibility.
For the banks, diminishing returns on capital from market making demand even greater efficiency, dexterity and scale to achieve 10-12% returns. More firms will trim this business, ultimately leaving a potentially attractive prize for those able to endure.
M O R G A N S T A N L E Y R E S E A R C H G l o b a l
Huw van Steenis1
+44 (0)20 7425 9747
Betsy Graseck2 +1 212 761 8473
Bruce Hamilton1 +44 (0)20 7425 7597
Vishwanath Tirupattur 2 +1 212 761 1043
Tom Whitehead2 +1 212 761 5672
Canset Eroglu1 +44 (0)20 7425 0477
Christian Edelmann +1 212 345 3589
Ted Moynihan +44 (0)20 7852 7555
James Davis +44 (0)20 7852 7631
Michael Turner +44 (0)20 7852 7845
Robert Rogers +44 (0)20 7852 7642
Maxim Olliver +44 (0)20 7852 7605
Oliver Wyman is a global leader in management consulting. For more information, visit www.oliverwyman.com.
Oliver Wyman is not authorized or regulated by the PRA or the FCA and is not providing investment advice. Oliver Wyman authors are not research analysts and are neither FCA nor FINRA registered. Oliver Wyman authors have only contributed their expertise on business strategy within the report. Oliver Wyman’s views are clearly delineated. The securities and valuation sections of report are the work of Morgan Stanley only and not Oliver Wyman.
For disclosures specifically pertaining to Oliver Wyman please see the Disclosure Section located at the end of this report.
1Morgan Stanley & Co. International plc+
2Morgan Stanley & Co. Incorporated
Morgan Stanley Blue Papers focus on critical investment themes that require coordinated perspectives across industry sectors, regions, or asset classes.

March 19, 2015 Wholesale & Investment Banking
M O R G A N S T A N L E Y B L U E P A P E R Table of Contents
Executive Summary: Profound Shift in Liquidity Risks ............................................................................................................ 3
1. The Liquidity Conundrum .................................................................................................................................................... 9
2. Impact on Asset Managers .................................................................................................................................................. 19
3. Impact on Banks.................................................................................................................................................................. 25
4. Impact on Market Infrastructure........................................................................................................................................... 34
2
March 19, 2015 Wholesale & Investment Banking
M O R G A N S T A N L E Y B L U E P A P E R Executive Summary: Profound Shift in Liquidity Risks There's a liquidity conundrum in fixed income markets facing policy makers and investors: how it’s resolved will have long-term investment implications across banks, asset managers and infrastructure players. At its heart is the huge shift in liquidity risks to the buy-side and asset owners as the twin forces of financial regulation and QE have played out. New rules have driven a severe reduction in sell-side balance sheet and banks’ liquidity provision. Wholesale banking balance sheets supporting traded markets have decreased by 40% in risk weighted assets terms and 20% in total balance sheet since 2010. At the same time, credit markets have boomed as companies turn more to bond finance and investors are hungry for income. Credit market issuance is 2.4 times larger today than 2005. Within this, AuM in daily redeemable funds have grown 10% per annum and are now 76% above 2008 levels. Cash in mutual funds has risen compared to pre-crisis periods and is at an industry level above redemptions experienced in periods of prior stress, suggesting asset managers are responsive to emerging risks. Nonetheless, policy makers are wrestling with the large changes to markets.
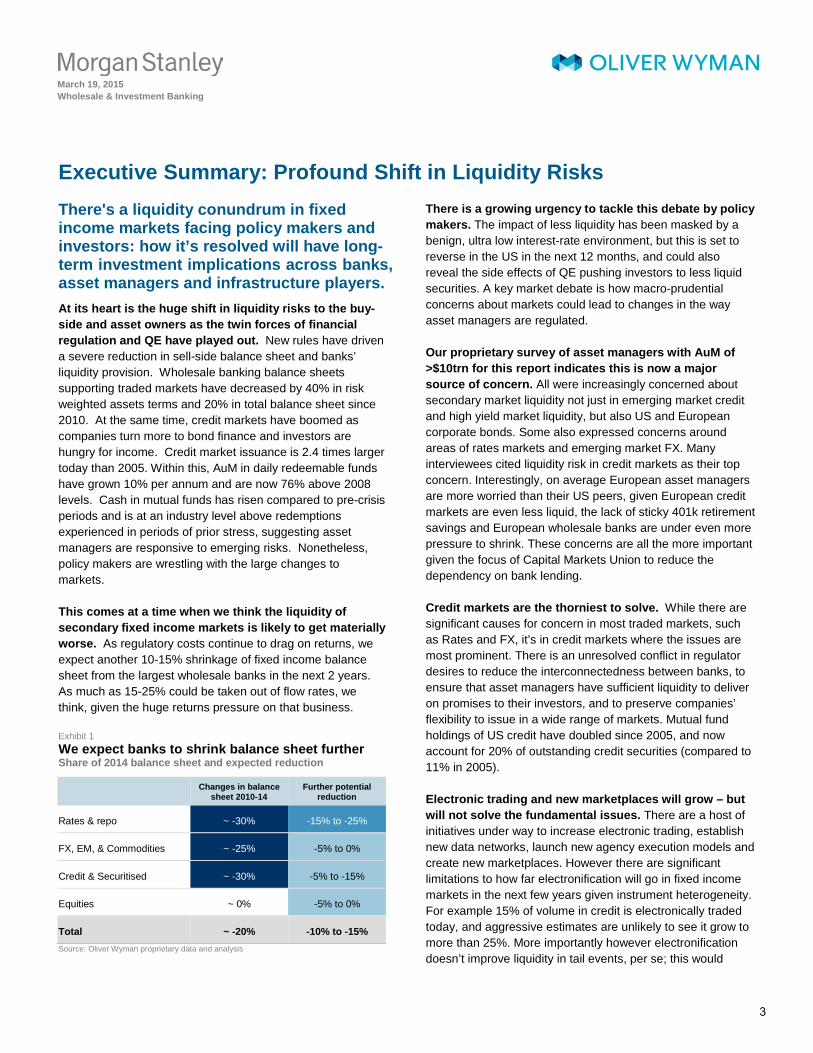
This comes at a time when we think the liquidity of secondary fixed income markets is likely to get materially worse. As regulatory costs continue to drag on returns, we expect another 10-15% shrinkage of fixed income balance sheet from the largest wholesale banks in the next 2 years. As much as 15-25% could be taken out of flow rates, we think, given the huge returns pressure on that business.
Exhibit 1 We expect banks to shrink balance sheet further Share of 2014 balance sheet and expected reduction
Changes in balance
sheet 2010-14 Further potential
reduction
Rates & repo ~ -30% -15% to -25%
FX, EM, & Commodities ~ -25% -5% to 0%
Credit & Securitised ~ -30% -5% to -15%
Equities ~ 0% -5% to 0%
Total ~ -20% -10% to -15% Source: Oliver Wyman proprietary data and analysis
There is a growing urgency to tackle this debate by policy makers. The impact of less liquidity has been masked by a benign, ultra low interest-rate environment, but this is set to reverse in the US in the next 12 months, and could also reveal the side effects of QE pushing investors to less liquid securities. A key market debate is how macro-prudential concerns about markets could lead to changes in the way asset managers are regulated.
Our proprietary survey of asset managers with AuM of >$10trn for this report indicates this is now a major source of concern. All were increasingly concerned about secondary market liquidity not just in emerging market credit and high yield market liquidity, but also US and European corporate bonds. Some also expressed concerns around areas of rates markets and emerging market FX. Many interviewees cited liquidity risk in credit markets as their top concern. Interestingly, on average European asset managers are more worried than their US peers, given European credit markets are even less liquid, the lack of sticky 401k retirement savings and European wholesale banks are under even more pressure to shrink. These concerns are all the more important given the focus of Capital Markets Union to reduce the dependency on bank lending.
Credit markets are the thorniest to solve. While there are significant causes for concern in most traded markets, such as Rates and FX, it’s in credit markets where the issues are most prominent. There is an unresolved conflict in regulator desires to reduce the interconnectedness between banks, to ensure that asset managers have sufficient liquidity to deliver on promises to their investors, and to preserve companies’ flexibility to issue in a wide range of markets. Mutual fund holdings of US credit have doubled since 2005, and now account for 20% of outstanding credit securities (compared to 11% in 2005).
Electronic trading and new marketplaces will grow – but will not solve the fundamental issues. There are a host of initiatives under way to increase electronic trading, establish new data networks, launch new agency execution models and create new marketplaces. However there are significant limitations to how far electronification will go in fixed income markets in the next few years given instrument heterogeneity. For example 15% of volume in credit is electronically traded today, and aggressive estimates are unlikely to see it grow to more than 25%. More importantly however electronification doesn’t improve liquidity in tail events, per se; this would
3
March 19, 2015 Wholesale & Investment Banking
M O R G A N S T A N L E Y B L U E P A P E R require more fundamental changes to increase standardisation, which in turn would bring trade-offs for issuance flexibility and investment portfolio construction. Similarly, while agency structures offer some benefits, they would not improve liquidity.
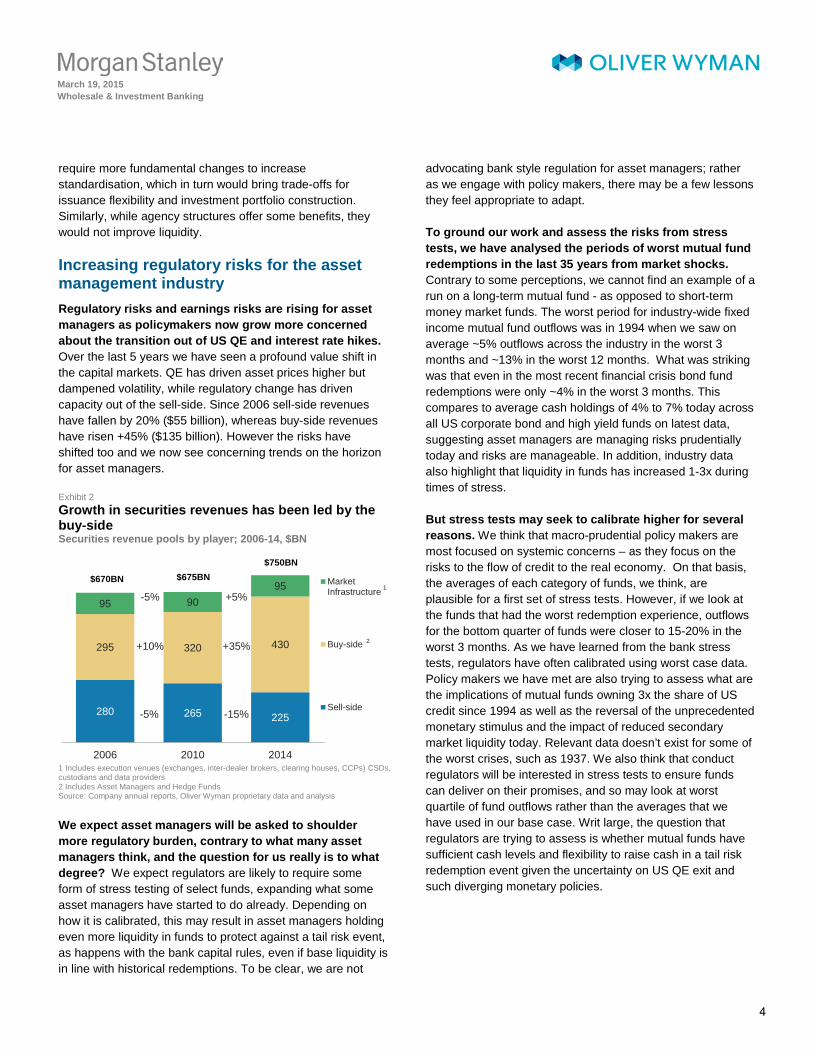
Increasing regulatory risks for the asset management industry Regulatory risks and earnings risks are rising for asset managers as policymakers now grow more concerned about the transition out of US QE and interest rate hikes. Over the last 5 years we have seen a profound value shift in the capital markets. QE has driven asset prices higher but dampened volatility, while regulatory change has driven capacity out of the sell-side. Since 2006 sell-side revenues have fallen by 20% ($55 billion), whereas buy-side revenues have risen +45% ($135 billion). However the risks have shifted too and we now see concerning trends on the horizon for asset managers.
Exhibit 2 Growth in securities revenues has been led by the buy-side Securities revenue pools by player; 2006-14, $BN
1 Includes execution venues (exchanges, inter-dealer brokers, clearing houses, CCPs) CSDs, custodians and data providers 2 Includes Asset Managers and Hedge Funds Source: Company annual reports, Oliver Wyman proprietary data and analysis
We expect asset managers will be asked to shoulder more regulatory burden, contrary to what many asset managers think, and the question for us really is to what degree? We expect regulators are likely to require some form of stress testing of select funds, expanding what some asset managers have started to do already. Depending on how it is calibrated, this may result in asset managers holding even more liquidity in funds to protect against a tail risk event, as happens with the bank capital rules, even if base liquidity is in line with historical redemptions. To be clear, we are not
advocating bank style regulation for asset managers; rather as we engage with policy makers, there may be a few lessons they feel appropriate to adapt.
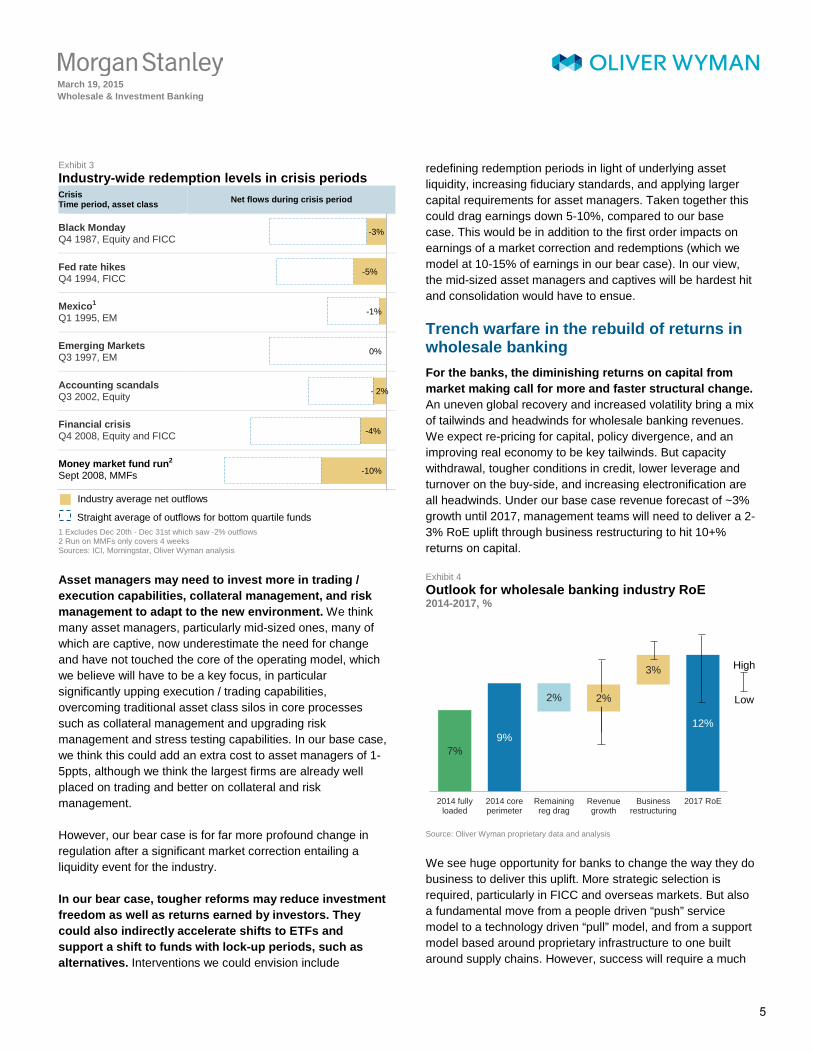
To ground our work and assess the risks from stress tests, we have analysed the periods of worst mutual fund redemptions in the last 35 years from market shocks. Contrary to some perceptions, we cannot find an example of a run on a long-term mutual fund - as opposed to short-term money market funds. The worst period for industry-wide fixed income mutual fund outflows was in 1994 when we saw on average ~5% outflows across the industry in the worst 3 months and ~13% in the worst 12 months. What was striking was that even in the most recent financial crisis bond fund redemptions were only ~4% in the worst 3 months. This compares to average cash holdings of 4% to 7% today across all US corporate bond and high yield funds on latest data, suggesting asset managers are managing risks prudentially today and risks are manageable. In addition, industry data also highlight that liquidity in funds has increased 1-3x during times of stress.
But stress tests may seek to calibrate higher for several reasons. We think that macro-prudential policy makers are most focused on systemic concerns – as they focus on the risks to the flow of credit to the real economy. On that basis, the averages of each category of funds, we think, are plausible for a first set of stress tests. However, if we look at the funds that had the worst redemption experience, outflows for the bottom quarter of funds were closer to 15-20% in the worst 3 months. As we have learned from the bank stress tests, regulators have often calibrated using worst case data. Policy makers we have met are also trying to assess what are the implications of mutual funds owning 3x the share of US credit since 1994 as well as the reversal of the unprecedented monetary stimulus and the impact of reduced secondary market liquidity today. Relevant data doesn’t exist for some of the worst crises, such as 1937. We also think that conduct regulators will be interested in stress tests to ensure funds can deliver on their promises, and so may look at worst quartile of fund outflows rather than the averages that we have used in our base case. Writ large, the question that regulators are trying to assess is whether mutual funds have sufficient cash levels and flexibility to raise cash in a tail risk redemption event given the uncertainty on US QE exit and such diverging monetary policies.
280 265 225
295 320 430
95 9095
2006 2010 2014
MarketInfrastructure
Buy-side
Sell-side
+5%
-15%
+35%
-5%
-5%
+10%
1
2
$670BN $675BN$750BN
4
March 19, 2015 Wholesale & Investment Banking
M O R G A N S T A N L E Y B L U E P A P E R
-10%
-4%
- 2%
0%
-1%
-5%
-3%
Exhibit 3 Industry-wide redemption levels in crisis periods Crisis Time period, asset class Net flows during crisis period
Black Monday Q4 1987, Equity and FICC
Fed rate hikes Q4 1994, FICC
Mexico1 Q1 1995, EM
Emerging Markets Q3 1997, EM
Accounting scandals Q3 2002, Equity
Financial crisis Q4 2008, Equity and FICC
Money market fund run2 Sept 2008, MMFs
Industry average net outflows Straight average of outflows for bottom quartile funds 1 Excludes Dec 20th - Dec 31st which saw -2% outflows 2 Run on MMFs only covers 4 weeks Sources: ICI, Morningstar, Oliver Wyman analysis
Asset managers may need to invest more in trading / execution capabilities, collateral management, and risk management to adapt to the new environment. We think many asset managers, particularly mid-sized ones, many of which are captive, now underestimate the need for change and have not touched the core of the operating model, which we believe will have to be a key focus, in particular significantly upping execution / trading capabilities, overcoming traditional asset class silos in core processes such as collateral management and upgrading risk management and stress testing capabilities. In our base case, we think this could add an extra cost to asset managers of 1-5ppts, although we think the largest firms are already well placed on trading and better on collateral and risk management.
However, our bear case is for far more profound change in regulation after a significant market correction entailing a liquidity event for the industry.
In our bear case, tougher reforms may reduce investment freedom as well as returns earned by investors. They could also indirectly accelerate shifts to ETFs and support a shift to funds with lock-up periods, such as alternatives. Interventions we could envision include
redefining redemption periods in light of underlying asset liquidity, increasing fiduciary standards, and applying larger capital requirements for asset managers. Taken together this could drag earnings down 5-10%, compared to our base case. This would be in addition to the first order impacts on earnings of a market correction and redemptions (which we model at 10-15% of earnings in our bear case). In our view, the mid-sized asset managers and captives will be hardest hit and consolidation would have to ensue.
Trench warfare in the rebuild of returns in wholesale banking For the banks, the diminishing returns on capital from market making call for more and faster structural change. An uneven global recovery and increased volatility bring a mix of tailwinds and headwinds for wholesale banking revenues. We expect re-pricing for capital, policy divergence, and an improving real economy to be key tailwinds. But capacity withdrawal, tougher conditions in credit, lower leverage and turnover on the buy-side, and increasing electronification are all headwinds. Under our base case revenue forecast of ~3% growth until 2017, management teams will need to deliver a 2-3% RoE uplift through business restructuring to hit 10+% returns on capital.
Exhibit 4 Outlook for wholesale banking industry RoE 2014-2017, %
Source: Oliver Wyman proprietary data and analysis
We see huge opportunity for banks to change the way they do business to deliver this uplift. More strategic selection is required, particularly in FICC and overseas markets. But also a fundamental move from a people driven “push” service model to a technology driven “pull” model, and from a support model based around proprietary infrastructure to one built around supply chains. However, success will require a much
7%9%
2% 2%
3%
12%
2014 fullyloaded
2014 coreperimeter
Remainingreg drag
Revenuegrowth
Businessrestructuring
2017 RoE
High
Low
5
March 19, 2015 Wholesale & Investment Banking
M O R G A N S T A N L E Y B L U E P A P E R more structural approach. The opportunity – but also the challenge – is there for the banks that can be decisive and make these changes in the next few years.
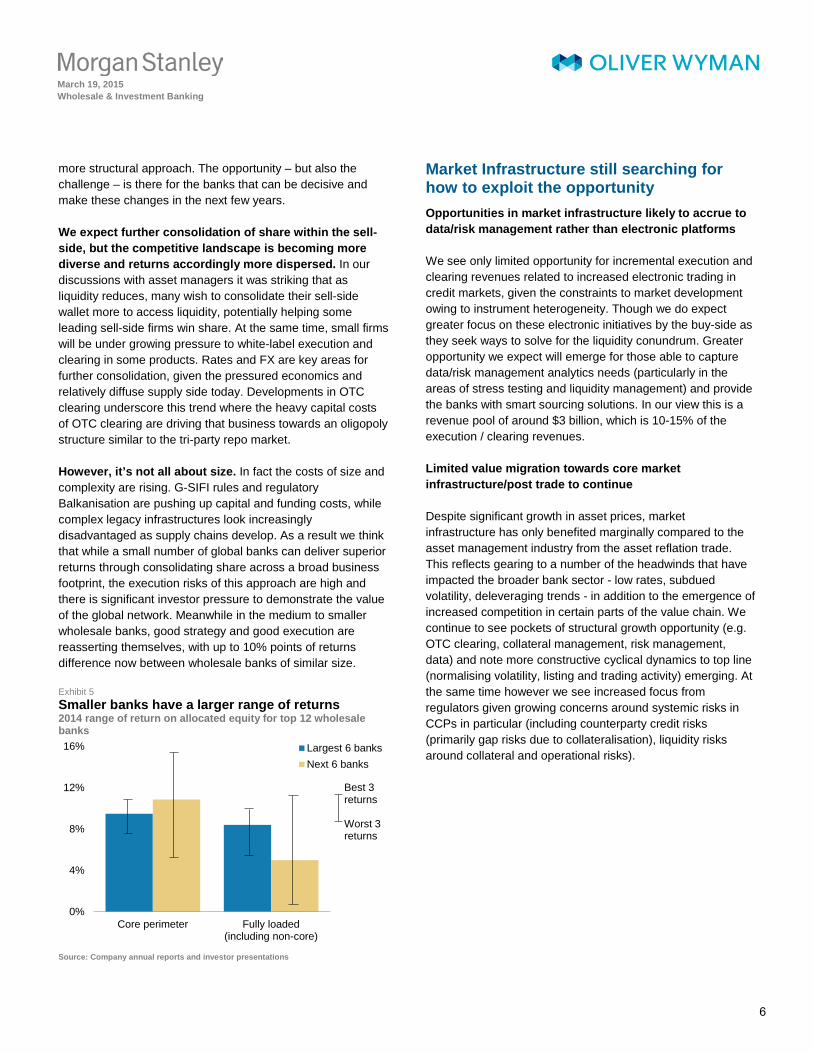
We expect further consolidation of share within the sell-side, but the competitive landscape is becoming more diverse and returns accordingly more dispersed. In our discussions with asset managers it was striking that as liquidity reduces, many wish to consolidate their sell-side wallet more to access liquidity, potentially helping some leading sell-side firms win share. At the same time, small firms will be under growing pressure to white-label execution and clearing in some products. Rates and FX are key areas for further consolidation, given the pressured economics and relatively diffuse supply side today. Developments in OTC clearing underscore this trend where the heavy capital costs of OTC clearing are driving that business towards an oligopoly structure similar to the tri-party repo market.
However, it’s not all about size. In fact the costs of size and complexity are rising. G-SIFI rules and regulatory Balkanisation are pushing up capital and funding costs, while complex legacy infrastructures look increasingly disadvantaged as supply chains develop. As a result we think that while a small number of global banks can deliver superior returns through consolidating share across a broad business footprint, the execution risks of this approach are high and there is significant investor pressure to demonstrate the value of the global network. Meanwhile in the medium to smaller wholesale banks, good strategy and good execution are reasserting themselves, with up to 10% points of returns difference now between wholesale banks of similar size.
Exhibit 5 Smaller banks have a larger range of returns 2014 range of return on allocated equity for top 12 wholesale banks
Source: Company annual reports and investor presentations
Market Infrastructure still searching for how to exploit the opportunity Opportunities in market infrastructure likely to accrue to data/risk management rather than electronic platforms
We see only limited opportunity for incremental execution and clearing revenues related to increased electronic trading in credit markets, given the constraints to market development owing to instrument heterogeneity. Though we do expect greater focus on these electronic initiatives by the buy-side as they seek ways to solve for the liquidity conundrum. Greater opportunity we expect will emerge for those able to capture data/risk management analytics needs (particularly in the areas of stress testing and liquidity management) and provide the banks with smart sourcing solutions. In our view this is a revenue pool of around $3 billion, which is 10-15% of the execution / clearing revenues.
Limited value migration towards core market infrastructure/post trade to continue
Despite significant growth in asset prices, market infrastructure has only benefited marginally compared to the asset management industry from the asset reflation trade. This reflects gearing to a number of the headwinds that have impacted the broader bank sector - low rates, subdued volatility, deleveraging trends - in addition to the emergence of increased competition in certain parts of the value chain. We continue to see pockets of structural growth opportunity (e.g. OTC clearing, collateral management, risk management, data) and note more constructive cyclical dynamics to top line (normalising volatility, listing and trading activity) emerging. At the same time however we see increased focus from regulators given growing concerns around systemic risks in CCPs in particular (including counterparty credit risks (primarily gap risks due to collateralisation), liquidity risks around collateral and operational risks).
0%
4%
8%
12%
16%
Core perimeter Fully loaded(including non-core)
Largest 6 banksNext 6 banks
Best 3 returns
Worst 3 returns
6
March 19, 2015 Wholesale & Investment Banking
M O R G A N S T A N L E Y B L U E P A P E R Policy debates we’ve engaged with banks and asset managers on for this report
During the course of our research for this year’s report we have debated, and had suggested to us, many possible policy steps that could improve the functioning and liquidity of the FICC markets. Given the plethora of in-train regulations that are seeking to improve structure and conduct, there are few simple wins. However, here are a number of suggestions relating to market liquidity that we think have merit to explore and debate further between practitioners and regulators on traded markets.
• Build a roadmap for macro-prudential policy makers to understand holders of credit and maturity terms, and potential risks throughout the system. Encourage better disclosure of tenors, concentrations, leverage, and type and size of liquidity tools employed (cash, lines of credit, swaps, ETFs, high quality liquid assets) to support this understanding.
• Consider running stress tests on select fixed income funds using the industry experience of the last 30 years redemption history. Prioritise based on size, complexity, exposure to thinly traded markets and distribution complexity. Assess benefits of different levels of fund level liquidity versus cost to investors of protecting themselves against a tail risk outflow event. However, in the first instance do not make as complex as bank stress tests given asset managers do not share the systemic risks banks pose. Further investigate the role of asset managers as source of operational risk for the funds they manage.
• Create the conditions to allow greater standardisation of corporate bonds. Investors are holding and trading a wide number of heterogeneous securities. Areas to investigate include standardisation of issuance amounts, coupon dates and maturities (for the very largest issuers), as well as rules and standards. Steps should be incremental and measured as no one would wish to jeopardise the success of debt financing market and the flexibility valued by issuers.
• Ensure regulators have and deploy consistent powers to gate / suspend redemption rights for funds in extremis. For instance, the SEC has granted this power to money market funds, UCITS allows suspension in exceptional circumstances with Board and/or regulator approval.
• Reduce early redemption interests by agreeing commonly accepted valuation / pricing standards (e.g. swing pricing).
• Consider the implications of mark-to-market accounting on institutional investors. Whilst we have found policy makers are focused on mutual funds, given they own less than 30% of credit markets and have no higher than ~5% peak redemptions in any 3 month period in the worst crises of the last 35 years, we think as much attention should be focused on other holders and the risks from MTM accounting on insurers and pension funds.
• Carefully (re-)calibrate post-trade transparency requirements and block trade exemptions. Immediate post-trade transparency requirements (e.g. in TRACE) discourage large order transactions, as buyers that are uncertain of ultimate size become concerned about being run over. The answer to this is to establish block sizes well above retail investor size, and delay reporting on large blocks for T+1 or T+2, in line with the MiFID II proposal. This may give brokers the incentive to take reasonable risk to facilitate client flow.
• Support e-platforms, but expect Request for Quote rather than Central Limit Order Books are more likely to succeed - given 1) low trading volumes, 2) difficulties of matching buy-side to buy-side orders, and 3) heterogeneity of instruments. Other data-driven innovations, such as networks linking potential buyers and sellers, should be welcomed.
• Evaluate the role of ETFs as a cash substitute within portfolio construction, considering the potential benefits (e.g. mitigating the yield drag caused by increasing cash holdings) as well as the potential risks (e.g. of potentially reduced liquidity of some ETFs under stressed market conditions)
• Recognise that inconsistent regulatory practices across regions will lead to different market structure decisions in different geographies. Whilst regulatory convergence could help markets, political economy reasons make harmonisation very unlikely, but heightens the need for increased coordination between regulators.
• Evaluate creating standardised settlement terms and documentation standards for leveraged loans, whilst taking into account the unique financing requirements of companies that rely on the loan market for financing.
7

March 19, 2015 Wholesale & Investment Banking
M O R G A N S T A N L E Y B L U E P A P E R Messages from our Proprietary Survey
Key takeaways from our meetings with senior executives of asset managers representing over $10 trillion of AuM
Investors have heightened concerns about credit market liquidity
• All were increasingly concerned about secondary market liquidity.
• Concerns were not just in high yield and emerging markets but in US and European credit markets given low market liquidity.
• Some also expressed concerns around areas of rates markets and emerging market FX.
• Investors worried about the potential for dislocation when the US raises rates and that ultra-low or negative interest rates are luring even more money into less liquid bonds.
There is little consensus on the solutions for credit markets, but everyone we met had ideas and were working on internal and external solutions
• Some would like issuers to reduce the number of unique securities, while others were concerned about the impact on corporates’ funding structures.
• Most are looking to embrace alternative execution methods (e.g. agency, peer-to-peer, electronic), although they were concerned the heterogeneity of markets would impede them being successful and how to pump prime these platforms.
European firms were more worried than US firms about credit outflows with rate rises
• We suspect this comes from the different structure of retirement savings, where a far higher % of funds in the US are held in sticky 401K plans (where investors can only switch funds rather than outright redeem) whilst a greater % in Europe are invested in discretionary mutual funds. This is critical to address for the Capital Markets Union project to be a success.
Most felt electronic trading won’t resolve the fundamental issues
• All wanted to harness technology to unlock hidden liquidity and improve efficiency. But most felt that this did not address the underlying problem of heterogeneity in instruments and that corporates prize the flexibility that issuing in different currencies, tenors and envelopes (MTNs, private placements, benchmark bonds) offers.
Demand for relaxation/recalibration of transparency requirements
• Need to balance benefits of post-trade transparency with impacts to market liquidity through block trade protection. If dealers did not have to quote size of larger trades or were able to post with a delay, for example, this could improve the current situation which disincentivises dealer intermediation of larger or less liquid trades.
Asset managers are already pulling a variety of levers, but with different levels of intensity
• The majority of firms were looking to concentrate their business on fewer large counterparties to achieve better financing terms, although some were concerned what the impact of this may be in a crisis. Most also looking to pull multiple levers including risk management and thinking about capacity management.
Asset managers crave regulatory coordination, although don’t believe it is coming
• Particularly in Europe, interviewees highlighted that regulators have not agreed on a harmonised approach to handling potential requests for suspension in redemptions, which would be critical for minimising dislocations in a liquidity crisis.
• Interviewees also suggested that common standards for pricing allocation of transaction costs and in-kind redemptions should be reviewed.
We would like to thank the firms and individuals who took the time to meet with us.
8
March 19, 2015 Wholesale & Investment Banking
M O R G A N S T A N L E Y B L U E P A P E R 1. The Liquidity Conundrum 1.1 Liquidity provision is falling further
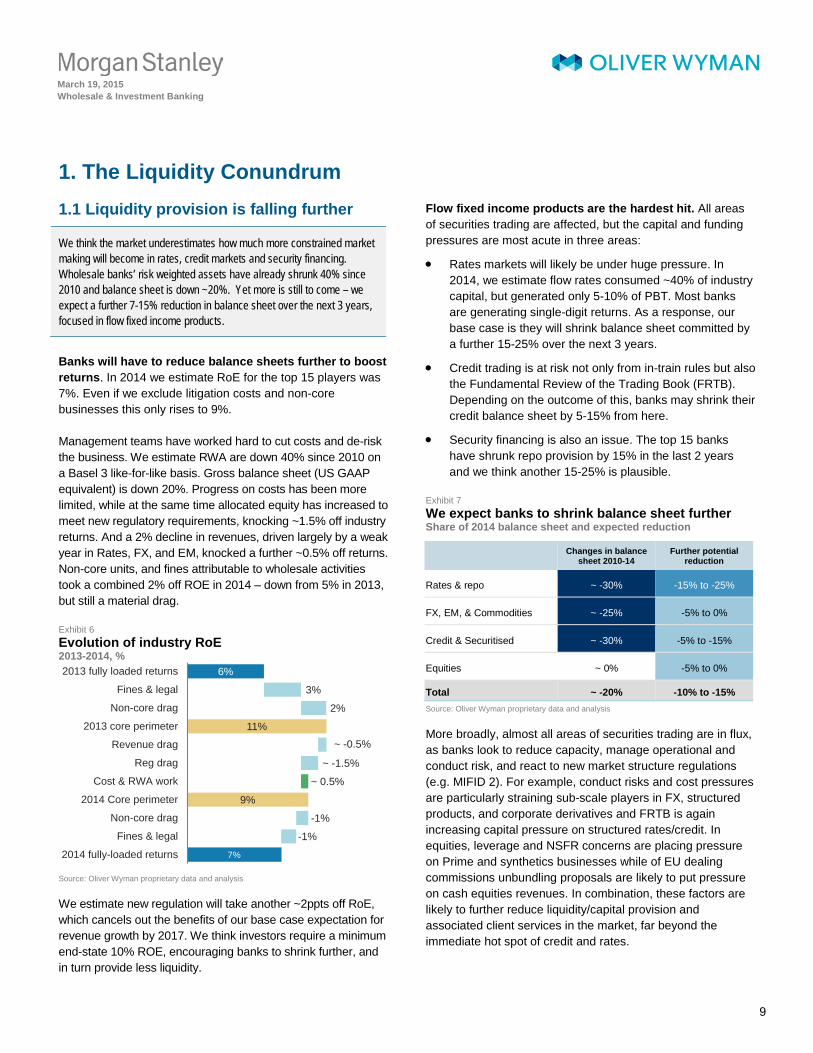
We think the market underestimates how much more constrained market making will become in rates, credit markets and security financing. Wholesale banks’ risk weighted assets have already shrunk 40% since 2010 and balance sheet is down ~20%. Yet more is still to come – we expect a further 7-15% reduction in balance sheet over the next 3 years, focused in flow fixed income products.
Banks will have to reduce balance sheets further to boost returns. In 2014 we estimate RoE for the top 15 players was 7%. Even if we exclude litigation costs and non-core businesses this only rises to 9%.
Management teams have worked hard to cut costs and de-risk the business. We estimate RWA are down 40% since 2010 on a Basel 3 like-for-like basis. Gross balance sheet (US GAAP equivalent) is down 20%. Progress on costs has been more limited, while at the same time allocated equity has increased to meet new regulatory requirements, knocking ~1.5% off industry returns. And a 2% decline in revenues, driven largely by a weak year in Rates, FX, and EM, knocked a further ~0.5% off returns. Non-core units, and fines attributable to wholesale activities took a combined 2% off ROE in 2014 – down from 5% in 2013, but still a material drag.
Exhibit 6 Evolution of industry RoE 2013-2014, %
Source: Oliver Wyman proprietary data and analysis
We estimate new regulation will take another ~2ppts off RoE, which cancels out the benefits of our base case expectation for revenue growth by 2017. We think investors require a minimum end-state 10% ROE, encouraging banks to shrink further, and in turn provide less liquidity.
Flow fixed income products are the hardest hit. All areas of securities trading are affected, but the capital and funding pressures are most acute in three areas:
• Rates markets will likely be under huge pressure. In 2014, we estimate flow rates consumed ~40% of industry capital, but generated only 5-10% of PBT. Most banks are generating single-digit returns. As a response, our base case is they will shrink balance sheet committed by a further 15-25% over the next 3 years.
• Credit trading is at risk not only from in-train rules but also the Fundamental Review of the Trading Book (FRTB). Depending on the outcome of this, banks may shrink their credit balance sheet by 5-15% from here.
• Security financing is also an issue. The top 15 banks have shrunk repo provision by 15% in the last 2 years and we think another 15-25% is plausible.
Exhibit 7 We expect banks to shrink balance sheet further Share of 2014 balance sheet and expected reduction
Changes in balance
sheet 2010-14 Further potential
reduction
Rates & repo ~ -30% -15% to -25%
FX, EM, & Commodities ~ -25% -5% to 0%
Credit & Securitised ~ -30% -5% to -15%
Equities ~ 0% -5% to 0%
Total ~ -20% -10% to -15% Source: Oliver Wyman proprietary data and analysis
More broadly, almost all areas of securities trading are in flux, as banks look to reduce capacity, manage operational and conduct risk, and react to new market structure regulations (e.g. MIFID 2). For example, conduct risks and cost pressures are particularly straining sub-scale players in FX, structured products, and corporate derivatives and FRTB is again increasing capital pressure on structured rates/credit. In equities, leverage and NSFR concerns are placing pressure on Prime and synthetics businesses while of EU dealing commissions unbundling proposals are likely to put pressure on cash equities revenues. In combination, these factors are likely to further reduce liquidity/capital provision and associated client services in the market, far beyond the immediate hot spot of credit and rates.
6%
11%
9%
7%
3%
2%
~ -0.5%
~ -1.5%
~ 0.5%
-1%
-1%
2013 fully loaded returns
Fines & legal
Non-core drag
2013 core perimeter
Revenue drag
Reg drag
Cost & RWA work
2014 Core perimeter
Non-core drag
Fines & legal
2014 fully-loaded returns
9

March 19, 2015 Wholesale & Investment Banking
M O R G A N S T A N L E Y B L U E P A P E R Exhibit 8 Capital required to generate $1 of revenue has greatly increased across wholesale products Estimated dealer financial resource consumption / revenues; 2006-2017E
Note: 1 2006-07 based on Basel II RWA; 2013-14 and 2016-17 based on blended average of leverage exposure and Basel III RWA; Revenue outlook based on base case revenue projections to 2017; 2017. Includes impacts of FRTB, leverage ratios, and structural reform in rates Source: Oliver Wyman proprietary data and analysis
Capital and funding requirements continue to ratchet up as banks deal with additional RWA and leverage pressures. We estimate that by 2017 capital consumption per unit of revenue generated in rates and credit intermediation will have increased 4-6x since pre-crisis levels. The key focus areas in 2015 are:
• RWA reform – FRTB and standardised capital floors potentially increasing risk weighted assets by 10-30% by
2019, if no mitigating actions are taken, in particular affecting credit and structured businesses.
• Stress tests – already the binding constraint on capital for most US banks, and a major challenge for the US operations of European ones. There is an increasing chance of a CCAR-like approach in Europe. Stress tests also constrain banks’ ability to sizeably increase risk or leverage intra-period.
• Leverage ratio – a significant constraint forcing a tougher re-evaluation of where the balance sheet is deployed; we expect an additional 15% to be withdrawn.
• G-SIFI – additional capital charges of 1 to 5ppts for large institutions, with much of this ultimately attributable to wholesale banking businesses.
• NSFR (net stable funding ratio) – increasing the long-term funding requirements, potentially adding $3-5 billion of costs, and in particular affecting rates and equities.
• Structural reform – particularly the non-ring-fenced banks in the UK and intermediate holding companies (IHC) in the US.
Today each bank faces a different set of constraints depending on business mix, footprint and overall group position. But for the industry as a whole we estimate 10-15% of additional capital would be required by 2017 absent further restructuring and deleveraging.
Exhibit 9 New regulations will have significant negative impacts across the range of wholesale products Expected impact on product economics by regulation
Rates & repo FX, EM, &
Commodities Credit &
securitisation Structure fixed
income Equities Impact
FRTB & Capital floors1
• FRTB likely to raise wholesale RWA 10% to 30% • Large impact on credit & structured from Illiquidity modelling rules
Stress tests
• Binding constraint for most in US; increasingly relevant in Europe • Wholesale products often cause large losses in adverse cases
GSIFI add-on
• 1 to 5ppts addition to capital requirements for large institutions • Wholesale banking is a major contributor to size of capital add-on
NSFR • $300-500BN additional stable funding required for derivatives • 10-15% increase in derivative funding cost
Leverage ratio
• Meeting 5% ratio at a wholesale standalone level would require an additional ~50% capital; impacts yet to be fully filtered down to BUs
Very high High Medium Low
1 New floors on RWA requirements as a percentage of standardised approach are still early in development, but likely to raise capital requirements across products with greater impact in Europe Source: Oliver Wyman proprietary data and analysis
Equities
Credit &securitisation
FX, EM, &Commodities
Rates & Repo
2006-072013-142016-17 estimate
x 5-6
x1.5-2
x4-5
~x2
10
March 19, 2015 Wholesale & Investment Banking
M O R G A N S T A N L E Y B L U E P A P E R 1.2 Shift in value and risk
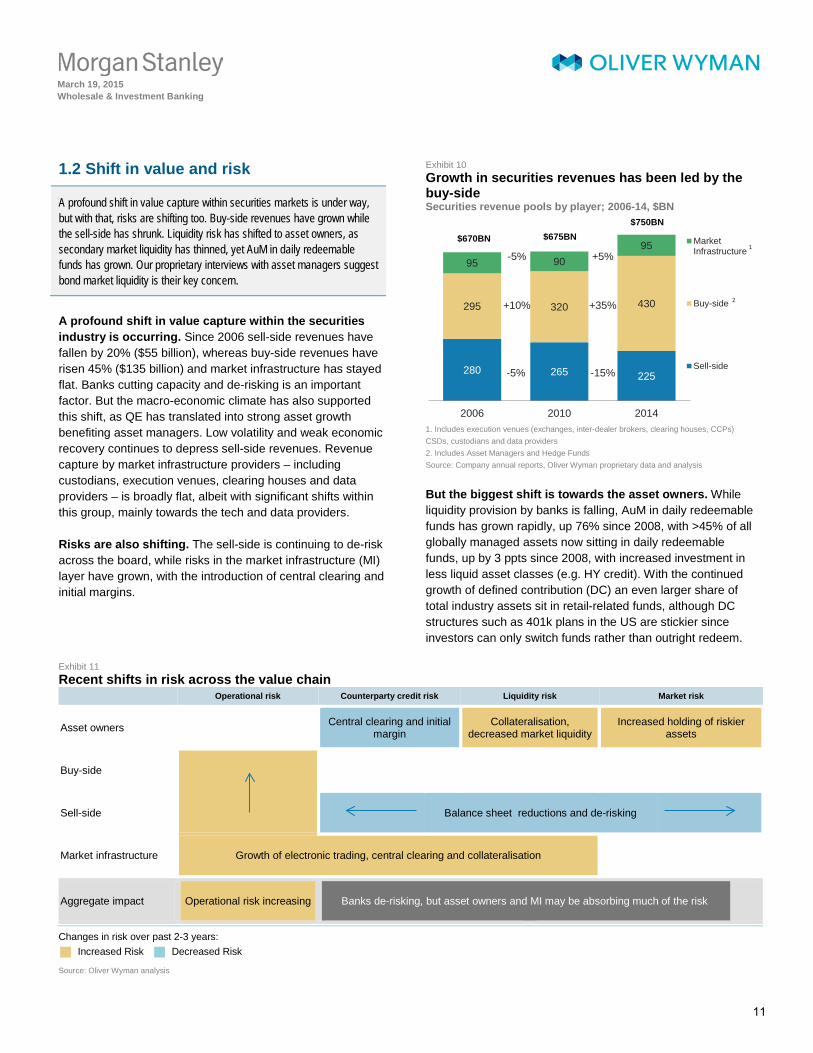
A profound shift in value capture within securities markets is under way, but with that, risks are shifting too. Buy-side revenues have grown while the sell-side has shrunk. Liquidity risk has shifted to asset owners, as secondary market liquidity has thinned, yet AuM in daily redeemable funds has grown. Our proprietary interviews with asset managers suggest bond market liquidity is their key concern.
A profound shift in value capture within the securities industry is occurring. Since 2006 sell-side revenues have fallen by 20% ($55 billion), whereas buy-side revenues have risen 45% ($135 billion) and market infrastructure has stayed flat. Banks cutting capacity and de-risking is an important factor. But the macro-economic climate has also supported this shift, as QE has translated into strong asset growth benefiting asset managers. Low volatility and weak economic recovery continues to depress sell-side revenues. Revenue capture by market infrastructure providers – including custodians, execution venues, clearing houses and data providers – is broadly flat, albeit with significant shifts within this group, mainly towards the tech and data providers.
Risks are also shifting. The sell-side is continuing to de-risk across the board, while risks in the market infrastructure (MI) layer have grown, with the introduction of central clearing and initial margins.
Exhibit 10 Growth in securities revenues has been led by the buy-side Securities revenue pools by player; 2006-14, $BN
1. Includes execution venues (exchanges, inter-dealer brokers, clearing houses, CCPs) CSDs, custodians and data providers 2. Includes Asset Managers and Hedge Funds Source: Company annual reports, Oliver Wyman proprietary data and analysis
But the biggest shift is towards the asset owners. While liquidity provision by banks is falling, AuM in daily redeemable funds has grown rapidly, up 76% since 2008, with >45% of all globally managed assets now sitting in daily redeemable funds, up by 3 ppts since 2008, with increased investment in less liquid asset classes (e.g. HY credit). With the continued growth of defined contribution (DC) an even larger share of total industry assets sit in retail-related funds, although DC structures such as 401k plans in the US are stickier since investors can only switch funds rather than outright redeem.
Exhibit 11 Recent shifts in risk across the value chain
Operational risk Counterparty credit risk Liquidity risk Market risk
Asset owners Central clearing and initial margin
Collateralisation, decreased market liquidity
Increased holding of riskier assets
Buy-side
Sell-side Balance sheet reductions and de-risking
Market infrastructure Growth of electronic trading, central clearing and collateralisation
Aggregate impact Operational risk increasing Banks de-risking, but asset owners and MI may be absorbing much of the risk
Changes in risk over past 2-3 years:
Increased Risk Decreased Risk
Source: Oliver Wyman analysis
280 265 225
295 320 430
95 9095
2006 2010 2014
MarketInfrastructure
Buy-side
Sell-side
+5%
-15%
+35%
-5%
-5%
+10%
1
2
$670BN $675BN$750BN
11
March 19, 2015 Wholesale & Investment Banking
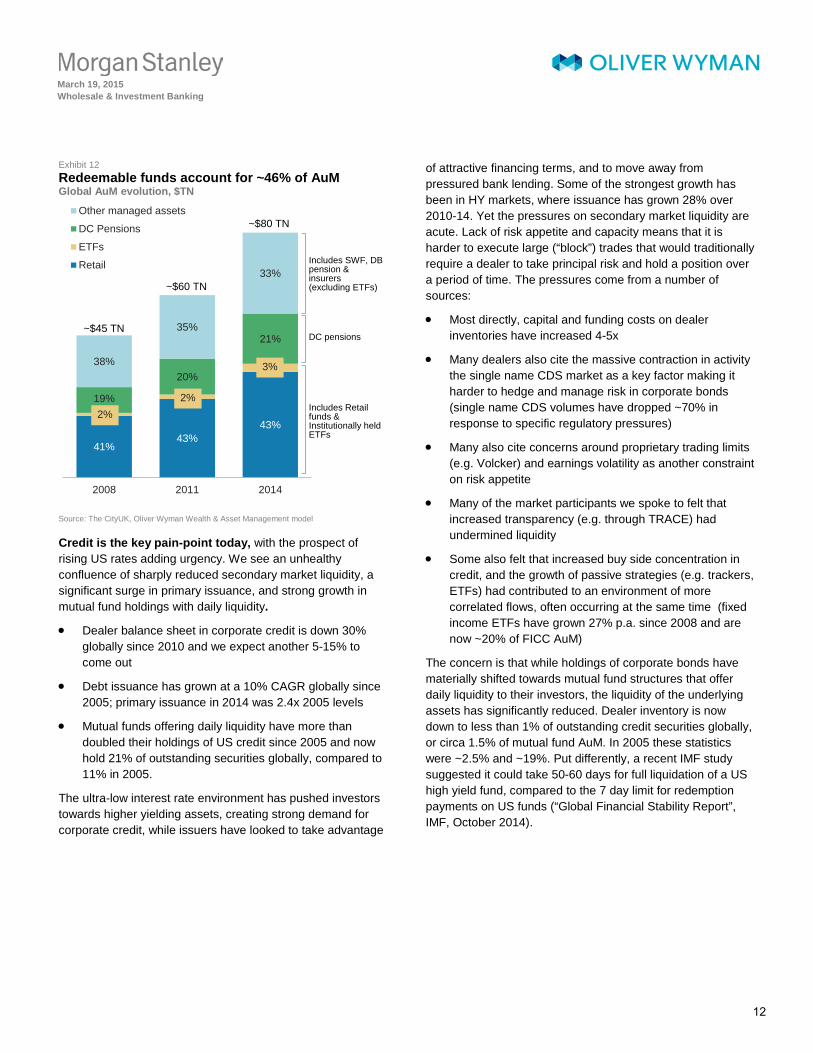
M O R G A N S T A N L E Y B L U E P A P E R Exhibit 12 Redeemable funds account for ~46% of AuM Global AuM evolution, $TN
Source: The CityUK, Oliver Wyman Wealth & Asset Management model
Credit is the key pain-point today, with the prospect of rising US rates adding urgency. We see an unhealthy confluence of sharply reduced secondary market liquidity, a significant surge in primary issuance, and strong growth in mutual fund holdings with daily liquidity.
• Dealer balance sheet in corporate credit is down 30% globally since 2010 and we expect another 5-15% to come out
• Debt issuance has grown at a 10% CAGR globally since 2005; primary issuance in 2014 was 2.4x 2005 levels
• Mutual funds offering daily liquidity have more than doubled their holdings of US credit since 2005 and now hold 21% of outstanding securities globally, compared to 11% in 2005.
The ultra-low interest rate environment has pushed investors towards higher yielding assets, creating strong demand for corporate credit, while issuers have looked to take advantage
of attractive financing terms, and to move away from pressured bank lending. Some of the strongest growth has been in HY markets, where issuance has grown 28% over 2010-14. Yet the pressures on secondary market liquidity are acute. Lack of risk appetite and capacity means that it is harder to execute large (“block”) trades that would traditionally require a dealer to take principal risk and hold a position over a period of time. The pressures come from a number of sources:
• Most directly, capital and funding costs on dealer inventories have increased 4-5x
• Many dealers also cite the massive contraction in activity the single name CDS market as a key factor making it harder to hedge and manage risk in corporate bonds (single name CDS volumes have dropped ~70% in response to specific regulatory pressures)
• Many also cite concerns around proprietary trading limits (e.g. Volcker) and earnings volatility as another constraint on risk appetite
• Many of the market participants we spoke to felt that increased transparency (e.g. through TRACE) had undermined liquidity
• Some also felt that increased buy side concentration in credit, and the growth of passive strategies (e.g. trackers, ETFs) had contributed to an environment of more correlated flows, often occurring at the same time (fixed income ETFs have grown 27% p.a. since 2008 and are now ~20% of FICC AuM)
The concern is that while holdings of corporate bonds have materially shifted towards mutual fund structures that offer daily liquidity to their investors, the liquidity of the underlying assets has significantly reduced. Dealer inventory is now down to less than 1% of outstanding credit securities globally, or circa 1.5% of mutual fund AuM. In 2005 these statistics were ~2.5% and ~19%. Put differently, a recent IMF study suggested it could take 50-60 days for full liquidation of a US high yield fund, compared to the 7 day limit for redemption payments on US funds (“Global Financial Stability Report”, IMF, October 2014).
41%43%
43%19%
20%
21%
19%
20%
21%
38%
35%
33%
2008 2011 2014
Other managed assets
DC Pensions
ETFs
Retail Includes SWF, DB pension & insurers (excluding ETFs)
~$45 TN
~$60 TN
~$80 TN
DC pensions
2%Includes Retail funds & Institutionally held ETFs
2%
3%
12
March 19, 2015 Wholesale & Investment Banking
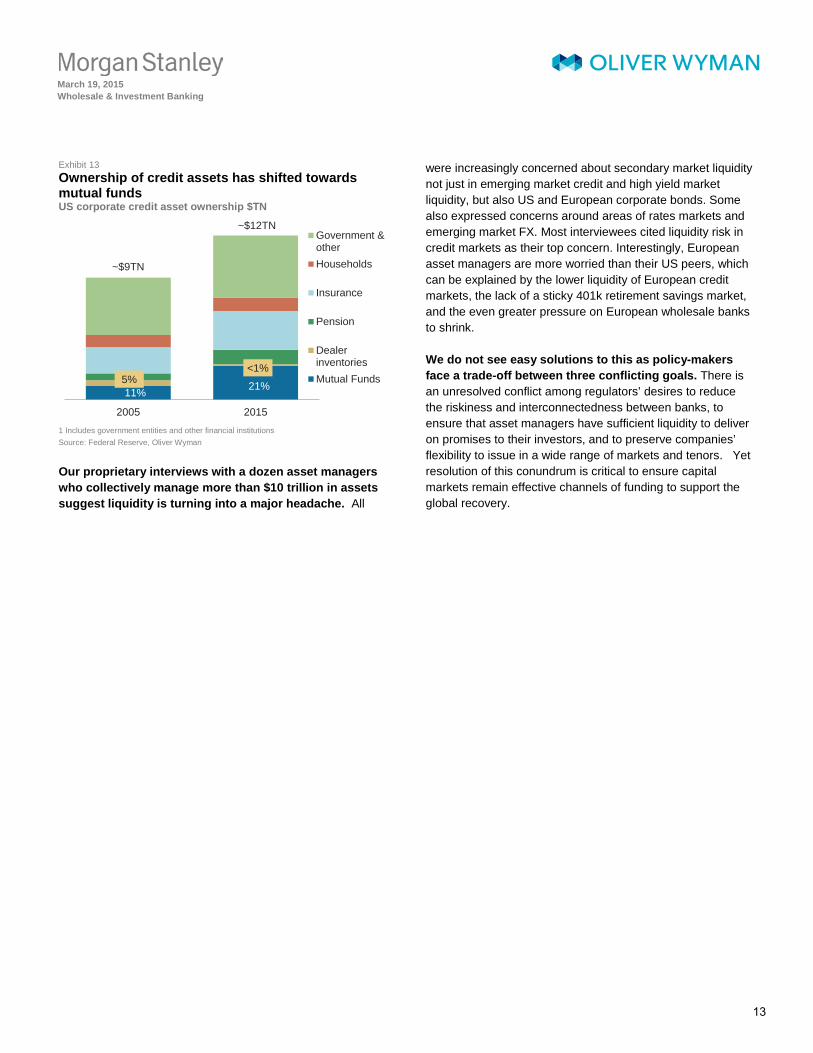
M O R G A N S T A N L E Y B L U E P A P E R Exhibit 13 Ownership of credit assets has shifted towards mutual funds US corporate credit asset ownership $TN
1 Includes government entities and other financial institutions Source: Federal Reserve, Oliver Wyman
Our proprietary interviews with a dozen asset managers who collectively manage more than $10 trillion in assets suggest liquidity is turning into a major headache. All
were increasingly concerned about secondary market liquidity not just in emerging market credit and high yield market liquidity, but also US and European corporate bonds. Some also expressed concerns around areas of rates markets and emerging market FX. Most interviewees cited liquidity risk in credit markets as their top concern. Interestingly, European asset managers are more worried than their US peers, which can be explained by the lower liquidity of European credit markets, the lack of a sticky 401k retirement savings market, and the even greater pressure on European wholesale banks to shrink.
We do not see easy solutions to this as policy-makers face a trade-off between three conflicting goals. There is an unresolved conflict among regulators’ desires to reduce the riskiness and interconnectedness between banks, to ensure that asset managers have sufficient liquidity to deliver on promises to their investors, and to preserve companies’ flexibility to issue in a wide range of markets and tenors. Yet resolution of this conundrum is critical to ensure capital markets remain effective channels of funding to support the global recovery.
2005 2015
Government &otherHouseholds
Insurance
Pension
DealerinventoriesMutual Funds
<1%5%11% 21%
~$9TN
~$12TN
13
March 19, 2015 Wholesale & Investment Banking
M O R G A N S T A N L E Y B L U E P A P E R Capital Markets Union and Market Structure
The crisis has taught us that Europe sorely needs a more diverse funding market for corporates and infrastructure. The problem is an over-reliance on lending by banks, whose balance sheets remain four times the size of the currency zone’s gross domestic product – far larger than elsewhere in the west. Insolvency regimes are also complex and inconsistent, limiting appetite for cross-border lending. We need to find new ways to channel non-bank finance to businesses and infrastructure projects, which will require some significant changes to Europe’s market plumbing as well as the approach of policy makers to markets.
But the Capital Markets Union also requires credit markets that function well, and the findings of this report about the lack of liquidity will need to be addressed for the CMU to be a vibrant success. In part as the next set of issues in Europe that the Commission is keen to promote are related to funding of mid-sized companies.
We see several legs to the CMU agenda
First, mid-sized companies need to be able to tap long-term savings via a pan European private placement market that gives them access to long-term competitively priced funding. In the US, 80% of long-term company finance is provided by investors; in the Eurozone it is 30%. But our work has highlighted the importance of finding the right buyers and creating a secondary market that supports the primary issuance, although we are realistic about liquidity likely being very thin in this market.
Second, it is not just about providing cheaper debt. Europe’s growing companies also need access to the equity market, from venture capital through to listed equity.
Third, the Commission should also lay out plans for project bonds for infrastructure, perhaps along the lines of North American municipal bond markets. Banks have traditionally played a major role in funding infrastructure, but new Basel rules strongly disincentivise this. Given the EU itself estimates it may need €1 trillion to finance such projects by 2020, a strong focus is
needed to develop the right bond structure, transparency and tax treatment. Again, our work underscores the need to find the right buyers given lack of liquidity in these instruments.
Fourth, enabling banks to sell small business loans directly to investors could also provide a boost to lending capacity, but post-crisis rules make this far more difficult. Thoughtful recalibration of the regulations, along lines that the ECB and the Bank of England are already investigating, could give banks more capacity to lend to SMEs. This said, the presence of the 4 year TLTRO and continuation of the UK’s Funding for Lending – both helpful schemes – mean in reality we are unlikely to see an opening up of private sector SME securitisation when central bank subsidised funding is far cheaper.
Fifth, as peer-to-peer lending continues to grow, we need a strong regulatory framework ensuring that investors are aware of the risks being taken.
Sixth – and perhaps most importantly – to reduce the cost of funding for countries in southern Europe we should also focus on clearing some of the roadblocks that hold up flows of credit. An obvious one would be to narrow the massive differences in bankruptcy procedures. For example, it can take 5 to 10 years to recover bad debts in the Italian courts. In some other countries, the same work can be completed in two years. If one of Europe’s challenges is to ensure capital is moved more swiftly from unproductive assets to ones that can help drive Europe’s economic growth, tackling very long-tailed insolvency regimes is critically important.
For more on our views on this topic see
“Europe needs a more flexible financial market: Europe needs to channel non-bank funding to businesses and infrastructure”, argues Huw van Steenis, Financial Times, September 30, 2014) and “Unlocking funding for European investment and growth”, Oliver Wyman for AFME, 2014
14
March 19, 2015 Wholesale & Investment Banking
M O R G A N S T A N L E Y B L U E P A P E R 1.3 Electronic markets and new execution models are only a partial answer
There are a host of initiatives under way to increase electronic trading, establish new data networks and create new marketplaces. We expect continued growth, and believe they can be helpful in supporting market efficiency and improving dealer economics. However, we believe that there are limits to how far and how fast change can occur, and the extent to which these can help address liquidity concerns.
Fixed income markets are entering a period of accelerating market structure change. A confluence of forces is driving this:
• Economic pressures on dealers
• Client concerns around liquidity
• A desire to manage conduct risks relating to sales and trading activities
• Mandated electronic trading (SEFs under Dodd-Frank and OTFs under MIFID / EMIR)
• New pre- and post-trade reporting requirements
• Advances in technology
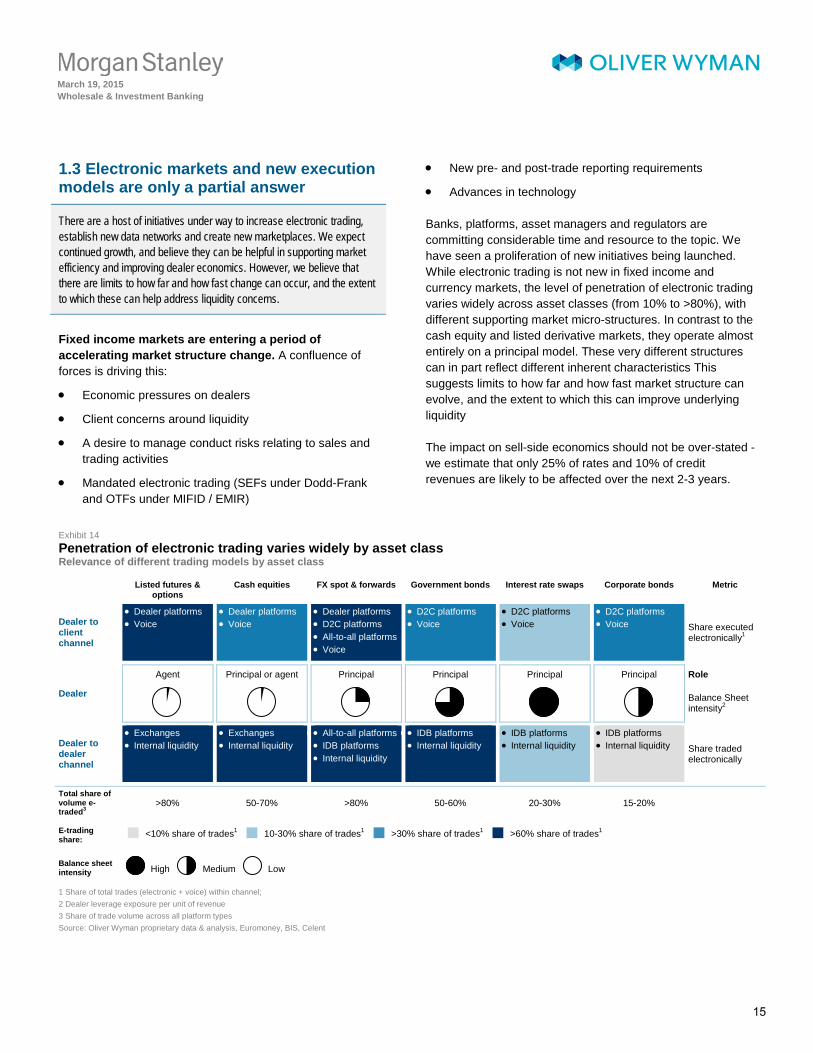
Banks, platforms, asset managers and regulators are committing considerable time and resource to the topic. We have seen a proliferation of new initiatives being launched. While electronic trading is not new in fixed income and currency markets, the level of penetration of electronic trading varies widely across asset classes (from 10% to >80%), with different supporting market micro-structures. In contrast to the cash equity and listed derivative markets, they operate almost entirely on a principal model. These very different structures can in part reflect different inherent characteristics This suggests limits to how far and how fast market structure can evolve, and the extent to which this can improve underlying liquidity
The impact on sell-side economics should not be over-stated - we estimate that only 25% of rates and 10% of credit revenues are likely to be affected over the next 2-3 years.
Exhibit 14 Penetration of electronic trading varies widely by asset class Relevance of different trading models by asset class
Listed futures & options
Cash equities FX spot & forwards Government bonds Interest rate swaps Corporate bonds Metric
Dealer to client channel
• Dealer platforms • Voice
• Dealer platforms • Voice
• Dealer platforms • D2C platforms • All-to-all platforms • Voice
• D2C platforms • Voice
• D2C platforms • Voice
• D2C platforms • Voice Share executed
electronically1
Dealer
Agent Principal or agent Principal Principal Principal Principal Role
Balance Sheet intensity2
Dealer to dealer channel
• Exchanges • Internal liquidity
• • Exchanges • Internal liquidity
• • All-to-all platforms • IDB platforms • Internal liquidity
• • IDB platforms • Internal liquidity
• IDB platforms • Internal liquidity
• IDB platforms • Internal liquidity Share traded
electronically
Total share of volume e-traded3
>80% 50-70% >80% 50-60% 20-30% 15-20%
E-trading share: <10% share of trades1 10-30% share of trades1 >30% share of trades1 >60% share of trades1
Balance sheet intensity High Medium Low 1 Share of total trades (electronic + voice) within channel; 2 Dealer leverage exposure per unit of revenue 3 Share of trade volume across all platform types Source: Oliver Wyman proprietary data & analysis, Euromoney, BIS, Celent
15
March 19, 2015 Wholesale & Investment Banking
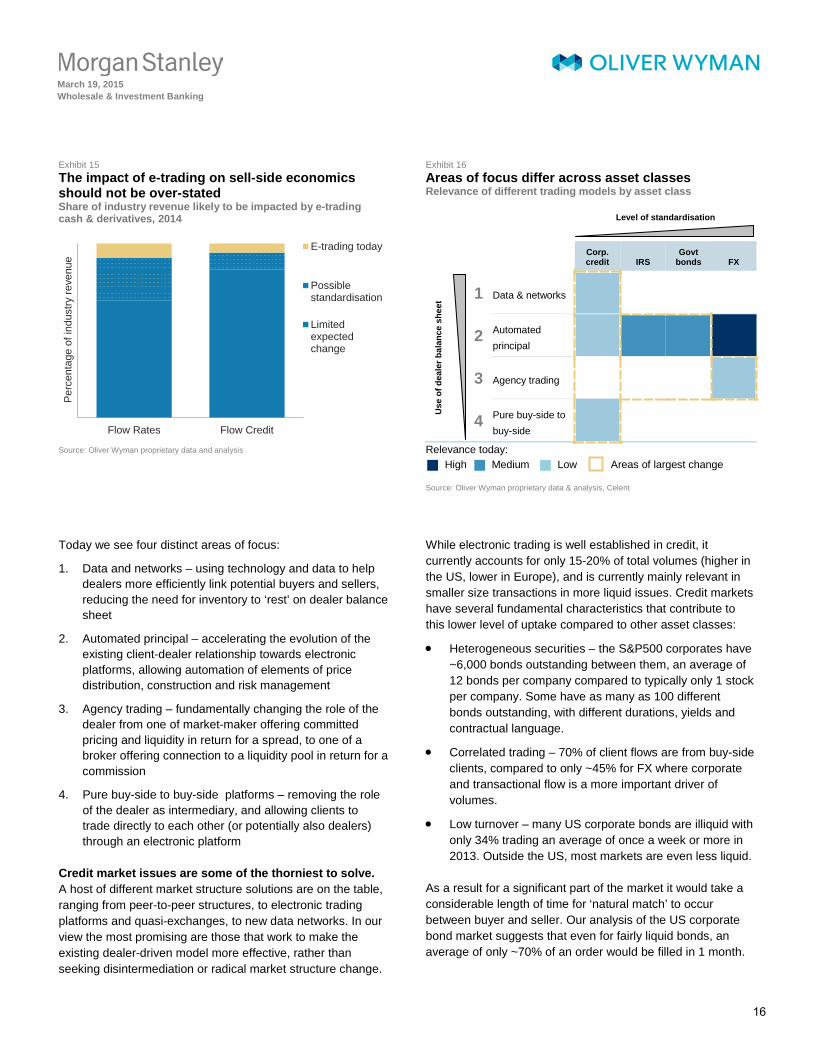
M O R G A N S T A N L E Y B L U E P A P E R Exhibit 15 The impact of e-trading on sell-side economics should not be over-stated Share of industry revenue likely to be impacted by e-trading cash & derivatives, 2014
Source: Oliver Wyman proprietary data and analysis
Exhibit 16 Areas of focus differ across asset classes Relevance of different trading models by asset class
Level of standardisation
Corp. credit IRS
Govt bonds FX
Use
of d
eale
r bal
ance
she
et
1 Data & networks
2 Automated principal
3 Agency trading
4 Pure buy-side to buy-side
Relevance today:
High Medium Low Areas of largest change
Source: Oliver Wyman proprietary data & analysis, Celent
Today we see four distinct areas of focus:
1. Data and networks – using technology and data to help dealers more efficiently link potential buyers and sellers, reducing the need for inventory to ‘rest’ on dealer balance sheet
2. Automated principal – accelerating the evolution of the existing client-dealer relationship towards electronic platforms, allowing automation of elements of price distribution, construction and risk management
3. Agency trading – fundamentally changing the role of the dealer from one of market-maker offering committed pricing and liquidity in return for a spread, to one of a broker offering connection to a liquidity pool in return for a commission
4. Pure buy-side to buy-side platforms – removing the role of the dealer as intermediary, and allowing clients to trade directly to each other (or potentially also dealers) through an electronic platform
Credit market issues are some of the thorniest to solve. A host of different market structure solutions are on the table, ranging from peer-to-peer structures, to electronic trading platforms and quasi-exchanges, to new data networks. In our view the most promising are those that work to make the existing dealer-driven model more effective, rather than seeking disintermediation or radical market structure change.
While electronic trading is well established in credit, it currently accounts for only 15-20% of total volumes (higher in the US, lower in Europe), and is currently mainly relevant in smaller size transactions in more liquid issues. Credit markets have several fundamental characteristics that contribute to this lower level of uptake compared to other asset classes:
• Heterogeneous securities – the S&P500 corporates have ~6,000 bonds outstanding between them, an average of 12 bonds per company compared to typically only 1 stock per company. Some have as many as 100 different bonds outstanding, with different durations, yields and contractual language.
• Correlated trading – 70% of client flows are from buy-side clients, compared to only ~45% for FX where corporate and transactional flow is a more important driver of volumes.
• Low turnover – many US corporate bonds are illiquid with only 34% trading an average of once a week or more in 2013. Outside the US, most markets are even less liquid.
As a result for a significant part of the market it would take a considerable length of time for ‘natural match’ to occur between buyer and seller. Our analysis of the US corporate bond market suggests that even for fairly liquid bonds, an average of only ~70% of an order would be filled in 1 month.
Flow Rates Flow Credit
Perc
enta
ge o
f ind
ustry
reve
nue
E-trading today
Possiblestandardisation
Limitedexpectedchange
16
March 19, 2015 Wholesale & Investment Banking
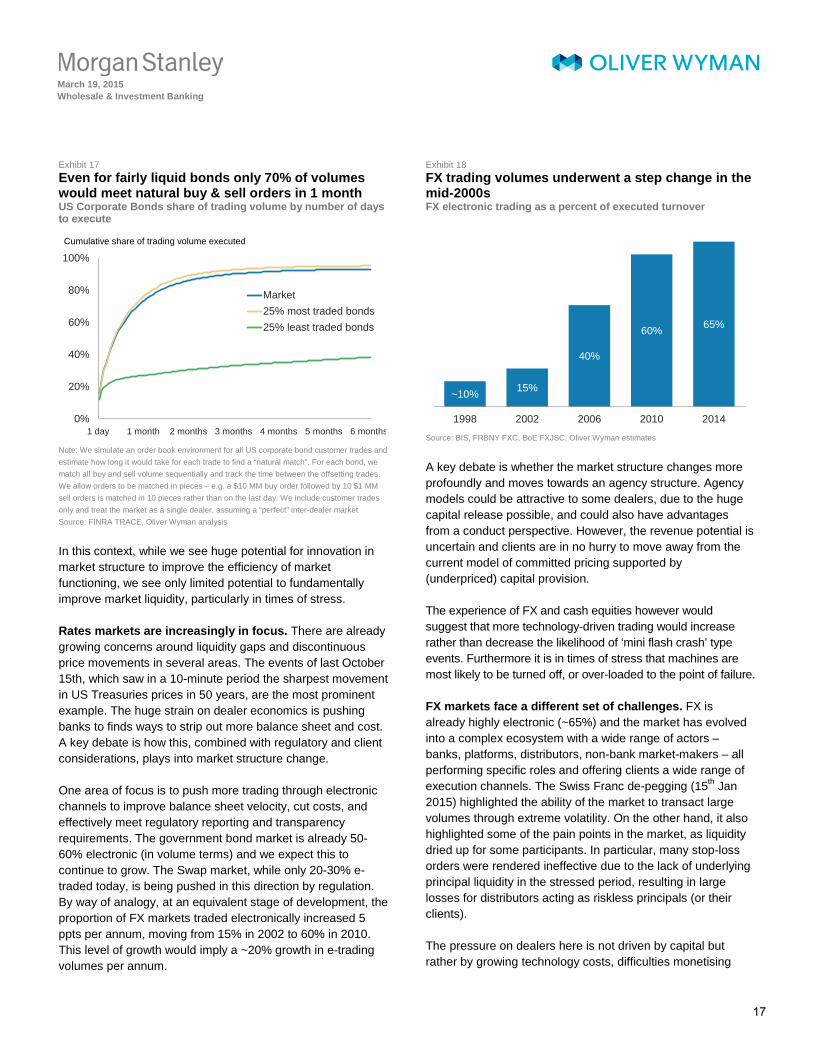
M O R G A N S T A N L E Y B L U E P A P E R Exhibit 17 Even for fairly liquid bonds only 70% of volumes would meet natural buy & sell orders in 1 month US Corporate Bonds share of trading volume by number of days to execute
Note: We simulate an order book environment for all US corporate bond customer trades and estimate how long it would take for each trade to find a “natural match”. For each bond, we match all buy and sell volume sequentially and track the time between the offsetting trades. We allow orders to be matched in pieces – e.g. a $10 MM buy order followed by 10 $1 MM sell orders is matched in 10 pieces rather than on the last day. We include customer trades only and treat the market as a single dealer, assuming a “perfect” inter-dealer market Source: FINRA TRACE, Oliver Wyman analysis
In this context, while we see huge potential for innovation in market structure to improve the efficiency of market functioning, we see only limited potential to fundamentally improve market liquidity, particularly in times of stress.
Rates markets are increasingly in focus. There are already growing concerns around liquidity gaps and discontinuous price movements in several areas. The events of last October 15th, which saw in a 10-minute period the sharpest movement in US Treasuries prices in 50 years, are the most prominent example. The huge strain on dealer economics is pushing banks to finds ways to strip out more balance sheet and cost. A key debate is how this, combined with regulatory and client considerations, plays into market structure change.
One area of focus is to push more trading through electronic channels to improve balance sheet velocity, cut costs, and effectively meet regulatory reporting and transparency requirements. The government bond market is already 50-60% electronic (in volume terms) and we expect this to continue to grow. The Swap market, while only 20-30% e-traded today, is being pushed in this direction by regulation. By way of analogy, at an equivalent stage of development, the proportion of FX markets traded electronically increased 5 ppts per annum, moving from 15% in 2002 to 60% in 2010. This level of growth would imply a ~20% growth in e-trading volumes per annum.
Exhibit 18 FX trading volumes underwent a step change in the mid-2000s FX electronic trading as a percent of executed turnover
Source: BIS, FRBNY FXC, BoE FXJSC, Oliver Wyman estimates
A key debate is whether the market structure changes more profoundly and moves towards an agency structure. Agency models could be attractive to some dealers, due to the huge capital release possible, and could also have advantages from a conduct perspective. However, the revenue potential is uncertain and clients are in no hurry to move away from the current model of committed pricing supported by (underpriced) capital provision.
The experience of FX and cash equities however would suggest that more technology-driven trading would increase rather than decrease the likelihood of ‘mini flash crash’ type events. Furthermore it is in times of stress that machines are most likely to be turned off, or over-loaded to the point of failure.
FX markets face a different set of challenges. FX is already highly electronic (~65%) and the market has evolved into a complex ecosystem with a wide range of actors – banks, platforms, distributors, non-bank market-makers – all performing specific roles and offering clients a wide range of execution channels. The Swiss Franc de-pegging (15th Jan 2015) highlighted the ability of the market to transact large volumes through extreme volatility. On the other hand, it also highlighted some of the pain points in the market, as liquidity dried up for some participants. In particular, many stop-loss orders were rendered ineffective due to the lack of underlying principal liquidity in the stressed period, resulting in large losses for distributors acting as riskless principals (or their clients).
The pressure on dealers here is not driven by capital but rather by growing technology costs, difficulties monetising
0%
20%
40%
60%
80%
100%
Market25% most traded bonds25% least traded bonds
1 day 2 months1 month 3 months 4 months 5 months 6 months
Cumulative share of trading volume executed
~10% 15%
40%
60% 65%
1998 2002 2006 2010 2014
17

March 19, 2015 Wholesale & Investment Banking
M O R G A N S T A N L E Y B L U E P A P E R flow and the need to manage conduct and operational risks. A key debate is the extent to which agency models can be adopted. Agency models exist at small scale within FX today, but there is growing focus on their potential application to certain transaction types (e.g. fixing orders). Broader take-up of an agency model could offer a cheaper and lower risk way for some banks (and non-banks) to distribute prices to their end clients. Yet most asset managers we spoke with are
comfortable with the current level of principal based liquidity provision. Furthermore, withdrawal of more banks from the role of market making could create greater systemic reliance on a narrower set of banks, and on non-bank liquidity providers.
18
March 19, 2015 Wholesale & Investment Banking
M O R G A N S T A N L E Y B L U E P A P E R 2. Impact on Asset Managers
2.1 Growing regulatory risks for asset managers As liquidity risks have shifted towards asset owners and the buy-side, the focus moves towards the available tools for policy makers to respond. The greatest area of uncertainty is around Asset Managers. Our base case is for the introduction of stress tests for some funds and a range of incremental measures. However, we see risks of a more wide-ranging regulatory response, most likely including higher fiduciary and capital standards that would have a heavier impact on long run asset manager earnings.
Regulatory focus on asset managers is likely to increase. As risks have shifted and continue to build in the system, the focus moves towards the available tools for policy makers to face these challenges. There are four potential avenues to explore:
• Bank capital and funding rules
• Market structure rules
• Regulation of funds and/or fund managers
• Changes to issuer profile to drive standardisation
We believe there is very little potential for relaxation of new capital and funding rules for the banks. Many of these rules have only recently been adopted, and some are still being implemented. We see no appetite from regulators to revisit this topic, and the desire to ensure the bank system is well-capitalised and stable remains paramount.
We are hopeful that liquidity concerns will play into careful calibration of market structure rules, as potential benefits of improved transparency are weighed against potentially adverse impacts on liquidity. Key areas include: calibration of block trading exemptions; requirements for pre / post trade transparency; product eligibility for mandatory electronic trading and clearing.
Action to standardise bond markets, while potentially beneficial to corporate credit market secondary liquidity, could impose costs on issuers by reducing flexibility. And material standardisation (e.g. of maturities) is likely only relevant for subset of the market - the very largest and most frequent issuers. As such, in line with the Fair and Effective Markets Review (FEMR), while we see some movement in this direction as potentially helpful, this is no panacea.
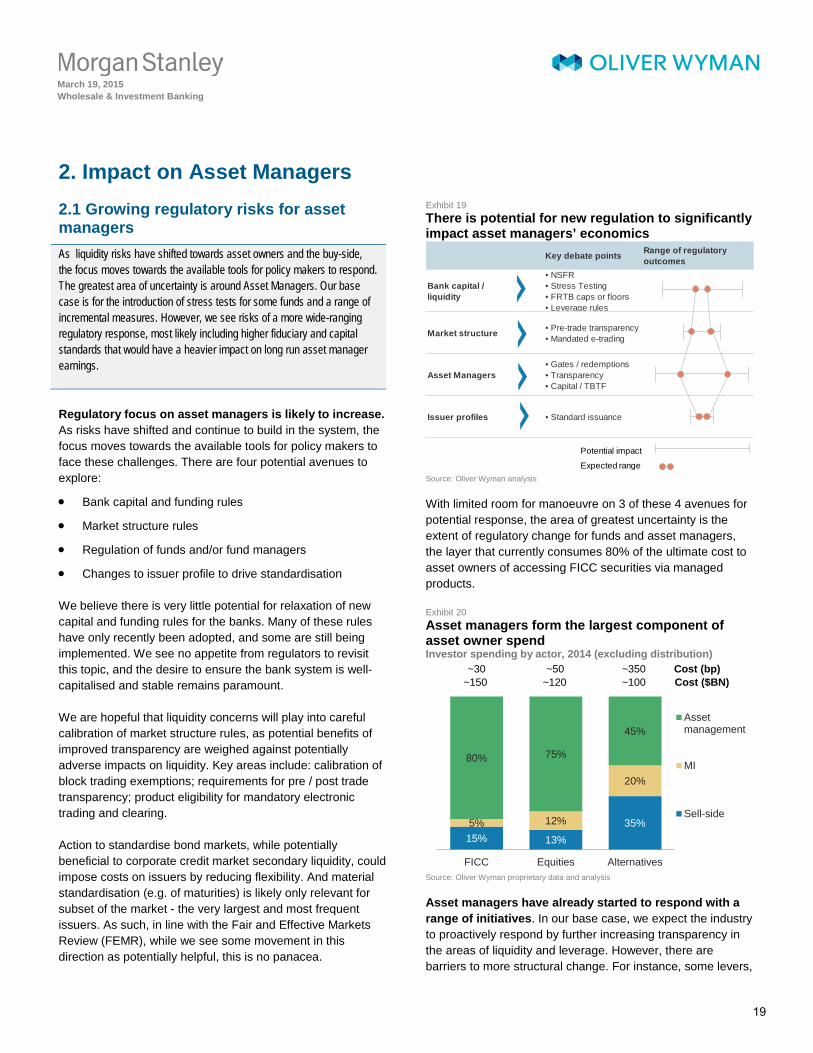
Exhibit 19 There is potential for new regulation to significantly impact asset managers’ economics
Source: Oliver Wyman analysis
With limited room for manoeuvre on 3 of these 4 avenues for potential response, the area of greatest uncertainty is the extent of regulatory change for funds and asset managers, the layer that currently consumes 80% of the ultimate cost to asset owners of accessing FICC securities via managed products.
Exhibit 20 Asset managers form the largest component of asset owner spend Investor spending by actor, 2014 (excluding distribution)
Source: Oliver Wyman proprietary data and analysis
Asset managers have already started to respond with a range of initiatives. In our base case, we expect the industry to proactively respond by further increasing transparency in the areas of liquidity and leverage. However, there are barriers to more structural change. For instance, some levers,
Key debate points Range of regulatory
outcomes
Bank capital / liquidity
• NSFR• Stress Testing• FRTB caps or floors• Leverage rules
Market structure • Pre-trade transparency• Mandated e-trading
Asset Managers• Gates / redemptions• Transparency• Capital / TBTF
Issuer profiles • Standard issuance
Potential impact
Expected range
15% 13%35%5% 12%
20%
80% 75%
45%
FICC Equities Alternatives
Assetmanagement
MI
Sell-side
Cost (bp)Cost ($BN)
~30~150
~50~120
~350~100
19
March 19, 2015 Wholesale & Investment Banking
M O R G A N S T A N L E Y B L U E P A P E R
-10%
-4%
- 2%
0%
-1%
-5%
-3%
such as higher cash shares, would result in a performance drag. Others, such as introducing redemption gates would reduce investor flexibility, and could even trigger a run. The industry therefore faces a collective action problem, as managers seek to avoid first mover disadvantage.
Equally, regulators face difficult tradeoffs as they seek to find an appropriate response across the available levers. In light of the recent FSB/IOSCO discussion on NBNI G-SIFI, we expect regulators in our base case to primarily respond by enforcing stress tests on select funds and possibly asset managers.
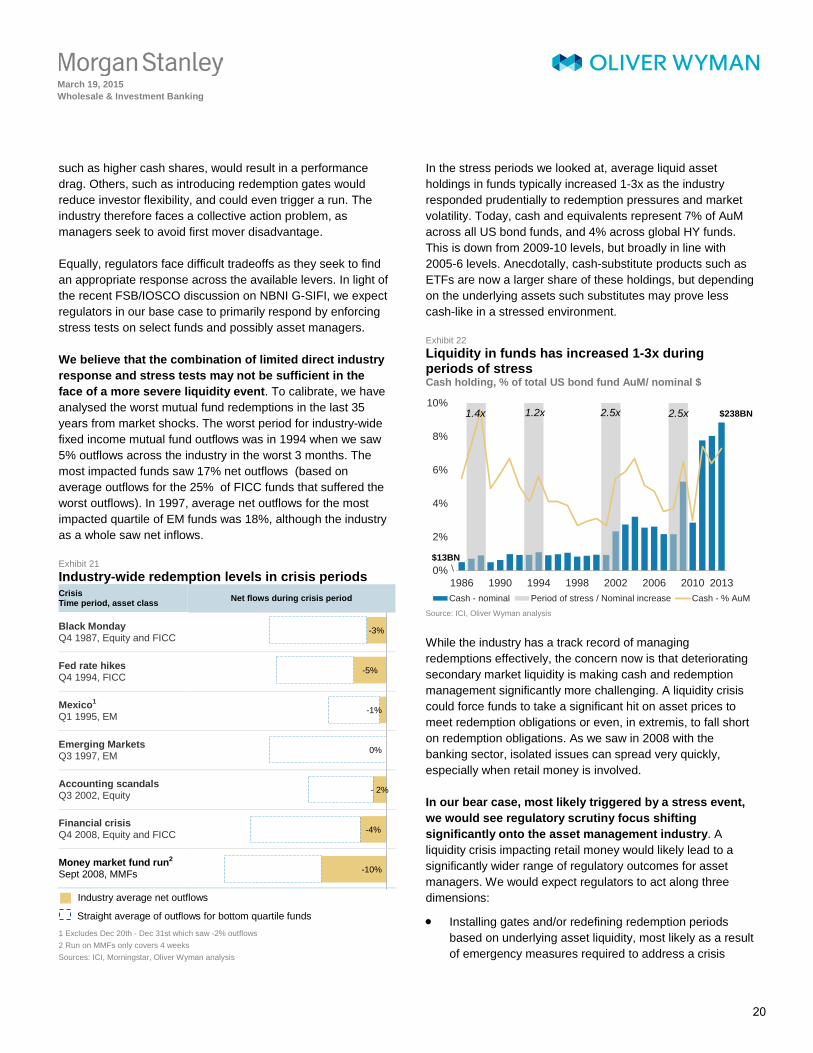
We believe that the combination of limited direct industry response and stress tests may not be sufficient in the face of a more severe liquidity event. To calibrate, we have analysed the worst mutual fund redemptions in the last 35 years from market shocks. The worst period for industry-wide fixed income mutual fund outflows was in 1994 when we saw 5% outflows across the industry in the worst 3 months. The most impacted funds saw 17% net outflows (based on average outflows for the 25% of FICC funds that suffered the worst outflows). In 1997, average net outflows for the most impacted quartile of EM funds was 18%, although the industry as a whole saw net inflows.
Exhibit 21 Industry-wide redemption levels in crisis periods Crisis Time period, asset class Net flows during crisis period
Black Monday Q4 1987, Equity and FICC
Fed rate hikes Q4 1994, FICC
Mexico1 Q1 1995, EM
Emerging Markets Q3 1997, EM
Accounting scandals Q3 2002, Equity
Financial crisis Q4 2008, Equity and FICC
Money market fund run2 Sept 2008, MMFs
Industry average net outflows Straight average of outflows for bottom quartile funds 1 Excludes Dec 20th - Dec 31st which saw -2% outflows 2 Run on MMFs only covers 4 weeks Sources: ICI, Morningstar, Oliver Wyman analysis
In the stress periods we looked at, average liquid asset holdings in funds typically increased 1-3x as the industry responded prudentially to redemption pressures and market volatility. Today, cash and equivalents represent 7% of AuM across all US bond funds, and 4% across global HY funds. This is down from 2009-10 levels, but broadly in line with 2005-6 levels. Anecdotally, cash-substitute products such as ETFs are now a larger share of these holdings, but depending on the underlying assets such substitutes may prove less cash-like in a stressed environment.
Exhibit 22 Liquidity in funds has increased 1-3x during periods of stress Cash holding, % of total US bond fund AuM/ nominal $
Source: ICI, Oliver Wyman analysis
While the industry has a track record of managing redemptions effectively, the concern now is that deteriorating secondary market liquidity is making cash and redemption management significantly more challenging. A liquidity crisis could force funds to take a significant hit on asset prices to meet redemption obligations or even, in extremis, to fall short on redemption obligations. As we saw in 2008 with the banking sector, isolated issues can spread very quickly, especially when retail money is involved.
In our bear case, most likely triggered by a stress event, we would see regulatory scrutiny focus shifting significantly onto the asset management industry. A liquidity crisis impacting retail money would likely lead to a significantly wider range of regulatory outcomes for asset managers. We would expect regulators to act along three dimensions:
• Installing gates and/or redefining redemption periods based on underlying asset liquidity, most likely as a result of emergency measures required to address a crisis
0%
2%
4%
6%
8%
10%
1986 1990 1994 1998 2002 2006 2010 2013Cash - nominal Period of stress / Nominal increase Cash - % AuM
$13BN
$238BN1.4x 1.2x 2.5x 2.5x
20
March 19, 2015 Wholesale & Investment Banking
M O R G A N S T A N L E Y B L U E P A P E R • Significantly increasing fiduciary standards
• Increasing capital requirements for asset managers
The earnings impact for traditional asset managers would be substantial in such a scenario. We estimate this additional regulatory cost burden would damage long run asset manager earnings by 5-10%. Longer redemption periods could accelerate shifts to ETFs, which are deemed more liquid, and support a shift to funds with lock-up periods, such as alternatives. In terms of fiduciary standards, beyond higher controls requirements, regulators would likely install elevated requirements for the product manufacturers. This would create new costs for the industry, to understand distribution practices as well as the suitability for end investors to a much larger extent than in MiFID II. As a consequence of these increased fiduciary standards we expect that asset managers will have to hold larger capital bases dampening returns even further.
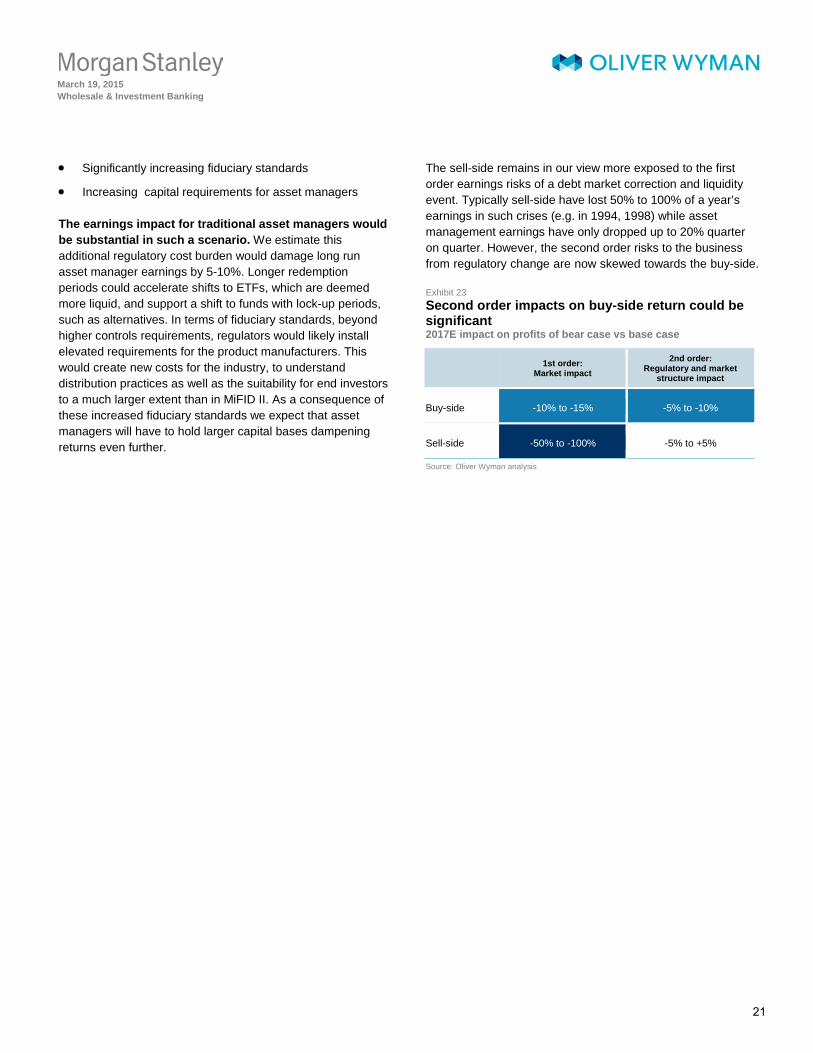
The sell-side remains in our view more exposed to the first order earnings risks of a debt market correction and liquidity event. Typically sell-side have lost 50% to 100% of a year’s earnings in such crises (e.g. in 1994, 1998) while asset management earnings have only dropped up to 20% quarter on quarter. However, the second order risks to the business from regulatory change are now skewed towards the buy-side.
Exhibit 23 Second order impacts on buy-side return could be significant 2017E impact on profits of bear case vs base case
1st order:
Market impact 2nd order:
Regulatory and market structure impact
Buy-side -10% to -15% -5% to -10%
Sell-side -50% to -100% -5% to +5%
Source: Oliver Wyman analysis
21
March 19, 2015 Wholesale & Investment Banking
M O R G A N S T A N L E Y B L U E P A P E R 2.2 Rising operational costs and consolidation
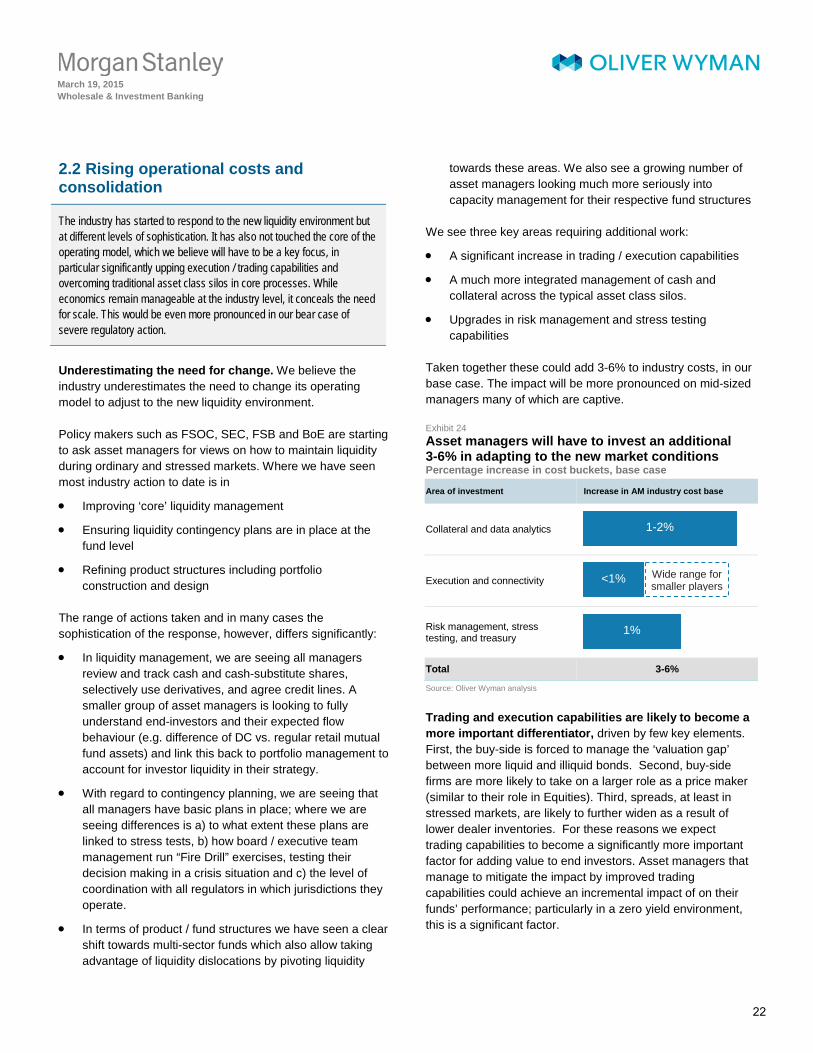
The industry has started to respond to the new liquidity environment but at different levels of sophistication. It has also not touched the core of the operating model, which we believe will have to be a key focus, in particular significantly upping execution / trading capabilities and overcoming traditional asset class silos in core processes. While economics remain manageable at the industry level, it conceals the need for scale. This would be even more pronounced in our bear case of severe regulatory action.
Underestimating the need for change. We believe the industry underestimates the need to change its operating model to adjust to the new liquidity environment.
Policy makers such as FSOC, SEC, FSB and BoE are starting to ask asset managers for views on how to maintain liquidity during ordinary and stressed markets. Where we have seen most industry action to date is in
• Improving ‘core’ liquidity management
• Ensuring liquidity contingency plans are in place at the fund level
• Refining product structures including portfolio construction and design
The range of actions taken and in many cases the sophistication of the response, however, differs significantly:
• In liquidity management, we are seeing all managers review and track cash and cash-substitute shares, selectively use derivatives, and agree credit lines. A smaller group of asset managers is looking to fully understand end-investors and their expected flow behaviour (e.g. difference of DC vs. regular retail mutual fund assets) and link this back to portfolio management to account for investor liquidity in their strategy.
• With regard to contingency planning, we are seeing that all managers have basic plans in place; where we are seeing differences is a) to what extent these plans are linked to stress tests, b) how board / executive team management run “Fire Drill” exercises, testing their decision making in a crisis situation and c) the level of coordination with all regulators in which jurisdictions they operate.
• In terms of product / fund structures we have seen a clear shift towards multi-sector funds which also allow taking advantage of liquidity dislocations by pivoting liquidity
towards these areas. We also see a growing number of asset managers looking much more seriously into capacity management for their respective fund structures
We see three key areas requiring additional work:
• A significant increase in trading / execution capabilities
• A much more integrated management of cash and collateral across the typical asset class silos.
• Upgrades in risk management and stress testing capabilities
Taken together these could add 3-6% to industry costs, in our base case. The impact will be more pronounced on mid-sized managers many of which are captive.
Exhibit 24 Asset managers will have to invest an additional 3-6% in adapting to the new market conditions Percentage increase in cost buckets, base case
Area of investment Increase in AM industry cost base
Collateral and data analytics
Execution and connectivity
Risk management, stress testing, and treasury
Total 3-6%
Source: Oliver Wyman analysis
Trading and execution capabilities are likely to become a more important differentiator, driven by few key elements. First, the buy-side is forced to manage the ‘valuation gap’ between more liquid and illiquid bonds. Second, buy-side firms are more likely to take on a larger role as a price maker (similar to their role in Equities). Third, spreads, at least in stressed markets, are likely to further widen as a result of lower dealer inventories. For these reasons we expect trading capabilities to become a significantly more important factor for adding value to end investors. Asset managers that manage to mitigate the impact by improved trading capabilities could achieve an incremental impact of on their funds’ performance; particularly in a zero yield environment, this is a significant factor.
1-2%
<1% Wide range for smaller players
1%
22
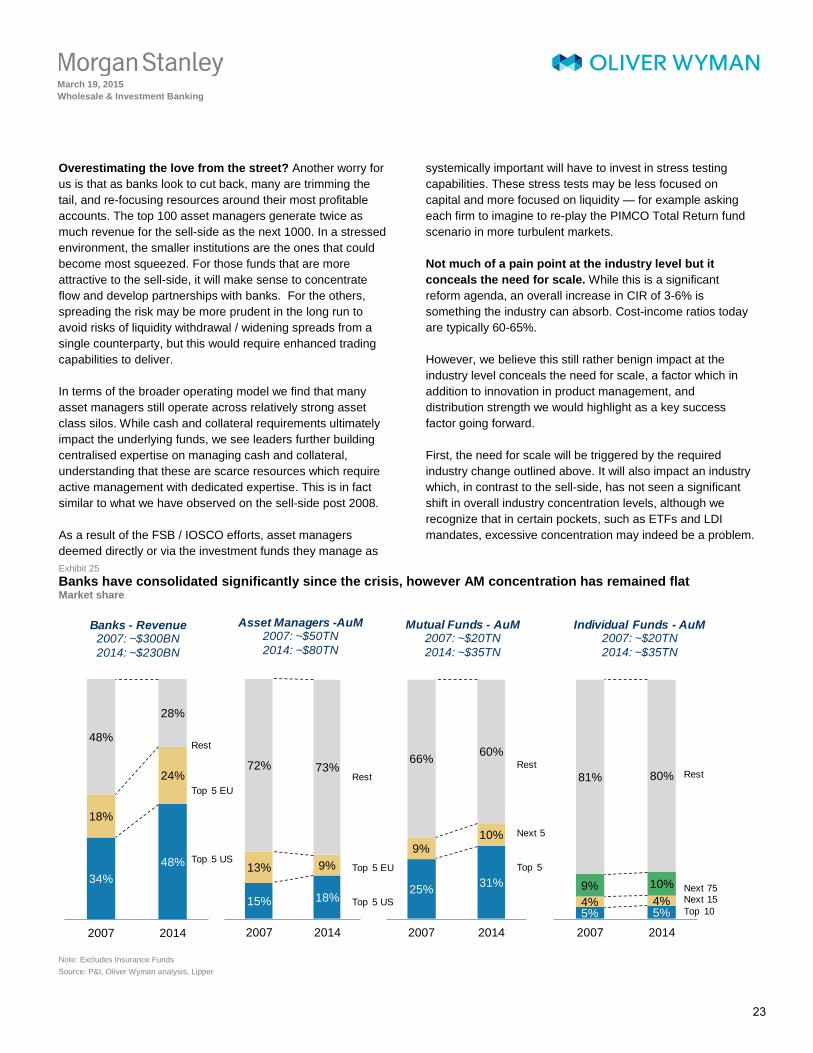
March 19, 2015 Wholesale & Investment Banking
M O R G A N S T A N L E Y B L U E P A P E R Overestimating the love from the street? Another worry for us is that as banks look to cut back, many are trimming the tail, and re-focusing resources around their most profitable accounts. The top 100 asset managers generate twice as much revenue for the sell-side as the next 1000. In a stressed environment, the smaller institutions are the ones that could become most squeezed. For those funds that are more attractive to the sell-side, it will make sense to concentrate flow and develop partnerships with banks. For the others, spreading the risk may be more prudent in the long run to avoid risks of liquidity withdrawal / widening spreads from a single counterparty, but this would require enhanced trading capabilities to deliver.
In terms of the broader operating model we find that many asset managers still operate across relatively strong asset class silos. While cash and collateral requirements ultimately impact the underlying funds, we see leaders further building centralised expertise on managing cash and collateral, understanding that these are scarce resources which require active management with dedicated expertise. This is in fact similar to what we have observed on the sell-side post 2008.
As a result of the FSB / IOSCO efforts, asset managers deemed directly or via the investment funds they manage as
systemically important will have to invest in stress testing capabilities. These stress tests may be less focused on capital and more focused on liquidity — for example asking each firm to imagine to re-play the PIMCO Total Return fund scenario in more turbulent markets.
Not much of a pain point at the industry level but it conceals the need for scale. While this is a significant reform agenda, an overall increase in CIR of 3-6% is something the industry can absorb. Cost-income ratios today are typically 60-65%.
However, we believe this still rather benign impact at the industry level conceals the need for scale, a factor which in addition to innovation in product management, and distribution strength we would highlight as a key success factor going forward.
First, the need for scale will be triggered by the required industry change outlined above. It will also impact an industry which, in contrast to the sell-side, has not seen a significant shift in overall industry concentration levels, although we recognize that in certain pockets, such as ETFs and LDI mandates, excessive concentration may indeed be a problem.
Exhibit 25 Banks have consolidated significantly since the crisis, however AM concentration has remained flat Market share
Note: Excludes Insurance Funds Source: P&I, Oliver Wyman analysis, Lipper
15% 18%
13% 9%
72% 73%
2007 2014
Asset Managers -AuM2007: ~$50TN2014: ~$80TN
Rest
Top 5 EU
Top 5 US
34%48%
18%
24%
48%
28%
2007 2014
Banks - Revenue2007: ~$300BN2014: ~$230BN
Rest
Top 5 EU
Top 5 US
25% 31%
9%10%
66% 60%
2007 2014
Mutual Funds - AuM2007: ~$20TN2014: ~$35TN
Rest
Next 5
Top 5
5% 5%4% 4%9% 10%
81% 80%
2007 2014
Individual Funds - AuM2007: ~$20TN2014: ~$35TN
Rest
Next 75Next 15Top 10
23
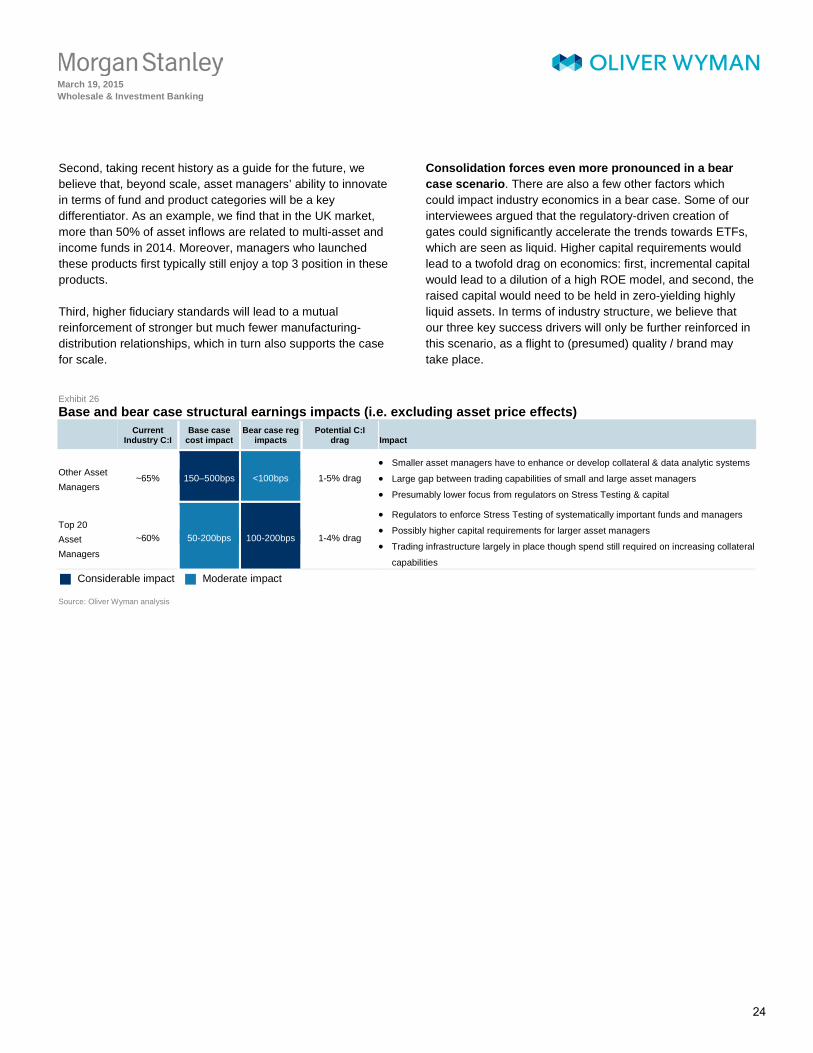
March 19, 2015 Wholesale & Investment Banking
M O R G A N S T A N L E Y B L U E P A P E R Second, taking recent history as a guide for the future, we believe that, beyond scale, asset managers’ ability to innovate in terms of fund and product categories will be a key differentiator. As an example, we find that in the UK market, more than 50% of asset inflows are related to multi-asset and income funds in 2014. Moreover, managers who launched these products first typically still enjoy a top 3 position in these products.
Third, higher fiduciary standards will lead to a mutual reinforcement of stronger but much fewer manufacturing-distribution relationships, which in turn also supports the case for scale.
Consolidation forces even more pronounced in a bear case scenario. There are also a few other factors which could impact industry economics in a bear case. Some of our interviewees argued that the regulatory-driven creation of gates could significantly accelerate the trends towards ETFs, which are seen as liquid. Higher capital requirements would lead to a twofold drag on economics: first, incremental capital would lead to a dilution of a high ROE model, and second, the raised capital would need to be held in zero-yielding highly liquid assets. In terms of industry structure, we believe that our three key success drivers will only be further reinforced in this scenario, as a flight to (presumed) quality / brand may take place.
Exhibit 26 Base and bear case structural earnings impacts (i.e. excluding asset price effects)
Current
Industry C:I Base case
cost impact Bear case reg
impacts Potential C:I
drag Impact
Other Asset Managers
~65% 150–500bps <100bps 1-5% drag
• Smaller asset managers have to enhance or develop collateral & data analytic systems
• Large gap between trading capabilities of small and large asset managers
• Presumably lower focus from regulators on Stress Testing & capital
Top 20 Asset Managers
~60% 50-200bps 100-200bps 1-4% drag
• Regulators to enforce Stress Testing of systematically important funds and managers
• Possibly higher capital requirements for larger asset managers
• Trading infrastructure largely in place though spend still required on increasing collateral
capabilities
Considerable impact Moderate impact
Source: Oliver Wyman analysis
24
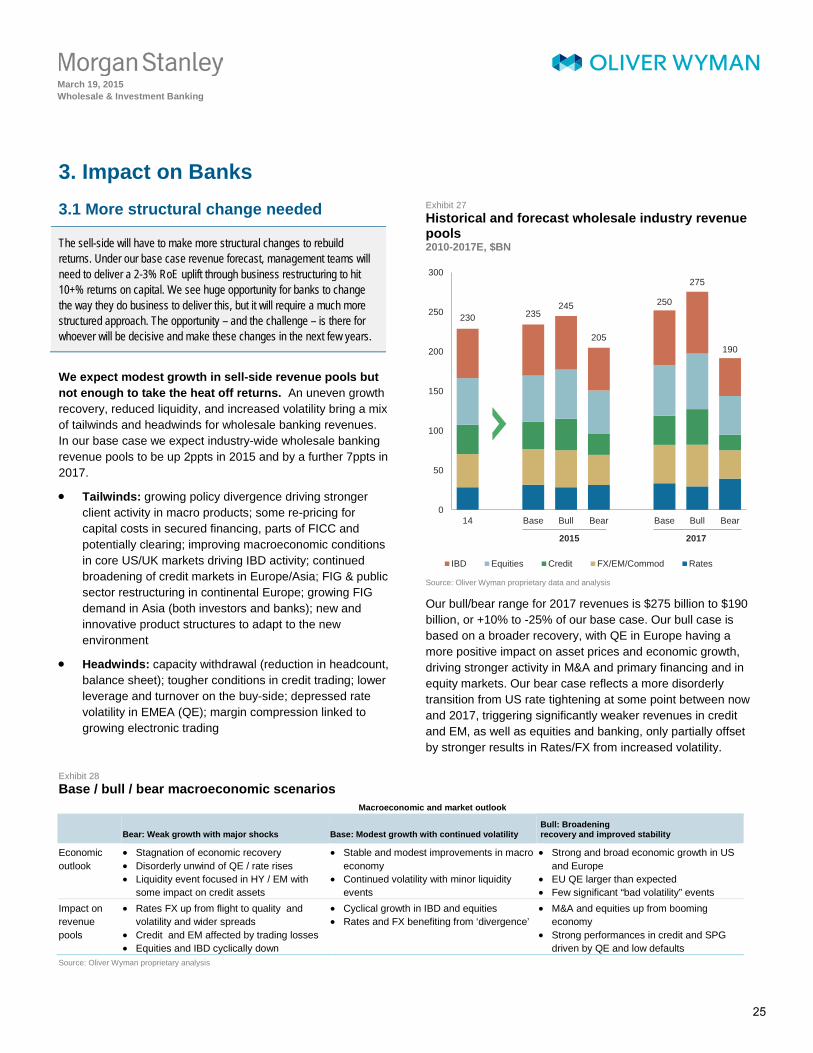
March 19, 2015 Wholesale & Investment Banking
M O R G A N S T A N L E Y B L U E P A P E R 3. Impact on Banks 3.1 More structural change needed
The sell-side will have to make more structural changes to rebuild returns. Under our base case revenue forecast, management teams will need to deliver a 2-3% RoE uplift through business restructuring to hit 10+% returns on capital. We see huge opportunity for banks to change the way they do business to deliver this, but it will require a much more structured approach. The opportunity – and the challenge – is there for whoever will be decisive and make these changes in the next few years.
We expect modest growth in sell-side revenue pools but not enough to take the heat off returns. An uneven growth recovery, reduced liquidity, and increased volatility bring a mix of tailwinds and headwinds for wholesale banking revenues. In our base case we expect industry-wide wholesale banking revenue pools to be up 2ppts in 2015 and by a further 7ppts in 2017.
• Tailwinds: growing policy divergence driving stronger client activity in macro products; some re-pricing for capital costs in secured financing, parts of FICC and potentially clearing; improving macroeconomic conditions in core US/UK markets driving IBD activity; continued broadening of credit markets in Europe/Asia; FIG & public sector restructuring in continental Europe; growing FIG demand in Asia (both investors and banks); new and innovative product structures to adapt to the new environment
• Headwinds: capacity withdrawal (reduction in headcount, balance sheet); tougher conditions in credit trading; lower leverage and turnover on the buy-side; depressed rate volatility in EMEA (QE); margin compression linked to growing electronic trading
Exhibit 27 Historical and forecast wholesale industry revenue pools 2010-2017E, $BN
Source: Oliver Wyman proprietary data and analysis
Our bull/bear range for 2017 revenues is $275 billion to $190 billion, or +10% to -25% of our base case. Our bull case is based on a broader recovery, with QE in Europe having a more positive impact on asset prices and economic growth, driving stronger activity in M&A and primary financing and in equity markets. Our bear case reflects a more disorderly transition from US rate tightening at some point between now and 2017, triggering significantly weaker revenues in credit and EM, as well as equities and banking, only partially offset by stronger results in Rates/FX from increased volatility.
Exhibit 28 Base / bull / bear macroeconomic scenarios Macroeconomic and market outlook
Bear: Weak growth with major shocks Base: Modest growth with continued volatility Bull: Broadening recovery and improved stability
Economic outlook
• Stagnation of economic recovery • Disorderly unwind of QE / rate rises • Liquidity event focused in HY / EM with
some impact on credit assets
• Stable and modest improvements in macro economy
• Continued volatility with minor liquidity events
• Strong and broad economic growth in US and Europe
• EU QE larger than expected • Few significant “bad volatility” events
Impact on revenue pools
• Rates FX up from flight to quality and volatility and wider spreads
• Credit and EM affected by trading losses • Equities and IBD cyclically down
• Cyclical growth in IBD and equities • Rates and FX benefiting from ‘divergence’
• M&A and equities up from booming economy
• Strong performances in credit and SPG driven by QE and low defaults
Source: Oliver Wyman proprietary analysis
230 235245
205
250
275
190
0
50
100
150
200
250
300
14 Base Bull Bear Base Bull Bear
IBD Equities Credit FX/EM/Commod Rates
20172015
25
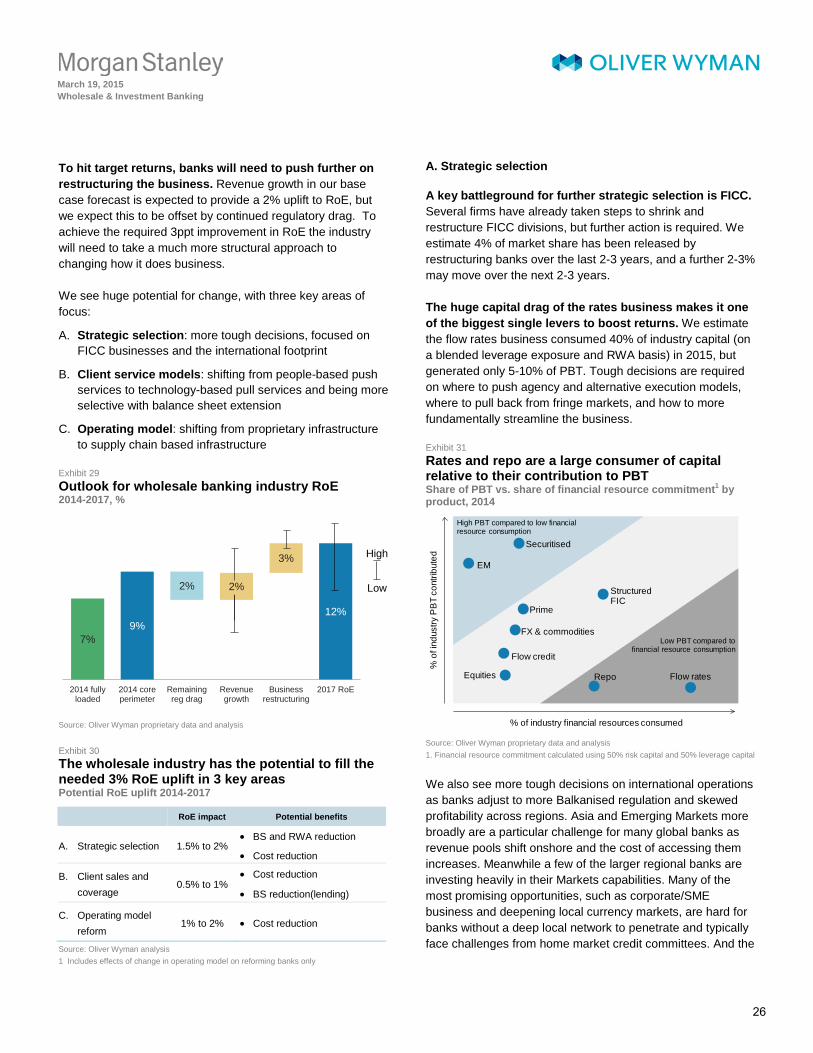
March 19, 2015 Wholesale & Investment Banking
M O R G A N S T A N L E Y B L U E P A P E R To hit target returns, banks will need to push further on restructuring the business. Revenue growth in our base case forecast is expected to provide a 2% uplift to RoE, but we expect this to be offset by continued regulatory drag. To achieve the required 3ppt improvement in RoE the industry will need to take a much more structural approach to changing how it does business.
We see huge potential for change, with three key areas of focus:
A. Strategic selection: more tough decisions, focused on FICC businesses and the international footprint
B. Client service models: shifting from people-based push services to technology-based pull services and being more selective with balance sheet extension
C. Operating model: shifting from proprietary infrastructure to supply chain based infrastructure
Exhibit 29 Outlook for wholesale banking industry RoE 2014-2017, %
Source: Oliver Wyman proprietary data and analysis
Exhibit 30 The wholesale industry has the potential to fill the needed 3% RoE uplift in 3 key areas Potential RoE uplift 2014-2017
RoE impact Potential benefits
A. Strategic selection 1.5% to 2% • BS and RWA reduction
• Cost reduction
B. Client sales and coverage
0.5% to 1% • Cost reduction
• BS reduction(lending)
C. Operating model reform
1% to 2% • Cost reduction
Source: Oliver Wyman analysis 1 Includes effects of change in operating model on reforming banks only
A. Strategic selection A key battleground for further strategic selection is FICC. Several firms have already taken steps to shrink and restructure FICC divisions, but further action is required. We estimate 4% of market share has been released by restructuring banks over the last 2-3 years, and a further 2-3% may move over the next 2-3 years.
The huge capital drag of the rates business makes it one of the biggest single levers to boost returns. We estimate the flow rates business consumed 40% of industry capital (on a blended leverage exposure and RWA basis) in 2015, but generated only 5-10% of PBT. Tough decisions are required on where to push agency and alternative execution models, where to pull back from fringe markets, and how to more fundamentally streamline the business.
Exhibit 31 Rates and repo are a large consumer of capital relative to their contribution to PBT Share of PBT vs. share of financial resource commitment1 by product, 2014
Source: Oliver Wyman proprietary data and analysis 1. Financial resource commitment calculated using 50% risk capital and 50% leverage capital
We also see more tough decisions on international operations as banks adjust to more Balkanised regulation and skewed profitability across regions. Asia and Emerging Markets more broadly are a particular challenge for many global banks as revenue pools shift onshore and the cost of accessing them increases. Meanwhile a few of the larger regional banks are investing heavily in their Markets capabilities. Many of the most promising opportunities, such as corporate/SME business and deepening local currency markets, are hard for banks without a deep local network to penetrate and typically face challenges from home market credit committees. And the
7%9%
2% 2%
3%
12%
2014 fullyloaded
2014 coreperimeter
Remainingreg drag
Revenuegrowth
Businessrestructuring
2017 RoE
High
Low
Flow ratesEquities
% o
f ind
ustry
PB
T co
ntrib
uted
% of industry financial resources consumed
Repo
Prime
High PBT compared to low financial resource consumption
FX & commoditiesLow PBT compared to
financial resource consumption
Structured FIC
Flow credit
EM
Securitised
26
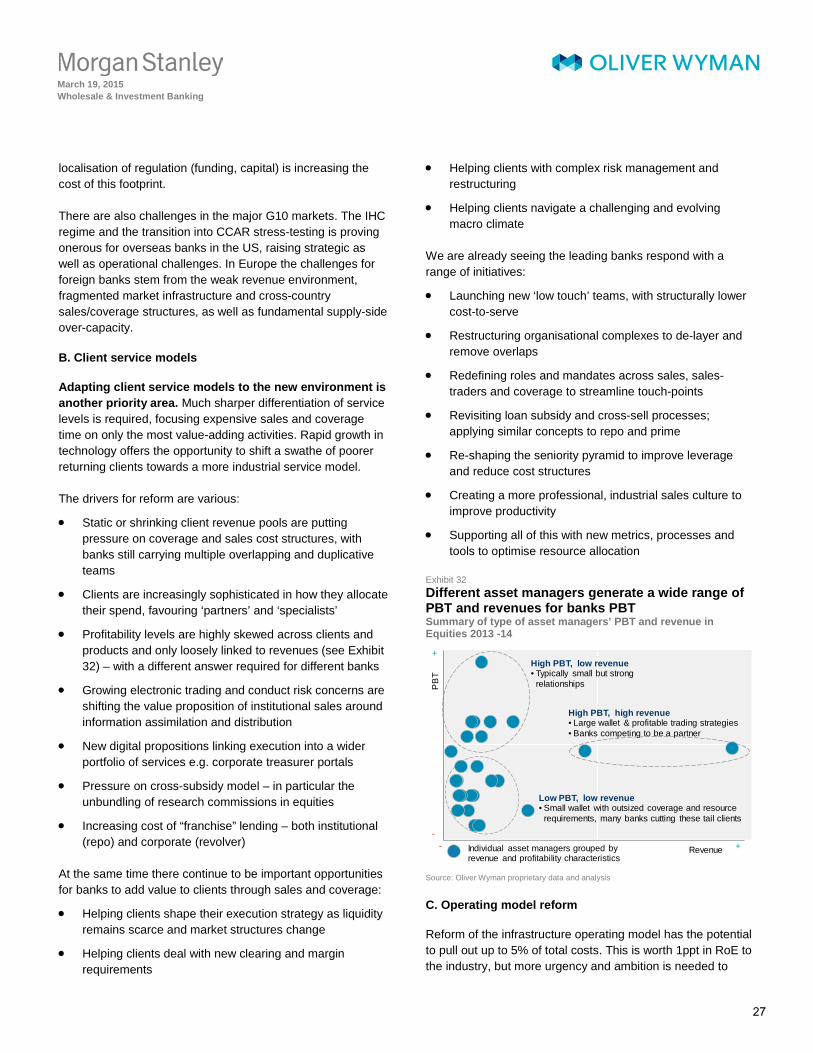
March 19, 2015 Wholesale & Investment Banking
M O R G A N S T A N L E Y B L U E P A P E R localisation of regulation (funding, capital) is increasing the cost of this footprint.
There are also challenges in the major G10 markets. The IHC regime and the transition into CCAR stress-testing is proving onerous for overseas banks in the US, raising strategic as well as operational challenges. In Europe the challenges for foreign banks stem from the weak revenue environment, fragmented market infrastructure and cross-country sales/coverage structures, as well as fundamental supply-side over-capacity.
B. Client service models Adapting client service models to the new environment is another priority area. Much sharper differentiation of service levels is required, focusing expensive sales and coverage time on only the most value-adding activities. Rapid growth in technology offers the opportunity to shift a swathe of poorer returning clients towards a more industrial service model.
The drivers for reform are various:
• Static or shrinking client revenue pools are putting pressure on coverage and sales cost structures, with banks still carrying multiple overlapping and duplicative teams
• Clients are increasingly sophisticated in how they allocate their spend, favouring ‘partners’ and ‘specialists’
• Profitability levels are highly skewed across clients and products and only loosely linked to revenues (see Exhibit 32) – with a different answer required for different banks
• Growing electronic trading and conduct risk concerns are shifting the value proposition of institutional sales around information assimilation and distribution
• New digital propositions linking execution into a wider portfolio of services e.g. corporate treasurer portals
• Pressure on cross-subsidy model – in particular the unbundling of research commissions in equities
• Increasing cost of “franchise” lending – both institutional (repo) and corporate (revolver)
At the same time there continue to be important opportunities for banks to add value to clients through sales and coverage:
• Helping clients shape their execution strategy as liquidity remains scarce and market structures change
• Helping clients deal with new clearing and margin requirements
• Helping clients with complex risk management and restructuring
• Helping clients navigate a challenging and evolving macro climate
We are already seeing the leading banks respond with a range of initiatives:
• Launching new ‘low touch’ teams, with structurally lower cost-to-serve
• Restructuring organisational complexes to de-layer and remove overlaps
• Redefining roles and mandates across sales, sales-traders and coverage to streamline touch-points
• Revisiting loan subsidy and cross-sell processes; applying similar concepts to repo and prime
• Re-shaping the seniority pyramid to improve leverage and reduce cost structures
• Creating a more professional, industrial sales culture to improve productivity
• Supporting all of this with new metrics, processes and tools to optimise resource allocation
Exhibit 32 Different asset managers generate a wide range of PBT and revenues for banks PBT Summary of type of asset managers’ PBT and revenue in Equities 2013 -14
Source: Oliver Wyman proprietary data and analysis
C. Operating model reform Reform of the infrastructure operating model has the potential to pull out up to 5% of total costs. This is worth 1ppt in RoE to the industry, but more urgency and ambition is needed to
Revenue
PB
T
+
-
High PBT, low revenue• Typically small but strong
relationships
High PBT, high revenue• Large wallet & profitable trading strategies• Banks competing to be a partner
Low PBT, low revenue• Small wallet with outsized coverage and resource
requirements, many banks cutting these tail clients
Individual asset managers grouped by revenue and profitability characteristics
-+
27
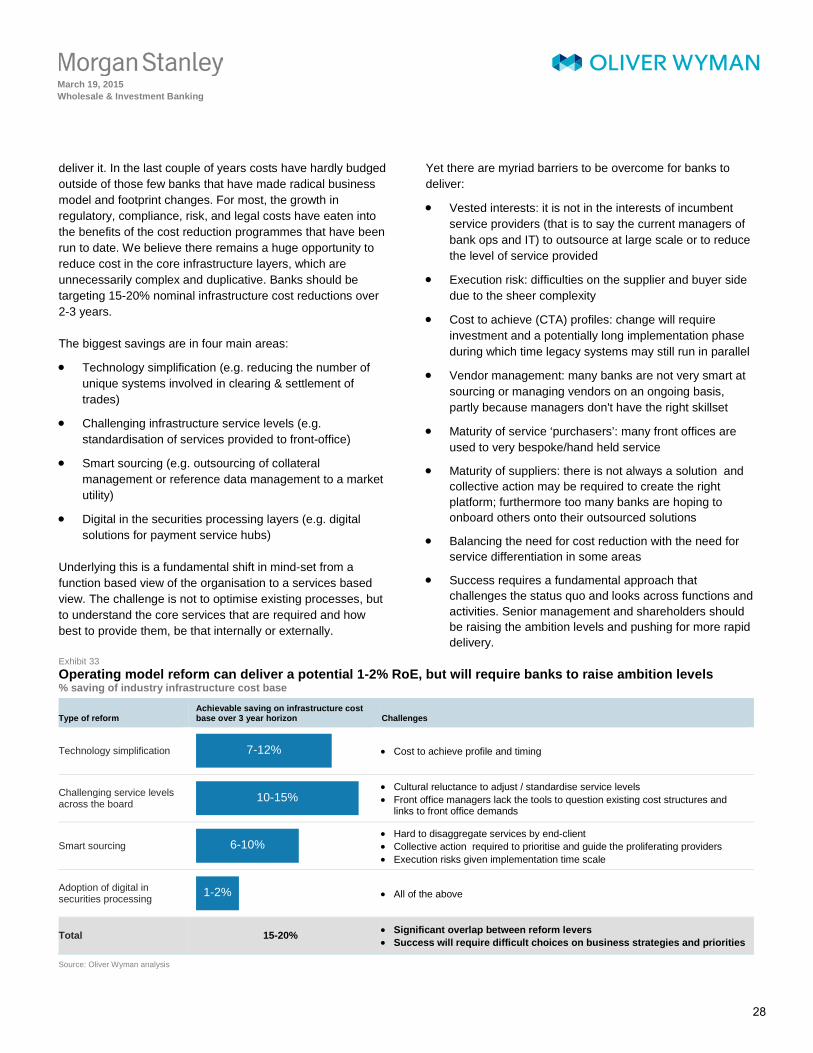
March 19, 2015 Wholesale & Investment Banking
M O R G A N S T A N L E Y B L U E P A P E R deliver it. In the last couple of years costs have hardly budged outside of those few banks that have made radical business model and footprint changes. For most, the growth in regulatory, compliance, risk, and legal costs have eaten into the benefits of the cost reduction programmes that have been run to date. We believe there remains a huge opportunity to reduce cost in the core infrastructure layers, which are unnecessarily complex and duplicative. Banks should be targeting 15-20% nominal infrastructure cost reductions over 2-3 years.
The biggest savings are in four main areas:
• Technology simplification (e.g. reducing the number of unique systems involved in clearing & settlement of trades)
• Challenging infrastructure service levels (e.g. standardisation of services provided to front-office)
• Smart sourcing (e.g. outsourcing of collateral management or reference data management to a market utility)
• Digital in the securities processing layers (e.g. digital solutions for payment service hubs)
Underlying this is a fundamental shift in mind-set from a function based view of the organisation to a services based view. The challenge is not to optimise existing processes, but to understand the core services that are required and how best to provide them, be that internally or externally.
Yet there are myriad barriers to be overcome for banks to deliver:
• Vested interests: it is not in the interests of incumbent service providers (that is to say the current managers of bank ops and IT) to outsource at large scale or to reduce the level of service provided
• Execution risk: difficulties on the supplier and buyer side due to the sheer complexity
• Cost to achieve (CTA) profiles: change will require investment and a potentially long implementation phase during which time legacy systems may still run in parallel
• Vendor management: many banks are not very smart at sourcing or managing vendors on an ongoing basis, partly because managers don't have the right skillset
• Maturity of service ‘purchasers’: many front offices are used to very bespoke/hand held service
• Maturity of suppliers: there is not always a solution and collective action may be required to create the right platform; furthermore too many banks are hoping to onboard others onto their outsourced solutions
• Balancing the need for cost reduction with the need for service differentiation in some areas
• Success requires a fundamental approach that challenges the status quo and looks across functions and activities. Senior management and shareholders should be raising the ambition levels and pushing for more rapid delivery.
Exhibit 33 Operating model reform can deliver a potential 1-2% RoE, but will require banks to raise ambition levels % saving of industry infrastructure cost base
Type of reform Achievable saving on infrastructure cost base over 3 year horizon Challenges
Technology simplification
• Cost to achieve profile and timing
Challenging service levels across the board
• Cultural reluctance to adjust / standardise service levels • Front office managers lack the tools to question existing cost structures and
links to front office demands
Smart sourcing
• Hard to disaggregate services by end-client • Collective action required to prioritise and guide the proliferating providers • Execution risks given implementation time scale
Adoption of digital in securities processing
• All of the above
Total 15-20% • Significant overlap between reform levers • Success will require difficult choices on business strategies and priorities
Source: Oliver Wyman analysis
7-12%
10-15%
6-10%
1-2%
28
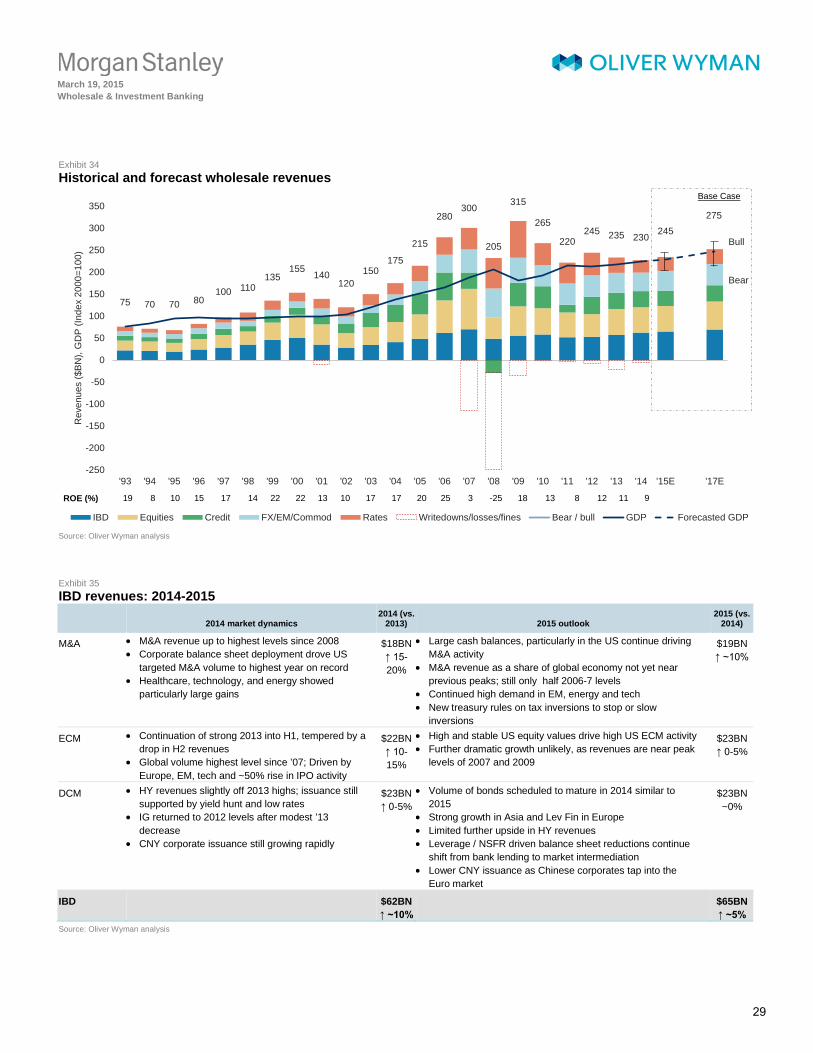
March 19, 2015 Wholesale & Investment Banking
M O R G A N S T A N L E Y B L U E P A P E R Exhibit 34 Historical and forecast wholesale revenues
Source: Oliver Wyman analysis
Exhibit 35 IBD revenues: 2014-2015
2014 market dynamics 2014 (vs.
2013) 2015 outlook 2015 (vs.
2014)
M&A • M&A revenue up to highest levels since 2008 • Corporate balance sheet deployment drove US
targeted M&A volume to highest year on record • Healthcare, technology, and energy showed
particularly large gains
$18BN ↑ 15-20%
• Large cash balances, particularly in the US continue driving M&A activity
• M&A revenue as a share of global economy not yet near previous peaks; still only half 2006-7 levels
• Continued high demand in EM, energy and tech • New treasury rules on tax inversions to stop or slow
inversions
$19BN ↑ ~10%
ECM • Continuation of strong 2013 into H1, tempered by a drop in H2 revenues
• Global volume highest level since ’07; Driven by Europe, EM, tech and ~50% rise in IPO activity
$22BN ↑ 10-15%
• High and stable US equity values drive high US ECM activity • Further dramatic growth unlikely, as revenues are near peak
levels of 2007 and 2009
$23BN ↑ 0-5%
DCM • HY revenues slightly off 2013 highs; issuance still supported by yield hunt and low rates
• IG returned to 2012 levels after modest ’13 decrease
• CNY corporate issuance still growing rapidly
$23BN ↑ 0-5%
• Volume of bonds scheduled to mature in 2014 similar to 2015
• Strong growth in Asia and Lev Fin in Europe • Limited further upside in HY revenues • Leverage / NSFR driven balance sheet reductions continue
shift from bank lending to market intermediation • Lower CNY issuance as Chinese corporates tap into the
Euro market
$23BN ~0%
IBD $62BN ↑ ~10%
$65BN ↑ ~5%
Source: Oliver Wyman analysis
75 70 70 80100 110
135155 140
120150
175
215
280300
205
315
265
220245 235 230 245
275
-250
-200
-150
-100
-50
0
50
100
150
200
250
300
350
'93 '94 '95 '96 '97 '98 '99 '00 '01 '02 '03 '04 '05 '06 '07 '08 '09 '10 '11 '12 '13 '14 '15E '17E
Rev
enue
s ($
BN
), G
DP
(Inde
x 20
00=1
00)
IBD Equities Credit FX/EM/Commod Rates Writedowns/losses/fines Bear / bull GDP Forecasted GDP
ROE (%) 19 8 10 15 17 14 22 1322 10 17 17 20 25 3 -25 1318 8 12
Base Case
11 9
Bull
Bear
29
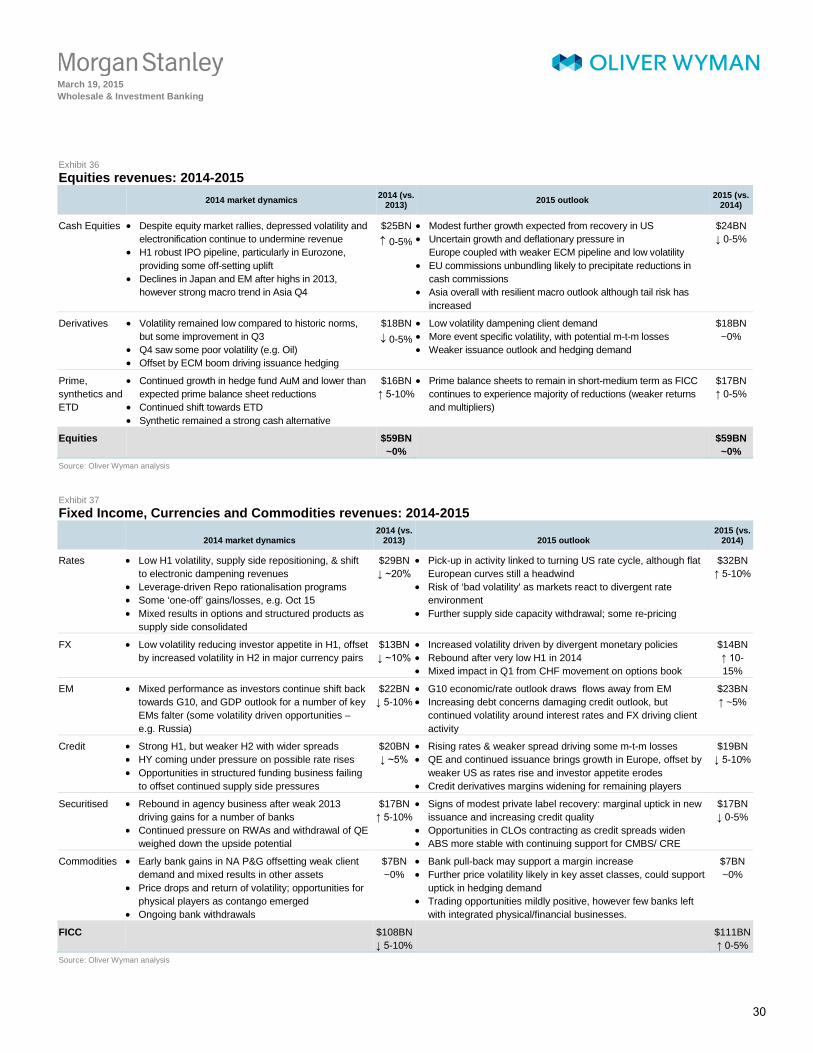
March 19, 2015 Wholesale & Investment Banking
M O R G A N S T A N L E Y B L U E P A P E R Exhibit 36 Equities revenues: 2014-2015
2014 market dynamics 2014 (vs. 2013) 2015 outlook 2015 (vs.
2014)
Cash Equities • Despite equity market rallies, depressed volatility and electronification continue to undermine revenue
• H1 robust IPO pipeline, particularly in Eurozone, providing some off-setting uplift
• Declines in Japan and EM after highs in 2013, however strong macro trend in Asia Q4
$25BN ↑ 0-5%
• Modest further growth expected from recovery in US • Uncertain growth and deflationary pressure in
Europe coupled with weaker ECM pipeline and low volatility • EU commissions unbundling likely to precipitate reductions in
cash commissions • Asia overall with resilient macro outlook although tail risk has
increased
$24BN ↓ 0-5%
Derivatives • Volatility remained low compared to historic norms, but some improvement in Q3
• Q4 saw some poor volatility (e.g. Oil) • Offset by ECM boom driving issuance hedging
$18BN ↓ 0-5%
• Low volatility dampening client demand • More event specific volatility, with potential m-t-m losses • Weaker issuance outlook and hedging demand
$18BN ~0%
Prime, synthetics and ETD
• Continued growth in hedge fund AuM and lower than expected prime balance sheet reductions
• Continued shift towards ETD • Synthetic remained a strong cash alternative
$16BN ↑ 5-10%
• Prime balance sheets to remain in short-medium term as FICC continues to experience majority of reductions (weaker returns and multipliers)
$17BN ↑ 0-5%
Equities $59BN ~0%
$59BN ~0%
Source: Oliver Wyman analysis Exhibit 37 Fixed Income, Currencies and Commodities revenues: 2014-2015
2014 market dynamics 2014 (vs.
2013) 2015 outlook 2015 (vs.
2014)
Rates • Low H1 volatility, supply side repositioning, & shift to electronic dampening revenues
• Leverage-driven Repo rationalisation programs • Some ‘one-off’ gains/losses, e.g. Oct 15 • Mixed results in options and structured products as
supply side consolidated
$29BN ↓ ~20%
• Pick-up in activity linked to turning US rate cycle, although flat European curves still a headwind
• Risk of ‘bad volatility' as markets react to divergent rate environment
• Further supply side capacity withdrawal; some re-pricing
$32BN ↑ 5-10%
FX • Low volatility reducing investor appetite in H1, offset by increased volatility in H2 in major currency pairs
$13BN ↓ ~10%
• Increased volatility driven by divergent monetary policies • Rebound after very low H1 in 2014 • Mixed impact in Q1 from CHF movement on options book
$14BN ↑ 10-15%
EM • Mixed performance as investors continue shift back towards G10, and GDP outlook for a number of key EMs falter (some volatility driven opportunities – e.g. Russia)
$22BN ↓ 5-10%
• G10 economic/rate outlook draws flows away from EM • Increasing debt concerns damaging credit outlook, but
continued volatility around interest rates and FX driving client activity
$23BN ↑ ~5%
Credit • Strong H1, but weaker H2 with wider spreads • HY coming under pressure on possible rate rises • Opportunities in structured funding business failing
to offset continued supply side pressures
$20BN ↓ ~5%
• Rising rates & weaker spread driving some m-t-m losses • QE and continued issuance brings growth in Europe, offset by
weaker US as rates rise and investor appetite erodes • Credit derivatives margins widening for remaining players
$19BN ↓ 5-10%
Securitised • Rebound in agency business after weak 2013 driving gains for a number of banks
• Continued pressure on RWAs and withdrawal of QE weighed down the upside potential
$17BN ↑ 5-10%
• Signs of modest private label recovery: marginal uptick in new issuance and increasing credit quality
• Opportunities in CLOs contracting as credit spreads widen • ABS more stable with continuing support for CMBS/ CRE
$17BN ↓ 0-5%
Commodities • Early bank gains in NA P&G offsetting weak client demand and mixed results in other assets
• Price drops and return of volatility; opportunities for physical players as contango emerged
• Ongoing bank withdrawals
$7BN ~0%
• Bank pull-back may support a margin increase • Further price volatility likely in key asset classes, could support
uptick in hedging demand • Trading opportunities mildly positive, however few banks left
with integrated physical/financial businesses.
$7BN ~0%
FICC $108BN ↓ 5-10%
$111BN ↑ 0-5%
Source: Oliver Wyman analysis
30
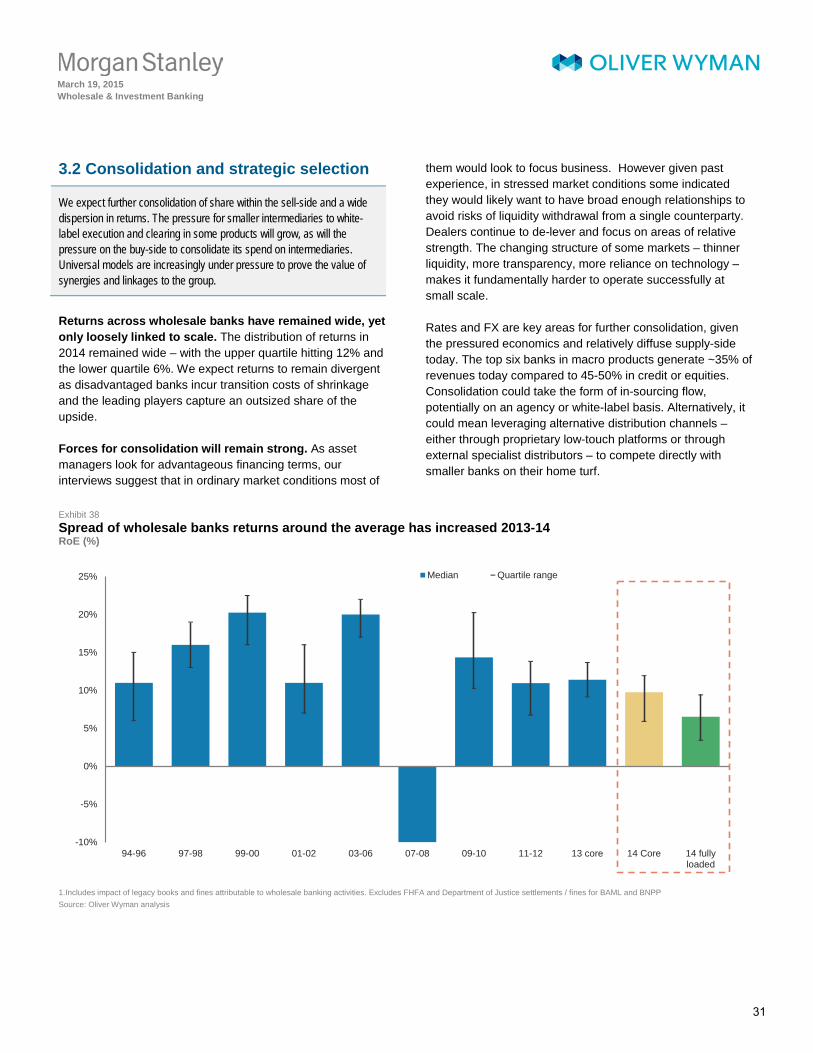
March 19, 2015 Wholesale & Investment Banking
M O R G A N S T A N L E Y B L U E P A P E R 3.2 Consolidation and strategic selection
We expect further consolidation of share within the sell-side and a wide dispersion in returns. The pressure for smaller intermediaries to white-label execution and clearing in some products will grow, as will the pressure on the buy-side to consolidate its spend on intermediaries. Universal models are increasingly under pressure to prove the value of synergies and linkages to the group.
Returns across wholesale banks have remained wide, yet only loosely linked to scale. The distribution of returns in 2014 remained wide – with the upper quartile hitting 12% and the lower quartile 6%. We expect returns to remain divergent as disadvantaged banks incur transition costs of shrinkage and the leading players capture an outsized share of the upside.
Forces for consolidation will remain strong. As asset managers look for advantageous financing terms, our interviews suggest that in ordinary market conditions most of
them would look to focus business. However given past experience, in stressed market conditions some indicated they would likely want to have broad enough relationships to avoid risks of liquidity withdrawal from a single counterparty. Dealers continue to de-lever and focus on areas of relative strength. The changing structure of some markets – thinner liquidity, more transparency, more reliance on technology – makes it fundamentally harder to operate successfully at small scale.
Rates and FX are key areas for further consolidation, given the pressured economics and relatively diffuse supply-side today. The top six banks in macro products generate ~35% of revenues today compared to 45-50% in credit or equities. Consolidation could take the form of in-sourcing flow, potentially on an agency or white-label basis. Alternatively, it could mean leveraging alternative distribution channels – either through proprietary low-touch platforms or through external specialist distributors – to compete directly with smaller banks on their home turf.
Exhibit 38 Spread of wholesale banks returns around the average has increased 2013-14 RoE (%)
1.Includes impact of legacy books and fines attributable to wholesale banking activities. Excludes FHFA and Department of Justice settlements / fines for BAML and BNPP Source: Oliver Wyman analysis
-10%
-5%
0%
5%
10%
15%
20%
25%
94-96 97-98 99-00 01-02 03-06 07-08 09-10 11-12 13 core 14 Core 14 fullyloaded
Median Quartile range
31
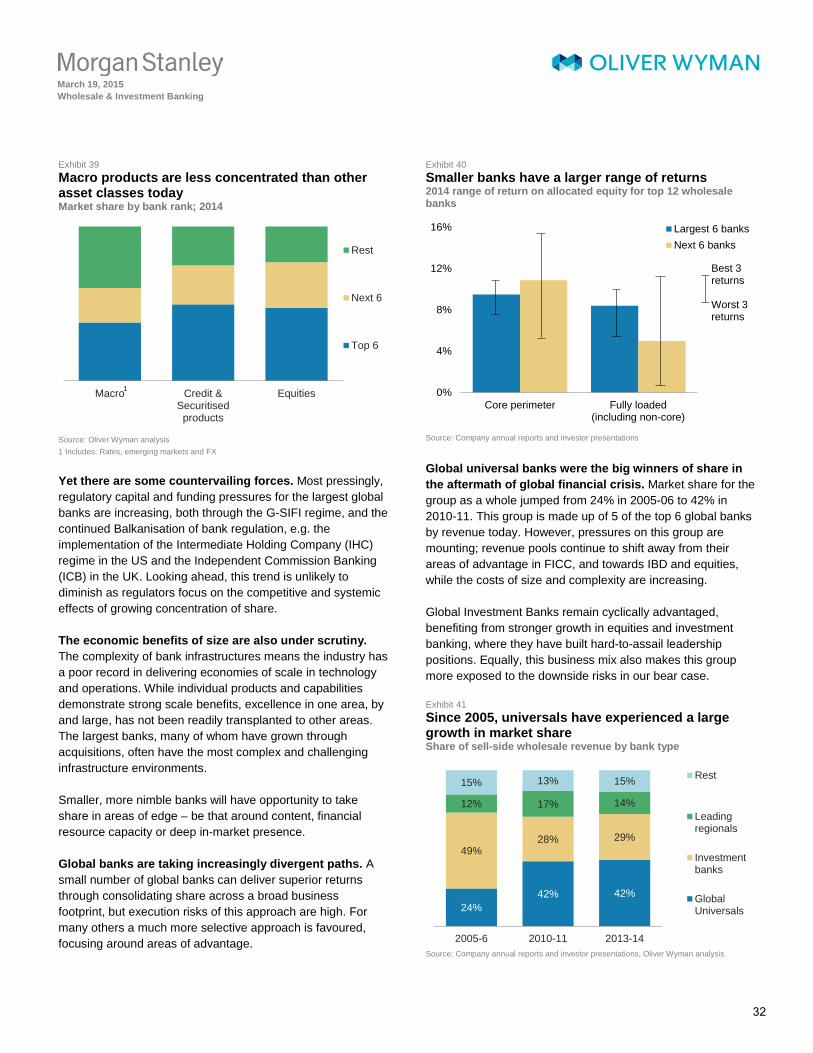
March 19, 2015 Wholesale & Investment Banking
M O R G A N S T A N L E Y B L U E P A P E R Exhibit 39 Macro products are less concentrated than other asset classes today Market share by bank rank; 2014
Source: Oliver Wyman analysis 1 Includes: Rates, emerging markets and FX
Yet there are some countervailing forces. Most pressingly, regulatory capital and funding pressures for the largest global banks are increasing, both through the G-SIFI regime, and the continued Balkanisation of bank regulation, e.g. the implementation of the Intermediate Holding Company (IHC) regime in the US and the Independent Commission Banking (ICB) in the UK. Looking ahead, this trend is unlikely to diminish as regulators focus on the competitive and systemic effects of growing concentration of share.
The economic benefits of size are also under scrutiny. The complexity of bank infrastructures means the industry has a poor record in delivering economies of scale in technology and operations. While individual products and capabilities demonstrate strong scale benefits, excellence in one area, by and large, has not been readily transplanted to other areas. The largest banks, many of whom have grown through acquisitions, often have the most complex and challenging infrastructure environments.
Smaller, more nimble banks will have opportunity to take share in areas of edge – be that around content, financial resource capacity or deep in-market presence.
Global banks are taking increasingly divergent paths. A small number of global banks can deliver superior returns through consolidating share across a broad business footprint, but execution risks of this approach are high. For many others a much more selective approach is favoured, focusing around areas of advantage.
Exhibit 40 Smaller banks have a larger range of returns 2014 range of return on allocated equity for top 12 wholesale banks
Source: Company annual reports and investor presentations
Global universal banks were the big winners of share in the aftermath of global financial crisis. Market share for the group as a whole jumped from 24% in 2005-06 to 42% in 2010-11. This group is made up of 5 of the top 6 global banks by revenue today. However, pressures on this group are mounting; revenue pools continue to shift away from their areas of advantage in FICC, and towards IBD and equities, while the costs of size and complexity are increasing.
Global Investment Banks remain cyclically advantaged, benefiting from stronger growth in equities and investment banking, where they have built hard-to-assail leadership positions. Equally, this business mix also makes this group more exposed to the downside risks in our bear case.
Exhibit 41 Since 2005, universals have experienced a large growth in market share Share of sell-side wholesale revenue by bank type
Source: Company annual reports and investor presentations, Oliver Wyman analysis
Macro Credit &Securitisedproducts
Equities
Rest
Next 6
Top 6
1 0%
4%
8%
12%
16%
Core perimeter Fully loaded(including non-core)
Largest 6 banksNext 6 banks
Best 3 returns
Worst 3 returns
24%42% 42%
49%28% 29%
12% 17% 14%
15% 13% 15%
2005-6 2010-11 2013-14
Rest
Leadingregionals
Investmentbanks
GlobalUniversals
32
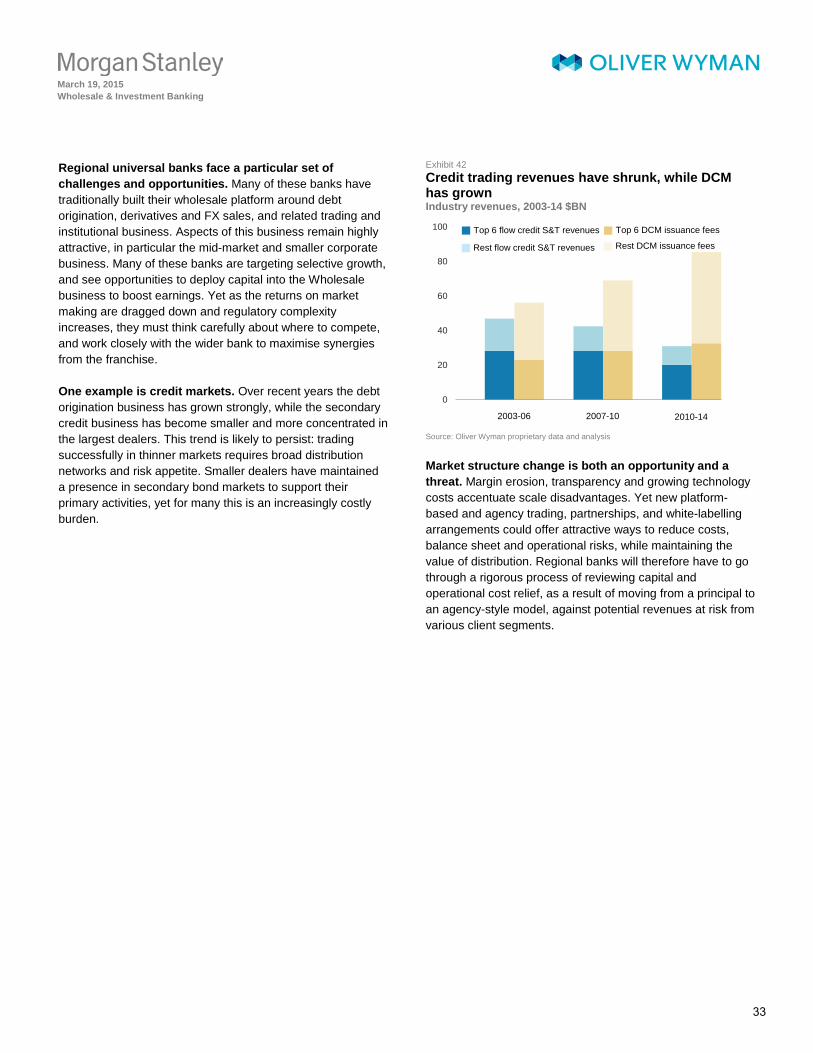
March 19, 2015 Wholesale & Investment Banking
M O R G A N S T A N L E Y B L U E P A P E R Regional universal banks face a particular set of challenges and opportunities. Many of these banks have traditionally built their wholesale platform around debt origination, derivatives and FX sales, and related trading and institutional business. Aspects of this business remain highly attractive, in particular the mid-market and smaller corporate business. Many of these banks are targeting selective growth, and see opportunities to deploy capital into the Wholesale business to boost earnings. Yet as the returns on market making are dragged down and regulatory complexity increases, they must think carefully about where to compete, and work closely with the wider bank to maximise synergies from the franchise.
One example is credit markets. Over recent years the debt origination business has grown strongly, while the secondary credit business has become smaller and more concentrated in the largest dealers. This trend is likely to persist: trading successfully in thinner markets requires broad distribution networks and risk appetite. Smaller dealers have maintained a presence in secondary bond markets to support their primary activities, yet for many this is an increasingly costly burden.
Exhibit 42 Credit trading revenues have shrunk, while DCM has grown Industry revenues, 2003-14 $BN
Source: Oliver Wyman proprietary data and analysis
Market structure change is both an opportunity and a threat. Margin erosion, transparency and growing technology costs accentuate scale disadvantages. Yet new platform-based and agency trading, partnerships, and white-labelling arrangements could offer attractive ways to reduce costs, balance sheet and operational risks, while maintaining the value of distribution. Regional banks will therefore have to go through a rigorous process of reviewing capital and operational cost relief, as a result of moving from a principal to an agency-style model, against potential revenues at risk from various client segments.
0
20
40
60
80
100
2003-06 2007-10 2010-14
Rest flow credit S&T revenues Rest DCM issuance fees
Top 6 flow credit S&T revenues Top 6 DCM issuance fees
33
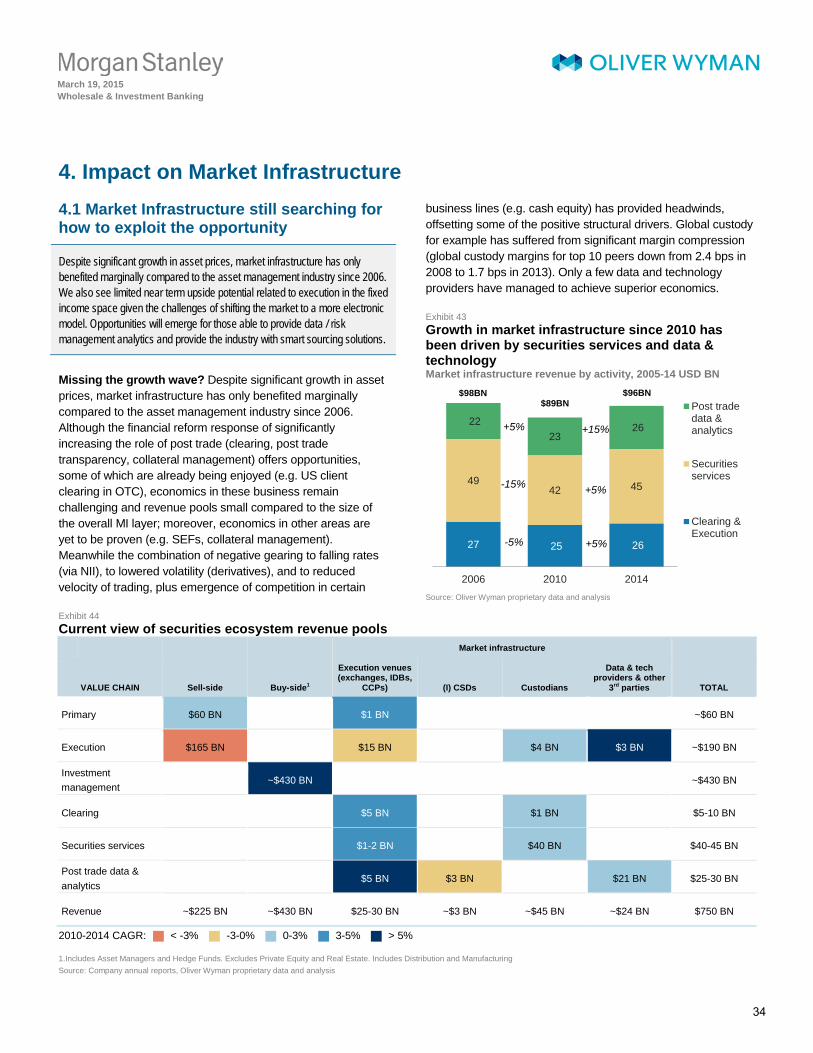
March 19, 2015 Wholesale & Investment Banking
M O R G A N S T A N L E Y B L U E P A P E R 4. Impact on Market Infrastructure 4.1 Market Infrastructure still searching for how to exploit the opportunity
Despite significant growth in asset prices, market infrastructure has only benefited marginally compared to the asset management industry since 2006. We also see limited near term upside potential related to execution in the fixed income space given the challenges of shifting the market to a more electronic model. Opportunities will emerge for those able to provide data / risk management analytics and provide the industry with smart sourcing solutions.
Missing the growth wave? Despite significant growth in asset prices, market infrastructure has only benefited marginally compared to the asset management industry since 2006. Although the financial reform response of significantly increasing the role of post trade (clearing, post trade transparency, collateral management) offers opportunities, some of which are already being enjoyed (e.g. US client clearing in OTC), economics in these business remain challenging and revenue pools small compared to the size of the overall MI layer; moreover, economics in other areas are yet to be proven (e.g. SEFs, collateral management). Meanwhile the combination of negative gearing to falling rates (via NII), to lowered volatility (derivatives), and to reduced velocity of trading, plus emergence of competition in certain
business lines (e.g. cash equity) has provided headwinds, offsetting some of the positive structural drivers. Global custody for example has suffered from significant margin compression (global custody margins for top 10 peers down from 2.4 bps in 2008 to 1.7 bps in 2013). Only a few data and technology providers have managed to achieve superior economics.
Exhibit 43 Growth in market infrastructure since 2010 has been driven by securities services and data & technology Market infrastructure revenue by activity, 2005-14 USD BN
Source: Oliver Wyman proprietary data and analysis
Exhibit 44 Current view of securities ecosystem revenue pools
Market infrastructure
VALUE CHAIN Sell-side Buy-side1
Execution venues (exchanges, IDBs,
CCPs) (I) CSDs Custodians
Data & tech providers & other
3rd parties TOTAL
Primary $60 BN $1 BN ~$60 BN
Execution $165 BN $15 BN $4 BN $3 BN ~$190 BN
Investment management
~$430 BN ~$430 BN
Clearing $5 BN $1 BN $5-10 BN
Securities services $1-2 BN $40 BN $40-45 BN
Post trade data & analytics
$5 BN $3 BN $21 BN $25-30 BN
Revenue ~$225 BN ~$430 BN $25-30 BN ~$3 BN ~$45 BN ~$24 BN $750 BN
2010-2014 CAGR: < -3% -3-0% 0-3% 3-5% > 5%
1.Includes Asset Managers and Hedge Funds. Excludes Private Equity and Real Estate. Includes Distribution and Manufacturing Source: Company annual reports, Oliver Wyman proprietary data and analysis
27 25 26
49 42 45
22 23
26
2006 2010 2014
Post tradedata &analytics
Securitiesservices
Clearing &Execution
-5%
-15%
+5%
+5%
+5%
+15%
$98BN$89BN
$96BN
34
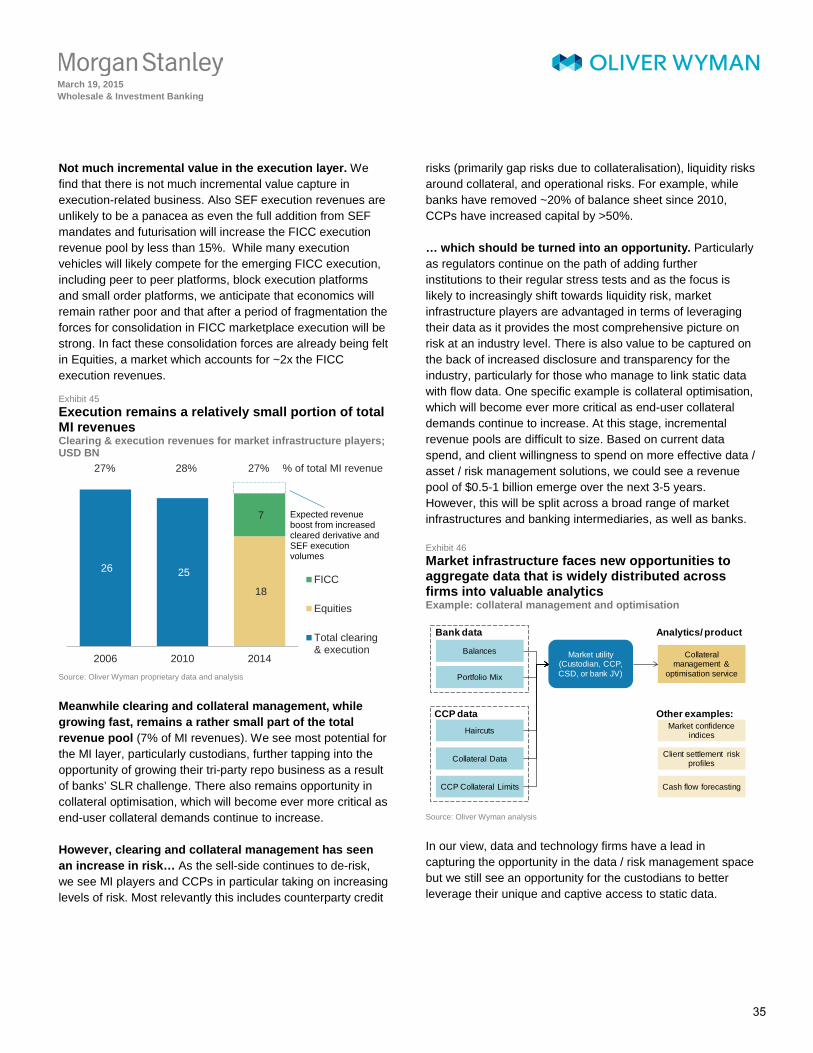
March 19, 2015 Wholesale & Investment Banking
M O R G A N S T A N L E Y B L U E P A P E R Not much incremental value in the execution layer. We find that there is not much incremental value capture in execution-related business. Also SEF execution revenues are unlikely to be a panacea as even the full addition from SEF mandates and futurisation will increase the FICC execution revenue pool by less than 15%. While many execution vehicles will likely compete for the emerging FICC execution, including peer to peer platforms, block execution platforms and small order platforms, we anticipate that economics will remain rather poor and that after a period of fragmentation the forces for consolidation in FICC marketplace execution will be strong. In fact these consolidation forces are already being felt in Equities, a market which accounts for ~2x the FICC execution revenues. Exhibit 45 Execution remains a relatively small portion of total MI revenues Clearing & execution revenues for market infrastructure players; USD BN
Source: Oliver Wyman proprietary data and analysis
Meanwhile clearing and collateral management, while growing fast, remains a rather small part of the total revenue pool (7% of MI revenues). We see most potential for the MI layer, particularly custodians, further tapping into the opportunity of growing their tri-party repo business as a result of banks’ SLR challenge. There also remains opportunity in collateral optimisation, which will become ever more critical as end-user collateral demands continue to increase.
However, clearing and collateral management has seen an increase in risk… As the sell-side continues to de-risk, we see MI players and CCPs in particular taking on increasing levels of risk. Most relevantly this includes counterparty credit
risks (primarily gap risks due to collateralisation), liquidity risks around collateral, and operational risks. For example, while banks have removed ~20% of balance sheet since 2010, CCPs have increased capital by >50%.
… which should be turned into an opportunity. Particularly as regulators continue on the path of adding further institutions to their regular stress tests and as the focus is likely to increasingly shift towards liquidity risk, market infrastructure players are advantaged in terms of leveraging their data as it provides the most comprehensive picture on risk at an industry level. There is also value to be captured on the back of increased disclosure and transparency for the industry, particularly for those who manage to link static data with flow data. One specific example is collateral optimisation, which will become ever more critical as end-user collateral demands continue to increase. At this stage, incremental revenue pools are difficult to size. Based on current data spend, and client willingness to spend on more effective data / asset / risk management solutions, we could see a revenue pool of $0.5-1 billion emerge over the next 3-5 years. However, this will be split across a broad range of market infrastructures and banking intermediaries, as well as banks.
Exhibit 46 Market infrastructure faces new opportunities to aggregate data that is widely distributed across firms into valuable analytics Example: collateral management and optimisation
Source: Oliver Wyman analysis
In our view, data and technology firms have a lead in capturing the opportunity in the data / risk management space but we still see an opportunity for the custodians to better leverage their unique and captive access to static data.
26 25
18
7
2006 2010 2014
FICC
Equities
Total clearing& execution
28%27% 27% % of total MI revenue
Expected revenue boost from increased cleared derivative and SEF execution volumes
Haircuts
Balances
Portfolio Mix
Collateral Data
CCP Collateral Limits
Collateral management &
optimisation service
Market utility (Custodian, CCP, CSD, or bank JV)
Bank data Analytics/ product
Other examples:Market confidence
indices
Client settlement risk profiles
Cash flow forecasting
CCP data
35
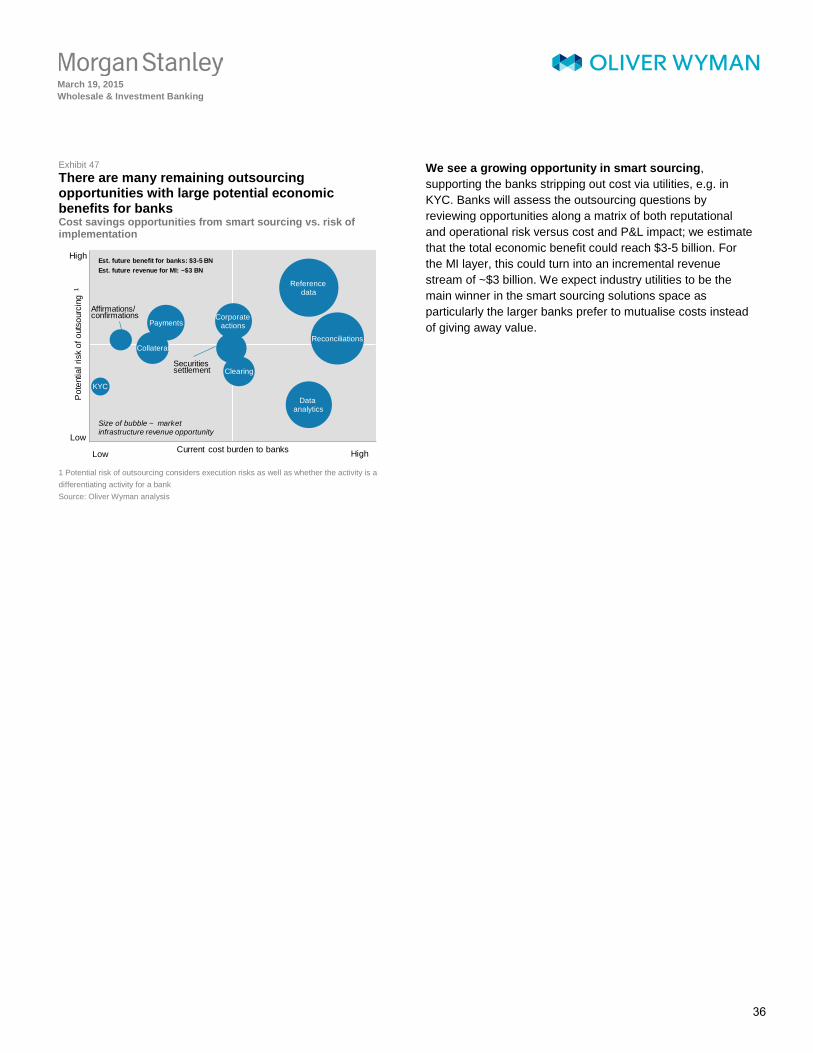
March 19, 2015 Wholesale & Investment Banking
M O R G A N S T A N L E Y B L U E P A P E R Exhibit 47 There are many remaining outsourcing opportunities with large potential economic benefits for banks Cost savings opportunities from smart sourcing vs. risk of implementation
1 Potential risk of outsourcing considers execution risks as well as whether the activity is a differentiating activity for a bank Source: Oliver Wyman analysis
We see a growing opportunity in smart sourcing, supporting the banks stripping out cost via utilities, e.g. in KYC. Banks will assess the outsourcing questions by reviewing opportunities along a matrix of both reputational and operational risk versus cost and P&L impact; we estimate that the total economic benefit could reach $3-5 billion. For the MI layer, this could turn into an incremental revenue stream of ~$3 billion. We expect industry utilities to be the main winner in the smart sourcing solutions space as particularly the larger banks prefer to mutualise costs instead of giving away value.
High
Low
Size of bubble ~ market infrastructure revenue opportunity
Low High
Est. future benefit for banks: $3-5 BNEst. future revenue for MI: ~$3 BN
KYC
Clearing
Reference data
Reconciliations
Corporate actions
Data analytics
Collateral
Payments
Pot
entia
l ris
k of
out
sour
cing
1
Current cost burden to banks
Affirmations/ confirmations
Securities settlement
36
March 19, 2015 Wholesale & Investment Banking
M O R G A N S T A N L E Y B L U E P A P E R Disclosure Section Morgan Stanley & Co. International plc, authorized by the Prudential Regulatory Authority and regulated by the Financial Conduct Authority and the Prudential Regulatory Authority, disseminates in the UK research that it has prepared, and approves solely for the purposes of section 21 of the Financial Services and Markets Act 2000, research which has been prepared by any of its affiliates. As used in this disclosure section, Morgan Stanley includes RMB Morgan Stanley (Proprietary) Limited, Morgan Stanley & Co International plc and its affiliates. For important disclosures, stock price charts and equity rating histories regarding companies that are the subject of this report, please see the Morgan Stanley Research Disclosure Website at www.morganstanley.com/researchdisclosures, or contact your investment representative or Morgan Stanley Research at 1585 Broadway, (Attention: Research Management), New York, NY, 10036 USA. For valuation methodology and risks associated with any price targets referenced in this research report, please contact the Client Support Team as follows: US/Canada +1 800 303-2495; Hong Kong +852 2848-5999; Latin America +1 718 754-5444 (U.S.); London +44 (0)20-7425-8169; Singapore +65 6834-6860; Sydney +61 (0)2-9770-1505; Tokyo +81 (0)3-6836-9000. Alternatively you may contact your investment representative or Morgan Stanley Research at 1585 Broadway, (Attention: Research Management), New York, NY 10036 USA. Analyst Certification The following analysts hereby certify that their views about the companies and their securities discussed in this report are accurately expressed and that they have not received and will not receive direct or indirect compensation in exchange for expressing specific recommendations or views in this report: Betsy Graseck, Bruce Hamilton, Vishwanath Tirupattur, Huw Van Steenis, Thomas Whitehead, Richard Wiles. Unless otherwise stated, the individuals listed on the cover page of this report are research analysts. Global Research Conflict Management Policy Morgan Stanley Research has been published in accordance with our conflict management policy, which is available at www.morganstanley.com/institutional/research/conflictpolicies. Important US Regulatory Disclosures on Subject Companies The equity research analysts or strategists principally responsible for the preparation of Morgan Stanley Research have received compensation based upon various factors, including quality of research, investor client feedback, stock picking, competitive factors, firm revenues and overall investment banking revenues. Morgan Stanley and its affiliates do business that relates to companies/instruments covered in Morgan Stanley Research, including market making, providing liquidity and specialized trading, risk arbitrage and other proprietary trading, fund management, commercial banking, extension of credit, investment services and investment banking. Morgan Stanley sells to and buys from customers the securities/instruments of companies covered in Morgan Stanley Research on a principal basis. Morgan Stanley may have a position in the debt of the Company or instruments discussed in this report. Certain disclosures listed above are also for compliance with applicable regulations in non-US jurisdictions. STOCK RATINGS Morgan Stanley uses a relative rating system using terms such as Overweight, Equal-weight, Not-Rated or Underweight (see definitions below). Morgan Stanley does not assign ratings of Buy, Hold or Sell to the stocks we cover. Overweight, Equal-weight, Not-Rated and Underweight are not the equivalent of buy, hold and sell. Investors should carefully read the definitions of all ratings used in Morgan Stanley Research. In addition, since Morgan Stanley Research contains more complete information concerning the analyst's views, investors should carefully read Morgan Stanley Research, in its entirety, and not infer the contents from the rating alone. In any case, ratings (or research) should not be used or relied upon as investment advice. An investor's decision to buy or sell a stock should depend on individual circumstances (such as the investor's existing holdings) and other considerations. Global Stock Ratings Distribution (as of February 28, 2015) For disclosure purposes only (in accordance with NASD and NYSE requirements), we include the category headings of Buy, Hold, and Sell alongside our ratings of Overweight, Equal-weight, Not-Rated and Underweight. Morgan Stanley does not assign ratings of Buy, Hold or Sell to the stocks we cover. Overweight, Equal-weight, Not-Rated and Underweight are not the equivalent of buy, hold, and sell but represent recommended relative weightings (see definitions below). To satisfy regulatory requirements, we correspond Overweight, our most positive stock rating, with a buy recommendation; we correspond Equal-weight and Not-Rated to hold and Underweight to sell recommendations, respectively. Coverage Universe Investment Banking Clients (IBC)
Stock Rating Category Count % of Total Count
% of Total IBC
% of Rating Category
Overweight/Buy 1161 35% 321 41% 28% Equal-weight/Hold 1459 44% 370 47% 25% Not-Rated/Hold 101 3% 10 1% 10% Underweight/Sell 609 18% 88 11% 14% Total 3,330 789 Data include common stock and ADRs currently assigned ratings. Investment Banking Clients are companies from whom Morgan Stanley received investment banking compensation in the last 12 months. Analyst Stock Ratings Overweight (O). The stock's total return is expected to exceed the average total return of the analyst's industry (or industry team's) coverage universe, on a risk-adjusted basis, over the next 12-18 months. Equal-weight (E). The stock's total return is expected to be in line with the average total return of the analyst's industry (or industry team's) coverage universe, on a risk-adjusted basis, over the next 12-18 months. Not-Rated (NR). Currently the analyst does not have adequate conviction about the stock's total return relative to the average total return of the analyst's industry (or industry team's) coverage universe, on a risk-adjusted basis, over the next 12-18 months. Underweight (U). The stock's total return is expected to be below the average total return of the analyst's industry (or industry team's) coverage universe, on a risk-adjusted basis, over the next 12-18 months. Unless otherwise specified, the time frame for price targets included in Morgan Stanley Research is 12 to 18 months. Analyst Industry Views Attractive (A): The analyst expects the performance of his or her industry coverage universe over the next 12-18 months to be attractive vs. the relevant broad market benchmark, as indicated below.
37
March 19, 2015 Wholesale & Investment Banking
M O R G A N S T A N L E Y B L U E P A P E R In-Line (I): The analyst expects the performance of his or her industry coverage universe over the next 12-18 months to be in line with the relevant broad market benchmark, as indicated below. Cautious (C): The analyst views the performance of his or her industry coverage universe over the next 12-18 months with caution vs. the relevant broad market benchmark, as indicated below. Benchmarks for each region are as follows: North America - S&P 500; Latin America - relevant MSCI country index or MSCI Latin America Index; Europe - MSCI Europe; Japan - TOPIX; Asia - relevant MSCI country index or MSCI sub-regional index or MSCI AC Asia Pacific ex Japan Index. . Important Disclosures for Morgan Stanley Smith Barney LLC Customers Important disclosures regarding the relationship between the companies that are the subject of Morgan Stanley Research and Morgan Stanley Smith Barney LLC or Morgan Stanley or any of their affiliates, are available on the Morgan Stanley Wealth Management disclosure website at www.morganstanley.com/online/researchdisclosures. For Morgan Stanley specific disclosures, you may refer to www.morganstanley.com/researchdisclosures. Each Morgan Stanley Equity Research report is reviewed and approved on behalf of Morgan Stanley Smith Barney LLC. This review and approval is conducted by the same person who reviews the Equity Research report on behalf of Morgan Stanley. This could create a conflict of interest. Other Important Disclosures Morgan Stanley is not acting as a municipal advisor and the opinions or views contained herein are not intended to be, and do not constitute, advice within the meaning of Section 975 of the Dodd-Frank Wall Street Reform and Consumer Protection Act. Morgan Stanley produces an equity research product called a "Tactical Idea." Views contained in a "Tactical Idea" on a particular stock may be contrary to the recommendations or views expressed in research on the same stock. This may be the result of differing time horizons, methodologies, market events, or other factors. For all research available on a particular stock, please contact your sales representative or go to Matrix at http://www.morganstanley.com/matrix. Morgan Stanley Research is provided to our clients through our proprietary research portal on Matrix and also distributed electronically by Morgan Stanley to clients. Certain, but not all, Morgan Stanley Research products are also made available to clients through third-party vendors or redistributed to clients through alternate electronic means as a convenience. For access to all available Morgan Stanley Research, please contact your sales representative or go to Matrix at http://www.morganstanley.com/matrix. Any access and/or use of Morgan Stanley Research is subject to Morgan Stanley's Terms of Use (http://www.morganstanley.com/terms.html). By accessing and/or using Morgan Stanley Research, you are indicating that you have read and agree to be bound by our Terms of Use (http://www.morganstanley.com/terms.html). In addition you consent to Morgan Stanley processing your personal data and using cookies in accordance with our Privacy Policy and our Global Cookies Policy (http://www.morganstanley.com/privacy_pledge.html), including for the purposes of setting your preferences and to collect readership data so that we can deliver better and more personalized service and products to you. To find out more information about how Morgan Stanley processes personal data, how we use cookies and how to reject cookies see our Privacy Policy and our Global Cookies Policy (http://www.morganstanley.com/privacy_pledge.html). If you do not agree to our Terms of Use and/or if you do not wish to provide your consent to Morgan Stanley processing your personal data or using cookies please do not access our research. Morgan Stanley Research does not provide individually tailored investment advice. Morgan Stanley Research has been prepared without regard to the circumstances and objectives of those who receive it. Morgan Stanley recommends that investors independently evaluate particular investments and strategies, and encourages investors to seek the advice of a financial adviser. The appropriateness of an investment or strategy will depend on an investor's circumstances and objectives. The securities, instruments, or strategies discussed in Morgan Stanley Research may not be suitable for all investors, and certain investors may not be eligible to purchase or participate in some or all of them. Morgan Stanley Research is not an offer to buy or sell or the solicitation of an offer to buy or sell any security/instrument or to participate in any particular trading strategy. The value of and income from your investments may vary because of changes in interest rates, foreign exchange rates, default rates, prepayment rates, securities/instruments prices, market indexes, operational or financial conditions of companies or other factors. There may be time limitations on the exercise of options or other rights in securities/instruments transactions. Past performance is not necessarily a guide to future performance. Estimates of future performance are based on assumptions that may not be realized. If provided, and unless otherwise stated, the closing price on the cover page is that of the primary exchange for the subject company's securities/instruments. The fixed income research analysts, strategists or economists principally responsible for the preparation of Morgan Stanley Research have received compensation based upon various factors, including quality, accuracy and value of research, firm profitability or revenues (which include fixed income trading and capital markets profitability or revenues), client feedback and competitive factors. Fixed Income Research analysts', strategists' or economists' compensation is not linked to investment banking or capital markets transactions performed by Morgan Stanley or the profitability or revenues of particular trading desks. The "Important US Regulatory Disclosures on Subject Companies" section in Morgan Stanley Research lists all companies mentioned where Morgan Stanley owns 1% or more of a class of common equity securities of the companies. For all other companies mentioned in Morgan Stanley Research, Morgan Stanley may have an investment of less than 1% in securities/instruments or derivatives of securities/instruments of companies and may trade them in ways different from those discussed in Morgan Stanley Research. Employees of Morgan Stanley not involved in the preparation of Morgan Stanley Research may have investments in securities/instruments or derivatives of securities/instruments of companies mentioned and may trade them in ways different from those discussed in Morgan Stanley Research. Derivatives may be issued by Morgan Stanley or associated persons. With the exception of information regarding Morgan Stanley, Morgan Stanley Research is based on public information. Morgan Stanley makes every effort to use reliable, comprehensive information, but we make no representation that it is accurate or complete. We have no obligation to tell you when opinions or information in Morgan Stanley Research change apart from when we intend to discontinue equity research coverage of a subject company. Facts and views presented in Morgan Stanley Research have not been reviewed by, and may not reflect information known to, professionals in other Morgan Stanley business areas, including investment banking personnel. Morgan Stanley Research personnel may participate in company events such as site visits and are generally prohibited from accepting payment by the company of associated expenses unless pre-approved by authorized members of Research management. Morgan Stanley may make investment decisions or take proprietary positions that are inconsistent with the recommendations or views in this report. To our readers in Taiwan: Information on securities/instruments that trade in Taiwan is distributed by Morgan Stanley Taiwan Limited ("MSTL"). Such information is for your reference only. The reader should independently evaluate the investment risks and is solely responsible for their investment decisions. Morgan Stanley Research may not be distributed to the public media or quoted or used by the public media without the express written consent of Morgan Stanley. Information on securities/instruments that do not trade in Taiwan is for informational purposes only and is not to be construed as a recommendation or a solicitation to trade in such securities/instruments. MSTL may not execute transactions for clients in these securities/instruments. To our readers in Hong Kong: Information is distributed in Hong Kong by and on behalf of, and is attributable to, Morgan Stanley Asia Limited as part of its regulated activities in Hong Kong. If you have any queries concerning Morgan Stanley Research, please contact our Hong Kong sales representatives. Morgan Stanley is not incorporated under PRC law and the research in relation to this report is conducted outside the PRC. Morgan Stanley Research does not constitute an offer to sell or the solicitation of an offer to buy any securities in the PRC. PRC investors shall have the relevant qualifications to invest in such securities and shall be responsible for obtaining all relevant approvals, licenses, verifications and/or registrations from the relevant governmental authorities themselves. Morgan Stanley Research is disseminated in Brazil by Morgan Stanley C.T.V.M. S.A.; in Japan by Morgan Stanley MUFG Securities Co., Ltd. and, for Commodities related research reports only, Morgan Stanley Capital Group Japan Co., Ltd; in Hong Kong by Morgan Stanley Asia Limited (which accepts responsibility for its contents) and by Bank Morgan Stanley AG, Hong Kong Branch; in Singapore by Morgan Stanley Asia (Singapore) Pte. (Registration number 199206298Z) and/or Morgan Stanley Asia (Singapore) Securities Pte Ltd (Registration number 200008434H), regulated by the Monetary Authority of Singapore (which accepts legal responsibility for its contents and should be contacted with respect to any matters arising from, or in connection with, Morgan Stanley Research) and by Bank Morgan Stanley AG, Singapore Branch (Registration number T11FC0207F); in Australia to "wholesale clients" within the meaning of the Australian Corporations Act by Morgan Stanley Australia Limited A.B.N. 67 003 734 576, holder of Australian financial services license No. 233742, which accepts responsibility for its contents; in Australia to "wholesale clients" and "retail clients" within the meaning of the Australian Corporations Act by Morgan Stanley Wealth Management Australia Pty Ltd (A.B.N. 19 009 145 555, holder of Australian financial services license No. 240813, which accepts responsibility for its contents; in Korea by Morgan Stanley & Co International plc, Seoul Branch; in India by Morgan Stanley India Company Private Limited; in Indonesia by PT Morgan Stanley Asia Indonesia; in Canada by Morgan Stanley Canada Limited, which has approved of and takes responsibility for its contents in Canada; in Germany by Morgan Stanley Bank AG, Frankfurt am Main and Morgan Stanley Private Wealth Management Limited, Niederlassung Deutschland, regulated by Bundesanstalt fuer Finanzdienstleistungsaufsicht (BaFin); in Spain by Morgan Stanley, S.V., S.A., a
38

March 19, 2015 Wholesale & Investment Banking
M O R G A N S T A N L E Y B L U E P A P E R Morgan Stanley group company, which is supervised by the Spanish Securities Markets Commission (CNMV) and states that Morgan Stanley Research has been written and distributed in accordance with the rules of conduct applicable to financial research as established under Spanish regulations; in the US by Morgan Stanley & Co. LLC, which accepts responsibility for its contents. Morgan Stanley & Co. International plc, authorized by the Prudential Regulatory Authority and regulated by the Financial Conduct Authority and the Prudential Regulatory Authority, disseminates in the UK research that it has prepared, and approves solely for the purposes of section 21 of the Financial Services and Markets Act 2000, research which has been prepared by any of its affiliates. Morgan Stanley Private Wealth Management Limited, authorized and regulated by the Financial Conduct Authority, also disseminates Morgan Stanley Research in the UK. Private UK investors should obtain the advice of their Morgan Stanley & Co. International plc or Morgan Stanley Private Wealth Management representative about the investments concerned. RMB Morgan Stanley (Proprietary) Limited is a member of the JSE Limited and regulated by the Financial Services Board in South Africa. RMB Morgan Stanley (Proprietary) Limited is a joint venture owned equally by Morgan Stanley International Holdings Inc. and RMB Investment Advisory (Proprietary) Limited, which is wholly owned by FirstRand Limited. FirstRand Limited and Rand Merchant Bank (a division of FirstRand Limited) may presently hold a 1% or more of a class of common equity securities, in any companies covered in this report. This may include holding a net long or short position of US$1 million or more of Debt securities. Within the last 12 months, FirstRand Limited may have co-managed a public offering, received compensation for investment services, or services other than investment services, or expects to receive or intends to seek compensation for investment services not disclosed in this report. Additionally, FirstRand limited does make a market in securities or acts as a corporate broker not disclosed in this report. FirstRand Limited (or it's directors, officers or employees) may, to the extent permitted by law, own or have a position in the securities of any company or related company referred to herein, and may add to or dispose of any such position or may make a market or act as a principle in any transaction in such securities or financial instruments. Directors of FirstRand Limited may also be directors of any of the companies mentioned in this report. FirstRand Limited may from time to time provide or solicit investment banking underwriting or other financial services to, for, or from any company referred to herein. FirstRand Limited (or its directors, officers or employees) may, to the extent permitted by law, act upon or use the information or opinions presented herein, research or analysis on which they are based prior to the material being published. FirstRand Limited may have issued, or may in the future issue other advice, which is inconsistent with, and reaches different conclusions from the information presented in this report. The information in Morgan Stanley Research is being communicated by Morgan Stanley & Co. International plc (DIFC Branch), regulated by the Dubai Financial Services Authority (the DFSA), and is directed at Professional Clients only, as defined by the DFSA. The financial products or financial services to which this research relates will only be made available to a customer who we are satisfied meets the regulatory criteria to be a Professional Client. The information in Morgan Stanley Research is being communicated by Morgan Stanley & Co. International plc (QFC Branch), regulated by the Qatar Financial Centre Regulatory Authority (the QFCRA), and is directed at business customers and market counterparties only and is not intended for Retail Customers as defined by the QFCRA. As required by the Capital Markets Board of Turkey, investment information, comments and recommendations stated here, are not within the scope of investment advisory activity. Investment advisory service is provided exclusively to persons based on their risk and income preferences by the authorized firms. Comments and recommendations stated here are general in nature. These opinions may not fit to your financial status, risk and return preferences. For this reason, to make an investment decision by relying solely to this information stated here may not bring about outcomes that fit your expectations. The trademarks and service marks contained in Morgan Stanley Research are the property of their respective owners. Third-party data providers make no warranties or representations relating to the accuracy, completeness, or timeliness of the data they provide and shall not have liability for any damages relating to such data. The Global Industry Classification Standard (GICS) was developed by and is the exclusive property of MSCI and S&P. Morgan Stanley Research or portions of it may not be reprinted, sold or redistributed without the written consent of Morgan Stanley. Morgan Stanley Research, or any portion thereof may not be reprinted, sold or redistributed without the written consent of Morgan Stanley. Other Important Disclosures from Oliver Wyman Copyright © 2015 Oliver Wyman. All rights reserved. This report may not be reproduced or redistributed, in whole or in part, without the written permission of Oliver Wyman and Oliver Wyman accepts no liability whatsoever for the actions of third parties in this respect. This report is not a substitute for tailored professional advice on how a specific financial institution should execute its strategy. This report is not investment advice and should not be relied on for such advice or as a substitute for consultation with professional accountants, tax, legal or financial advisers. Oliver Wyman has made every effort to use reliable, up-to-date and comprehensive information and analysis, but all information is provided without warranty of any kind, express or implied. Oliver Wyman disclaims any responsibility to update the information or conclusions in this report. Oliver Wyman accepts no liability for any loss arising from any action taken or refrained from as a result of information contained in this report or any reports or sources of information referred to herein, or for any consequential, special or similar damages even if advised of the possibility of such damages. This report may not be sold without the written consent of Oliver Wyman. The Oliver Wyman employees that contributed to this report are neither FCA nor FINRA registered. Oliver Wyman is not authorised or regulated by the Financial Conduct Authority or the Prudential Regulatory Authority. As a consultancy firm it may have business relationships with companies mentioned in this report and as such may receive fees for executing this business. Please refer to www.oliverwyman.com for further details.
39

The Americas 1585 Broadway New York, NY 10036-8293 United States Tel: +1 (1)212 761 4000
Europe 20 Bank Street, Canary Wharf London E14 4AD United Kingdom Tel: +44 (0)20 7425 8000
Japan 1-9-7 Otemachi, Chiyoda-ku Tokyo 100-8104 Japan Tel: +81 (0) 3 6836 5000
Asia/Pacific 1 Austin Road West Kowloon Hong Kong Tel: +852 2848 5200
EMEA 55 Baker Street London W1U 8EW United Kingdom Tel: +44 20 7333 8333 [email protected]
Americas 1166 Avenue of the Americas 29th Floor New York, NY 10036 United States Tel: +1 212 541 8100 [email protected]
Asia Pacific 8 Cross Street, #24-01 048424 Singapore Tel: +65 6510 9700 [email protected]
© 2015 Morgan Stanley and Oliver Wyman