Who Killed the Inner Circle? The Decline of the American ...
42
Who Killed the Inner Circle? The Decline of the American Corporate Interlock Network 1 Johan S. G. Chu University of Chicago Gerald F. Davis University of Michigan U.S. corporations have shared members of their boards of directors since the early 1900s, creating a dense interlock network in which nearly every major corporation was connected through short paths and elevat- ing a handful of well-connected directors to an influential “inner circle.” This network remained highly connected throughout the 20th century, serving as a mechanism for the rapid diffusion of information and prac- tices and promoting elite cohesion. Some of the most well-established findings in the sociology of networks sprang from this milieu. In the 2000s, however, board recruiting practices changed: the authors find that well-connected directors became less preferred. As a result, the in- ner circle disappeared and companies became less connected to each other. Revisiting three classic studies, on the diffusion of corporate pol- icies, on corporate executives’ political unity, and on elite socialization, shows that established understandings of the effects of board inter- locks on U.S. corporations, directors, and social elites no longer hold. In the century after Louis Brandeis published Other Peoples’ Money in 1914, the U.S. corporate interlock network became perhaps the most studied net- work in the social sciences. Brandeis argued that a handful of bankers were 1 We are grateful to Mark Mizruchi for his invaluable advice and comments on this study and to our colleagues in the Management and Organizations Department at Michigan’s Ross School of Business and the Organizations and Markets group at Chicago Booth. Di- rect correspondence to Johan Chu, University of Chicago Booth School of Business, 5807 South Woodlawn Avenue, Chicago, Illinois 60637. E-mail: [email protected] © 2016 by The University of Chicago. All rights reserved. 0002-9602/2016/12203-0002$10.00 714 AJS Volume 122 Number 3 ( November 2016): 714– 54 This content downloaded from 128.135.212.099 on December 09, 2016 14:25:29 PM All use subject to University of Chicago Press Terms and Conditions (http://www.journals.uchicago.edu/t-and-c).
Transcript of Who Killed the Inner Circle? The Decline of the American ...
Who Killed the Inner Circle? The Decline ofthe American Corporate Interlock Network1
Johan S. G. ChuUniversity of Chicago
Gerald F. DavisUniversity of Michigan
U.S. corporations have shared members of their boards of directorssince the early 1900s, creating a dense interlock network inwhich nearlyeverymajor corporationwas connected through short paths and elevat-ing a handful of well-connected directors to an influential “inner circle.”This network remained highly connected throughout the 20th century,serving as a mechanism for the rapid diffusion of information and prac-tices and promoting elite cohesion. Some of the most well-establishedfindings in the sociology of networks sprang from this milieu. In the2000s, however, board recruiting practices changed: the authors findthat well-connected directors became less preferred. As a result, the in-ner circle disappeared and companies became less connected to eachother. Revisiting three classic studies, on the diffusion of corporate pol-icies, on corporate executives’ political unity, and on elite socialization,shows that established understandings of the effects of board inter-locks on U.S. corporations, directors, and social elites no longer hold.
In the century after Louis Brandeis publishedOther Peoples’Money in 1914,the U.S. corporate interlock network became perhaps the most studied net-work in the social sciences. Brandeis argued that a handful of bankers were
1 We are grateful toMarkMizruchi for his invaluable advice and comments on this studyand to our colleagues in the Management and Organizations Department at Michigan’sRoss School of Business and the Organizations andMarkets group atChicagoBooth.Di-rect correspondence to JohanChu, University of Chicago Booth School of Business, 5807SouthWoodlawnAvenue,Chicago, Illinois 60637.E-mail: [email protected]
© 2016 by The University of Chicago. All rights reserved.0002-9602/2016/12203-0002$10.00
714 AJS Volume 122 Number 3 (November 2016): 714–54
This content downloaded from 128.135.212.099 on December 09, 2016 14:25:29 PMAll use subject to University of Chicago Press Terms and Conditions (http://www.journals.uchicago.edu/t-and-c).

able to dominate the corporate economy through positions as directors on theboards of their subject companies, creating an “endless chain” that served as“themost potent instrument of theMoneyTrust”Brandeis (1914, p. 51).Mills(1956) described how a power elite knit together business, government, andthe military. Mintz and Schwartz (1985) showed that financial institutionsheld enduring positions at the apex of the network, while Useem (1984) un-covered the distinctive psychology and class consciousness of well-connecteddirectors, whom he labeled the “inner circle.”2 Dozens of studies since thenhave shown the potency of this network for diffusing ideas, promoting com-mon corporate practices, and enabling coordinated action (Mizruchi 1996;Dreiling and Darves 2011).
Throughout the 20th century, the network had several enduring proper-ties. While the vast majority of directors served on only one board, an elitegroupof a fewdozenpeople—the inner circle—servedonmanyboards. Sim-ilarly, a handful of corporations maintained large boards staffed with well-connected directors that gave them a distinct status as hubs of the network.As a result of these two features, the average geodesic, or shortest networkdistance, between any pair of directors or any pair of companies was re-markably short; that is, the network was a small world (Watts 1999). In1904, 90.9%of large corporationswerewithin three steps of themost centralboard (Mizruchi 1982); the comparable figure in 1999was 82.4%.A flu virusthat infected the J. P. Morgan Chase board in January 2001 could havespread to over 80% of the Fortune 1000 by May through monthly boardmeetings (Davis, Yoo, and Baker 2003).
All this has changed since the turn of the 21st century. In 1974, more than90 directors served on five or more major corporate boards in the UnitedStates. In 1994, at least 75 people held five board seats. By 2012, there wasonly one director serving onfive S&P500 boards: ShirleyAnn Jackson, pres-ident ofRensselaerPolytechnic Institute.The inner circle hadvanished.More-over, because the number of intercorporate connections rises geometricallywith board memberships—five people who each serve on two boards createonly five connections, while one person who serves on five boards creates10—these well-connected directors were especially consequential for theoverall densityof thenetwork.Withoutan inner circle, the shortest pathsbe-tween firms grow much longer. A large body of work premised on denselyconnectedcorporateboardsmayno longerbeapplicable in theUnitedStates(see Mizruchi [1996] for a review).
2 In addition to membership on multiple corporate boards, Useem (1984) identified mem-bers of the inner circle by their service in elite policy organizations, high-level governmentpositions, and business groups such as the Business Roundtable. This article focuses onboard memberships, but our findings are consistent with recent work on the decline ofother mechanisms for elite cohesion.
715
Who Killed the Inner Circle?
This content downloaded from 128.135.212.099 on December 09, 2016 14:25:29 PMAll use subject to University of Chicago Press Terms and Conditions (http://www.journals.uchicago.edu/t-and-c).

In this article, we describe macrostructural changes in the U.S. corporateinterlock network from 1997 to 2010, explain why these changes occurred,and outline their implications.We document the decline of some of the mostenduring properties of the network since the turn of the 21st century. Usingcomprehensive time-series data on over 27,000 directors serving on almost2,500 corporate boards in the United States, we analyze both the dynamicsof tie creation and dissolution and the aggregate properties of the resultingnetwork. Our findings show that the inner circle, a durable feature of theU.S. corporate landscape over the 20th century, has disappeared, and thatdistances between companies on the interlock network have lengthened tounprecedented levels. Regression and simulation analysis provides evidencethat thecauseof thesechangeswas thebreakdownofaprocessofpreferentialattachment. During the 20th century, well-connected directors who alreadyserved on multiple corporate boards were substantially more likely to gainnewappointments than thosewhoservedononlyoneboard; in short, the richin board seats got richer. Since the turn of the 21st century, however, well-connected, multiboarded directors have lost their advantage. This changehad important consequences for the aggregate structure of the network.We then illustrate the implications of a less connected network on the ef-
fects of board ties, by verifying whether three well-established findings inthe literature still hold true. First, we find that introductions from existingmultiboard directors (Useem 1984) no longer create a viable pathway to thecorporate interlock network inner circle. There is no cohesive, far-reachinginner circle left to join, and recreating one would be impossible given cur-rent director hiring practices. Second, simulations show that the politicalunifying power of the interlock network (Mizruchi 1992; Burris 2005) isweakened and that the prospects for broad-based, moderate political actionby corporate elites are lowered. Third, we show that multiple interlock tiesto prior adopters (Davis 1991) can no longer explain diffusion of practicesacross the network. Rapid, broad-based diffusion of new corporate prac-tices, if it still occurs, happens through other mechanisms.
THE U.S. CORPORATE ELITE NETWORK
Corporate board interlocks are perhaps the most studied network in the so-cial sciences. In his analysis of early 20th-century capitalism, Lenin ([1916]1939) drew on Jeidels’s (1905) study of bank interlocks in Germany to por-tray intrinsic tendencies toward the concentration of economic power.Bran-deis (1914) echoed this theme in his description of early finance capitalismin the United States, where a few bankers served on dozens of corporateboards. Generations of scholars have since investigated interlock networksin economies around theworld (e.g.,Mintz andSchwartz 1985; Stokman,Zieg-ler, and Scott 1985; Scott 1997; Windolf 2002). More recent cross-national
716
American Journal of Sociology
This content downloaded from 128.135.212.099 on December 09, 2016 14:25:29 PMAll use subject to University of Chicago Press Terms and Conditions (http://www.journals.uchicago.edu/t-and-c).
comparisons show that countries vary widely in the structural propertiesof their interlock networks, both cross-sectionally and over time (Kogut2012).
What is at stake is how we understand the social structure of corporatecontrol. The earliest work on board interlocks took for granted that demon-strating the existence of a well-connected social elite was sufficient to showthat it mattered. Mills (1956, p. 283) stated, “The key organizations, per-haps, are the major corporations themselves, for on the boards of directorswe find a heavy overlapping among the members of these several elites.”And, “We must remember that these men of the power elite now occupythe strategic places in the structure of American society; that they commandthe dominant institutions of a dominant nation; that, as a set of men, theyare in a position to make decisions with terrible consequences for the under-lying populations of the world” (pp. 286–87). An early agenda for studyingelites was to highlight just how small the world of these elites was throughshared affiliations such as board memberships.
By the late 1980s, sociologists moved beyond simply showing that inter-locks were common to tracing their effects on corporate behavior. The po-litical action committees of companies whose executives served on the samebank boards donated to similar candidates, suggesting that interlocks werea mechanism for political cohesion (Mizruchi 1989, 1992). Contentious cor-porate governance practices quickly spread from board to board throughshared directors, indicating that the network was a substrate for diffusion(Davis 1991). Dozens of subsequent studies showed shared directorships tobe a pervasive influence on board-level decisions: perhaps unsurprisingly,what directors experienced on one board shaped what they did on otherboards (see Mizruchi 1996, for an early review).
The aggregate effect of these dyadic ties depends on the shape of the largernetwork in which they are embedded. A virus can spread faster in midtownManhattan than in an archipelago, and practices that diffuse through adense network of shared directors can spread faster than those that diffusethrough sparse geographic networks (Davis and Greve 1997). Moreover,communities with dense local corporate networks are better able to mobilizethan those without, whether to lobby the state legislature for favorable pol-icies (Vogus and Davis 2005), to support local nonprofits (Marquis, Davis,and Glynn 2013), or to launch a successful Olympics bid, as Atlanta’s well-connected business elite did (Glynn 2008). At the national level, students ofelites have seen a dense corporate network as perhaps the most importantmechanism for coherent—often politically moderate and pragmatic—politi-cal action on the part of business (Useem 1984; Mizruchi 2013). By implica-tion, its absence could undermine the possibility of class conscious elites. Thatis, the macrostructure of the network is essential for many of the network’seffects.
717
Who Killed the Inner Circle?
This content downloaded from 128.135.212.099 on December 09, 2016 14:25:29 PMAll use subject to University of Chicago Press Terms and Conditions (http://www.journals.uchicago.edu/t-and-c).

The interlock network has several distinctive features that shape howweunderstand it. In contrast tomany social networks,where actors choose theirpartners directly, interlocks are created indirectly via affiliations. Compa-nies connect to other companies as a by-product of their choice of directorswho serve on other boards. Yet unlike many affiliation networks, interlocksare strong ties. As Grannis (2010) points out, the network among sociologydepartments created through faculty hiring (or the network among actorswho appeared in the same film at some point in their careers) lacks plausiblemechanisms for two-way communication. Board meetings, in contrast, ef-fectively ensure regular face-to-face contact between directors and two-waycommunications between connected companies. Daylong board meetingsevery month or two create a powerful substrate for diffusion.Finally, interlocks are a network both of people and of corporations (Breiger
1974). The agenda for work on both aspects of the network was set in the1980s. As a network of people, researchers focused on the careers of directorsand how the inner circle was composed and operated. Useem (1984) foundmembers of the inner circle to be a distinct social type who were prone tobeing involved both in the business world and in public service. Over thecourse of two decades, Westphal and coauthors have analyzed in detail thecareer paths of directors and the factors that led some types to gather manyboard appointments in the United States (Westphal and Zajac 2013). Per-haps the central question here is,What distinguishes those directors who be-come superconnectors serving on a large number of boards? Superconnec-tors are few in number but disproportionately consequential in their effecton the structure of the network. A director serving on two boards createsone tie (between companies A andB), and a director serving on three boardscreates threeties (betweenAandB,BandC,andAandC).Butadirectorserv-ingonnineboards,asVernonJordandidformuchof the1980sand1990s, cre-ates 36 dyadic ties among companies (and over 4,000 two-step ties betweendirectors).As a network of corporations, research focused largely on the status or-
dering among companies—which kinds of companies became central andwhy. Mintz and Schwartz (1985) found that money-center banks made upa stable core for the U.S. interlock network due to their position in the flowof capital in the economy. Early in the century, bank centrality stemmedfrom ties created through the appointment of bankers to corporate boards.By the 1960s, banks instead gained their centrality by appointing to theirown board well-connected outside directors, such as the CEOs of promi-nent companies. Subsequently, Davis and Mizruchi (1999) found that bankboards had shrunk in size and in their recruiting of well-connected direc-tors and that no single type of company monopolized the most central posi-tions. Centrality no longer reliably mapped onto capital flows. Despite theseshifts in the identity of the most central companies, the network as a whole
718
American Journal of Sociology
This content downloaded from 128.135.212.099 on December 09, 2016 14:25:29 PMAll use subject to University of Chicago Press Terms and Conditions (http://www.journals.uchicago.edu/t-and-c).
remained highly connected,with short path lengths connecting almost all di-rectors and companies, as a result of the continued existence of a highly con-nected core of directors (Davis et al. 2003).
CORPORATE GOVERNANCE AND CHALLENGES TO THEINTERLOCK NETWORK SINCE 2000
For almost the whole of the 20th century, the distribution of boardmember-ships was highly skewed. While thousands of directors served on only oneboard, and hundreds on two or three, a few dozen sat on five or more, and ahandful on eight or more. A highly skewed distribution held at the dawn ofthe corporate age at the beginning of the 20th century (Mizruchi 1982), inthe 1930s and 1940s (Mills 1956, p. 383 n. 12), and at the end of the century(Davis et al. 2003). The existence of an inner circle was an enduring featureof the U.S. corporate landscape, even as particular directors and companiescame andwent and as the kinds of people occupying central positions shiftedfrom bankers to corporate executives to prominent figures from the nonprofitand academic worlds.
The two key properties of the network—the presence of an inner circle andshort path lengths (geodesics) connecting directors and companies—aremath-ematically related. Superconnectors have a vastly disproportionate impacton the network’smacrostructure, increasing its density (percentage of poten-tial ties realized) and shrinking its average geodesic. One superconnectorserving on 10 boards creates 45 unique ties among corporations, as much as15 directors who serve on three boards each or 45 directors serving on twoboards each. Thus, the presence of an inner circle of superconnectors is crit-ical for creating a densely connected network.
The existence of an inner circle reflects the recruiting practices of boards:some directors are attractive to many kinds of boards and have the oppor-tunity to become superconnectors. Previous studies of the corporate inter-lock network suggested different bases for preferential recruitment. One ba-sis is broadly demographic: directors are attractive due to their background,education, race, or gender. A second basis is network dynamics: certain di-rectors are advantaged either because of the processes that boards use whensearching for new directors or because of the criteria that boards use to eval-uate director candidates. First, a director who served on many boards hadmany codirectors who could provide personal recommendations for newboard appointments.3 Second, sitting on many boards in itself increased thevalue of a director for new board appointments. Useem (1984) argued that
3 In almost all the instances where Vernon Jordan gained another board seat, he had pre-viously served on another board with at least one director on the new board (Davis et al.2003, p. 304).
719
Who Killed the Inner Circle?
This content downloaded from 128.135.212.099 on December 09, 2016 14:25:29 PMAll use subject to University of Chicago Press Terms and Conditions (http://www.journals.uchicago.edu/t-and-c).

directors sitting on many boards gained broad-based business intelligence,social connections, and legitimacy within the corporate and political worlds,thus making them attractive as codirectors. Companies encouraged theirbest executives to serveonoutsideboards togain access to thesenetworkben-efits. Moreover, there is reason to expect that directors convey status to theirboards via the other boards on which they serve. Among the few pieces ofinformation that shareholders learn about directors during their annual elec-tion is what other boards they serve on. For instance, a bankwhose directorsserveonmanyotherwell-knowncorporateboardsgains the implicit endorse-ment of these firms (Davis and Robbins 2005).Any of these rules of attachment—widely shared preferences based on
demography or network positions—could yield a distribution of boardmem-berships in which a few directors end up on many boards. This is in mostcases sufficient to yield a small world network (Barabási and Albert 1999;Watts 1999). Thus, the disappearance of the inner circle suggests that therules of attachment changed around the turn of the 21st century.We examine changes in the rules of attachment, that is, the characteristics
that made directors more or less likely to join new boards, to ascertain thecauses of the demise of the inner circle. We focus on demography and net-work dynamics. For most of the 20th century, boards were composed al-most exclusively ofwhitemen, typically executiveswith elite pedigrees. Thischanged somewhat during the 1980s and 1990s, and boards came to containmore nonexecutives and became modestly more diverse. Given that boardsprefer to recruit those with whom at least one director is acquainted, one ofthe results of this newfound preference for diversity was that a small hand-ful of women and minority directors each joined a large number of boards:once suchadirector joined oneboard, he or shewas in aposition tobe invitedonto several more. By 2002, Forbesmagazine reported that four of the fivebest connected directors onS&P500 boardswereAfrican-American (DiCarlo2002).Studies also showed that boards preferred to recruit sought-after direc-
tors who already served on many other boards, especially if the companieson whose boards they served were successful (Davis and Robbins 2005). Aboard’s status is transmitted in part by its affiliations (Bothner, Smith, andWhite 2010), which suggests that directors of prominent and successful firmswould be preferred.This process canwork in reverse, however: directors (and, by association,
their firms) can be tainted by their affiliations (Sullivan, Haunschild, andPage 2007). In the wake of corporate scandals at Enron, WorldCom, andelsewhere in the early 2000s, directors’ other affiliations—even with firmslauded for their performance and innovation—could be hazardous to afirm’sprestige. Directors became subject to increased scrutiny through the publi-cation of “report cards” by outside evaluators, where directors serving on
720
American Journal of Sociology
This content downloaded from 128.135.212.099 on December 09, 2016 14:25:29 PMAll use subject to University of Chicago Press Terms and Conditions (http://www.journals.uchicago.edu/t-and-c).
multiple boards faced greater hazards of downgrades (e.g., due to earningsrestatements). Moreover, simply serving on several boards in itself came tobe seen as prima facie evidence of inattention. Rather than being a sign ofstatus and talent, service onmultiple boardswas classified bymany as a signof being stretched too thin, or “overboarded.” Institutional Shareholder Ser-vices (ISS), an influential firm that advises institutional investors on howto vote their shares at the annual meetings where directors are elected, cod-ified this diagnosis. Beginning with the 2004 proxy season, ISS began rec-ommending that votes be withheld for directors who served on more thansix public company boards. For CEOs, the recommended limit on numberof boards was reduced to three (including their own firm). As of this writing,the policy stands at a maximum of six boards (ISS 2015, p. 15). What is per-haps remarkable is that at the time the policy was enacted, it applied to fewerthan 10 individuals (of whom at least fivewere African-American), none sit-ting on more than seven boards. A six-board maximum would have onlylimited influence on the existence of an inner circle.
The new policy’s real significance is that it indicated a reversal of thevaluation of being well connected. As we have noted, for decades well-connected directors were highly sought after for their experience, connec-tions, and legitimating potential. Our discussions with veteran directors andcorporate counsel suggest that this preference for well-connected directorshas reversed. In some cases the new standards are codified in corporate pol-icies that limit the number of boards on which directors can serve. Bank ofAmerica’s current corporate governance guidelines state, “To ensure that di-rectors have sufficient time to properly discharge their duties, directors areexpected to seek Corporate Governance Committee approval prior to join-ing the board of any other public company. No director shall serve on theboards of more than six public companies, including the Company’s Board”(emphasis added). General Motors’ standards say, “It is the expectation ofthe Board that every member have sufficient time to commit to preparationforandattendanceatBoardandcommitteemeetings.Therefore, it is thesenseof the Board that non-employee directors should not serve onmore than fourother boards of publicly traded companies (excluding non-profits and subsid-iaries)unless theBoarddetermines that suchservicewillnot impair theabilityof suchdirector to effectivelyperformhis orherobligations asadirectorof theCompany” (emphasis added). And Altria’s standards state, “Each director isexpected to ensure that other commitmentsdonot interferewith thedischargeof his or her duties as a director of the Company. Consequently, directorsshould not serve on more than three other public company boards. Directorsare expected to informtheChairmanand theChair ofNominating,CorporateGovernance and Social Responsibility Committee upon becoming a directorof any other public company or becoming a member of the audit committeeof any other public company” (emphasis added). The number of allowable
721
Who Killed the Inner Circle?
This content downloaded from 128.135.212.099 on December 09, 2016 14:25:29 PMAll use subject to University of Chicago Press Terms and Conditions (http://www.journals.uchicago.edu/t-and-c).

boardmembershipsvaries—six forBankofAmericadirectors,fiveforGMdi-rectors (withtheoptionforawaiver), fourforAltriadirectors—butwhat is sig-nificant is that firms have any stated policies limiting the number of director-ships, something that was almost unheard of before 2001.
DATA SOURCES
We begin our analysis by examining changes in the macrostructure of theU.S. board interlock network from 1997 to 2010.We then determine whetherthese structural changes can be explained by changes in the preference forwell-boarded, well-connected directors by first identifying shifts in boardhiring patterns and then usingMonte Carlo simulations to ascertainwhetherthese shifts were sufficient to cause the interlock network’s observed macro-structural changes.For these investigations, we created a data set covering S&P 1500 boards
from 1997 to 2010 inclusive, using data from ISS (formerly RiskMetrics),Boardex, and CRSP/Compustat. Annual board composition data werecreated using board data from ISS/RiskMetrics and interlock data fromBoardex. While the ISS/RiskMetrics data set is the one most commonlyused in studies of board interlocks, it suffers from issues of data quality.Names are listed inconsistently, different people with the same name orsimilar names are sometimes indicated as being the same person, and thesame person is often listed using several “unique” identifiers. The Boardexdata set uses company and director unique identifiers consistently. (Duringdata processing, we found only one instance of an identifier being usedinconsistently in Boardex, compared to thousands of inconsistencies in ISS/RiskMetrics.) Boardex has its own weaknesses, however. The data coverageis incomplete for firms and individuals that were not active into the late2000s, and Boardex sometimes splits one company into two entries.Wecorrected ISS/RiskMetrics companyanddirector identifiersbymatch-
ing them to Boardex identifiers, using text similarity matching for companyand director names, director board lists, and company director lists and pat-tern matching for interlocks. We created algorithms to automatically gen-erate suggested corrections to ISS/RiskMetrics data using linked Boardexdata. Suggested corrections were manually checked before being reflectedin the final data set.With this corrected data set, we created the list of companies that were
on the S&P 1500 as of their annual meeting date according to ISS/Risk-Metrics and generated the corresponding lists of boardmembers.We addedannual performance data from CRSP/Compustat, matching entries on CU-SIPs (Committee on Uniform Security Identification Procedures’ six-digit,alphanumeric issuer codes) and ticker symbols. For supplemental analyses of
722
American Journal of Sociology
This content downloaded from 128.135.212.099 on December 09, 2016 14:25:29 PMAll use subject to University of Chicago Press Terms and Conditions (http://www.journals.uchicago.edu/t-and-c).

the effect of shareholder proposals on director hiring, we used the ISS/Risk-Metrics Shareholder Proposals data set, matching on company name.
The S&P 1500 sample includes 2,454 distinct companies over 17,065company-years and 27,192directors over 151,135 director-years. From theselists of companies andboards,we created lists of annual board interlocks (com-panies sharing a director) and director interlocks (directors serving togetheron the same board). The sample consisted of 54,220 corporate interlock-years for an average of slightly under 3,900 interlocks per year and 882,120director interlock-years for an average of slightly over 63,000 interlocks peryear.
THE COLLAPSE OF CONNECTEDNESS IN THEINTERLOCK NETWORK
Figure 1 shows mean geodesics in the main component of the corporate in-terlock network connecting the largest U.S. public companies. Average net-work distances stayed near constant between 1982 and 1999 (Davis et al.2003) but increased sharply from 2000 to 2010 (this study). The average dis-tance between two companies in the main component of the S&P 500 cor-porate interlock network increased from 3.21 in 2000 to 4.23 in 2010, whilethe S&P 1500 mean geodesic increased from 4.16 to 4.97 during the sameperiod. Table 1 lists the sizes of themaximal three-step networks in the largeU.S. public company network for selected years from 1904 to 2010. Like themost central companies over the previous 100 years, the company with thelargest three-step network in 2000 (Sara Lee) had board ties linking it toover 80% of S&P 500 boards in three steps, and none of the 425 S&P 500main component companies were more than five steps away from Sara Leeon thecorporate interlocknetwork.Bycontrast, in2010UnitedTechnologies
FIG. 1.—Mean geodesic in main component of board interlock networks, 1982–2010.Data for 1982–99 are from Davis et al. (2003); 1997–2010, this study; study populationdiffers across the sources.
723
Who Killed the Inner Circle?
This content downloaded from 128.135.212.099 on December 09, 2016 14:25:29 PMAll use subject to University of Chicago Press Terms and Conditions (http://www.journals.uchicago.edu/t-and-c).

Company had the largest three-step network but had barely more than 60%of S&P 500 boards linked within three steps, and eight steps were requiredto reach all companies in the main component fromUnited Technologies.The decreased connectedness in the interlock network (fig. 2) was caused
by (1) decreased numbers of direct ties from companies to companies and(2) changes in the distribution of number of ties from companies to compa-nies and directors to directors. The average degree for companies in the S&P1500 corporate interlock network decreased from 7.14 in 2000 to 4.98 in2010. There were 62 companies with more than 20 direct board ties (shared
TABLE 1Characteristics of the Board Interlock Network, 1904–2010
Characteristic 1904 1912 1919 1935 1964 1969 1974 1999 2000 2010
Number of connectedfirms . . . . . . . . . . . . . . . 154 140 143 145 153 153 145 811 425 440
Three-step reachof most centralcorporation (%) . . . . . . . 90.9 81.9 85.5 80.7 90.4 91.0 84.9 82.4 84.2 60.9
Directors on six ormore boards . . . . . . . . . 24 27 14 3 4 2 0 * 8 0
NOTE.—The 1904–74 data are fromMizruchi (1982, p. 105–8); 1999, fromDavis et al. (2003,p. 320); 2000–2010, this study; study population differs across the three sources.* Data not available in source article.
FIG. 2.—S&P 500 interlock network main component, 1996 (left) and 2010 (right)
724
American Journal of Sociology
This content downloaded from 128.135.212.099 on December 09, 2016 14:25:29 PMAll use subject to University of Chicago Press Terms and Conditions (http://www.journals.uchicago.edu/t-and-c).

directors) to other companies in 2000, with Sara Lee and Allstate having37 direct ties each. By 2010, only one company with more than 20 direct tiesremained—MarathonOil with only 21. (See table 2 for a list of themost con-nected companies and their number of shared-director ties to other compa-nies in 2000 and 2010.) The average degree for directors (number of direc-tors sharing boards with the focal director) declined from 12.32 to 10.95, asmaller drop as themodal director continued to serve ononeboardwith eightto 10 other directors. The connectedness of the most connected directors de-creased dramatically, however. In 2000, Vernon Jordan served on boards
TABLE 2Top 25 (including Ties) Degree Centrality Companies
in S&P 1500 Interlock Network
YEAR 2000 YEAR 2010
Rank Degree Company Rank Degree Company
1 . . . . . 37 Sara Lee 1 . . . . . 21 Marathon Oil1 . . . . . 37 Allstate 2 . . . . . 20 Northern Trust3 . . . . . 35 Bank of America 2 . . . . . 20 Stanley Black & Decker3 . . . . . 35 SBC Communications 2 . . . . . 20 H. J. Heinz Company5 . . . . . 34 Bell Atlantic 2 . . . . . 20 Lowe’s Companies6 . . . . . 33 Chase Manhattan 6 . . . . . 19 The Progressive Corpo-
ration6 . . . . . 33 Schering-Plough 7 . . . . . 18 Caterpillar8 . . . . . 32 ExxonMobil 7 . . . . . 18 Aon9 . . . . . 30 Xerox 7 . . . . . 18 Suntrust Banks9 . . . . . 30 Equifax 10 . . . . 17 Prudential Financial9 . . . . . 30 Honeywell International 10 . . . . 17 The PNC Financial Ser-
vices Group12 . . . . 29 AMR 10 . . . . 17 International Business
Machines12 . . . . 29 Bank One 10 . . . . 17 Keycorp12 . . . . 29 Suntrust Banks 10 . . . . 17 United Technologies12 . . . . 29 Kroger 10 . . . . 17 Chevron16 . . . . 28 Protective Life 10 . . . . 17 WellsFargo andCompany16 . . . . 28 Kmart 10 . . . . 17 McDonald’s16 . . . . 28 Vulcan Materials 10 . . . . 17 FMC Technologies16 . . . . 28 BellSouth 10 . . . . 17 Pfizer16 . . . . 28 Minnesota Mining and
Manufacturing20 . . . . 16 Sprint Nextel
21 . . . . 27 Procter and Gamble 20 . . . . 16 The Bank of New YorkMellon
21 . . . . 27 AT&T 20 . . . . 16 Enpro Industries21 . . . . 27 Union Carbide 23 . . . . 15 Eli Lilly and Company21 . . . . 27 Fleet Boston 23 . . . . 15 MeadWestvaco25 . . . . 26 Pepsico 23 . . . . 15 Northrop Grumman25 . . . . 26 Aon 23 . . . . 15 Deere and Company25 . . . . 26 Springs Industries 23 . . . . 15 3M25 . . . . 26 Sunoco 23 . . . . 15 Qwest Communications
International
725
Who Killed the Inner Circle?
This content downloaded from 128.135.212.099 on December 09, 2016 14:25:29 PMAll use subject to University of Chicago Press Terms and Conditions (http://www.journals.uchicago.edu/t-and-c).
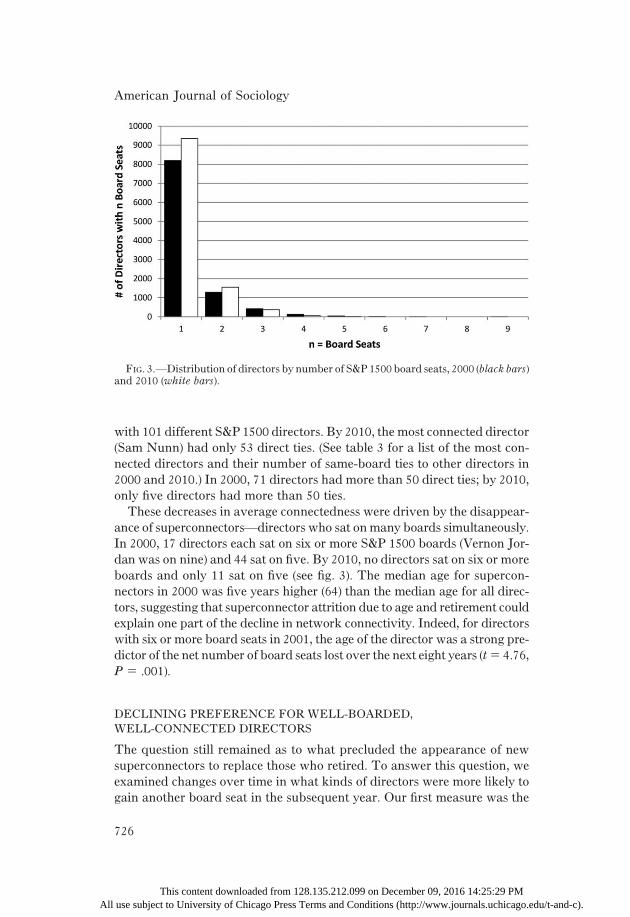
with 101 different S&P 1500 directors. By 2010, the most connected director(Sam Nunn) had only 53 direct ties. (See table 3 for a list of the most con-nected directors and their number of same-board ties to other directors in2000 and 2010.) In 2000, 71 directors had more than 50 direct ties; by 2010,only five directors had more than 50 ties.These decreases in average connectedness were driven by the disappear-
ance of superconnectors—directors who sat onmany boards simultaneously.In 2000, 17 directors each sat on six or more S&P 1500 boards (Vernon Jor-dan was on nine) and 44 sat on five. By 2010, no directors sat on six or moreboards and only 11 sat on five (see fig. 3). The median age for supercon-nectors in 2000 was five years higher (64) than the median age for all direc-tors, suggesting that superconnector attrition due to age and retirement couldexplain one part of the decline in network connectivity. Indeed, for directorswith six or more board seats in 2001, the age of the director was a strong pre-dictor of the net number of board seats lost over the next eight years (t5 4.76,P 5 .001).
DECLINING PREFERENCE FOR WELL-BOARDED,WELL-CONNECTED DIRECTORS
The question still remained as to what precluded the appearance of newsuperconnectors to replace those who retired. To answer this question, weexamined changes over time in what kinds of directors were more likely togain another board seat in the subsequent year. Our first measure was the
726
FIG. 3.—Distribution of directors by number of S&P 1500 board seats, 2000 (black bars)and 2010 (white bars).
American Journal of Sociology
This content downloaded from 128.135.212.099 on December 09, 2016 14:25:29 PMAll use subject to University of Chicago Press Terms and Conditions (http://www.journals.uchicago.edu/t-and-c).

number of board seats held by the focal director—how well boarded the di-rector was.We also used a measure of network reach for each director—thelogged number of boards that each director could be introduced to by hispeer directors.4 To construct this director-year measure, we calculated thenumber of boards that were directly linked to the focal director’s currentboards and on which the focal director did not currently serve.
We examined the effect of several different director characteristics be-yond being well boarded and well connected. Demographically, we taggeddirectors who were female, members of an ethnic minority, or members ofthe social elite (which we defined as nonminority men educated at Harvard,Yale, Princeton, or Stanford). We also tracked whether each director was acorporate executive for each year of our study period.We also controlled fordirectors’ age and age squared in our regressions.
Fama and Jensen (1983) argued that skilled directors were good stewardsof shareholder value and that such directors would be rewarded with moreremunerative, high-profile board seats. While it is impossible to directlymeasure director skill, several studies (e.g., Yermack 2004) found that direc-tors of firms with good performance tended to join more boards, as did di-rectors serving on the boards of large companies (e.g., Davis and Robbins2005).5 We used these indirect measures of director skill: the size (loggednumber of employees) and performance (total annual returns) of companieswhere the focal director currently served. For each director, we used themaximal value of each size and performance measure in our regressions.6
We included two additional network measures. A director’s degree cen-trality (howmany different directors serve on boardswith the focal director)measures the number of peer directors for the focal director without regardto these peers’ other board appointments. We used logged degree centralityin our regressions. Eigenvector centrality is a recursive indicator of the focaldirector’s status in the overall director-director network. Directors who arelinked to many well-linked directors rank higher in eigenvector centrality.
Regressions also controlled for years since the first year in our data setand included individual year effects. Table 4 contains details of how we
5 Westphal and colleagues (Zajac and Westphal 1996; Westphal and Stern 2007) haveshown that being skilled at ingratiation and having a reputation for not activelymonitor-ing CEO actions could lead to more board appointments. We cannot control for this inthe current study.6 Exploratory regressions showed that the maximal values of these measures explainedmore of the variance in subsequent director hiring than means or medians. Using meansor medians instead yields the same significant regression results. Alternate specificationsused logged market value for size and return on assets or return on equity for perfor-mance. The empirical conclusions below were unaffected by these substitutions.
Who Killed the Inner Circle?
727
4 We added 1 to the number before logging, to allow inclusion of directors whose peersdid not sit on any other boards.
This content downloaded from 128.135.212.099 on December 09, 2016 14:25:29 PMAll use subject to University of Chicago Press Terms and Conditions (http://www.journals.uchicago.edu/t-and-c).
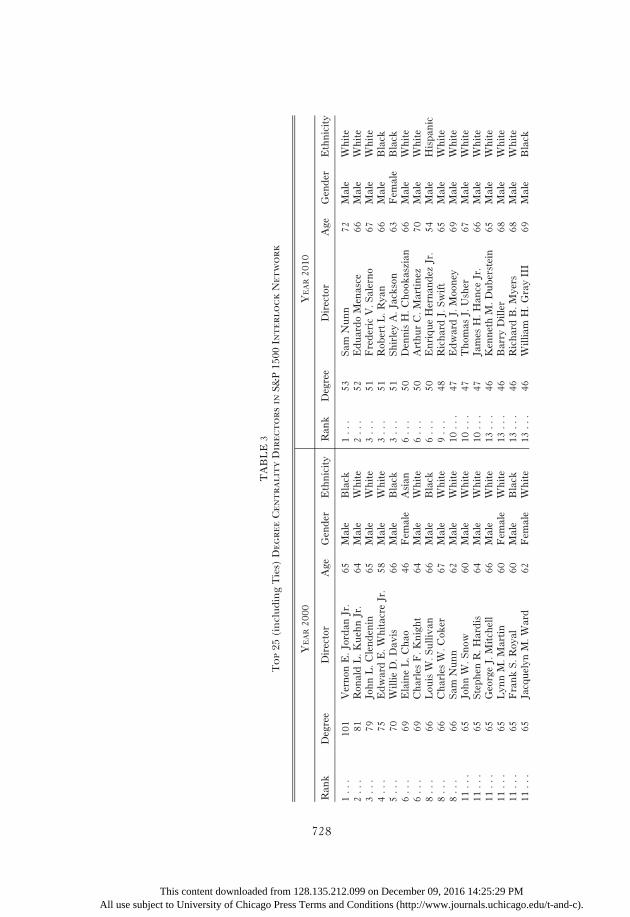
TABLE3
Top25
(includingTies)
DegreeCentralityDirectorsinS&P15
00InterlockNetwork
YEAR2000
YEAR2010
Ran
kDegree
Director
Age
Gender
Ethnicity
Ran
kDegree
Director
Age
Gender
Ethnicity
1..
.101
Vernon
E.Jordan
Jr.
65Male
Black
1..
.53
Sam
Nunn
72Male
White
2..
.81
Ron
aldL.K
uehnJr.
64Male
White
2..
.52
EduardoMenasce
66Male
White
3..
.79
JohnL.C
lendenin
65Male
White
3..
.51
FredericV.S
alerno
67Male
White
4..
.75
EdwardE.W
hitacre
Jr.
58Male
White
3..
.51
Rob
ertL.R
yan
66Male
Black
5..
.70
WillieD.D
avis
66Male
Black
3..
.51
ShirleyA.Jackson
63Fem
ale
Black
6..
.69
ElaineL.C
hao
46Fem
ale
Asian
6..
.50
DennisH.C
hookaszian
66Male
White
6..
.69
CharlesF.K
night
64Male
White
6..
.50
ArthurC.M
artinez
70Male
White
8..
.66
Lou
isW.S
ullivan
66Male
Black
6..
.50
EnriqueHernan
dez
Jr.
54Male
Hispan
ic8..
.66
CharlesW.C
oker
67Male
White
9..
.48
RichardJ.Swift
65Male
White
8..
.66
Sam
Nunn
62Male
White
10..
.47
EdwardJ.Mooney
69Male
White
11..
.65
JohnW.S
now
60Male
White
10..
.47
Thom
asJ.Usher
67Male
White
11..
.65
Stephen
R.H
ardis
64Male
White
10..
.47
James
H.H
ance
Jr.
66Male
White
11..
.65
GeorgeJ.Mitchell
66Male
White
13..
.46
KennethM.D
uberstein
65Male
White
11..
.65
Lyn
nM.M
artin
60Fem
ale
White
13..
.46
Barry
Diller
68Male
White
11..
.65
FrankS.R
oyal
60Male
Black
13..
.46
RichardB.M
yers
68Male
White
11..
.65
Jacquelyn
M.W
ard
62Fem
ale
White
13..
.46
William
H.G
rayIII
69Male
Black
728
This content downloaded from 128.135.212.099 on December 09, 2016 14:25:29 PMAll use subject to University of Chicago Press Terms and Conditions (http://www.journals.uchicago.edu/t-and-c).

TABLE3(Con
tinued)
YEAR2000
YEAR2010
Ran
kDegree
Director
Age
Gender
Ethnicity
Ran
kDegree
Director
Age
Gender
Ethnicity
17..
.64
Han
sW.B
echerer
64Male
White
17..
.45
Steven
S.R
einem
und
61Male
White
17..
.64
AnnM.K
orologos
58Fem
ale
White
17..
.45
Man
uelA.F
ernan
dez
63Male
Hispan
ic19
...
63Ivan
G.S
eidenberg
53Male
White
19..
.44
J.MichaelL
osh
64Male
White
19..
.63
James
F.H
ardym
on65
Male
White
19..
.44
Han
selE
.Tookes
II63
Male
Black
21..
.62
MaryJ.Evan
s70
Fem
ale
White
19..
.44
Lau
raD’A
ndreaTyson
63Fem
ale
White
22..
.61
AlanT.D
ickson
68Male
White
22..
.43
CharlesR.L
ee70
Male
White
23..
.60
Brian
H.R
owe
69Male
White
22..
.43
James
H.B
lanchard
68Male
White
24..
.59
Rob
ertP.L
ucian
o66
Male
White
22..
.43
Rob
ertT.B
rady
70Male
White
24..
.59
JohnR.S
tafford
62Male
White
22..
.43
R.D
avid
Hoover
64Male
White
24..
.59
JohnG.B
reen
66Male
White
22..
.43
Kriss
CloningerIII
62Male
White
24..
.59
Don
aldF.M
cHenry
63Male
Black
22..
.43
CharleneBarshefsky
60Fem
ale
White
24..
.59
Don
aldV.F
ites
66Male
White
22..
.43
JohnC.M
alon
e70
Male
White
24..
.59
Bob
byR.Inman
69Male
White
22..
.43
VirgisW.C
olbert
71Male
Black
24..
.59
Pau
lFulton
65Male
White
24..
.59
LeonardS.C
olem
an50
Male
White
24..
.59
Franklin
A.T
hom
as65
Male
Black
24..
.59
Ray
J.Groves
64Male
White
24..
.59
Rozan
neL.R
idgw
ay65
Fem
ale
White
729
This content downloaded from 128.135.212.099 on December 09, 2016 14:25:29 PMAll use subject to University of Chicago Press Terms and Conditions (http://www.journals.uchicago.edu/t-and-c).
constructed each measure from our data sources. Table 5 shows descriptivestatistics and correlations.7
Models 1–3 in table 6 show the regression results from a random-effectsunbalanced panel logistic regression calculating the effects of each indepen-dent variable on the probability of a director gaining a new board seat in thesubsequent year. To capture monotonous changes in the effect of each inde-pendent variable over the years, we included the interaction terms of eachindependent variable with the number of years since 1997 (the first year inour data). Model 1 shows results from the full model. We find that directorsassociated with larger companies were more likely to gain new board seatsbut no effect for directors on the boards of higher performance companies,when controlling for demographic and network characteristics. Note thecomparisonwithmodels 2 and 3,which show regression results without net-work measure regressors. Directors from more successful companies werenot preferred per se but may have been popular with board selection com-mittees only because they had good network connections.Minority directors and social elite directors were preferentially hired onto
additional boards throughout the period of the study. Minority directorswere 1.47 times more likely than nonminority directors, and social elite di-rectors 1.33 times more likely than nonelite directors, to gain an additionalboard seat in the next year. There was no significant preference for femaledirectors, however. Corporate executives were initially less likely than non-executives to gain additional board seats, but this comparative propensityincreased over time.Well-connected directors—those whose peer directors served on many
other boards—were more likely to gain additional board seats throughoutthe period of the study. But this advantage decreased over time. In 1997,each tenfold increase in the number of distinct boards served by peer direc-tors more than quadrupled the likelihood of the focal director gaining a newboard seat in the next year. By 2010, the effect size was almost halved.8
There was strong evidence of preferential attachment, by which the rich(in board seats) get richer, at the beginning of the study period. This pref-erence for directors on many boards disappeared during the period of the
American Journal of Sociology
730
8 Note that when controlling for peer board reach and other network characteristics, in-creasing the number of peer directors negatively affected the propensity to gain addi-tional board seats. This is in line with social network research finding that the range andcontent of connections trumps sheer number of connections in determining outcomes forthe focal actor (e.g., Burt 1992; Cotton-Nessler 2013).
7 For obvious reasons, director degree centrality was highly correlated with both thenumber of board seats held by the director and the number of distinct boards servedby peer directors. Removing director degree centrality from the analysis did not changethe pattern of results for the remaining variables.
This content downloaded from 128.135.212.099 on December 09, 2016 14:25:29 PMAll use subject to University of Chicago Press Terms and Conditions (http://www.journals.uchicago.edu/t-and-c).

study, however. In 1997, directors who served on two boards were approx-imately twice as likely to gain additional board seats as those who served ononly one board, and the same held true for directors on three ormore boards.By 2010 neither directors on two boards nor those on three or more boardswere preferred compared to those on one board.
To examine the changes in preferential hiring of well-boarded, well-connected, and corporate executive directors in more detail, we repeated theregression above but substituted interactions with year dummies instead ofwith years since 1997 for the measures of number of boards, number of peerboards, and corporate executive status. This allowed us to estimate coeffi-cients for these variables’ effects on hiring for each year in the study period,by taking the coefficient vector from the regression results and adding the co-efficient of the interaction term of the independent variable with the year tothe base year (1997) coefficient for the independent variable. We also calcu-lated variances for each of these coefficients by using the covariance matrixwith the sum formula for variances:
Varða1 1 a2Þ 5 Varða1Þ 1 Varða2Þ 1 2 � Covða1, a2Þ:
Four separate variance-weighted least-squares (VWLS) regressions con-firm the overall shift in the values of these coefficients over the period ofthe study. Directors on multiple boards became comparatively less likely togain additional board seats over time (directors on two boards: t 5 24.40,P< .0005; on three ormoreboards: t525.74,P< .0005), asdiddirectorswithpeers on many distinct boards (t 5 23.05, P 5 .002). Corporate executivesbecame comparativelymore likely to gain new board appointments (t5 2.43,P 5 .015).
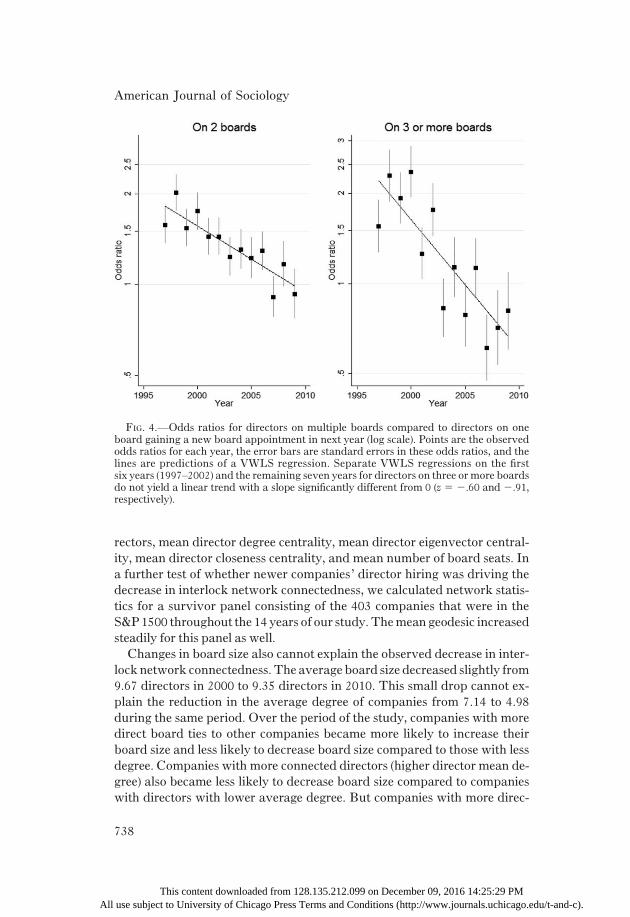
Using the yearly coefficients obtained above, figure 4 plots the odds ratiosof joining a new board in the subsequent year for directors with multipleboard seats compared to those with one board seat for each year from 1997to 2009. The VWLS models predict that a director with two board seats in1997 was 1.82 times more likely than a director with only one board seat tojoin a new board within the next year but no more likely than the single-board director in 2009. The predicted change in log odds for directors onthree or more boards was even more drastic. A director on three or moreboards in 1997 was 2.20 times more likely than a director on one board tojoin a new board within the next year but became only 0.66 times as likelyas a one-board director in 2009. This shift in preference for three or moreboard directors appears to have occurred abruptly between 2002 and 2003(see fig. 4, right graph).
The effects of having peers on many boards are shown in figure 5. In1997, a director with 10 times the one-step board reach of an otherwise sim-ilar director was predicted to have a 4.31 times higher chance of gaining a
731
Who Killed the Inner Circle?
This content downloaded from 128.135.212.099 on December 09, 2016 14:25:29 PMAll use subject to University of Chicago Press Terms and Conditions (http://www.journals.uchicago.edu/t-and-c).
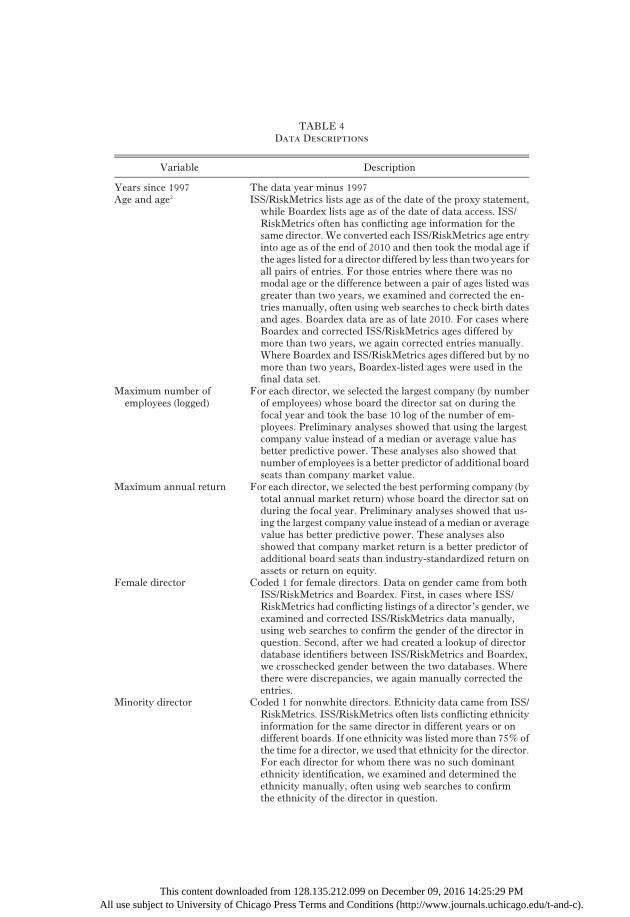
TABLE 4Data Descriptions
Variable Description
Years since 1997 The data year minus 1997Age and age2 ISS/RiskMetrics lists age as of the date of the proxy statement,
while Boardex lists age as of the date of data access. ISS/RiskMetrics often has conflicting age information for thesame director. We converted each ISS/RiskMetrics age entryinto age as of the end of 2010 and then took the modal age ifthe ages listed for a director differed by less than two years forall pairs of entries. For those entries where there was nomodal age or the difference between a pair of ages listed wasgreater than two years, we examined and corrected the en-tries manually, often using web searches to check birth datesand ages. Boardex data are as of late 2010. For cases whereBoardex and corrected ISS/RiskMetrics ages differed bymore than two years, we again corrected entries manually.Where Boardex and ISS/RiskMetrics ages differed but by nomore than two years, Boardex-listed ages were used in thefinal data set.
Maximum number ofemployees (logged)
For each director, we selected the largest company (by numberof employees) whose board the director sat on during thefocal year and took the base 10 log of the number of em-ployees. Preliminary analyses showed that using the largestcompany value instead of a median or average value hasbetter predictive power. These analyses also showed thatnumber of employees is a better predictor of additional boardseats than company market value.
Maximum annual return For each director, we selected the best performing company (bytotal annual market return) whose board the director sat onduring the focal year. Preliminary analyses showed that us-ing the largest company value instead of a median or averagevalue has better predictive power. These analyses alsoshowed that company market return is a better predictor ofadditional board seats than industry-standardized return onassets or return on equity.
Female director Coded 1 for female directors. Data on gender came from bothISS/RiskMetrics and Boardex. First, in cases where ISS/RiskMetrics had conflicting listings of a director’s gender, weexamined and corrected ISS/RiskMetrics data manually,using web searches to confirm the gender of the director inquestion. Second, after we had created a lookup of directordatabase identifiers between ISS/RiskMetrics and Boardex,we crosschecked gender between the two databases. Wherethere were discrepancies, we again manually corrected theentries.
Minority director Coded 1 for nonwhite directors. Ethnicity data came from ISS/RiskMetrics. ISS/RiskMetrics often lists conflicting ethnicityinformation for the same director in different years or ondifferent boards. If one ethnicity was listed more than 75% ofthe time for a director, we used that ethnicity for the director.For each director for whom there was no such dominantethnicity identification, we examined and determined theethnicity manually, often using web searches to confirmthe ethnicity of the director in question.
This content downloaded from 128.135.212.099 on December 09, 2016 14:25:29 PMAll use subject to University of Chicago Press Terms and Conditions (http://www.journals.uchicago.edu/t-and-c).

new board seat in the subsequent year. By 2009, this difference in propen-sities was reduced to 2.40. Having well-placed peers still helped, but muchless so.
The preference shifts described above were not driven by new types ofcompanies joining the S&P 1500, such as Internet companies around theturn of the century. Model 4 in table 6 shows the results of regressions witha dependent variable that was coded 1 only if the director joined the boardof a company in the survivor panel, which consisted of companies present inthe S&P 1500 in all years from 1997 to 2010. A similar pattern of results isobtained.
The decline in comparative propensity to be hired onto additional boardsforwell-boardedandwell-connecteddirectorscompared to their lessboardedand less connected peers is congruent with a shift in companies’ preference
TABLE 4 (Continued)
Variable Description
Social elite director Directors were coded as a member of the social elite if they werewhite and male and had an educational affiliation withHarvard, Yale, Princeton, or Stanford listed in Boardex.Ethnicity, gender, and elite education credentials have beenshown to correspond with social elite membership (e.g.,Useem and Karabel 1986). The correlation between thesedemographic markers and elite membership is far from per-fect but is reasonable for directors during the period understudy.
Corporate executive Directors were identified as corporate executives in a given yearif they were listed in ISS/RiskMetrics as being an employeedirector for a firm. Occasionally, directors may not be on theboard of their employer but sit only on an outside board orboards. These cases are not captured in the data.
Director degreecentrality (logged)
Degree centrality measures for directors were calculated byflattening the bimodal data to create director-director net-works for each year. Two directors are linked if they serve onthe same board.We added 1 to the degree before logging base10.
Director eigenvectorcentrality
Eigenvector centrality measures for directors were calculatedby flattening the bimodal data to create director-directornetworks for each year. Two directors are linked if they serveon the same board.
Number of nonoverlappingboards served on by peerdirectors (logged)
For the measure of peer director reach, we calculated thenumber of nonoverlapping boards each director’s peer di-rectors sat on for each year, excluding any boards the focaldirector also sat on. We added 1 to this value before loggingbase 10.
Number of board seatsheld by director
The number of board seats held by the director in the given year
Joined board next year? Coded 1 if a director joined a new S&P 1500 board in the fol-lowing calendar year
733
Who Killed the Inner Circle?
This content downloaded from 128.135.212.099 on December 09, 2016 14:25:29 PMAll use subject to University of Chicago Press Terms and Conditions (http://www.journals.uchicago.edu/t-and-c).

TABLE5
DescriptiveStatisticsandCorrelationCoefficients
Variable
Mean
SD
12
34
56
78
910
1112
13
1.Years
since
1997
....
....
....
....
....
....
6.10
3.75
2.Age
....
....
....
....
....
....
....
....
...
59.82
8.62
.09
3.Age
2/100
....
....
....
....
....
....
....
...
36.53
10.31
.09
1.00
4.Maxim
um
number
ofem
ployees
(logged)..
...
3.97
.69
2.01
.03
.02
5.Maxim
um
annual
return
....
....
....
....
...13
.56
.01
.01
.00
.05
6.Fem
aledirector?
(15
yes)..
....
....
....
...
.11
.31
.05
2.18
2.18
.07
.00
7.Minoritydirector?
(15
yes)
....
....
....
...
.08
.27
.05
2.11
2.11
.09
.01
.08
8.Socialelitedirector?
(15
yes)
....
....
....
...13
.34
.02
.04
.04
.04
.02
2.17
2.14
9.Corporateexecutive?
(15
yes)
....
....
....
..23
.42
2.08
2.26
2.26
.02
.01
2.16
2.10
.01
10.D
irectordegreecentrality(lo
gged)
....
....
.1.08
.20
2.07
.08
.06
.49
.14
.05
.08
.05
.03
11.D
irectoreigenvectorcentrality�
100..
....
..23
1.05
2.07
.01
.01
.19
.03
.01
.03
.01
.02
.33
12.N
umber
ofboardswithpeerdirectors
(logged)
.80
.35
2.11
.03
.02
.60
.10
.06
.09
.08
.04
.72
.28
13.N
umber
ofboard
seatsheldbydirector*
....
1.29
.58
2.03
.05
.04
.38
.18
.03
.06
.07
.07
.84
.21
.62
14.Joined
new
board
nextyear?(1
5yes)
....
...06
.24
2.05
2.07
2.07
.08
.02
.02
.03
.02
.03
.09
.04
.12
.09
*Number
ofboard
seatscoded
3forthreeor
moreboards.
This content downloaded from 128.135.212.099 on December 09, 2016 14:25:29 PMAll use subject to University of Chicago Press Terms and Conditions (http://www.journals.uchicago.edu/t-and-c).

for certain types of directors. But another explanation for these results is thatdirector preferences changed while company hiring preferences remainedconstant. Instead of companies eschewingmultiple board directors andplac-ing less weight on personal introductions, well-boarded directors may havebecome loath to take on more board appointments and well-connected di-rectors less likely to rely on personal contacts to find new board seats.
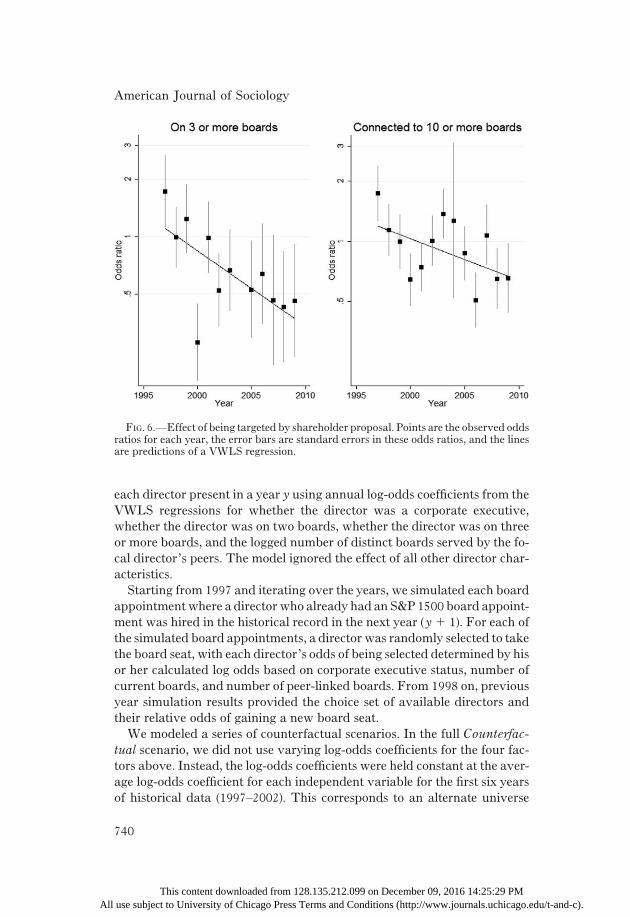
An examination of the effects of shareholder proposals on board hiringpropensities provides support for a shift in boards’ hiring preferences ratherthan a shift in directors’ preferences. Figure 6 shows results from two sep-arate logistic regressions with fixed company effects, where the dependentvariables are the propensity to hire certain types of directors. The left panelgraphs the effect of being targeted by a shareholder proposal on a compa-ny’s propensity to hire directors on three or more boards. The right paneldisplays the same effect for the propensity to hire directors who are wellconnected (linked to 10 ormore boards they do not already serve on throughboard peers). Boards targeted by shareholder proposals in 1997 tended torespond by hiring well-boarded and well-connected directors. By 2009, be-ing targeted by shareholder proposals had the opposite effect. Targetedboards eschewed well-boarded, well-connected directors.
An examination of how often board seats were filled by directors with noprevious S&P 1500 board experience also provides support for changed cor-porate preferences, suggesting that corporations came to place less empha-sis on directors’ connections to other boards. Figure 7 plots the observedprobability that a board appointment was filled by a director with no ex-isting board appointments from 1998 to 2010. A linear regression predictsa 5 percentage point increase between 1998 and 2010 in the percentage ofboard appointments filled by directors not already serving on anotherboard.
WHO KILLED THE INNER CIRCLE?
Did the decreased preferences for well-connected directors lead to the col-lapse of cohesion in the interlock network? We adopt a two-pronged ap-proach to answering this question. First, we consider possible alternativecauses of the decline in interlock network connectedness and check to seewhether these possible causes are observed. Second, we use Monte Carlosimulations to test whether the observed changes in preference for well-boarded and well-connected directors were sufficient to explain the magni-tude of change in the interlock network’s macrostructure.
The regression results in table 6 show that preferences for directors onlarge company or high-performing company boards; for female, minority,and social elite directors; and for network degree- or eigenvector-central
735
Who Killed the Inner Circle?
This content downloaded from 128.135.212.099 on December 09, 2016 14:25:29 PMAll use subject to University of Chicago Press Terms and Conditions (http://www.journals.uchicago.edu/t-and-c).

TABLE 6Logistic Regression Coefficients for Log Odds of Director Gaining a
New Board Appointment in Next Year
JOIN BOARD NEXT YEAR
JOIN SURVIVOR
PANEL BOARD
Model 1 Model 2 Model 3 Model 4
Years since 1997 . . . . . . . . . . . . . . . . . 2.19 .19 .17 21.14**(2.92) (1.01) (.83) (22.94)
Age/10 . . . . . . . . . . . . . . . . . . . . . . . . . 3.41*** 4.28*** 4.05*** 4.66***(7.37) (9.95) (8.79) (5.49)
Age2/1,000 . . . . . . . . . . . . . . . . . . . . . . 23.28*** 23.96*** 23.76*** 24.62***(28.15) (210.62) (29.39) (26.14)
Maximum number of employees(logged) . . . . . . . . . . . . . . . . . . . . . .11* .68*** .59*** 2.03
(2.01) (16.73) (13.54) (2.31)Maximum annual return . . . . . . . . . . . .07 .19*** .17*** .04
(1.30) (3.97) (3.35) (.39)Female director . . . . . . . . . . . . . . . . . . 2.02 .08 .14
(2.26) (.81) (1.05)Minority director . . . . . . . . . . . . . . . . . .38*** .50*** .65***
(3.86) (5.05) (4.90)Social elite director . . . . . . . . . . . . . . . .28*** .41*** .13
(4.01) (5.84) (1.16)Corporate executive . . . . . . . . . . . . . . . 2.18** 2.07 .16
(22.75) (21.11) (1.63)Director degree centrality (logged) . . . 21.47*** 21.18*
(25.09) (22.54)Director eigenvector centrality . . . . . . .28 23.87
(.12) (2.93)Number of boards served by peer
directors (logged) . . . . . . . . . . . . . 1.47*** 2.22***(11.67) (10.59)
Number of board seats held bydirector (n 5 2) . . . . . . . . . . . . . . . .59*** .37*
(6.16) (2.46)Number of board seats held by
director (n 5 3 or more) . . . . . . . . .77*** .47*(5.15) (2.02)
Years since 1997 �:Age/10 . . . . . . . . . . . . . . . . . . . . . . . .05 2.04 2.02 .35**
(.77) (2.60) (2.22) (2.58)Age2/1,000 . . . . . . . . . . . . . . . . . . . . 2.05 .03 .00 2.29*
(2.75) (.48) (.07) (22.45)Maximum number of employees(logged) . . . . . . . . . . . . . . . . . . . . . .01 2.03*** 2.04*** .04**
(.82) (25.29) (25.90) (2.92)Maximum annual return . . . . . . . . . 2.00 2.01* 2.01* 2.00
(2.28) (22.25) (22.11) (2.34)Female director . . . . . . . . . . . . . . . . .01 .00 2.01
(.94) (.07) (2.44)Minority director . . . . . . . . . . . . . . . 2.02 2.03* 2.03
(21.63) (22.54) (21.87)Social elite director . . . . . . . . . . . . . 2.01 2.02* 2.01
(21.24) (22.23) (2.55)
This content downloaded from 128.135.212.099 on December 09, 2016 14:25:29 PMAll use subject to University of Chicago Press Terms and Conditions (http://www.journals.uchicago.edu/t-and-c).

directors did not significantly change during the period of the study. A sim-ilar regression for directors’ propensity to leave an existing board appoint-ment in the next year showed that directors on two or more boards and di-rectors with high eigenvector centrality became less likely to leave a boardover the period of the study.
We also checked for the occurrence of several other shifts that could po-tentially explain the decrease in interlock network connectedness. Com-pany entries and exits into the S&P 1500 did not becomemore frequent overtime. More central companies and companies with more well-boarded di-rectors did not become more likely to leave the S&P 1500 during the periodunder study; we found no significant changes in propensity to leave theS&P 1500 on the basis of company degree centrality, eigenvector centrality,closeness centrality, betweenness centrality, number of directors, mean de-gree of directors, mean eigenvector centrality of directors, mean closenesscentrality of directors, or mean number of board seats held by directors oron the basis of the percentile rank (by year) of each of these variables. Thecharacteristics of new entrants to the S&P 1500 did not change significantly.Examining companies in their first year of listing on the S&P 1500, we foundno temporal trend in their percentile rankings on degree centrality, eigen-vector centrality, closeness centrality, betweenness centrality, number of di-
737
TABLE 6 (Continued)
JOIN BOARD NEXT YEAR
JOIN SURVIVOR
PANEL BOARD
Model 1 Model 2 Model 3 Model 4
Corporate executive . . . . . . . . . . . . . .02* .01 .03(2.16) (1.03) (1.83)
Director degree centrality(logged) . . . . . . . . . . . . . . . . . . . .01 .04
(.25) (.58)Director eigenvector centrality . . . . 2.38 2.53
(2.86) (2.65)Number of boards served by
peer directors (logged) . . . . . . . 2.05* 2.08*(22.54) (22.36)
Number of board seats heldby director (n 5 2) . . . . . . . . . . 2.05** 2.04
(23.23) (21.80)Number of board seats held
by director (n 5 3 or more) . . . 2.10*** 2.11**(24.02) (22.83)
NOTE.—Year coefficients not shown. All tests two-tailed.* P < .05.** P < .01.*** P < .001.
Who Killed the Inner Circle?
This content downloaded from 128.135.212.099 on December 09, 2016 14:25:29 PMAll use subject to University of Chicago Press Terms and Conditions (http://www.journals.uchicago.edu/t-and-c).
rectors, mean director degree centrality, mean director eigenvector central-ity, mean director closeness centrality, and mean number of board seats. Ina further test of whether newer companies’ director hiring was driving thedecrease in interlock network connectedness, we calculated network statis-tics for a survivor panel consisting of the 403 companies that were in theS&P1500 throughout the 14 years of our study.Themean geodesic increasedsteadily for this panel as well.Changes in board size also cannot explain the observed decrease in inter-
lock network connectedness. The average board size decreased slightly from9.67 directors in 2000 to 9.35 directors in 2010. This small drop cannot ex-plain the reduction in the average degree of companies from 7.14 to 4.98during the same period. Over the period of the study, companies with moredirect board ties to other companies became more likely to increase theirboard size and less likely to decrease board size compared to those with lessdegree. Companies with more connected directors (higher director mean de-gree) also became less likely to decrease board size compared to companieswith directors with lower average degree. But companies with more direc-
738
FIG. 4.—Odds ratios for directors on multiple boards compared to directors on oneboard gaining a new board appointment in next year (log scale). Points are the observedodds ratios for each year, the error bars are standard errors in these odds ratios, and thelines are predictions of a VWLS regression. Separate VWLS regressions on the firstsix years (1997–2002) and the remaining seven years for directors on three ormore boardsdo not yield a linear trend with a slope significantly different from 0 (z 5 2.60 and 2.91,respectively).
American Journal of Sociology
This content downloaded from 128.135.212.099 on December 09, 2016 14:25:29 PMAll use subject to University of Chicago Press Terms and Conditions (http://www.journals.uchicago.edu/t-and-c).

tors becamemore likely to decrease the size of their boards compared to com-panies with fewer directors.
After ruling out alternatives, we are left with four confirmed shifts in di-rector hiring patterns: increased preferences for corporate executives andfor individuals with no current board appointments and decreased pref-erences for individuals with many current board appointments and withpeers onmany other boards.While the effects of the preference shift in favorof corporate executives on the connectedness of the interlock network areuncertain, the latter three shifts in preference all militate for decreased inter-locknetworkconnectedness.Thepresenceofmoredirectorswithonlyasingleboard appointment leads to a decrease in the number of links between com-panies. The nonappearance of superconnectors—directors on many boardswho connect directors onmany other boards—leads to a networkwith higheraverage number of steps between companies.
To test whether these observed shifts in hiring patterns were sufficient toexplain the macrostructural changes in the interlock network, we coded asimulation. The simulation allowed us to model counterfactual scenariosin which the four shifts in preference were not present. In the baseline Re-ality scenario, we calculated relative odds of gaining a new board seat for
739
FIG. 5.—Effect of being well connected on odds ratios of gaining a new board appoint-ment in the next year. Effect of tenfold increase in number of linked boards. Points are theobserved odds ratios for each year, the error bars are standard errors in these odds ratios,and the lines are predictions of a VWLS regression.
Who Killed the Inner Circle?
This content downloaded from 128.135.212.099 on December 09, 2016 14:25:29 PMAll use subject to University of Chicago Press Terms and Conditions (http://www.journals.uchicago.edu/t-and-c).
each director present in a year y using annual log-odds coefficients from theVWLS regressions for whether the director was a corporate executive,whether the director was on two boards, whether the director was on threeor more boards, and the logged number of distinct boards served by the fo-cal director’s peers. The model ignored the effect of all other director char-acteristics.Starting from 1997 and iterating over the years, we simulated each board
appointmentwhere a directorwho already had an S&P 1500 board appoint-ment was hired in the historical record in the next year (y1 1). For each ofthe simulated board appointments, a director was randomly selected to takethe board seat, with each director’s odds of being selected determined by hisor her calculated log odds based on corporate executive status, number ofcurrent boards, and number of peer-linked boards. From 1998 on, previousyear simulation results provided the choice set of available directors andtheir relative odds of gaining a new board seat.We modeled a series of counterfactual scenarios. In the full Counterfac-
tual scenario, we did not use varying log-odds coefficients for the four fac-tors above. Instead, the log-odds coefficients were held constant at the aver-age log-odds coefficient for each independent variable for the first six yearsof historical data (1997–2002). This corresponds to an alternate universe
740
FIG. 6.—Effect of being targeted by shareholder proposal. Points are the observed oddsratios for each year, the error bars are standard errors in these odds ratios, and the linesare predictions of a VWLS regression.
American Journal of Sociology
This content downloaded from 128.135.212.099 on December 09, 2016 14:25:29 PMAll use subject to University of Chicago Press Terms and Conditions (http://www.journals.uchicago.edu/t-and-c).

where the shifts in preference for corporate executives, directors on two- orthree-plus boards, and directors with higher board reach did not occur. Thefull Counterfactual scenario also eliminated the observed increase in pro-pensity to hire directors with no existing board appointments. The rate ofzero-board director hiring was held constant by randomly selecting zero-board director hires in the historical data and simulating the hiring of an ex-isting director into the position.
The effect of eachpreference shiftwas also tested separately. Four partial-counterfactual scenarios each held log-odds coefficients for one indepen-dent variable constant, while using time-varying log-odds coefficients forthe other independent variables. Another partial-counterfactual scenarioheld the log-odds coefficients for both whether a director was on two boardsandwhether a director was on three ormore boards constant, correspondingto a counterfactual where there was no shift in preference for well-boardeddirectors. A final partial-counterfactual scenario modeled only the effect ofmaintaining a constant rate of zero-board director hiring.
Figure 8 displays simulation results for the 2010 mean geodesic for theS&P 1500. The distribution of mean geodesics over 100 runs of the Realityscenario is centered close to the 2010 mean geodesic observed in the histor-ical data of 4.96. The distribution for the full Counterfactual scenario is cen-tered close to the observed 1996 mean geodesic of 4.16. An examination ofthe partial-counterfactual scenario results shows that the change in propen-sity for corporate executives to gain new board seats was inconsequential inits effect, but the other propensity changes all mattered.
741
FIG. 7.—Percentage of board appointments filled by director with no existing boardappointments. Points are observed values for each year. Line is a linear least-squares re-gression.
Who Killed the Inner Circle?
This content downloaded from 128.135.212.099 on December 09, 2016 14:25:29 PMAll use subject to University of Chicago Press Terms and Conditions (http://www.journals.uchicago.edu/t-and-c).

These results indicate that the observed shifts in preferences for zero-board, well-boarded, andwell-connected directors were sufficient to explainthe magnitude of the change in the interlock network’s mean step distancebetween companies. Conversely, if these preference shifts had not occurred,we would expect the interlock network mean geodesic in 2010 to be littlechanged from its value in 1996.While figure 8 shows an uncanny quantitative agreement with the histor-
ical data, this was not expected. The model omits many factors that couldaffect the shape of the interlock network, such as assortative matching (e.g.,
FIG. 8.—Kernel densities of simulated 2010 mean geodesics. Eight scenarios of 100runs each. Dashed lines indicate observed historical mean geodesic in S&P 1500 for1996 and 2010. Solid curves show distributions for Counterfactual and Reality simula-tion scenarios. Dashed curves show distributions for scenarios in which one or more in-dependent variables’ effect has been held steady (as in the Counterfactual scenario), whilethe remaining independent variables’ effects have been allowed to change (as in the Re-ality scenario). The held-constant variables for each dashed scenario are ① director is acorporate executive, ② director is on two boards, ③ number of nonoverlapping boardswhere peer directors served,④ proportion of board seats taken by new versus existing di-rectors,⑤ director is on three or more boards,⑥ director is on two boards, and director ison three or more boards.
742
American Journal of Sociology
This content downloaded from 128.135.212.099 on December 09, 2016 14:25:29 PMAll use subject to University of Chicago Press Terms and Conditions (http://www.journals.uchicago.edu/t-and-c).

larger companiesmaybemore likely tohiredirectors onmoreboards) and theaforementioned effects of being targeted by shareholder proposals. We ex-pect that these omissions should cause the simulation to overestimate thege-odesic lengthening in the center of the network (e.g., the S&P500) andunder-estimate it outside the center of the network. Nevertheless, the change inoverallmeangeodesic canbe explainedbyour simple simulationmodelwith-out needing to resort to a more complicated model.
Figure 9 shows distributions of the number of board appointments for di-rectors for representative Reality and Counterfactual scenario runs (respec-tively one of the two Reality or Counterfactual scenario runs wherein therun’s mean geodesic was closest to the median mean geodesic for all runsin the respective scenario). These distributions are quite similar to the his-torical distributions in figure 3. The identified shifts in preference for certaintypes of directors seem sufficient to explain the decrease in directors withmany board appointments. Simulated degree distributions are also similarto historical distributions, albeit with a shorter right-hand tail for the Real-ity simulated data compared to the historical data perhaps due to ignoringassortative matching in our models.
REVISITING PRIOR SCHOLARSHIP ON THE EFFECTSOF BOARD TIES
To illustrate the impact of the interlock network changes described above,we revisit three classic studies of the effects of interlock ties and examinewhether and how their findings still apply in the less connected interlock
FIG. 9.—Distribution of number of directors with n boards from simulations, 2000(black bars) and 2010 (white bars).
743
Who Killed the Inner Circle?
This content downloaded from 128.135.212.099 on December 09, 2016 14:25:29 PMAll use subject to University of Chicago Press Terms and Conditions (http://www.journals.uchicago.edu/t-and-c).

network. Among other functions (Mizruchi 1996), shared board member-ships have been identified as a central mechanism for socializing new elites(Useem 1984), fostering political unity (Mizruchi 1992), and diffusing corpo-rate practices (Davis 1991). We find that the interlock network is no longerconnected enough to act as an effective mechanism for these processes.In his groundbreaking study of American and British boards of the late
1970s and early 1980s, Useem (1984) described the interlock network as abroadly connected, elite socialization device. An individual newly appointedto his (and it was almost always his, not her) first board seat could catch theeye of an established member of the inner circle, someone who alreadyserved onmany corporate boards andwas connected to others who did also.If thenewboardappointeepassedmusterandprovedamenabletomentoring,this mentor would sponsor him for membership in more corporate boards,suggest government and civic affiliations, and nudge him toward the appro-priate political views for a member of the inner circle.This narrative is predicated on the existence of a group of mutually con-
nected, frequently interacting individuals, each on many boards and collec-tively connected to the majority of the interlock network. Our data showthat no such group existed by 2010. In 1997, 363 of the 432 S&P 500 com-panies with any interlocks were linked by a single network of directors withthree or more board seats serving on boards with each other. Themean geo-desic between companies on this network of well-boarded directors was3.24; on average, any company’s board could reach any other companyboard through a director’s friend or friend of a friend. By 2010, only 244of 440 companies were connected in the main component of directors withthree or more board seats linked to similarly well-boarded directors, andthere were four smaller components of three to six companies each con-nected in this way. The mean geodesic in the (much smaller compared tothat in 1997) main component lengthened to 4.85.9
The disappearance of a cohesive inner circle is even more apparent whenconsidering the network between companies created by shared directorseach on fourormore boards.A258-companycomponent existed in 1997witha single smaller component of four companies. There was no longer a pre-dominant component by 2010. The largest component comprised 17 compa-nies, alongside 10 more components with between four and 10 companiesapiece. The broader S&P 1500 network underwent similar decohesion.Therewere four components, each linkedbydirectors on four ormore boards
9 To put this number—a mean geodesic of 4.85 between 244 companies—in perspective,the average Twitter follower network geodesic in 2010 was estimated to be between 3.43and 4.12 for a network size of approximately 200million users (Bakhshandeh et al. 2011).The acquaintance network in the U.S. population of 200 million in the late 1960s was es-timated to have a geodesic between 3 and 5.2 (Milgram 1967).
744
American Journal of Sociology
This content downloaded from 128.135.212.099 on December 09, 2016 14:25:29 PMAll use subject to University of Chicago Press Terms and Conditions (http://www.journals.uchicago.edu/t-and-c).

in 1997, with the main component creating a connected core of 510 compa-nies, but in 2010, there were 28 components, with the largest consisting of62 companies and most with only four companies each.
Against this changed backdrop, a director joining his first corporateboard became unlikely to meet another director who could introduce himto many other boards. Even if the newly minted director was lucky enoughto serve on a board with such a well-boarded, well-connected director, thesenior director’s board connections would span only a small part of the cor-porate milieu. The new director could not climb into the corporate interlocknetwork inner circle through introductions from his well-connected boardpeers. Indeed, there was no inner circle left to join.
Mizruchi’s (1992) classic study of large firms’ political action providedevidence for the unifying effects of interlock ties, finding that director inter-locks increase political cohesion. Commercial banks figure prominently inhis analysis; in 1980, the focal year ofMizruchi’s analysis, commercial bankboards formed thehubs of the interlocknetwork.By1997, commercial bankswere no longer at the center of the network, however, so examining how hisfindings would be changed by the decohesion of the interlock network from1997 onward is not instructive.
A better study to revisit for our current purposes is Burris’s (2005) studyof the effect of shared board memberships on political contributions by topexecutives.Usingdata from1980 (the sameyear studiedbyMizruchi [1992]),Burris found that serving on the same board caused executives to adoptsimilar patterns of political donation. The average dissimilarity in giving—the difference in percentage of total political contributions allocated to theRepublican Party between a pair of executives—was 24% for pairs of exec-utives who served on the same board, compared to 34% for pairs of execu-tives in general.10 Sharing a board affiliation was consequential in increas-ing political consensus. The effects of serving on the same board were muchstronger than the effects of being employed by companies in the same in-dustry or state.
We modeled the consensus-generating effect of interlock ties using ourS&P 500 data for 1997 and 2010, restricting the data to include only corpo-rate executives and the ties between them. Our data cover 1,134 executivesin 1997 and 768 in 2010, with 69.8%of executives in 1997 and 58.1% in 2010with at least one interlock tie to another executive. (Burris’s [2005] sampleconsisted of 761 executives, with 62% having at least one interlock tie.) In-terlock ties between executives with the same employer were excluded fromthe analysis.
10 Even a 24% average dissimilarity is indicative of a bimodal distribution of politicalgiving, albeit significantly less polarized than a donation distribution with 34% averagedissimilarity.
745
Who Killed the Inner Circle?
This content downloaded from 128.135.212.099 on December 09, 2016 14:25:29 PMAll use subject to University of Chicago Press Terms and Conditions (http://www.journals.uchicago.edu/t-and-c).

Each director’s percentage of total political contributions allocated to theRepublican Party was calculated in a two-step process. Each executive’s la-tent baseline—unaffected by ties to other executives—percentage of politi-cal giving allocated to the Republican Party was drawn randomly from astrongly bimodal probability distribution. The distribution was created bysumming two normal distributions, one with mean 0.41667 and standarddeviation 0.08333 and the other with mean 20.41667 and the same stan-dard deviation. The summed distribution was truncated at ±0.5 (20.5 cor-responded to making 100% of political donations to the Democratic Party;10.5, to making 100% of donations to the Republican Party) and normal-ized so that the area under the probability distribution curve summed toone. Next, each director’s percentage of contributions going to the Repub-lican Party was adjusted to be closer to his or her board peers’ donations.Each director’s giving was shifted toward his or her peers’ mean; a direc-tor’s Republican contribution percentage was calculated as the weightedaverage of the focal director’s baseline Republican percentage and that ofhis or her peers,with the focal director’s baseline percentageweighted 10 timeshigher than his or her peers’.11
We find a weakened political unifying and moderating effect for the in-terlock network. Using the 1997 network, the simulation predicts that a pairof executives who serve on the same board will have on average a 24% dif-ference in political contribution percentage to the Republican Party, com-pared to a 37% difference between two executives randomly selected with-out regard to interlock ties. Even though the effects of each individual boardtie are held constant across the 1997 and 2010 network scenarios, the de-crease in overall network density leads to increased differences in the po-litical contribution percentage allocated to Republicans for board peers—an average 30% difference between linked directors in 2010. The similarityboost from serving on the same board is halved, purely because of the de-crease in the connectedness of the overall interlock network.Aweakened unifying effect leads tomore polarized political action. Com-
paring the simulateddistributions of executives’percentage of contributionsto the Republican Party for the 1997 and 2010 interlock networks (fig. 10)shows a shift away from giving similar amounts to both political parties to-ward allocating almost all of one’s contributions to one party. While bothdistributions are bimodal, the 2010 distribution has many more extremelypolarizeddonorsonbothsidesof thepolitical spectrum,whilemorebalanced,centrist contributors have all but disappeared.
11 The shape of the baseline bimodal distribution and the tenfold weight for a focal direc-tor’s baseline percentage versus his or her peers were chosen through trial and error togive distributions similar to Burris’s for 1997. This allows us to relate our simulation re-sults to his empirical findings. Using different shapes for the bimodal distribution andvalues for the peer influence weight yielded similar results.
746
American Journal of Sociology
This content downloaded from 128.135.212.099 on December 09, 2016 14:25:29 PMAll use subject to University of Chicago Press Terms and Conditions (http://www.journals.uchicago.edu/t-and-c).

Studying the spread of poison pill antitakeover defenses in the Fortune500, Davis (1991) found that innovations diffused across the board interlocknetwork. The number of interlock ties to prior adopters was the best predic-tor of whether a company opted to adopt poison pill provisions. Being con-nected by shared board members to companies that had already adoptedpoison pills increased the probability that a company would also adopt thetakeover defense. The more prior adopters (up to an optimal, for adoption,value of six) a companywas connected to on the interlock network, the higherthe probability the company also chose to adopt a poison pill provision.Whilea tie to one prior adopter increased the rate of adoption by about 60% com-pared to when a company had no ties to prior adopters, possessing ties tothree prior adopters more than doubled the adoption rate. A firmwith ties tosix prior adopters had the highest rate of poison pill adoption, about 2.5 timesthe rate for a companywith no ties to prior adopters.
We simulated poison pill adoption using the interlock networks for 593large companies in 1982 and this study’s 2010 S&P 500 companies.12 Thesimulation was run 1,000 times for each condition (1982 and 2010 interlocknetworks), with the interlock network held constant throughout each sim-
12 The 1982 data set is the one used in Davis et al. (2003). Using the current study’s 1997S&P 500 interlock network instead of the 1982 data yields similar results. We present re-sults using the 1982 data since the interlock structure then is more likely to be similar tothe structure during 1984–89, the period of Davis’s (1991) study.
FIG. 10.—Simulated distribution of number of executives by proportion of political con-tributions allocated to the Republican Party.
747
Who Killed the Inner Circle?
This content downloaded from 128.135.212.099 on December 09, 2016 14:25:29 PMAll use subject to University of Chicago Press Terms and Conditions (http://www.journals.uchicago.edu/t-and-c).

ulation. Each simulation run consisted of 20 sequential quarters. In eachquarter, a company’s propensity to adopt a poison pill was set proportionalto
e0:2094�ln interlocks11ð Þ10:643�ln ties to adopters11ð Þ20:1689�ln ties211ð Þ;
where interlocks is the number of directly interlocked boards of the focalcompany, ties to adopters is the number of directly interlocked boards thathave adopted a poison pill in a prior quarter, and ties2 is the square of thisnumber. The coefficients were taken from model 6 in table 2 of Davis’s(1991) study. We multiplied this propensity by a normalizing factor to de-rive the probability that a given company would adopt a poison pill in thequarter. The normalizing factor was calibrated to reproduce the observedadoption pattern by quarter (Davis 1991, fig. 3) for the 1982 network.Calibrating the normalization factor in this way constrains the shape of
the simulated adoption curves. The curves for both the 1982 network and the2010 network are similar to Davis’s observed adoption curve (1991, fig. 1).The 2010 adoption curve is less steep relative to the 1982 curve, and, on av-erage, only 50% of the companies adopt poison pills by the end of the sim-ulation, compared to 62% in the 1982 simulation runs.A much more striking difference is observed in the mechanisms of poison
pill adoption. Examining the ratio of adopterswith links to three ormore prioradopters versus thosewith links to two or fewer prior adopters (fig. 11) shows
FIG. 11.—Number of new adopters with ties to three or more prior adopters comparedto number of new adopters without ties to three or more prior adopters.
748
American Journal of Sociology
This content downloaded from 128.135.212.099 on December 09, 2016 14:25:29 PMAll use subject to University of Chicago Press Terms and Conditions (http://www.journals.uchicago.edu/t-and-c).

that most of the poison pill adoptions on the 1982 network after quarter 7could conceivably be attributed to diffusion through board links to multipleprior adopters. This mechanism cannot account for the majority of adop-tions in the 2010 network at any time during the simulation period, however,as the less connected network structure provided fewer links to prior adopt-ers. In the middle of the simulation period, at quarter 10 where the adoptioncurve was steepest, 2/3 of companies adopting poison pills in the 1982 net-work were connected to three or more prior adopters. Contagion from expo-sure to multiple prior adopters could be a significant driver of adoption ashalf of at-risk companies (those that had not yet adopted poison pill provi-sions) were linked to three or more prior adopters. In contrast, only 1/5 ofat-risk companies were linked to three or more prior adopters in quarter 10of simulations using the 2010 network, and only 1/4 of poison pill adoptionsoccurred in companies connected to three or more prior adopters.
By 2010, it was impossible for an innovation to spread rapidly via inter-lock links to multiple prior adopters. The typical company shared too fewdirectors with prior adopters to allow for multiple exposures to a new inno-vation, until the innovation was already widespread. Different, most prob-ably non-interlock-based, mechanisms now underlie the spread of newman-agement practices. If suchmechanisms are less effective than interlock ties inthe 1980s, then there will be less isomorphism in corporate policies today.
THE UNITED STATES WITHOUT A COHESIVE CORPORATE ELITE
Our findings show that the U.S. board interlock network has changed infundamentalways.Much thatwas trueof the interlocknetwork for100yearsbecameuntruewithin10 subsequent years.TheU.S. corporate interlocknet-work suffered a striking decline in connectedness. This decline was drivenby a radical shift in the characteristics of directors invited onto additionalboards. The preference for directors on many boards disappeared. Direc-tors serving on three or more boards may now be less likely than those serv-ing on one board to gain a newboard seat. The value of beingwell connectedthrough peers serving on other boards also declined.
It is important to point out that the interlock network had faced momen-tous challenges before. Brandeis’s exposé in 1914 led many bankers to re-sign their directorships en masse later that year. Wars, market crashes, theDepression, and multiple merger waves shuffled the players but did littleto alter the existence of an inner circle. The interlock network remaineddensely connected and consistent in its properties throughout these changes.Seven firms thatwere among the 10most central in 1962were also in the top10 in 1982—six of them banks. In the subsequent two decades, however,banks shrunk their boards and stopped recruiting well-connected directors,and the banking industry consolidated (Davis and Mizruchi 1999); hun-
749
Who Killed the Inner Circle?
This content downloaded from 128.135.212.099 on December 09, 2016 14:25:29 PMAll use subject to University of Chicago Press Terms and Conditions (http://www.journals.uchicago.edu/t-and-c).

dreds of large corporations were taken over and their boards disbanded;and demands from corporate constituents for greater diversity led to a de-mographic shift in directors, mostly benefiting a small handful of directors(such as Vernon Jordan). Yet the average geodesic stayed nearly constant,and the inner circle endured (Davis et al. 2003). It appeared that the innercircle and the network’s cohesion were durably resilient, perhaps even inevi-table“emergentpropertiesofnetworksquanetworks” (Davisetal.2003,p.322).The crucial difference between the changes described in this article and
previous interlock network transformations was the breakdown of the pref-erence forwell-connecteddirectors.Whereasdirectorswerepreviously soughtafter because of their legitimating connections, the financial scandals of theearly 2000s and the attendant public outcry reversed this social construction(cf. Zhu andWestphal 2011) and turned “corporate diplomats” (Useem1984)into “busy” (e.g., Ferris, Jagannathan, and Pritchard 2003; Fich and Shiv-dasani 2006) or “overworked” directors. Companies became leery of hiringmultiboard directors lest they be chastised by analysts and investors. Thisrapid social deconstruction of prestige occurred when multiple-board mem-bership had become decoupled from social elite membership and corporatepower. In the 1970s, over 90 directors, almost all corporate executives andall but one white, served on five or more boards each. By the late 1990s, di-rectors with the most board appointments were often African-Americanswith primary appointments outside the corporate sphere. The increasingnumber of minority directors in U.S. boardrooms was and is a testament tothe progress toward racial equality made in the United States over the latterhalf of the 20th century. This silver lining has a cloud, however.When scan-dals, such as the PennCentral bankruptcy, erupted in the 1970s, the status ofwell-boarded directors was not threatened. After the corporate scandals ofthe early 2000s, however, directors serving on many boards were vilified.Studies of U.S. board interlocks have proliferated over the past 30 years.
For the board researcher of today, our results are both exciting and damn-ing. On one hand, everything old is new again. The foundational laws of thenetwork have changed. Directors sitting on multiple boards are no longersought out. The interlock network is no longer a reliable map of elite power.Social distances are no longer reliably shortened by board ties. The findingsof classic studies—on elite socialization and class consciousness, on polit-ical unity and pragmatism, and on corporate learning and isomorphism—no longer hold. Previously discovered “facts” need reconfirmation. On theother hand, the network is now less interesting in some senses. The interlocknetwork no longer tells us much about who holds power in U.S. society. Nordoes it provide a substrate for rapid isomorphism. Future studies will haveto establish new reasons for studying the changed interlock network.More broadly, the findings presented here call into question whether a
broad-based, cohesive social elite still exists in the United States. Mizruchi
750
American Journal of Sociology
This content downloaded from 128.135.212.099 on December 09, 2016 14:25:29 PMAll use subject to University of Chicago Press Terms and Conditions (http://www.journals.uchicago.edu/t-and-c).
(2013)makes thisargument,asserting thatamoderate,highlyconnected,andinfluential core of business leaders—the corporate elite—continually existedfrom the early 20th century but disappeared in the 1990s. In his view, anactive state, powerful labor, and a financial community whose intereststranscended those of particular firms or sectors forced the corporate eliteto unite and defend the corporate system. In the 1980s, the moderating in-fluences of the state, labor, and commercial banks were weakened, and in-stead “shareholder value” became the dominant logic (Zajac and Westphal2004). Institutional investors (Useem 1996), financial analysts (Dobbin andZorn 2005), and the capital market itself (Davis 2009) came to exert controlon CEOs and directors. On one hand, the corporate elite had won the war,and the U.S. corporate system had become a taken-for-granted institution.Attempts by labor or government to place restrictions on corporations werenow deemed ill advised, even unpatriotic. On the other hand, the new share-holder value master proved a tyrant. Public company CEOs lost job secu-rity and found themselves scrambling to survive individually by capturingmore market value for their individual firms. The corporate elite no longerhad the motivation or the ability to band together to defend their interestsas a class. With the corporate elite fragmented, U.S. society lost a powerfulconsensus-building, politically moderate interest group.
Another possibility is that the social elite still coheres but has found new,more hospitable enclaves, protected from nonelite entry and hidden frompublic scrutiny. There is some evidence of the development of a more globalcorporate elite that spans national boundaries (Heemskerk, Fennema, andCarroll 2016), although the number of U.S. firms implicated in this networkis rather modest. Davis (2013) suggests that public corporations are losingtheir central place in the American economy, noting that the number oflisted companies in the United States dropped by more than half between1997 and 2012, as the number of delistings consistently outpaced the num-ber of companies going public.13 Moreover, companies going public mostrecently have adopted market-hostile governance structures, giving theirfounders supervoting rights that ensure their control. (The three foundersofGroupon,e.g., hold stakes giving them 150 votes per share;Mark Zucker-berg personally controls an absolute majority of Facebook’s voting rights.)It is possible that the public corporation as we know it is an artifact of the20th century, and thus those who direct public corporations are no longer
13 The number of private equity-owned companies increased, by contrast, dramaticallyduring this period. Members of the boards of these companies are not subject to the samepublic scrutiny. Elite networks centered on the owners of a few large private companieshave become politically consequential, albeit with a much less centrist orientation thanthe corporate inner circle of the 20th century (e.g., Mayer 2016).
751
Who Killed the Inner Circle?
This content downloaded from 128.135.212.099 on December 09, 2016 14:25:29 PMAll use subject to University of Chicago Press Terms and Conditions (http://www.journals.uchicago.edu/t-and-c).
society’s elites. The study of social elites in the 21st century will have to fol-low a different path than that of the study of 20th-century elites.
REFERENCES
Bakhshandeh, Reza, Mehdi Samadi, Zohreh Azimifar, and Jonathan Schaeffer. 2011.“Degrees of Separation in Social Networks.” Pp. 18–23 in Proceedings: The Fourth In-ternational Symposium on Combinatorial Search, edited by Daniel Borrajo, MaximLikhachev, and Carlos Linares Lopez. Palo Alto, Calif.: AAAI.
Barabási, Albert-László, and Réka Albert. 1999. “Emergence of Scaling in RandomNet-works.” Science 286:509–12.
Bothner, Matthew S., Edward B. Smith, and Harrison C. White. 2010. “AModel of Ro-bust Positions in Social Networks.” American Journal of Sociology 116:943–92.
Brandeis, Louis. 1914. Other Peoples’Money: And How the Bankers Use It. New York:Stokes.
Breiger, Ronald L. 1974. “The Duality of Persons and Groups.” Social Forces 53:181–90.Burris, Val. 2005. “Interlocking Directorates and Political Cohesion among Corporate
Elites.” American Journal of Sociology 111:249–83.Burt, Ronald S. 1992.StructuralHoles: The Social Structure of Competition. Cambridge,
Mass.: Harvard University Press.Cotton-Nessler, Natalie C. 2013. “Skill in Interpersonal Networks.” Ph.D. dissertation.
University of Michigan, Stephen M. Ross School of Business.Davis, Gerald F. 1991. “Agents without Principles? The Spread of the Poison Pill through
the Intercorporate Network.” Administrative Science Quarterly 36:583–613.———. 2009.Managed by theMarkets:HowFinanceReshapedAmerica. Oxford:Oxford
University Press.———. 2013. “After the Corporation.” Politics and Society 41:283–308.Davis, Gerald F., and Henrich R. Greve. 1997. “Corporate Elite Networks and Gover-
nance Changes in the 1980s.” American Journal of Sociology 103:1–37.Davis, Gerald F., and Mark S. Mizruchi. 1999. “The Money Center Cannot Hold: Com-
mercial Banks in the U.S. System of Corporate Governance.” Administrative ScienceQuarterly 44:215–39.
Davis, Gerald F., and Gregory E. Robbins. 2005. “Nothing but Net? Networks and Sta-tus in Corporate Governance.” Pp. 290–311 in The Sociology of Financial Markets,edited by Karin Knorr-Cetina and Alex Preda. Oxford: Oxford University Press.
Davis, Gerald F., Mina Yoo, andWayne E. Baker. 2003. “The SmallWorld of the Amer-ican Corporate Elite, 1982–2001.” Strategic Organization 1:301–26.
DiCarlo, Lisa. 2002. “America’s Most Overworked Directors.” Forbes, August 8. http://www.forbes.com/2002/08/06/0806directors.html.
Dobbin, Frank, and Dirk Zorn. 2005. “Corporate Malfeasance and the Myth of Share-holder Value.” Political Power and Social Theory 17:179–98.
Dreiling, Michael, and Derek Darves. 2011. “Corporate Unity in American Trade Policy:A Network Analysis of Corporate-Dyad Political Action.” American Journal of Soci-ology 116:1514–63.
Fama, Eugene F., andMichael C. Jensen. 1983. “Separation of Ownership and Control.”Journal of Law and Economics 26:301–25.
Ferris, Stephen P., Murali Jagannathan, and Adam C. Pritchard. 2003. “Too Busy toMind the Business? Monitoring by Directors with Multiple Board Appointments.”Journal of Finance 58:1087–1112.
Fich, Eliezer M., and Anil Shivdasani. 2006. “Are Busy Boards Effective Monitors?”Journal of Finance 61:689–724.
752
American Journal of Sociology
This content downloaded from 128.135.212.099 on December 09, 2016 14:25:29 PMAll use subject to University of Chicago Press Terms and Conditions (http://www.journals.uchicago.edu/t-and-c).

Glynn,MaryAnn. 2008. “Configuring theField of Play:HowHosting theOlympicGamesImpacts Civic Community.” Journal of Management Studies 45:1117–46.
Grannis, Rick. 2010. “Six Degrees of ‘Who Cares?’” American Journal of Sociology 115:991–1017.
Heemskerk, Eelke M., Meindert Fennema, and William K. Carroll. 2016. “The GlobalCorporate Elite after the Financial Crisis: Evidence from the Transnational Networkof Interlocking Directorates.” Global Networks 16:68–88.
Institutional Shareholder Services. 2015. “United States Summary Proxy Voting Guide-lines: 2015 Benchmark Policy Recommendations.” http://www.issgovernance.com/file/policy/1_2015-us-summary-voting-guidelines-updated.pdf.
Jeidels, Otto. 1905. Das Verhältnis der Deutschen Grossbanken zur Industrie: Mit Beson-derer Berücksichtigung der Eisenindustrie. Leipzig: Duncker & Humblot.
Kogut, Bruce. 2012. “The Small World of Corporate Governance: An Introduction.”Pp. 1–51 in The Small Worlds of Corporate Governance, edited by Bruce Kogut. Cam-bridge, Mass.: MIT Press.
Lenin, Vladimir I. [1916] 1939. Imperialism: TheHighest Stage of Capitalism. NewYork:International.
Marquis, Christopher, Gerald F. Davis, and Mary Ann Glynn. 2013. “Golfing Alone?Corporations, Elites, and Nonprofit Growth in 100 American Communities.” Organi-zation Science 24:39–57.
Mayer, Jane. 2016.DarkMoney: The Hidden History of the Billionaires behind the Riseof the Radical Right. New York: Doubleday.
Milgram, Stanley. 1967. “The Small-World Problem.” Psychology Today 1:61–67.Mills, C. Wright. 1956. The Power Elite. New York: Oxford University Press.Mintz, Beth, and Michael Schwartz. 1985. The Power Structure of American Business.
Chicago: University of Chicago Press.Mizruchi, Mark S. 1982. The American Corporate Network, 1904–1974. Beverly Hills,
Calif.: Sage.———. 1989. “Similarity of Political Behavior among Large American Corporations.”
American Journal of Sociology 95:401–24.———. 1992. The Structure of Corporate Political Action: Interfirm Relations and Their
Consequences. Cambridge, Mass.: Harvard University Press.———. 1996. “What Do Interlocks Do? An Analysis, Critique, and Assessment of Re-
search on Interlocking Directorates.” Annual Review of Sociology 22:271–98.———. 2013. The Fracturing of the American Corporate Elite. Cambridge, Mass.: Har-
vard University Press.Scott, John. 1997. Corporate Business and Capitalist Classes. Oxford: Oxford University
Press.Stokman, Frans N., Rolf Ziegler, and John Scott. 1985.Networks of Corporate Power: A
Comparative Analysis of Ten Countries. Cambridge: Polity.Sullivan, Bilian Ni, Pamela Haunschild, and Karen Page. 2007. “Organizations Non
Gratae? The Impact of Unethical Corporate Acts on Interorganizational Networks.”Organization Science 18:55–70.
Useem,Michael. 1984.The Inner Circle: Large Corporations and theRise of Business Po-litical Activity in the U.S. and U.K. New York: Oxford University Press.
———. 1996. Investor Capitalism: HowMoneyManagers Are Changing the Face of Cor-porate America. New York: Basic.
Useem,Michael, and JeromeKarabel. 1986. “Pathways to TopCorporateManagement.”American Sociological Review 51:184–200.
Vogus, Timothy J., and Gerald F. Davis. 2005. “Elite Mobilizations for AntitakeoverLegislation, 1982–1990.” Pp. 96–121 in Social Movements and Organization Theory,edited by Gerald F. Davis, Doug McAdam, W. Richard Scott, and Mayer N. Zald.New York: Cambridge University Press.
753
Who Killed the Inner Circle?
This content downloaded from 128.135.212.099 on December 09, 2016 14:25:29 PMAll use subject to University of Chicago Press Terms and Conditions (http://www.journals.uchicago.edu/t-and-c).

Watts, Duncan J. 1999. Small Worlds: The Dynamics of Networks between Order andRandomness. Princeton, N.J.: Princeton University Press.
Westphal, James D., and Ithai Stern. 2007. “Flattery Will Get You Everywhere (Espe-cially If You Are a Male Caucasian): How Ingratiation, Boardroom Behavior, andDemographic Minority Status Affect Additional Board Appointments at U.S. Com-panies.” Academy of Management Journal 50:267–88.
Westphal, James D., and Edward J. Zajac. 2013. “A Behavioral Theory of CorporateGovernance: Explicating the Mechanisms of Socially Situated and Socially Consti-tuted Agency.” Academy of Management Annals 7:605–59.
Windolf, Paul. 2002. Corporate Networks in Europe and the United States. Oxford:Oxford University Press.
Yermack, David. 2004. “Remuneration, Retention, and Reputation Incentives for Out-side Directors.” Journal of Finance 59:2281–2308.
Zajac, Edward J., and James D. Westphal. 1996. “Director Reputation, CEO-BoardPower, and the Dynamics of Board Interlocks.” Administrative Science Quarterly41:507–29.
———. 2004. “The Social Construction ofMarket Value: Institutionalization and Learn-ing Perspectives on Stock Market Reactions.” American Sociological Review 69:433–57.
Zhu, DavidH., and James D.Westphal. 2011. “Misperceiving the Beliefs of Others: HowPluralistic Ignorance Contributes to the Persistence of Positive Security Analyst Re-actions to the Adoption of Stock Repurchase Plans.” Organization Science 22:869–86.
754
American Journal of Sociology
This content downloaded from 128.135.212.099 on December 09, 2016 14:25:29 PMAll use subject to University of Chicago Press Terms and Conditions (http://www.journals.uchicago.edu/t-and-c).
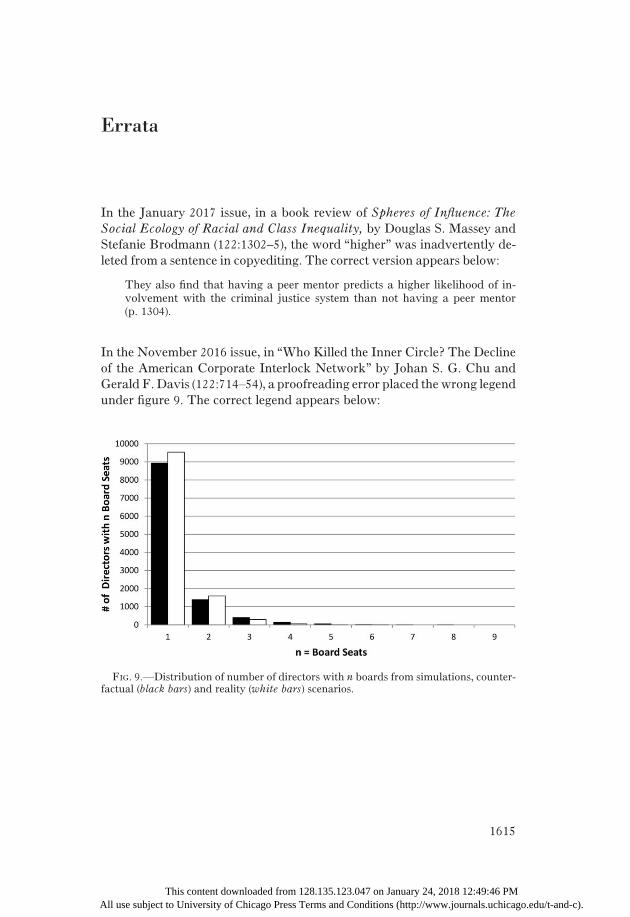
Errata
In the January 2017 issue, in a book review of Spheres of Influence: TheSocial Ecology of Racial and Class Inequality, by Douglas S. Massey andStefanie Brodmann (122:1302–5), the word “higher” was inadvertently de-leted from a sentence in copyediting. The correct version appears below:
They also find that having a peer mentor predicts a higher likelihood of in-volvement with the criminal justice system than not having a peer mentor(p. 1304).
In the November 2016 issue, in “Who Killed the Inner Circle? The Declineof the American Corporate Interlock Network” by Johan S. G. Chu andGerald F. Davis (122:714–54), a proofreading error placed thewrong legendunder figure 9. The correct legend appears below:
FIG. 9.—Distribution of number of directors with n boards from simulations, counter-factual (black bars) and reality (white bars) scenarios.
1615
This content downloaded from 128.135.123.047 on January 24, 2018 12:49:46 PMAll use subject to University of Chicago Press Terms and Conditions (http://www.journals.uchicago.edu/t-and-c).