WhiteHat Security Web Applications Security Statistics Report 2016

Executive Summary
“How are we doing?” That’s the question on the mind of many executives and security practitioners whether they have recently implemented an application security program, or already have a well-established plan in place. The executives within those organizations want to know if the resources they have invested in source code reviews, threat modeling, developer training, security tools, etc. are making a measurable difference in reducing the risk of website compromise, which is by no means guaranteed. They want to know if their online business is truly more secure or less secure than industry peers. If above average, they may praise their team’s efforts and promote their continued success. On the other hand, if the organization is a security laggard, this is cause for concern and action.
Every organization needs to know where it stands, especially against its adversaries. Verizon Business’ 2010 Data Breach Investigations Report (DBIR), a study conducted in cooperation with the United States Secret Service, provides insight. The report analyzes over 141 confirmed data breaches from 2009 which resulted in the compromise of 143 million records. To be clear, this data set is restricted to incidents of a “data” breach, which is different than those only resulting in financial loss. Either way, the data is overwhelming. The majority of breaches and almost all of the data stolen in 2009 (95%) were perpetrated by remote organized criminal groups hacking “servers and applications.” That is, hacking Web Servers and Web applications — “websites” for short. The attack vector of choice was SQL Injection, typically a vulnerability that can’t readily be “patched,” and used to install customized malware.
As the Verizon DBIR describes, the majority of breach victims are targets of opportunity, as opposed to targets of choice. Directly in the crosshairs are the Financial Services, Hospitality, and Retail industries. Victimized organizations are selected because their security posture is weaker than others and the data they possess can be converted into cash, namely payment card data and intellectual property. As such, organizations are strongly encouraged to determine if they are similar potential targets of opportunity in these industries, have a relatively weak or unknown security posture, and the data they hold is similarly attractive. This is a key point because perfect security may not be necessary to avoid becoming another Verizon DBIR statistical data point.
There are of course many published examples in Web security where the victim was a target of choice. Currently, Clickjacking attacks1 targeting social networks, more specifically Facebook, are rampant. In these attacks, visitors are being tricked into posting unwanted messages to friends and installing malware. There has also been a rise in targeted Cross-Site Scripting attacks, including a notable incident involving Apache.org2 in which passwords were compromised. Content Spoofing attacks have been aimed at Wired to spoof a Steve Jobs health scare3. Sears suffered a similar embarrassment4 when a fake product listing appeared on the company’s website. In an Insufficient Authorization incident involving Anthem Blue Cross Blue Shield, customers’ personally identifiable information was exposed5.
WhiteHat Website Security Statistic Report
Fall 2010, 10th Edition – Industry Benchmarks
Web security is a moving target and enterprises need timely information about the latest attack trends, how they can best defend their websites, and gain visibility into their vulnerability lifecycle. Through its Software-as-a-Service (SaaS) offering, WhiteHat Sentinel, WhiteHat Security is uniquely positioned to deliver the knowledge and solutions that organizations need to protect their brands, attain PCI compliance and avert costly breaches.
The WhiteHat Website Security Statistics Report provides a one-of-a-kind perspective on the state of website security and the issues that organizations must address to safely conduct business online. WhiteHat has been publishing the report, which highlights the top vulnerabilities, tracks vertical market trends and identifies new attack techniques, since 2006.
The WhiteHat Security report presents a statistical picture of current website vulnerabilities among the more than 2,000 websites under management, accompanied by WhiteHat expert analysis and recommendations. WhiteHat’s report is the only one in the industry to focus solely on previously unknown vulnerabilities in custom Web applications, code unique to an organization, within real-world websites.
2,000+ websites
under management

WhiteHat Website Security Statistics Report | 10th Edition | Fall 2010 2
The bottom-line is no matter how mature the software development lifecycle there are always ways to break into and defraud computer systems. A goal of reducing the number of vulnerabilities to zero is an unrealistic, futile pursuit, perhaps impossible, and as we’ve learned likely unnecessary. And, organizations should increase the emphasis on improving responsiveness when vulnerabilities are eventually identified. The risk management question then becomes, “How secure is secure enough?” If the organization is a target of opportunity, perhaps a goal of being at or above average among your peers is good enough. If a target of choice, perhaps.
Until now no metrics have been published which organizations can use as a benchmark to compare themselves against their industry peers. These benchmarks may help answer the question, “How are we doing?” or “Are we secure enough?” WhiteHat Security’s 10th Website Security Statistics Report presents a statistical picture of the vulnerability assessment results from over 2,000 websites across 350 organizations under WhiteHat Sentinel management. For the first time, we’ve broken down the numbers by industry and size of organization. The data provides a unique perspective on the state of website security that may begin answering some of these pressing questions.
Key Findings• Theaveragewebsitehadnearly13 serious vulnerabilities.
• Banking,Insurance,andHealthcareindustriesperformedthebestoverallregardingtheaveragenumberofserious vulnerabilities having 5, 6, and 8 respectively. The worst were the IT, Retail, and Education sectors with an average of 24, 17, and 17.
• Largeorganizations(over2,500employees)hadthehighestaveragenumberofserious vulnerabilities totaling 13, followed by medium (150 - 2,500 employees) at 12, and third was small (Up to 150 employees) at 11.
• Cross-SiteRequestForgerymovedupto4thplaceasoneofthemostprevalentvulnerabilityclasses.Alsonewonthelist, in 10th place, is Brute Force affecting 10% of websites.
• TheBankingindustryremovedSQLInjectionasoneofthemostprevalentissuestheyfacewhilealltheotherindustries are still grappling with it. Similarly, Cross-Site Scripting within the Insurance industry has about half the overall likelihood of being exploited versus the others at 36%.
• Industrieswithagreateraveragenumberofserious vulnerabilities tend to have worse remediation rates.
• Smallorganizationsfixthemostoftheirserious vulnerabilities by percentage (62%), followed by medium (58%) and large (54%).
• 64%ofBankingandTelecommunicationswebsites,theindustriesleadinginremediation,havefixedmorethan60%of their reported serious vulnerabilities. The laggards are Insurance and IT where only 26% and 33% respectively have fixed more than 60% of their outstanding serious issues.
• ItdoesnotappearorganizationsizesignificantlyimpactsanIndustry’saveragenumberofserious vulnerabilities, the type or degree of specific vulnerability classes, or their time-to-fix metrics. However, remediation rate does seem to correlate. Typically the larger the organization the fewer vulnerabilities they resolve by percentage.
• Withrespecttotheaveragenumberofserious vulnerabilities within large organizations, Social Networking, Banking, and Healthcare had the best marks with 4.38, 5.18, and 3.68 respectively. The three Worst were IT, Retail, Financial Services, with 29.55, 18.44, and 10.34
• Amonglargeorganizations,theBanking,FinancialServices,HealthcareandEducationindustriesturnedinthebesttime-to-fix metrics with 2 weeks, 3 weeks, 4 weeks, and 4 weeks respectively. The worst were Telecommunications, Insurance, Retail and Social Networking with 26 weeks, 10 weeks, 8 weeks, and 8 weeks.
• Telecommunications,Retail,andHealthcareindustrieshadthethreebestremediationratesoflargeorganizationswith67%, 60% and 58% respectively. The three worst were IT, Banking and Insurance with 32%, 35%, and 35%.
Serious Vulnerabilities: Those vulnerabilities with a HIGH, CRITICAL, or URGENT severity as defined by PCI-DSS naming conventions. Exploitation could lead to breach or data loss.

WhiteHat Website Security Statistics Report | 10th Edition | Fall 2010 3
Data Overview• DatacollectedfromJanuary1,2006toAugust25,2010
• 2,000+websites
• 350+organizations(Start-upstoFortunelisted)
• 32,000+verifiedcustomWebapplicationvulnerabilities(non-CommonVulnerabilitiesandExposures(CVE))
• Majorityofwebsitesassessedmultipletimespermonth
• VulnerabilitiesclassifiedaccordingtoWASCThreatClassification6
• SeveritynamingconventionalignswithPCI-DSS7
Note: The websites WhiteHat Sentinel assesses likely represent the most “important” and “secure” websites on the Web, owned by organization that are very serious about their security.
Vulnerability Assessment & Data Collection Process
Built on a Software-as-a-Service (SaaS) technology platform, WhiteHat Sentinel combines proprietary scanning technology with human expert analysis, to enable customers to identify, prioritize, manage and remediate website vulnerabilities. WhiteHat Sentinel focuses solely on previously unknown vulnerabilities in custom Web applications -- code unique to an organization (Figure 1). Every vulnerability discovered by the WhiteHat Sentinel Service is verified for accuracy and prioritized by severity and threat.
In order for organizations to take appropriate action, each website vulnerability must be independently evaluated for business criticality. For example, not all Cross-Site Scripting or SQL Injection vulnerabilities are equal, making it necessarytoconsideritstrue“severity”foranindividualorganization.UsingthePaymentCardIndustryDataSecurityStandard8(PCI-DSS)severitysystem(Urgent,Critical,High,Medium,Low)asabaseline,WhiteHatSecurityratesvulnerability severity by the potential business impact if the issue were to be exploited and does not rely solely on default scanner settings.
WhiteHatSentineloffersthreedifferentlevelsofservice(Premium,Standard,andBaseline)tomatchthelevelofsecurityassurance required by the organization9.And,WhiteHatSentinelexceedsPCI6.6and11.3.2requirementsforWebapplication scanning10.
Figure 1. Software / Vulnerability Stack

WhiteHat Website Security Statistics Report | 10th Edition | Fall 2010 4
Scanning Technology• “Productionsafe”scanning-Non-invasivetestingwithlessperformanceimpactthanasingleuser.
• Battlefieldtesting-Trackrecordofidentifyingmorevulnerabilitiesthancommercialscanners.
• Accuracy-False-positivesarevirtuallyeliminatedbytheWhiteHatSecurityOperationsTeam.
• SeamlesssupportforWeb2.0technology-modernwebsitesusingJavaScript,MacromediaFlash,AJAX,JavaApplets,orActiveX
• Authenticatedscans-Patentedautomatedlogintechnologyforcompletewebsitemapping.
• BusinessLogicCoverage-customizedtestsanalyzeeveryWebform,businessprocess,andauthentication/authorization component.
Table 1. WhiteHat Sentinel Premium Edition Coverage
Factors Influencing the Data
• Websitesrangefromhighlycomplexandinteractivewithlargeattacksurfacestostatic brochureware. Brochureware websites, because of a generally limited attack surface, tend tohavealimitednumberof“custom”Webapplicationvulnerabilities.
• VulnerabilitiesarecountedbyuniqueWebapplicationandclassofattack.Ifthreeof thefiveparametersofasingleWebapplication(/foo/webapp.cgi)arevulnerabletoSQL Injection,itiscountedasonevulnerability(notthree).Ifcountedbyindividualparameter the total count are estimated to be 2 - 5 times higher.
• “Bestpractice”findingsarenotincludedinthereport.Forexample,ifawebsitemixes SSLcontentwithnon-SSLonthesameWebpage,whilethismaybeconsideredapolicy violation, it must be taken on a case-by-case basis. Only issues that can be directly and remotelyexploitablethatleadtodatalossareincluded.

WhiteHat Website Security Statistics Report | 10th Edition | Fall 2010 5
• Vulnerabilityassessmentprocessesareincrementalandongoing,thefrequencyofwhich iscustomer-drivenandassuchshouldnotautomaticallybeconsidered“complete.” ThevastmajorityofWhiteHatSentinelcustomershavetheirsitesassessedmultiple timespermonth.
• Newattacktechniquesareconstantlybeingresearchedtouncoverpreviouslyunknown vulnerabilities,includinginpreviouslytestedandunchangedcode.Likewiseassessments maybeconductedindifferentformsofauthenticatedstate(i.e.user,admin,etc.).As suchitisbesttoviewthisreportasabest-casescenarioandtherearealwaysmore vulnerabilities to be found.
• WebsitesmaybecoveredbydifferentWhiteHatSentinelservicelevels(Premium(PE), Standard(SE),Baseline(BE))offeringvaryingdegreesoftestingcriteria,butallinclude verification. PE covers all technical vulnerabilities and business logic flaws identified by theWASCThreatClassificationv1(andsomebeyond).SEfocusesprimarilyonthe technicalvulnerabilities.BEbundlescriticaltechnicalsecuritychecksintoaproduction- safe, fully-automated service. The bulk of websites under management are under the PE offering.
Data Overview
In website security, three outcome-based metrics stand out. First is the average number of serious and remotely exploitable website vulnerabilities that could lead to a breach or data loss. Second is the speed with which an organization fixes those vulnerabilities, the time-to-fix. And, last is the percentage of vulnerabilities that get fixed, also know as the remediation rate. For example, if two different websites each have seven serious vulnerabilities you can use these metrics to determine which is more secure. If SiteA fixed all of its vulnerabilities in 30 days, while SiteB fixed only half in 60 days, the difference in the overall security posture is clear.
Vulnerability Prevalence
It is important to understand the difference between what is possible and what is probable with regard to website vulnerabilities. A vulnerability represents a possible avenue for an attacker to exploit a website, but not all (vulnerabilities or attackers) are created equal. Just because a vulnerability exists does not necessarily mean it will be exploited, by whom or to what extent. Some vulnerabilities are more difficult to exploit than others and thereby are only relevant to a more sophisticated attacker. Autonomous worms & viruses exploit one type of issue, while sentient attackers may prefer another. Better understanding of these factors enables security professionals to make informed decisions about website risk management.
What we do know is having numerous serious (Urgent, Critical, or High severity) issues, whatever they be, makes it easier for an attacker to achieve a successful intrusion. Therefore, it is best to minimize vulnerabilities to the maximum extent possible in order to increase software security assurance. At the same time, an attacker only needs to find and exploit a single issue to hit pay dirt. That’s why mature and pragmatic software development lifecycles are designed to reduce the total number of vulnerabilities and minimize the severity of those that remain unremediated in a manner consistent with the risk tolerance of the business.
Whether taking the first steps in developing an application security program or an organization that is already well down the path, the question is for the same, “How does the number of vulnerabilities in our production applications compare to industry averages?” From an industry vertical and organization size perspective, Figures 2, 3, & 4 below illustrate those current averages across the nine industries in our sample.

WhiteHat Website Security Statistics Report | 10th Edition | Fall 2010 6
Figure2.AverageNumberofSerious Vulnerabilities Sorted by industry
Over the last year we determined that the average website had nearly 13 serious vulnerabilities with a standard deviation (σ) of 29.11, meaning that most websites had between 0 and 42. The range is quite stunning, but really only for those unfamiliar with the generally weak state of website security. While no industry is close to zero, the Banking, Insurance, Healthcare and Financial Services industries performed comparatively well with an average of 5, 6, 6, and 8 vulnerabilities respectively. On the opposite end of the spectrum, the least secure websites, resided in the IT, Retail, and Education sectors with an average of 24, 17, and 17 each.
Taking into consideration the types of data that are appealing to cyber criminals, placement of the industries makes sense. The “more secure” websites would typically have large volumes of payment card data, identity information, and access to financial transactions. The Retail industry, which collects a significant amount of payment card data, is a curious exception. Retail was on the higher side of vulnerabilities and yet is also a highly attractive target for cyber criminals. It is possible to attribute this aberration to an average Retail website’s attack surface and rate of application change. If either is elevated we would expect increased vulnerability counts, but we do not have data to support or refute this theory.
!"#$%&
!!#'!&
!!#%(&
!)#))&
!)#*)&
!!#))&
!!#*)&
!%#))&
!%#*)&
!"#))&
!"#*)&
!$#))&
+,-./&0%1*))&,23&45/-&/67+48//9:& 6/3;<6&0!*)&=&%1*))&/67+48//9:& 96,++&0<7&>4&!*)&/67+48//9:&
!"#$%&#'()*
+#$',-'.)/0#
$%+1/12
#3'
4$&%015%2,0'615#'
Figure3.AverageNumberofSerious Vulnerabilities Sorted by Size of the Organization
Judging from Figure 3, the size of the organization may only marginally correlate with the number of serious vulnerabilities a website is likely to have. Large organizations have the most issues totaling 13, followed by medium at 12, and a close third is small at 11. At the same time it is helpful to point out that the delta between all three organization sizes is roughly two vulnerabilities, which is very slight when compared to the overall number.
Where things become more interesting is within the standard deviations (σ) of large, medium, and small organizations (Table 2). In large organizations, most websites had an average of between 0 and 50 serious vulnerabilities (σ of 36.42). Mostmedium-sizedorganizationsfellwithin0and35vulnerabilities(σ of 23.67), while small organizations had between 0 and 40 (σ of 29.1). Clearly the average number of serious vulnerabilities ranged fairly substantially in all three organization sizes.

WhiteHat Website Security Statistics Report | 10th Edition | Fall 2010 7
!"#$%
$"&'%
#("'&%
'")$%
)"#&%
*+"!!%
#'"&*%
#$"&&%
&"'$%
!"*#%
&"$+%
*)",)%
!"!,%
#+"'*%
#)"(!%
##"$#%
#&"*&%
*#"'!%
+"(+%
&"+!%
+"((%
&"+'%
#'"+'%
*&"+)%
##"*,%
#&"'(%
#)"&*%
("((% !"((% #("((% #!"((% *("((% *!"((% '("((% '!"((%
-./01/2%
3456.78/%
91/./61.:%;<=>16<?%
@<.:AB6.=<%
C/?5=./6<%
CD%
E><=.::%
F<A.1:%
;861.:%G<AH8=01/2%
D<:<68II5/16.78/?% ?I.::%J5K%A8%#!(%<IK:8L<<?M%
I<415I%J#!(%N%*O!((%<IK:8L<<?M%
:.=2<%J*O!((%./4%8><=%<IK:8L<<?M%
Figure 4. AverageNumberofSeriousVulnerabilities
Sorted by Size of the Organization and Industry
Note: Missing portions of data indicate that the volume of data collected was not large enough to include as a meaningful data sample.
When comparing the number of serious vulnerabilities combined by organization size and industry segment in Figure 4, the data reveals much more than compiled overall averages alone. With Banking websites, the size of the organization does not appear to affect vulnerability counts while the remaining industries do possess differences to varying degrees.
In the Retail and Financial Services sectors, the data demonstrates that the larger the organization, the more vulnerabilities it is likely to have. On the other hand in Telecommunications the opposite is true. In other industries, medium-size organizations have the worst performance. Collectively there does not appear to be evidence that organization size alone dictates whether an industry will have an increased or decreased volume of vulnerabilities.
WhiteHat Website Security Statistics Report | 10th Edition | Fall 2010 8
Industry Small Org Vuln
Average
Small Org (σ)
Med Org Vuln
Average
Medium Org (σ)
Large Org Vuln
Average
Large Org (σ)
Overall 11.27 36.42 11.81 23.67 13.42 29.1
Telecom - - 9.09 19.95 5.21 2.98
Social 16.42 25.15 21.35 26.33 4.38 4.95
Retail 14.3 17.39 14.24 30.43 18.44 37.31
IT 24.96 76.9 16.05 21.2 29.55 44.74
Insurance - - - - 6.14 9.41
Healthcare 13.93 18.66 19.32 40.1 3.68 6.76
Financial Services 4.93 9.29 5.57 7.38 10.34 17.68
Education 9 10.92 26.76 32.76 8.43 7.22
Banking 4.95 7.77 4.89 3.66 5.18 5.77
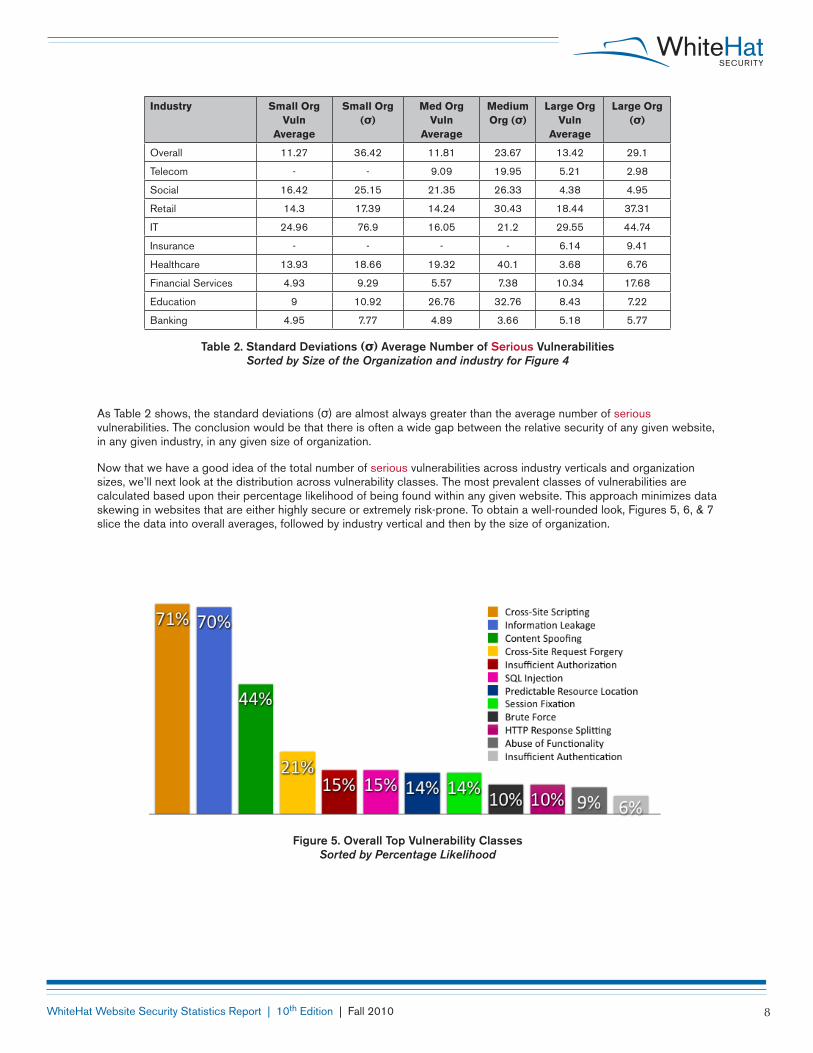
Table2.StandardDeviations(σ)AverageNumberofSerious Vulnerabilities Sorted by Size of the Organization and industry for Figure 4
As Table 2 shows, the standard deviations (σ) are almost always greater than the average number of serious vulnerabilities. The conclusion would be that there is often a wide gap between the relative security of any given website, in any given industry, in any given size of organization.
Now that we have a good idea of the total number of serious vulnerabilities across industry verticals and organization sizes, we’ll next look at the distribution across vulnerability classes. The most prevalent classes of vulnerabilities are calculated based upon their percentage likelihood of being found within any given website. This approach minimizes data skewing in websites that are either highly secure or extremely risk-prone. To obtain a well-rounded look, Figures 5, 6, & 7 slice the data into overall averages, followed by industry vertical and then by the size of organization.
Figure5.OverallTopVulnerabilityClasses Sorted by Percentage Likelihood

WhiteHat Website Security Statistics Report | 10th Edition | Fall 2010 9
When compared to previous WhiteHat Security reports, the usual vulnerability classes appear in Figure 5. Cross-Site Scripting and Information Leakage remain by far the most prevalent occurring in 7 out of 10 websites. SQL Injection, InsufficientAuthorization,andPredictableResourceLocationarestillascommonasbeforeaswellbeingfoundinroughly 15% of websites. We also still see a 50-50 mix between technical vulnerability classes that scanners excel at identifying and business logic flaws that require the intelligence of human evaluation and expertise to uncover. This is not to say that there are not some changes to the list worthy of discussion.
As predicted in past WhiteHat Security reports, Cross-Site Request Forgery (CSRF) has moved up the “Overall Top Vulnerability Classes” chart into the 4th most prevalent spot. It should not be concluded that websites have become more vulnerable to CSRF in the past year. The increase can be attributed to a steadily improving Sentinel assessment methodology combined with customer demand to report these issues. Only a couple of years ago CSRF was not considered a vulnerability worth spending time on by most organizations. Recently this perception has changed with increased customer awareness and an uptick in malicious hacker activity that exploits this vulnerability.
Brute Force is a newcomer to the list, but like CSRF not because the issue is new in some way or websites are becoming more vulnerable. Far from it. Instead, the bulk of these issues occur when the website login fields reveal whichentryoftheusername/passwordcombinationisincorrect.Duetospammersminingforvalidemailaddresses(usernames) on target websites, specifically social networks, enterprises have an increased awareness and appreciation of the risks involved. They have subsequently elevated the demand for testing and reporting of this issue, where in the past the recommendation was ignored, and the charts reflect that evolution.
Figure6.TopVulnerabilityClasses Sorted by Industry and Percentage Likelihood

WhiteHat Website Security Statistics Report | 10th Edition | Fall 2010 10
One fact that immediately stands out is the similarity between Figures 5 & 6. Each industry possesses nearly the same types of issues with the only real difference being in degree. However, there are some subtle exceptions relating to SQL Injection and Cross-Site Scripting.
The Banking category has managed to wipe out SQL Injection as one of the most prevalent issues they face while all the other industries are still grappling with it. Currently SQL Injection is at an impressively low 4% likelihood in Banking websites. This is not to say that some Banking websites don’t currently have SQL Injection or haven’t had them at some point in the past, just that the vast majority have been fixed within the previous year. This may have been the result of regulatory requirements and widespread attacks motivating action. Similarly Cross-Site Scripting within the Insurance industry has roughly half the overall likelihood of occurrence versus the others.
We believe anecdotally that these improvement can be attributed to policy enforcement in organizations that have mandated that the development group must fix SQL Injection or Cross-Site Scripting issues within a specified amount of time once identified and reduce their volume of introduction within the code. Such policies encourage developers to seek out the security team for assistance with education and tools that enable them to be successful with the mandate. Other organizations in other industries have of course adopted similar policies,however the vast majority of Banking and Insurance organizations appear to have done so across the board.
Figure7.TopVulnerabilityClasses Sorted by Size of Organization and Percentage Likelihood

WhiteHat Website Security Statistics Report | 10th Edition | Fall 2010 11
As shown in Figure 7, there is no meaningful difference in the type of vulnerabilities organizations possess in relation to the number of employees. Even the degree to which they are likely to be vulnerable is extremely consistent. It is likely because the root cause of these issues has more to do with general shortcomings of software development programs and technology platforms in use rather than tendencies of particular industries or organizations.
Time-to-Fix
Once website vulnerabilities are identified, a certain amount of time transpires before the issue is resolved. Resolution could take the form of a software update, configuration change, Web application firewall rule, etc. An open vulnerability represents an opportunity for malicious hackers to exploit the website. The challenge is that no remedy is instantaneous and ideally the window of exposure should be as short as possible. To measure time-to-fix we focused on serious vulnerabilities identified and resolved within the previous year (August 25, 2009 and August 25, 2010).
Factors Influencing the Data
• Shouldavulnerabilityberesolved,itcouldtakeuptosevendaysbeforeitisretestedandconfirmedclosedbyWhiteHatSecurity’sThreatResearchCenter,dependinguponthecustomer’spreferredscanschedule.Acustomercanalsoproactivelyusetheauto-retestfunction to get real-time confirmation of a fix.
• Notallvulnerabilitiesidentifiedwithinthisperiodhavebeenresolved,whichmeansthetime-to-fix measurements are likely to grow as resolution rates increase.
First, we’d like compare how long (in weeks) it takes for different industries to remediate their website vulnerabilities. As a reminder, these are all issues that have been identified by WhiteHat Sentinel and the exploitability of the vulnerability is verified. Different industries possess different types of sensitive information and are subject to different regulations. We might expect these factors to influence their relative time-to-fix speed. Similarly, it has been suggested that the size of the organization, due to varying levels of bureaucracy, also may influence the time is takes to get a vulnerability resolved. Figures 8 & 9 below shed new light on this area to see if the general theory holds true and to what degree a difference in remediation/mitigationspeedexists.

WhiteHat Website Security Statistics Report | 10th Edition | Fall 2010 12
!"
#!"
$!"
%!"
&!"
'!"
(!"
)!"
*!"
+!"
#!!"
#" &" )" #!" #%" #(" #+" $$" $'" $*" %#" %&" %)" &!" &%" &(" &+" '$" '(" '+" ($" ('" (+" )$" )'" )+" *$" *+" +'"#!#"#!&"##!"##+"#$*"#%%"#&$"#'%"$##"
!"##"$%&
'()*
(+,-.()/(01(2.%3()
4'(0%3()5-#(6.768-9):*((;,<))
,-./0.1"2345-67."80.-.50-9":;<=05;>"?;-9@A5-<;"B.>4<-.5;"BC"D=;<-99"E;@-09":750-9"F;@G7</0.1"C;9;57HH4.05-67.>"
Figure8.AggregateAverageTime-to-Fix(Weeks) Sorted by Industry
Industry Leaders Top 25%
Above Average Mid 25% – 50%
Laggards Lower 50% – 75%
Overall 5 13 30
Banking 2 3 13
Education 5 14 19
Financial Services 6 11 28
Healthcare 3 9 22
Insurance 10 22 39
IT 5 13 29
Retail 6 18 40
Social Networking 3 9 28
Telecommunications 2 5 25
Table3.Time-to-FixBenchmarks(Weeks) Sorted by Industry
By arranging the time-to-fix data in a cumulative format we get a sense of the time required for a given percentage of industry’s websites to fix their vulnerabilities. This helps to answer the question, “How fast should our organization be fixing our vulnerabilities?” From a risk management perspective if the organization is a target of opportunity, perhaps a goalofbeingatoraboveaverageisgoodenough.Ifhowevertheorganizationisatargetofchoice,eitherASAPorbeingamong the fastest is more appropriate.
For example, the top 25% of Banking websites (Leaders) need 2 or less weeks between the point when a vulnerability is verified and confirmed closed. In Banking websites that are at or Above Average, no more than 3 weeks is necessary to deploy a fix. The Laggards are taking over 3 months. In all cases except for Insurance, Leaders need no more than a couple weeks to 1.5 months to address the majority of their vulnerabilities. For the Above Average, save for Banking, we’re talking a month to several months to close out a *serious vulnerability. Worse still are the Laggards who wait 6 months or more.
We find the aforementioned performance of the Leaders and the Above Average rather impressive and encouraging historically, but perhaps also may be a bit misleading. The time-to-fix metrics are skewed on the shorter end by a possibly sluggish remediation rate. For example, when organizations fix vulnerabilities they may do so quickly, but not fix many of them by percentage. As such all time-to-fix measurements must be viewed with this context in mind.

WhiteHat Website Security Statistics Report | 10th Edition | Fall 2010 13
!"
#!"
$!"
%!"
&!"
'!"
(!"
)!"
*!"
+!"
#!!"
#" &" )" #!"
#%"
#("
#+"
$$"
$'"
$*"
%#"
%&"
%)"
&!"
&%"
&("
&+"
'$"
'("
'+"
($"
('"
(+"
)$"
)'"
)+"
*$"
*+"
+'"
#!#"
#!&"
##!"
##+"
#$*"
#%%"
#&$"
#'%"
$##"
!"##"$%&
'()*
(+,-.()/(01(2.%3()
4'(0%3()5-#(6.768-9):*((;,<))
,-./0"1$2'!!"-34"560."078,5900:;"704<=7"1#'!">"$2'!!"078,5900:;":7-,,"1=8"?5"#'!"078,5900:;"
Figure9.AggregateAverageTime-to-Fix(Weeks)
Sorted by Size of the Organization
Size of Organization Leaders Top 25%
Above Average Mid 25% – 50%
Laggards Lower 50% – 75%
small (up to 150 employees) 4 12 26
medium (150 - 2,500 employees) 5 10 26
large (2,500 and over employees) 6 15 35
Table4.Time-to-FixBenchmarks(Weeks) Sorted by Size of the Organization
When analyzing time-to-fix metrics by size of the organization, we do not see a substantial difference between the performance of small, medium, and large sized organizations. The metrics are generally close overall. There is however a clear gap between the general Leaders who fix their vulnerabilities within a month to a month and a half, the Above Average who take 2 to 4 months, and the Laggards between 6 and 9 months. Our next step is take a look at a deeper slice of the time-to-fix data, but this time when industry and organization size are separated.

WhiteHat Website Security Statistics Report | 10th Edition | Fall 2010 14
!"
#!"
$!"
%!"
&!"
'!"
(!"
)!"
*!"
+!"
#!!"
#" &" )" #!"
#%"
#("
#+"
$$"
$'"
$*"
%#"
%&"
%)"
&!"
&%"
&("
&+"
'$"
'("
'+"
($"
('"
(+"
)$"
)'"
)+"
*$"
*+"
+'"
#!#"
#!&"
##!"
##+"
#$*"
#%%"
#&$"
#'%"
$##"
!"##"$%&
'()*
(+,-.()/(01(2.%3()
4'(0%3()5-#(6.768-9):*((;,<))
,-./0.1"20.-.30-4"56780369":6-4;<3-76"=>"?867-44"@6;-04"5A30-4"B6;CA7/0.1"
Figure10.AggregateAverageTime-to-Fix(Weeks) Small–Sized Organizations by Industry (up to 150 employees)
Industry Leaders Top 25%
Above Average Mid 25% – 50%
Laggards Lower 50% – 75%
Overall 4 12 26
Financial Services 7 18 31
Healthcare 3 6 23
IT 4 11 24
Retail 11 12 27
Social Networking 2 3 10
Table5.Time-to-FixBenchmarks(Weeks) Small–Sized Organizations by Industry (up to 150 employees)
When analyzing time-to-fix by the size of the organization and industry we get much more variety in the metrics. Of course this might have something to do with the volume and kind of data in the set, but we believe the trend lines are there and tell a story.
WhiteHat Website Security Statistics Report | 10th Edition | Fall 2010 15
!"
#!"
$!"
%!"
&!"
'!"
(!"
)!"
*!"
+!"
#!!"
#" &" )" #!"
#%"
#("
#+"
$$"
$'"
$*"
%#"
%&"
%)"
&!"
&%"
&("
&+"
'$"
'("
'+"
($"
('"
(+"
)$"
)'"
)+"
*$"
*+"
+'"
#!#"
#!&"
##!"
##+"
#$*"
#%%"
#&$"
#'%"
$##"
!"##"$%&
'()*
(+,-.()/(01(2.%3()
4'(0%3()5-#(6.768-9):*((;,<))
,-./0.1"2345-67."80.-.50-9":;<=05;>"?;-9@A5-<;"BC"D=;<-99"E;@-09":750-9"F;@G7</0.1"C;9;57HH4.05-67.>"
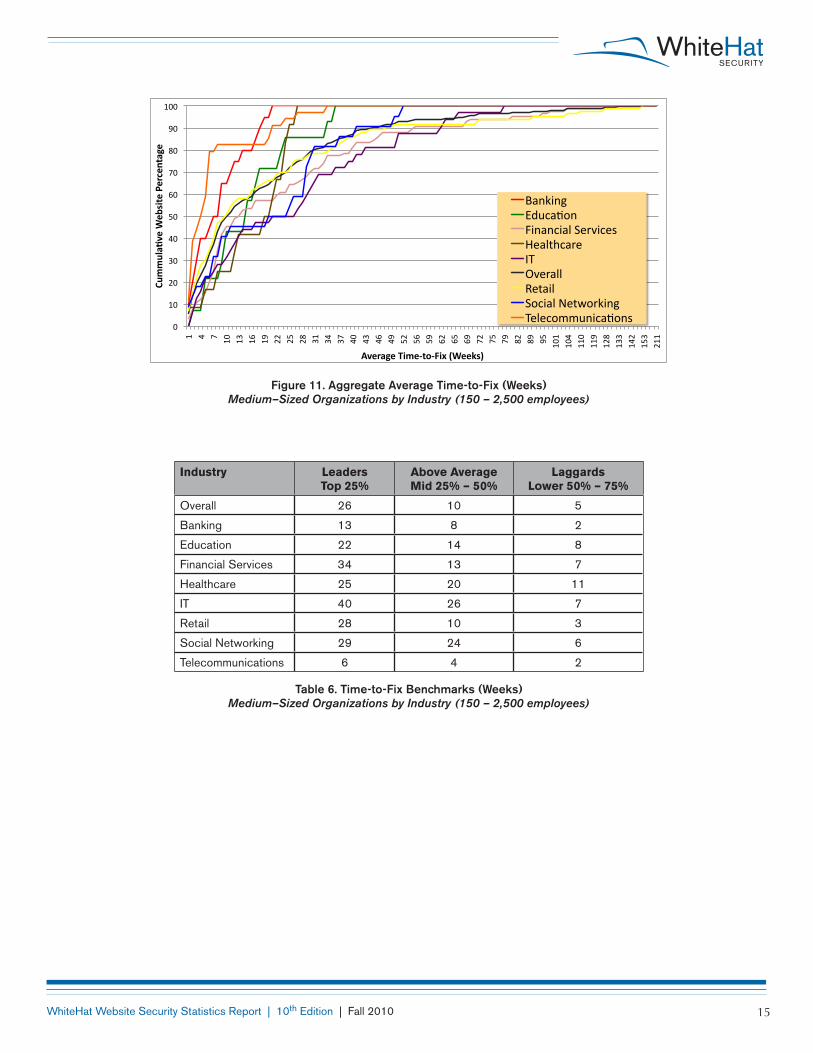
Figure11.AggregateAverageTime-to-Fix(Weeks) Medium–Sized Organizations by Industry (150 – 2,500 employees)
Industry Leaders Top 25%
Above Average Mid 25% – 50%
Laggards Lower 50% – 75%
Overall 26 10 5
Banking 13 8 2
Education 22 14 8
Financial Services 34 13 7
Healthcare 25 20 11
IT 40 26 7
Retail 28 10 3
Social Networking 29 24 6
Telecommunications 6 4 2
Table6.Time-to-FixBenchmarks(Weeks) Medium–Sized Organizations by Industry (150 – 2,500 employees)
WhiteHat Website Security Statistics Report | 10th Edition | Fall 2010 16
!"
#!"
$!"
%!"
&!"
'!"
(!"
)!"
*!"
+!"
#!!"
#" &" )" #!"
#%"
#("
#+"
$$"
$'"
$*"
%#"
%&"
%)"
&!"
&%"
&("
&+"
'$"
'("
'+"
($"
('"
(+"
)$"
)'"
)+"
*$"
*+"
+'"
#!#"
#!&"
##!"
##+"
#$*"
#%%"
#&$"
#'%"
$##"
!"##"$%&
'()*
(+,-.()/(01(2.%3())
4'(0%3()5-#(6.768-9):*((;,<))
,-./0.1"2345-67."80.-.50-9":;<=05;>"?;-9@A5-<;"B.>4<-.5;"BC"D=;<-99"E;@-09":750-9"F;@G7</0.1"C;9;57HH4.05-67.>"
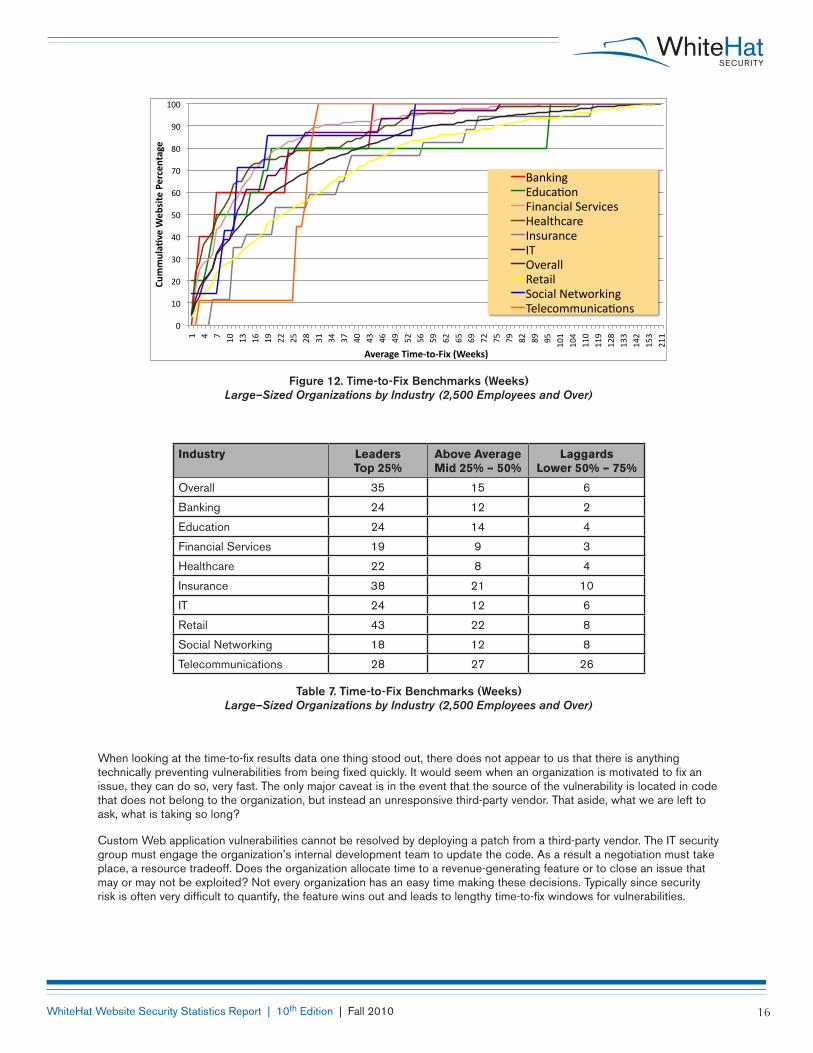
Figure12.Time-to-FixBenchmarks(Weeks)
Large–Sized Organizations by Industry (2,500 Employees and Over)
Industry Leaders Top 25%
Above Average Mid 25% – 50%
Laggards Lower 50% – 75%
Overall 35 15 6
Banking 24 12 2
Education 24 14 4
Financial Services 19 9 3
Healthcare 22 8 4
Insurance 38 21 10
IT 24 12 6
Retail 43 22 8
Social Networking 18 12 8
Telecommunications 28 27 26
Table7.Time-to-FixBenchmarks(Weeks) Large–Sized Organizations by Industry (2,500 Employees and Over)
When looking at the time-to-fix results data one thing stood out, there does not appear to us that there is anything technically preventing vulnerabilities from being fixed quickly. It would seem when an organization is motivated to fix an issue, they can do so, very fast. The only major caveat is in the event that the source of the vulnerability is located in code that does not belong to the organization, but instead an unresponsive third-party vendor. That aside, what we are left to ask, what is taking so long?
Custom Web application vulnerabilities cannot be resolved by deploying a patch from a third-party vendor. The IT security group must engage the organization’s internal development team to update the code. As a result a negotiation must take place, a resource tradeoff. Does the organization allocate time to a revenue-generating feature or to close an issue that may or may not be exploited? Not every organization has an easy time making these decisions. Typically since security risk is often very difficult to quantify, the feature wins out and leads to lengthy time-to-fix windows for vulnerabilities.

WhiteHat Website Security Statistics Report | 10th Edition | Fall 2010 17
Resolution Rates
As we have learned in the previous sections, even if serious vulnerabilities are identified, verified, and explained it does not necessarily mean they are fixed quickly. As such it is important to analyze the resolution rates of organizations that do get their vulnerabilities fixed, or not, and in what volumes (Figure 13). Some organizations target the easier issues first to demonstrate their progress in vulnerability reduction. Others prioritize the high severity issues to reduce overall risk.
!"#
$"#
!%#
$!#
&$#
&"#
!&#
!&#
!!#
!'#
'#
""#
""#
(#
"%#
"%#
")#
"!#
*#
")#
'#
"&#
")#
")#
"$#
+#
+#
")#
""#
")#
!#
"&#
"!#
""#
$#
""#
"*#
"'#
*#
"$#
*!#
!+#
$'#
&!#
!$#
!!#
&"#
$(#
(*#
$+#
)# ")# !)# $)# &)# ()# *)# %)# ')# +)# "))#
,-./0.1#
2345-67.#
80.-.50-9#:;<=05;>#
?;-9@A5-<;#
B.>4<-.5;#
BC#
D;@-09#
:750-9#E;@F7</0.1#
C;9;57GG4.05-67.>#
H=;<-99#
)#I#!)J#
!"J#I#&)J#
&"J#I#*)J#
*"J#I#')J#
'"J#I#"))J#
Figure 13. Percentage of Websites within Remediation Rate Ranges Sorted by Industry
There is a sizable difference in Figure 13 between the remediation rates of different industry groups. On the high side, 64% of Banking and Telecommunications websites measurably fix the bulk of their vulnerabilities (green segments). The laggards are Insurance and IT where most of the websites have resolved less than half (red & orange segments) of their outstanding issues.
Industry remediation rates also seem to track uniformly with the “average number of serious vulnerabilities -- By Industry” in Figure 2. Specifically, industries with a greater average number of vulnerabilities generally have worse remediation rates. The opposite of course would also be true where a lower average number of vulnerabilities would lead to an increased remediation rate. As would be expected, it is easier to fix the bulk of an organization’s vulnerabilities if the starting point is a smaller, and potentially more manageable, number.
Another finding to highlight is the weak performance of the Insurance space, which seems to be contradictory to its marked reduction in Cross-Site Scripting vulnerabilities seen previously. One theory is that with development and security resources being as scarce as they are, insurance companies focused most of their energy dealing with Cross-Site Scripting and simply ignored the remaining issues. Depending upon different corporate environments and risk management approaches, this may have been the most appropriate strategy available.

WhiteHat Website Security Statistics Report | 10th Edition | Fall 2010 18
!"#!$#
%&#
&!#
'!#
"!#
!!#
%!#
(!#
$!#
)!#
*+,-.#/&0!11#+23#45.,#.67*48..9:#
6.3;<6#/=!1#>#&0!11#.67*48..9:#
96+**#/<7#?4#=!1#.67*48..9:#
!"#$%&#'(#)
#*+%,-.
'(%/#'
Figure 14. Average Remediation Rate Percentage Sorted by size of the Organization
As similarly witnessed in the “Average Number of Serious Vulnerabilities -- By Size or Organization” in Figure 3, the size of the organization does appear to play a role, albeit a small one, in remediation rates. Small organizations fix the most issues by percentage (62%), followed by medium (58%), and a nearby third is large (54%). As before, the delta between the high and the low is only 8%, making the size or the organization not the most challenging issue to overcome for improvement.
!"#
$"#
%"#
""#
&"#
'"#
("#
)"#
*+,-.#/!0"11#+23#45.,#.67*48..9:#
6.3;<6#/="1#>#!0"11#.67*48..9:#
96+**#/<7#?4#="1#.67*48..9:#
!"#$%&#'(#)
#*+%,-.
'(%/#'
0$&%.+1%,-.'2+1#'
@+2A;2-#
B3<C+D42#
E;2+2C;+*#F.,5;C.9#
G.+*?HC+,.#
I29<,+2C.#
IJ#
K5.,+**#
L.?+;*#
F4C;+*#M.?N4,A;2-#
J.*.C466<2;C+D429#
* Missing portions of data indicate that the volume of data collected was not large enough to include as a meaningful data sample.
Figure 15. Average Remediation Rate Percentage Sorted by Industry and Organization Size

WhiteHat Website Security Statistics Report | 10th Edition | Fall 2010 19
By comparing remediation rates against both organization size and industry segment, we get increased contextual visibility beyond combined overall averages. For example, the remediation rate of Telecommunications and Education remain largely flat regardless of organization size. Bank and Financial Services remediation rates fall sharply as size increases. Interestingly, sectors including IT, Retail, and Social Networking have an inflection point where remediation rates improve going from small to medium, but then fall noticeably from medium to large. The opposite is true for Healthcare.
It is difficult to pinpoint or even suggest the cause of such results, but likely multiple factors are at work. Organization size, industry regulations, experience of past breaches, established security polices, customer demand, and more are all factors that could influence the results. What we do know is that organizations continue to find it difficult to fix all, or nearly all, of their issues quickly. This is the area where most organizations get into trouble and the result can be a data breach. The mere existence of a single vulnerability is often not the cause of a breach. However, lack of responsiveness and a lack of a comprehensive approach to website security contribute to breaches.
Factors inhibiting organizations from remediating vulnerabilities:
• Nooneattheorganizationunderstandsorisresponsibleformaintainingthecode.
• Nooneattheorganizationknowsabout,understands,orrespectsthevulnerability.
• Featureenhancementsareprioritizedaheadofsecurityfixes.
• Lackofbudgettofixtheissues.
• Affectedcodeisownedbyanunresponsivethird-partyvendor.
• Websitewillbedecommissionedorreplaced“soon.”Tonote,wehaveexperienceddeprecated websites under the Sentinel Service still in active use for over two years.
• Riskofexploitationisaccepted.
• Solutionconflictswithbusinessusecase.
• Compliancedoesnotrequirefixingtheissue.
Conclusions and Recommendations
“How are we doing?”, or “Are we secure enough?” Those are the commonly asked questions by enterprises where our report began. To answer we must first understand that vulnerabilities don’t exploit themselves. It is an adversary who exploits a vulnerability in an asset thereby causing a technical or business impact. Next organizations must determine if they are a target of opportunity or choice. If a target of opportunity, perhaps being above average security posture compared to their respective industry peers is good enough. If a target of choice, being among the best is a better goal.
And since we know websites are under constant siege and code security is imperfect, three of the most important metrics to track are the number of serious and remotely exploitable vulnerabilities, the time-to-fix once identified, and remediation rate. Then by aligning an adversary’s capabilities and preferences against various security controls it becomes possible to measure the security posture of an organization against its tolerance for risk now and into the future. Perfectionisnotnecessarytoavoiddatabreach,noristhereaneedforfrustrationintheeventofavulnerabilitybeingexposed. What is necessary is visibility and the ability to respond quickly and effectively.
We’ve learned through the data within this report that organizations, regardless of size or industry, are quite capable of improving their application security program. They can drastically reduce the number vulnerabilities produced through their SDL, fix those that slip by faster and in larger quantities when motivated to do so. Unfortunately for many, the motivation comes as a result of compromise, but this doesn’t need to be the case. Other organizations are viewing the rise of security awareness from customers as a business driver and leveraging their program’s success as a differentiator. Especially when measured as described.
For those organizations that wish to start or improve their website security programs, who wish to prevent breach and data loss, here is the process WhiteHat Security recommends:

WhiteHat Website Security Statistics Report | 10th Edition | Fall 2010 20
1.Findyourwebsites(allofthem)
Identifying an organization’s complete Web presence is vital to a successful program. You can’t secure what you don’t know you own. Find out what websites there are, what they do, document the data they possess, who is responsible for them, and other helpful metadata.
2. Website Valuation & Prioritization
Each website provides different value to an organization. Some process highly sensitive data, others contain only marketing brochure-ware. Some websites facilitate thousands of credit card transactions each day, others generate advertising revenue. When resources are limited, prioritization must focus on those assets offering the best risk reducing return-on-investment consistent with business objectives.
3. Adversaries & Risk Tolerance
Not all adversaries, those attempting to compromise websites, have the same technical capability, motivation, or end-goal. Some adversaries are people, ranging from highly experienced to novice. Others adversaries are 100% automated are self propagating, such as worms and viruses. Their methods are different as is their target selection. Organizations must determine the type of adversaries they wish to thwart with the resources available:
Random Opportunistic: Attacks are automated, noisy, unauthenticated, and exploit well-known unpatched issues. Victims are chosen indiscriminately, targets of opportunity, through internet-wide scans and tend to impact those who are most vulnerable. Typical motivation is to infect Web pages with malware or subtle defacement.
Directed Opportunistic: A physical attackers, person behind a keyboard, armed with professional or open source scanning tools. They may register accounts, authenticate, and customize exploits for custom Web application flaws found easily by automation. They typically focus on targets of opportunity, specifically those with data that can be monetized and penetrable with a small amount effort (days). For example, the least secure online banks, e-commerce retailers, or hospitality organization.
Fully Targeted: Highly motivated attackers with professional, open source, and custom built tools. They may register accounts, authenticate, customize exploits for custom Web application vulnerabilities, and capitalize on business logic flaws. Their targets tend to be targets of choice may be defrauded, extorted, and be under attack from anywhere to a year or more.
4.Measureyourcurrentsecurityposture
Vulnerability assessments and penetration tests are designed to simulate the technical capabilities of a given type of adversary (step #3) and measure the success they would have. Finding as many vulnerabilities as possible is a by product of the exercise. Just as important as WHAT types of vulnerabilities are tested for is also HOW. The testing methodology must be meet or exceed the technical capabilities of the adversary that your organization would like to repel.
5. Remediation & Mitigation
From a risk management perspective it might be best to first fix a medium severity vulnerability on a main transactional website as opposed to a high severity issue in a non-critical system. Using the information obtain from steps 1 - 4 these decisions can be made with the confidence gained from the supporting data. Website vulnerabilities may be “fixed” with a application code change, virtual patch using a Web Application Firewalls, system configuration update, decommission the website, roll back the code, etc. All are possible option.

WhiteHat Website Security Statistics Report | 10th Edition | Fall 2010 21
Glossary–WebSecurityThreatClassificationv2.0(ClassesofAttack)11
Cross-SiteScripting12
Cross-siteScripting(XSS)isanattacktechniquethatinvolvesechoingattacker-suppliedcodeintoauser’sbrowserinstance. A browser instance can be a standard web browser client, or a browser object embedded in a software product such as the browser within WinAmp, an RSS reader, or an email client. The code itself is usually written in HTML/JavaScript,butmayalsoextendtoVBScript,ActiveX,Java,Flash,oranyotherbrowser-supportedtechnology.
Whenanattackergetsauser’sbrowsertoexecutehis/hercode,thecodewillrunwithinthesecuritycontext(orzone)ofthe hosting web site. With this level of privilege, the code has the ability to read, modify and transmit any sensitive data accessiblebythebrowser.ACross-siteScriptedusercouldhavehis/heraccounthijacked(cookietheft),theirbrowserredirected to another location, or possibly shown fraudulent content delivered by the web site they are visiting. Cross-site Scripting attacks essentially compromise the trust relationship between a user and the web site. Applications utilizing browser object instances which load content from the file system may execute code under the local machine zone allowing for system compromise.
InformationLeakage13
Information Leakage is an application weakness where an application reveals sensitive data, such as technical details of the web application, environment, or user-specific data. Sensitive data may be used by an attacker to exploit the target web application, its hosting network, or its users. Therefore, leakage of sensitive data should be limited or prevented whenever possible. Information Leakage, in its most common form, is the result of one or more of the following conditions:AfailuretoscruboutHTML/Scriptcommentscontainingsensitiveinformation,improperapplicationorserverconfigurations, or differences in page responses for valid versus invalid data.
ConentSpoofing14
Content Spoofing is an attack technique that allows an attacker to inject a malicious payload that is later misrepresented as legitimate content of a web application.
Cross-SiteRequestForgery15
Across-siterequestforgeryisanattackthatinvolvesforcingavictimtosendanHTTPrequesttoatargetdestinationwithout their knowledge or intent in order to perform an action as the victim. The underlying cause is application functionalityusingpredictableURL/formactionsinarepeatableway.ThenatureoftheattackisthatCSRFexploitsthetrustthatawebsitehasforauser.Bycontrast,cross-sitescripting(XSS)[9]exploitsthetrustthatauserhasforawebsite.LikeXSS,CSRFattacksarenotnecessarilycross-site,buttheycanbe.Cross-siterequestforgeryisalsoknownasCSRF,XSRF,one-clickattack,sessionriding,confuseddeputy,andseasurf.
Insufficient Authorization16
Insufficient Authorization results when an application does not perform adequate authorization checks to ensure that the user is performing a function or accessing data in a manner consistent with the security policy. Authorization procedures should enforce what a user, service or application is permitted to do. When a user is authenticated to a web site, it does not necessarily mean that the user should have full access to all content and functionality.
SQLInjection17
SQL Injection is an attack technique used to exploit applications that construct SQL statements from user-supplied input. When successful, the attacker is able to change the logic of SQL statements executed against the database.
Structured Query Language (SQL) is a specialized programming language for sending queries to databases. The SQL programming language is both an ANSI and an ISO standard, though many database products supporting SQL do so with proprietary extensions to the standard language. Applications often use user-supplied data to create SQL statements. If an application fails to properly construct SQL statements it is possible for an attacker to alter the statement structure and execute unplanned and potentially hostile commands. When such commands are executed, they do so under the context of the user specified by the application executing the statement. This capability allows attackers to gain control of all database resources accessible by that user, up to and including the ability to execute commands on the hosting system.

WhiteHat Website Security Statistics Report | 10th Edition | Fall 2010 22
PredictableResourceLocation(PRL)18
PredictableResourceLocationisanattacktechniqueusedtouncoverhiddenwebsitecontentandfunctionality.Bymaking educated guesses via brute forcing an attacker can guess file and directory names not intended for public viewing.Bruteforcingfilenamesiseasybecausefiles/pathsoftenhavecommonnamingconventionandresideinstandard locations. These can include temporary files, backup files, logs, administrative site sections, configuration files, demo applications, and sample files. These files may disclose sensitive information about the website, web application internals, database information, passwords, machine names, file paths to other sensitive areas, etc...
This will not only assist with identifying site surface which may lead to additional site vulnerabilities, but also may disclose valuableinformationtoanattackerabouttheenvironmentoritsusers.PredictableResourceLocationisalsoknownasForced Browsing, Forceful Browsing, File Enumeration, and Directory Enumeration.
Session Fixation19
Session Fixation is an attack technique that forces a user’s session ID to an explicit value. Depending on the functionality of the target web site, a number of techniques can be utilized to “fix” the session ID value. These techniques range from Cross-siteScriptingexploitstopepperingthewebsitewithpreviouslymadeHTTPrequests.Afterauser’ssessionIDhasbeen fixed, the attacker will wait for that user to login. Once the user does so, the attacker uses the predefined session ID value to assume the same online identity.
Brute Force20
A brute force attack is a method to determine an unknown value by usintg an automated process to try a large number of possible values. The attack takes advantage of the fact that the entropy of the values is smaller than perceived. For example, while an 8 character alphanumeric password can have 2.8 trillion possible values, many people will select their passwords from a much smaller subset consisting of common words and terms.
HTTPResponseSplitting21
TheessenceofHTTPResponseSplittingistheattacker’sabilitytosendasingleHTTPrequestthatforcesthewebservertoformanoutputstream,whichistheninterpretedbythetargetastwoHTTPresponsesinsteadofoneresponse,in the normal case. The first response may be partially controlled by the attacker, but this is less important. What is materialisthattheattackercompletelycontrolstheformofthesecondresponsefromtheHTTPstatuslinetothelastbyteoftheHTTPresponsebody.Oncethisispossible,theattackerrealizestheattackbysendingtworequeststhroughthe target. The first one invokes two responses from the web server, and the second request would typically be to some “innocent” resource on the web server. However, the second request would be matched, by the target, to the second HTTPresponse,whichisfullycontrolledbytheattacker.Theattacker,therefore,tricksthetargetintobelievingthataparticularresourceonthewebserver(designatedbythesecondrequest)istheserver’sHTTPresponse(servercontent),while it is in fact some data, which is forged by the attacker through the web server - this is the second response.
Abuse of Functionality22
Abuse of Functionality is an attack technique that uses a web site’s own features and functionality to attack itself or others. Abuse of Functionality can be described as the abuse of an application’s intended functionality to perform an undesirable outcome. These attacks have varied results such as consuming resources, circumventing access controls, or leaking information. The potential and level of abuse will vary from web site to web site and application to application. Abuseoffunctionalityattacksareoftenacombinationofotherattacktypesand/orutilizeotherattackvectors.
Insufficient Authentication23
Insufficient Authentication occurs when a web site permits an attacker to access sensitive content or functionality without having to properly authenticate. Web-based administration tools are a good example of web sites providing access to sensitive functionality. Depending on the specific online resource, these web applications should not be directly accessible without requiring the user to properly verify their identity.

WhiteHat Website Security Statistics Report | 10th Edition | Fall 2010 23
1 Facebook Clickjacking Attack Spreading Through Share Button http://www.informationweek.com/news/security/attacks/showArticle.jhtml?articleID=226700456&cid=iwhome_art_Attac_mostpop
2 Apache.org hit by targeted XSS attack, passwords compromised http://www.zdnet.com/blog/security/apacheorg-hit-by-targeted-xss-attack-passwords-compromised/6123
3 Wired.com Image Viewer Hacked to Create Phony Steve Jobs Health Story http://www.wired.com/epicenter/2009/01/wiredcom-imagev/
4 Altered Sears Web Site Offers Grill to ‘Cook Babies’ http://www.foxnews.com/story/0,2933,541221,00.html?test=latestnews
5 Customer information left exposed by insurance giant http://www.wave3.com/Global/story.asp?S=12793126
6 WASC Threat Classification – http://projects.webappsec.org/Threat-Classification
7 PCI Data Security Standard (PCI DSS) – https://www.pcisecuritystandards.org/security_standards/pci_dss.shtml
8 PCI Data Security Standard – https://www.pcisecuritystandards.org/
9 WhiteHat Sentinel Selection Guidelines – http://www.whitehatsec.com/home/services/selection.html
10 Achieving PCI Compliance with WhiteHat Sentinel – http://www.whitehatsec.com/home/services/pci.html
11 WASC Threat Classification v2.0 – http://projects.webappsec.org/Threat-Classification
12 Cross-Site Scripting – http://projects.webappsec.org/Cross-Site+Scripting
13 Information Leakage – http://projects.webappsec.org/Information-Leakage
14 Content Spoofing – http://projects.webappsec.org/Content-Spoofing
15 Cross-Site Request Forgery – http://projects.webappsec.org/Cross-Site-Request-Forgery
16 Insufficient Authorization – http://projects.webappsec.org/Insufficient-Authorization
17 SQL Injection – http://projects.webappsec.org/SQL-Injection
18 Predictable Resource Location – http://projects.webappsec.org/Predictable-Resource-Location
19 Session Fixation – http://projects.webappsec.org/Session-Fixation
20 Brute Force – http://projects.webappsec.org/Brute-Force
21 HTTP Response Splitting – http://projects.webappsec.org/HTTP-Response-Splitting
22 Abuse of Functionality – http://projects.webappsec.org/Abuse-of-Functionality
23 Insufficient Authentication – http://projects.webappsec.org/Insufficient-Authentication

WhiteHat Security, Inc. | 3003 Bunker Hill Lane | Santa Clara, CA 95054
408.343.8300 | www.whitehatsec.com Copyright © 2010 WhiteHat Security, Inc. | Product names or brands used in this publication are for identification purposes only and may be trademarks of their respective companies. 092010
About WhiteHat Security, Inc.Headquartered in Santa Clara, California, WhiteHat Security is the leading provider of website security solutions that protect critical data, ensure compliance and narrow the window of risk. WhiteHat Sentinel, the company’s flagship product family, is the most accurate, complete and cost-effective website vulnerability management solution available. It delivers the flexibility, simplicity and manageability that organizations need to take control of website security and prevent Web attacks. Furthermore, WhiteHat Sentinel enables automated mitigation of website vulnerabilities via integration with Web application firewalls. To learn more about WhiteHat Security, please visit our website at www.whitehatsec.com.
The WhiteHat Sentinel Service – Website Risk Management
WhiteHatSentinelisthemostaccurate,completeandcost-effectivewebsitevulnerabilitymanagementsolutionavailable.Itdeliverstheflexibility,simplicityand manageability that organizations need to take control of website security andpreventWebattacks.WhiteHatSentinelisbuiltonaSoftware-as-a-Service(SaaS)platformdesignedfromthegrounduptoscalemassively,supportthelargestenterprisesandofferthemostcompellingbusinessefficiencies,loweringyouroverallcostofownership.
Cost-effective Website Vulnerability Management – As organizations struggle to maintain a strong security posture with shrinking resources, WhiteHat Sentinel has become the solution of choice for total website security at any budget level. The entire Sentinel product family is subscription-based. So, no matter how often you run your application assessments, whether it’s once a week or once a month, your costs remain the same.
Accurate – WhiteHat Sentinel delivers the most accurate and customized website vulnerability information available– rated by both threat and severity ratings – via its unique assessment methodology. Built on the most comprehensive knowledgebase in Web application security, WhiteHat Sentinel verifies all vulnerabilities, virtually eliminating false positives. So, even with limited resources, the remediation process will be sped up by seeing only real, actionable vulnerabilities, saving both time and money, dramatically limiting exposure to attacks.
Timely – WhiteHat Sentinel was specifically designed to excel in rapidly-changing threat environments and dramatically narrow the window of risk by providing assessments on your schedule. Whether it’s a quarterly compliance audit, new product roll-out, or weekly business-as-usual site updates, WhiteHat Sentinel can begin assessing your websites at the touch of a button.
Complete–WhiteHAT Sentinel was built to scale to assess hundreds, even thousands of the largest and most complex websites simultaneously. This scalability of both the methodology and the technology enables WhiteHat to streamline the process of website security. WhiteHat Sentinel was built specifically to run in both QA/developmentandproductionenvironmentstoensuremaximumcoveragewithnoperformanceimpact.And,WhiteHatSentinelexceedsPCI6.6and11.3.2requirements for Web application scanning.
SimplifiedManagement–WhiteHat Sentinel is turnkey – no hardware or scanning software to install requiring time-intensive configuration and management. WhiteHat Sentinel provides a comprehensive assessment, plus prioritization recommendations based on threat and severity levels, to better arm security professionals with the knowledge needed to secure an organization’s data. WhiteHat Sentinel also providesaWebservicesAPItodirectlyintegrateSentinelvulnerabilitydatawithindustry-standardbugtrackingsystems,orSIMsorothersystemsallowingyouto work within your existing framework. With WhiteHat, you focus on the most important aspect of website security – fixing vulnerabilities and limiting risk.


![[Austria] ZigBee exploited](https://static.fdocuments.net/doc/165x107/587cfa411a28ab1e7e8b4ab5/austria-zigbee-exploited.jpg)


![WhiteHat Security Website Statistics [Full Report] (2013)](https://static.fdocuments.net/doc/165x107/545644dbaf79594d148b9404/whitehat-security-website-statistics-full-report-2013.jpg)