WHITE PAPER ON LAND, INFRASTRUCTURE AND TRANSPORT IN …
67
WHITE PAPER ON LAND, INFRASTRUCTURE AND TRANSPORT IN JAPAN, 2006 ( Outline ) Ministry of Land, Infrastructure and Transport
Transcript of WHITE PAPER ON LAND, INFRASTRUCTURE AND TRANSPORT IN …

WHITE PAPER ON LAND, INFRASTRUCTUREAND TRANSPORT IN JAPAN, 2006
(Outline)
Ministry of Land, Infrastructure and Transport

PREFACE
Our nation is at a historical turning point with its population decreased for the fi rst time in the post war era. The decrease is most likely to linger over medium to long term where aging of the community is also predicted. National concerns regarding the future of the regional area is developing on such circumstance.
It is our belief that the dynamism of the nation cannot be achieved without vitality in all the corners of each region in the nation. The nation’s growth would be kept uncertain unless maintaining and improving the dynamism of its regions in the future. Being in charge of administrative areas cohesively related to the regional areas such as land policies, social capital improvement, and transportation policies, MLIT is obligated to objectively analyze the conditions that the regional areas are currently facing, to identify their challenges, and to set the course of measures addressing those challenges without provoking any pointless anxiety about the future of the regional areas, and knowing that the planning of regions is supposed to be independently addressed by those respective regions in principle.
To perform this obligation, Part I of this White Paper comprises a subject “Development of MLIT’s Administration for the Dynamic Stride of Regions” where fundamental analyses are conducted regarding the circumstance that the regions are currently facing, and where challenges in conserving and improving the dynamism of the regions in the context of major social and economic shifts are summarized to present the development of the MLIT’s administration for regional revitalization.
Part II of this White Paper reports trends in the fi elds of MLIT’s administration, organized by their respective policy issues.

WHITE PAPER ON LAND, INFRASTRUCTURE AND TRANSPORT IN JAPAN, 2006 (Outline)Contents
Preface
Part I: Development of MLIT Administration for the Dynamic Stride of Regions
Chapter 1: Statuses the Regional Areas Are Facing …………………………………………………………………………2 [National consciousness against the regional areas] ……………………………………………………………3 [Essential contexts of the regional areas] ………………………………………………………………………5 [Future perspective of regional areas] ……………………………………………………………………… 10
Chapter 2: Future Challenges of Regional Areas in the Context of Social and Economic Structure Shifts …………… 13 [Autonomous development and social capital improvement of regional blocks] …………………………… 13 [City planning and community planning under the circumstance of defl ating population] ………………… 16 [Public transportations supporting regional dynamism] …………………………………………………… 19 [Population in charge of supporting vitality of regions under population decrease and graying] ………… 21 [New role of construction industry in regions] ……………………………………………………………… 23 [Tourism promotion for more interacting population] ……………………………………………………… 25 [Challenges of regions on the development of environment] ……………………………………………… 26
Chapter 3: Development of Measures Implemented by MLIT Aiming at Regional Revitalization …………………… 27 [Transformation to land structure enabling autonomous development of regional blocks] ………………… 28 [Comprehensive support for the autonomous regional planning within livelihood spheres] ……………… 29 [Promote tourism based country for more exchange of regional population] ……………………………… 31 [Development of condition for the regional revitalization] ………………………………………………… 32
Part II: Trends in MLIT Administration
Chapter 1: New MLIT Policies befi tting the Needs of the Times ……………………………………………………… 34Chapter 2: Realizing a Tourism-based Country of Beauty ……………………………………………………………… 37Chapter 3: Promoting Regional Revitalization and Urban Renaissance ………………………………………………… 39Chapter 4: Setting the Stage for an Independent and Vibrant Life ……………………………………………………… 42Chapter 5: Forging Open Economic Society with a Competitive Edge ………………………………………………… 46Chapter 6: Formulating Safe and Peaceful Society ……………………………………………………………………… 51Chapter 7: Creating and Conserving a Beautiful and Favorable Environment ………………………………………… 56Chapter 8: Promoting Formation of Vibrant and Diverse Regions ……………………………………………………… 61Chapter 9: International Partnership and Contribution for the Nation’s Sustainable Development …………………… 62Chapter 10: Technical R&D Supporting Public Life in Japan in the Future ……………………………………………… 63

Part I
Development of MLIT Administrationfor the Dynamic Stride of Regions

─ 2 ─
Chapter 1: Statuses the Regional Areas Are Facing
- Regions being at a turning point amid shifts of social and economic structures
Japan is at a historical turning point with its population peaked off, under which circumstances the way regional areas would be in the future is increasingly attracting attentions. The national awareness of the regional areas in the Opinion Poll on Social Awareness by the Cabinet Offi ce implemented in February 2007 shows the continuously increasing proportion of people answered “Regional Disparity” as the “area in which Japan is considered to have a trend for the worse” from 9.7% in the second last survey (implemented in February 2005) and 15.0% in the last survey (implemented in February 2006) to 26.5% that is the 8th most out of the 26 available options. On the other hand, the international comparison on per capita GDP, etc. implemented by the OECD (the Organization for Economic Cooperation and Development) found Japan as one of the countries with the least regional disparity among all the OECD countries.
[Chapter 1 Key Points]
As we evaluate the status of the regions, there exists a concern regarding the decreasing and aging population giving serious impacts on what the regions would be in the future, at the same time we can identify some trends including the long term narrowing of the regional disparity in per capita income of prefectural residents over the post war period. To maintain and improve the vital energy of the regional areas, it has been a vital challenge both to deal with such demographic changes and incorporate the economic globalization of the East Asian region as the economic globalization develops.
International Comparison of Regional Disparity in Per Capita GDP (Gini’s Coeffi cient)
0.00 0.05 0.10 0.15 0.20 0.25 0.30 0.35
SwedenJapanGreek
NetherlandsAustralia
FinlandFranceIreland
NorwayCzech Republic
DenmarkSpain
United StatesGermany
ItalyAverage of OECD Countries
AustriaCanada
PortugalHungary
South KoreaGreat Britain
BelgiumPoland
SlovakiaMexicoTurkey
Notes: 1) The coefficients shown are the data from the year 2001 (2000 for some of the countries.) 2) The figure used for Japan in this graph, derived using per capita gross product of respective prefectures, is different from the one used in P.8“Shifts in the Regional Disparity of Per Capita Income of the Prefectural Residents (Gini’s Coefficient) ”where per capita income of respective prefectures are used.Source: Regions at a Glance 2005 , OECD
0.060.090.09
0.100.110.11
0.120.120.12
0.130.130.130.13
0.140.14
0.150.150.150.15
0.170.180.18
0.210.23
0.270.32
0.19

─ 3 ─
Considering the foregoing, this chapter is going to perceive the actual state of the regional areas in Japan by consciousness surveys and basic data relating to the regional areas.
[National consciousness against the regional areas] A survey was conducted in December 2006 by the Ministry of Land, Infrastructure and Transport regarding national thoughts on the current status and the prospect of their areas of residence as well as on the regional disparity. The result of the survey found a small number of people answering “It has become worse than before” for the current status of the areas, whereas the survey revealed that relatively larger number of people in the towns and villages has anxiety about the future of such areas as graying of the community, intensifi ed Birthrate decrease, and population decrease. Also, a large proportion of the answers revealed sensible widening of regional disparity, in the areas including income level and employment situation being predominating aspects where such widening is indicated.
“How do you describe the current status of the area of your residence?” (N = 1,346)
14.814.8
17.317.3
16.816.8
16.916.9
64.464.4
59.559.5
60.760.7
60.360.3
14.8
17.3
16.8
16.9
64.4
59.5
60.7
60.3
14.8
17.5
16.9
6.0
5.8
6.1
5.9
16.5
0 20 40 60 80 100 (%)
Towns and villages
Other cities
The 16 major cities
Entire survey
It has become worse than before. It is the same as before.
It has become better than before. I do not know.
Source: Ministry of Land, Infrastructure and Transport Japan
“Are you anxious about the future of the area of your residence?” (N = 1,346)
10.710.710.7
4.8
3.0
31.531.5
25.125.1
22.322.3
25.125.1
28.928.9
30.430.4
34.534.5
31.231.2
10.710.7
11.711.7
13.713.7
12.112.1
31.5
25.1
22.3
25.1
15.4
26.7
23.8
24.7
28.9
30.4
34.5
31.2
10.7
11.7
13.7
12.1
2.7
1.3
2.7
1.8
5.1
0 20 40 60 80 100(%)
Towns and villages
Other cities
The 16 major cities
Entire survey
I am very much anxious about it. I am slightly anxious about it.
I cannot specify whether I am anxious or not. I am not so much anxious.
I am not anxious at all. I do not know.
Source: Ministry of Land, Infrastructure and Transport Japan

─ 4 ─
The Aspects Where the Anxiety about the Future of the Area of Residence Exists (Multiple selection;N = 1,346)
19.0
28.6
38.1
52.4
84.1
20.0
28.8
32.3
45.0
70.4
34.9
13.3
10.8
27.7
55.4
22.9
25.6
28.8
42.6
69.5
23.8
28.6
28.6
15.9
15.9
17.5
13.1
11.5
16.9
15.8
19.2
21.5
6.0
8.4
3.6
24.1
19.3
21.7
13.3
13.5
16.0
17.5
18.7
20.9
0.0
9.5
17.5
0.8
5.8
9.6
0.0
10.8
10.8
0.5
7.4
11.1
I do not know
Difficulties in management, maintenance, and upgrading of social infrastructure
The downfall of educational standard
The deterioration of medical/welfare system
The downscaling of public transportation
The decrease of employment opportunities
Deterioration of natural environment
The loosening of social ties within the community
The decline of the central district
Public security deterioration
Economic downfall
Population decrease
Intensified falling birthrate
Intensified graying of the community
0 10 20 30 40 50 60 70 80 90 (%)
Entire survey The 16 major cities Other cities Town and villages
Source: Ministry of Land, Infrastructure and Transport Japan
“Do you think the regional disparity is expanding in these days?” (N = 1,346)
Expanding
Slightly Expanding
I cannot specify whether it is expanding or not.
Slightly Narrowing
Narrowing
I do not know
Source: Ministry of Land, Infrastructure and Transport Japan
32.932.9
33.033.0
31.431.4
32.632.6
30.230.2
33.133.1
34.534.5
33.133.1
32.9
33.0
31.4
32.6
30.2
33.1
34.5
33.1
22.8
24.3
25.0
24.3
4.7
1.5
3.4
0.7
1.3
0.7
0.3
2.3
8.1
7.4
5.5
7.0
0 20 40 60 80 100
Towns and villages
Other cities
The 16 major cities
Entire survey
(%)
Aspects Where Widening of Regional Disparity is Considered to be Intensifi ed Recently (Multiple selection;N = 885)
0 10 20 30 40 50 60 70 80 (%)
I do not know
Public security
Information and communication environment
Habitational environment
Development of roads, etc.
Opportunities for cultural/entertainment activities
Educational standard
Convenience in shopping
Accessibility of public transportation
Medical/Welfare system standards
Employment situation
Income level
Source: Ministry of Land, Infrastructure and Transport Japan
Entire survey The 16 major cities Other cities Town and villages
0.0
9.6
13.8
10.6
18.1
27.7
19.1
29.8
40.4
39.4
58.5
69.1
1.6
9.6
13.0
15.1
14.1
23.0
25.7
25.4
43.7
60.5
68.0
2.8
12.5
11.1
14.8
15.3
18.5
17.6
27.3
40.7
39.8
62.0
64.4
1.7
10.3
12.7
14.6
14.8
22.4
23.1
26.3
35.9
42.3
60.7
67.2
33.4

─ 5 ─
[Essential contexts of the regional areas]○Demographic trends
(Japan’s population peaks off) The population of Japan had consistently increased over the postwar period, whereas its population growth rate had its peak in 1975 and started to decrease gradually thereafter. The population of Japan in the year 2005 increased by 840 thousand or 0.7% from the year 2000 to 127.77 million, thereby marked the record low in the population growth rate within the postwar period. The fi gure further revealed the peak-off of the population, decreased by 19 thousand compared to the population estimate of the preceding year. Demographic trend by prefectures shows population decreased since the previous Population Census in 32 prefectures most of which are in the provinces.
(Population shifts in the three metropolitan areas and the provinces) The shifts in population growth rate reveals the higher rate in the three metropolitan areas over the most of the postwar period than that of the provinces, which is the most prominent over two decades of the rapid economic growth period from1955. The breakdown of the population growth rate over the period into natural rate and social rate shows the increases in the social rate of the three metropolitan areas by rates between 1% to 1.5% per annum, whereas that of the provinces shows decreases by rates around 1%, refl ecting the demographic shifts including relocation for employments.
Shifts in Population Growth Rate and Population of Japan
-0.5
0.0
0.5
1.0
1.5
2.0
1950 1955 1960 1965 1970 1975 1980 1985 1990 1995 2000 2005 (Year)
Population growth rate (%)
40
60
80
100
120
140
Population (millions)
Population growth rate Population
Notes: 1) The data exclude Okinawa prefecture before 1972. 2) The population growth rates for the years 1972 and 1973 are shown in broken line due to the considerable impact of the reversion of Okinawa to Japan.Source: Japan Statistical Yearbooks, Ministry of Internal Affairs and Communications
Shifts in Population and Population Growth Rate in the Three Metropolitan Areas and the provinces
Notes: 1) The data exclude Okinawa prefecture before 1972. 2) The population growth rates for the years 1972 and 1973 are not described due to the considerable impact of the reversion of Okinawa to JapanSources: Population Estimates, Ministry of Internal Affairs and Communications (The populations for the intercensal periods are the estimated populations after intercensal adjustments)
-1.0
0.0
1.0
2.0
3.0
4.0
1950 1955 1960 1965 1970 1975 1980 1985 1990 1995 2000 2005
Population growth rate (%)
(Year)
in the three Metropolitan Areas
in the Provinces
1950 1955 1960 1965 1970 1975 1980 1985 1990 1995 2000 2005
30
20
10
0
40
50
60
70
Population (millions)
in the three Metropolitan Areas
in the Provinces
(Year)
─ 6 ─
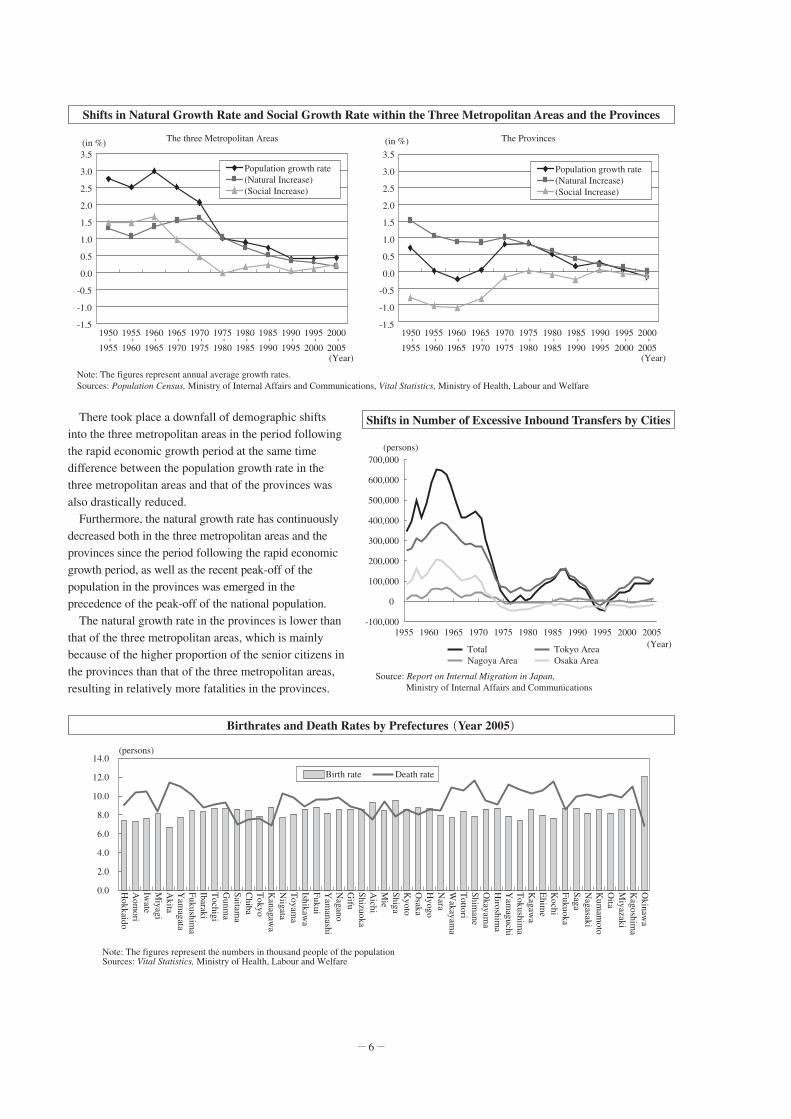
There took place a downfall of demographic shifts into the three metropolitan areas in the period following the rapid economic growth period at the same time difference between the population growth rate in the three metropolitan areas and that of the provinces was also drastically reduced. Furthermore, the natural growth rate has continuously decreased both in the three metropolitan areas and the provinces since the period following the rapid economic growth period, as well as the recent peak-off of the population in the provinces was emerged in the precedence of the peak-off of the national population. The natural growth rate in the provinces is lower than that of the three metropolitan areas, which is mainly because of the higher proportion of the senior citizens in the provinces than that of the three metropolitan areas, resulting in relatively more fatalities in the provinces.
Shifts in Natural Growth Rate and Social Growth Rate within the Three Metropolitan Areas and the Provinces
The three Metropolitan Areas
-1.5
-1.0
-0.5
0.0
0.5
1.0
1.5
2.0
2.5
3.0
3.5
-1.5
-1.0
-0.5
0.0
0.5
1.0
1.5
2.0
2.5
3.0
3.5
1950
-
1955
1955
-
1960
1960
-
1965
1965
-
1970
1970
-
1975
1975
-
1980
1980
-
1985
1985
-
1990
1990
-
1995
1995
-
2000
2000-
2005(Year)
(in %)
Population growth rate (Natural Increase) (Social Increase)
1950
-
1955
1955
-
1960
1960
-
1965
1965
-
1970
1970
-
1975
1975
-
1980
1980
-
1985
1985
-
1990
1990
-
1995
1995
-
2000
2000
-
2005(Year)
The Provinces(in %)
Note: The figures represent annual average growth rates.Sources: Population Census, Ministry of Internal Affairs and Communications, Vital Statistics, Ministry of Health, Labour and Welfare
Population growth rate (Natural Increase) (Social Increase)
Birthrates and Death Rates by Prefectures (Year 2005)
(persons)14.0
12.0
10.0
8.0
6.0
4.0
2.0
0.0 Hokkaido
Aom
oriIw
ateM
iyagiA
kitaY
amagata
Fukushima
IbarakiT
ochigiG
unma
Saitama
Chiba
Tokyo
Kanagaw
aN
iigataT
oyama
Ishikawa
FukuiY
amanashi
Nagano
Gifu
ShizuokaA
ichiM
ieShigaK
yotoO
sakaH
yogoN
araW
akayama
Tottori
Shimane
Okayam
aH
iroshima
Yam
aguchiT
okushima
Kagaw
aE
hime
Kochi
FukuokaSagaN
agasakiK
umam
otoO
itaM
iyazakiK
agoshima
Okinaw
a
Note: The figures represent the numbers in thousand people of the populationSources: Vital Statistics, Ministry of Health, Labour and Welfare
Birth rate Death rate
Shifts in Number of Excessive Inbound Transfers by Cities
-100,000
0
100,000
200,000
300,000
400,000
500,000
600,000
700,000
1955 1960 1965 1970 1975 1980 1985 1990 1995 2000 2005(Year)
(persons)
Total Tokyo AreaNagoya Area Osaka Area
Source: Report on Internal Migration in Japan, Ministry of Internal Affairs and Communications

─ 7 ─
(Trends of the population in the three metropolitan areas and the provinces) The outfl owing population had been the sole trend of the area around the special wards of Tokyo, due to the population sprawl developed around the three metropolitan areas over two decades from 1965. However, the excessive population is funneling into the special words of Tokyo, the City of Nagoya, and Osaka City in the recent context of skyrocketing number of condominium supply in the areas due to the decline in land prices, which can be construed as the developing centripetal movements within the three metropolitan areas. On the other hand, there was observed a situation where the centripetal force of the cities with centric functions in the regional blocks has been intensifi ed in the provinces.
Shifts in Number of Excessive Inbound/Outbound Transfers to/from the Special Wards of Tokyo, City of
Nagoya, and City of Osaka
23 wards in Tokyo
-200,000
-150,000
-100,000
-50,000
0
50,000
100,000
150,000
200,000
1960 1965 1970 1975 1980 1985 1990 1995 2000 2005(Year)
(persons)
City of Nagoya
-30,000
-20,000
-10,000
0
10,000
20,000
30,000
40,000
50,000
1960 1965 1970 1975 1980 1985 1990 1995 2000 2005(Year)
(persons) City of Osaka
-100,000
-50,000
0
50,000
100,000
1960 1965 1970 1975 1980 1985 1990 1995 2000 2005(Year)
(persons)
Source: Report on Internal Migration in Japan, the Ministry of Internal Affairs and Communications
Shifts in Proportion of Prefectural Populations in the Respective Regional Block Populations
0
5
10
15
20
25
30
35
40
1950 1955 1960 1965 1970 1975 1980 1985 1990 1995 2000 2005
(Year)
(in %)
Miyagi Prefecture Hiroshima Prefecture Fukuoka Prefecture
Source: Population Census, Ministry of Internal Affairs and Communications

─ 8 ─
○Income and employment situations
(Situation of Prefectural Residents’Income) The regional disparity in per capita income of the prefectural residents derived using the Gini’s coeffi cient shows a relatively higher level of disparity until early 1970s, which is considered to be the cause of the migration from the provinces to the three metropolitan areas. The Gini’s coeffi cient experienced a downfall in the following period due to the income augmentation resulted from the industrial structure change in the provinces. The coeffi cient, having decreased again after a soar in the bubble economy period, was found increased again to 0.079 in the year 2004, compared to 0.070 in the year 2001.
(Employment Situation in Regions) The shifts in jobs-to-applicants ratios by regional blocks of the period after mid 1970s show relatively higher ratios in some blocks, or relatively lower ratios in the other blocks. Among the recent jobs-to-applicants ratios showing upward trend in all the regional blocks refl ecting the ongoing economic recovery, improvement in the employment situation is relatively less active in the regional blocks of Hokkaido, Tohoku, and Kyushu.
Shifts in the Regional Disparity of Per Capita Income of the Prefectural Residents (Gini’s Coeffi cient)
0.06
0.07
0.08
0.09
0.10
0.11
0.12
0.13
0.14
1955 1960 1965 1970 1975 1980 1985 1990 1995 2000(Fiscal Year)
Notes: 1) The figures used in this graph, derived using per capita income of respective prefectures, are different from the one used in P.2“International Comparison of Regional Disparity in Per Capita GDP (Gini Coefficient) ”where per capita gross income of respective prefectures are used. 2) Calculated based on Prefectural Accounts, Cabinet Office, Government of Japan, as well as Population Census, and Annual Report on Current Population Estimates, Ministry of Internal Affairs and Communications. 3) The income figures of the prefectural residents are calculated based on the 68SNA for the years before 1989, and 93SNA thereafter.Source: the Ministry of Land, Infrastructure and Transport Japan
Regional D
isparity
Narrower
Wider
2004
Shifts in Job-to-applicants Ratios by Regional Blocks
1 : 0.0
1 : 0.5
1 : 1.0
1 : 1.5
1 : 2.0
1 : 2.5
1975 1976 1977 1978 1979 1980 1981 1982 1983 1984 1985 1986 1987 1988 1989 1990 1991 1992 1993 1994 1995 1996 1997 1998 1999 2000 2001 2002 2003 2004 2005 2006
(Year)
(Ratio)
National AverageHokuriku
HokkaidoTokai
TohokuKinki
Southern KantoChugoku
Northern Kanto /KoshinShikoku Kyushu
Sources: Statistics of Employment Security Operations, Ministry of Health, Labour and Welfare

─ 9 ─
○Situations regarding industrial structure and manufacturing location
(Industrial structures in regions) The industrial compositions of the employees by regional blocks in year 2005 show regional characteristics; the proportion of employees in the primary industry are relatively more in Tohoku and Shikoku regions;Northern Kanto/Koshin, Hokuriku, and Tokai regions have outstanding employee proportions of more than 30% in secondary industry;Over 70% of employees in Hokkaido and Southern Kanto regions are in tertiary industry.
(Return of the factories to domestic locations) Since 1990s, there had been an intensifying tendency in Japan to relocate production bases to locations abroad including Southeast Asia and China, especially in the manufacturing industry. Having infl uenced by the tendency to some extent, the number of newly constructed factories in Japan had been constantly decreasing since 1989. However, the recent years saw an identifi ed phenomenon of those factories returning to their homeland of Japan, due to the increasing awareness of advantages with domestic locations, such as home demand expansion, outfl ow prevention of technologies/know-how to foreign countries. According to the survey on the trend of new factory constructions conducted by the Ministry of Economy, Trade and Industry (METI), the number of newly constructed factory locations became a record-low of 844 in 2002, and has consistently increased since 2003, to 1,544 in the year 2005.
(Number of Newly Constructed Factories by Regions) Recent increments in the number of newly constructed factories can be observed in all the regional blocks comparing the numbers in the year 2002 and that of the year 2005. Particularly, the numbers of Northern Kanto/Koshin, Tokai, and Kinki in the year 2005 shows more than twice as much as the year 2002. On the other hand, the comparison of the proportions in the numbers of the newly constructed factories between the three metropolitan areas and regional districts area reveals a recent trend of slightly more proportional increment in the three metropolitan areas, considering from the fact that the shares in the three metropolitan areas and the provinces remained at 2:8 ratio until year 1998 have changed to 3:7 ratio in 2005, due mainly to the more growth of the number in the three metropolitan areas.
Composition of Employees by Regional Blocks (2005)
4.94.9
7.97.9
10.410.4
1.61.6
8.28.2
5.75.7
3.83.8
2.32.3
6.56.5
9.79.7
8.18.1
26.626.6
19.419.4
26.626.6
23.023.0
31.731.7
32.132.1
34.834.8
27.327.3
27.627.6
24.924.9
21.821.8
4.9
7.9
10.4
1.6
8.2
5.7
3.8
2.3
6.5
9.7
8.1
26.6
19.4
26.6
23.0
31.7
32.1
34.8
27.3
27.6
24.9
21.8
68.5
72.7
63.0
75.5
60.1
62.2
61.5
70.4
65.9
65.4
70.1
0% 10% 20% 30% 40% 50% 60% 70% 80% 90% 100%
Whole Country
Hokkaido
Tohoku
Southern Kanto
Northern Kanto/Koshin
Hokuriku
Tokai
Kinki
Chugoku
Shikoku
Kyushu
Primary Industry Secondary Industry Tertiary IndustrySources: Population Census 2005, Ministry of Internal Affairs and Communications
Shifts in Numbers of Constructed Factories
3,328,3283,1433,143
2,7502,750
2,0252,025
1,2831,283 1,1611,161 1,0401,0401,2281,228 1,2051,205
911911 753753 876876 837837629629 745745
916916 1,0731,073
819819
632632
734734
439439
341341289289
261261
318318 308308
246246216216
250250 286286
215215307307
386386471471
3,3283,143
2,750
2,025
1,283 1,161 1,0401,228 1,205
911 753 876 837629 745
916 1,073
819
632
734
439
341289
261
318 308
246216
250 286
215307
386471
0
500
1,000
1,500
2,000
2,500
3,000
3,500
4,000
4,500
1989 1990 1991 1992 1993 1994 1995 1996 1997 1998 1999 2000 2001 2002 2003 2004 2005(year)
(Number of Factories)
ProvincesThree Metropolitan Areas
Source: Survey of Factory Location Trends, Ministry of Economy, Trade and Industry

─ 10 ─
[Future perspective of regional areas] The population of Japan, having already made its peak, is expected to have more intensifi ed population diminution and graying in the future, which will profoundly affect the regional areas. The existence of East Asia with rapidly growing economy has become increasingly important in deliberate upon the way the Japanese regional economy should be amid the ongoing economic globalization.
(Demographic trends of Japan in the future) The national population of Japan is considered to have made its peak with 127.84 million as at December 2004. Estimate by the National Institute of Population and Social Security Research predicts that the population would be fewer than 100 million in 2046, declined to 99.38 million, and would be further declined to 89.93 million in 2055. Estimation by age groups predicts that the production age population (population of the age group from 15 to 64 which was 84.09 million in the Population Census 2005) would be less than 80 million in 2012, and would be continuously reduced to 45.95 million in 2055. Meanwhile, the population of senior citizens (age 65 or older) which was 25.67 million in 2005 would continue to increase and record its peak at 38.63 million in 2042. The proportion of the senior citizens would be 25.2% or more than one out of four people in 2013, and 33.7% or more than one out of three people in the year 2035, and then would be 40.5% in 2055.
Population Estimate of Japan in the Future
127.77 65.8%
0
20
40
60
80
100
120
140Population (millions)
Sources: Population Census 2005, Ministry of Internal Affairs and Communications, Future Population of Japan, National Institute of Population and Social Security Research, 2006
17.5217.5217.52
84.0984.0984.09
25.67
Proportion of the productive age population (ages 15 to 64)
Graying rate (Proportion of age 65 or older)
Population of age 14 or younger
51.1%
40.5%
20.1%
2005 2010 2015 2020 2025 2030 2035 2040 2045 2050 2055(Year)
0
10
20
30
40
50
60
70 (in %)
Population of age 15 to 64
Population of age 65 or older
89.93
36.46
45.9545.9545.95
7.527.527.52
Shifts in Numbers of Newly Constructed Factories by Regional Blocks
(Number of Factories)2002 2003 2004 2005
Hokkaido 35 46 51 57Tohoku 112 133 156 171
Southern Kanto 78 81 98 139Northern Kanto/Koshin 119 158 226 238
Hokuriku 74 84 94 139Tokai 109 158 210 248Kinki 105 159 194 210
Chugoku 54 50 52 99Shikoku 37 45 50 40Kyushu 121 138 171 203
Total (Nationwide) 844 1,052 1,302 1,544Source: Survey of Factory Location Trends, Ministry of Economy, Trade and
Industry
Shifts in Shares of Three Metropolitan Areas and the Provinces in Numbers of Newly Constructed Factories
0
10
20
30
40
50
60
70
80
90
100(in %)
80.3 83.378.9
82.2 79.0 80.1 79.9 79.4 79.6 78.7 77.7 77.874.5 74.5 70.8 70.4 69.5
19.7 16.721.1 17.8
21.0 19.9 20.1 20.6 20.4 21.3 22.3 22.225.5 25.5
29.2 29.6 30.5
1989 1990 1991 1992 1993 1994 1995 1996 1997 1998 1999 2000 2001 2002 2003 2004 2005
Proportion of the Provinces
Proportion of the three metropolitan areas
Source: Survey of Factory Location Trends, Ministry of Economy, Trade and Industry
(year)
─ 11 ─
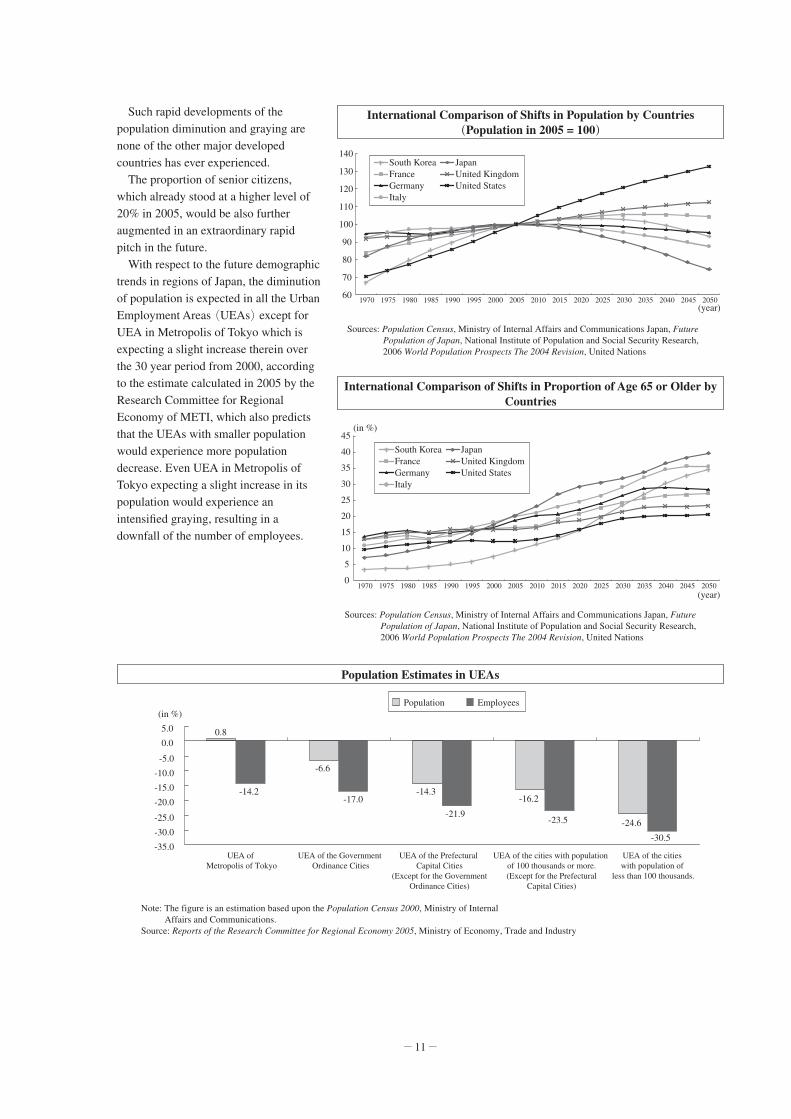
Such rapid developments of the population diminution and graying are none of the other major developed countries has ever experienced. The proportion of senior citizens, which already stood at a higher level of 20% in 2005, would be also further augmented in an extraordinary rapid pitch in the future. With respect to the future demographic trends in regions of Japan, the diminution of population is expected in all the Urban Employment Areas (UEAs) except for UEA in Metropolis of Tokyo which is expecting a slight increase therein over the 30 year period from 2000, according to the estimate calculated in 2005 by the Research Committee for Regional Economy of METI, which also predicts that the UEAs with smaller population would experience more population decrease. Even UEA in Metropolis of Tokyo expecting a slight increase in its population would experience an intensifi ed graying, resulting in a downfall of the number of employees.
Population Estimates in UEAs
-35.0
-30.0
-25.0
-20.0
-15.0
-10.0
-5.0
0.0
5.0
UEA of Metropolis of Tokyo
UEA of the Government Ordinance Cities
UEA of the Prefectural Capital Cities
(Except for the Government Ordinance Cities)
UEA of the cities with population of 100 thousands or more.
(Except for the Prefectural Capital Cities)
UEA of the cities with population of
less than 100 thousands.
(in %)Population Employees
Note: The figure is an estimation based upon the Population Census 2000, Ministry of Internal Affairs and Communications.
Source: Reports of the Research Committee for Regional Economy 2005, Ministry of Economy, Trade and Industry
0.8
-6.6
-14.3-16.2
-24.6
-14.2-17.0
-21.9-23.5
-30.5
International Comparison of Shifts in Population by Countries (Population in 2005 = 100)
60
70
80
90
100
110
120
130
140
1970 1975 1980 1985 1990 1995 2000 2005 2010 2015 2020 2025 2030 2035 2040 2045 2050 (year)
Sources: Population Census, Ministry of Internal Affairs and Communications Japan, Future Population of Japan, National Institute of Population and Social Security Research, 2006 World Population Prospects The 2004 Revision, United Nations
South KoreaFranceGermanyItaly
JapanUnited KingdomUnited States
International Comparison of Shifts in Proportion of Age 65 or Older by Countries
0
5
10
15
20
25
30
35
40
45(in %)
1970 1975 1980 1985 1990 1995 2000 2005 2010 2015 2020 2025 2030 2035 2040 2045 2050(year)
Sources: Population Census, Ministry of Internal Affairs and Communications Japan, Future Population of Japan, National Institute of Population and Social Security Research, 2006 World Population Prospects The 2004 Revision, United Nations
South KoreaFranceGermanyItaly
JapanUnited KingdomUnited States

─ 12 ─
(Growing East Asia) In the ongoing economic globalization, the existence of East Asia with rapidly growing economy has become as important as the demographic trends in deliberating upon the way of the Japanese regional economy. East Asia has maintained its high economic growth, and its nominal GDP comprises 10% share as at 2005 in the world. In the context of its high economic growth, the economic relationship between Japan and East Asia has been continuously developed as shown in its proportions in the total imports and exports of Japan amounting to 47.4% and 43.6% respectively in the year 2005.
(Shifts in social and economic structures) As explained above, Japan is currently facing such shifts in the demographic structure as development of population diminution and graying, as well as a shift in the international economic environment, namely the rapid economic growth in East Asia amid the ongoing economic globalization, both of which have tremendous effects on the way the regional areas of Japan would be. Being in the middle of such conditions, how to maintain and improve the dynamism in the regional areas of Japan is a vital challenge for the administration of MLIT.
Shifts in Nominal GDPs of Countries and Regions and Its Composition
China307.62.6%
NIEs3134.91.1% ASEAN
232.52.0%
Japan1,059.59.0%
NAFTA3,264.127.8%
EU3,691.731.4%
Others3,051.526.0%
East Asia Region675.05.7%
Year 1980
Note: NIEs3 is comprised of South Korea, Taiwan (the Republic of China), and Hong Kong.Source: World Economic Outlook Database, September 2006, IMF
Top line: Country/Region NameMiddle line: Nominal GDP (in billion US$)Bottom line: Share (%)
Others7,599.817.1%
EU13,502.830.4%
NAFTA14,356.732.3%
Japan4,567.410.3%
ASEAN882.52.0%
NIEs31,311.43.0%
China2,234.15.0%
East Asia Region4,428.010.0%
Year 2005
Shifts in Imports and Exports of Japan by Regions
Exports
1980 1990 2000 2005 (Year)
(in billion JPY)
Note: NIEs3 is comprised of South Korea, Taiwan (the Republic of China), and Hong Kong.Source: Foreign Trade Statistics, Ministry of Finance Japan
East A
sia Region
47.4%
70,000
60,000
50,000
40,000
30,000
20,000
10,000
0
Imports
1980 1990 2000 2005 (Year)
(in billion JPY)
East A
sia Region
43.6%
60,000
50,000
40,000
30,000
20,000
10,000
0
China NIEs3 ASEAN US others
3.93.9%11.811.8%10.410.4%24.224.2%
49.749.7%
13.513.5%6.36.3%2.12.1%
19.619.6%16.016.0%
21.221.2%31.531.5%
29.729.7%
22.522.5%
30.130.1%
30.130.1%
38.838.8%
3.9%11.8%10.4%24.2%
49.7%
13.5%6.3%2.1%
19.6%16.0%
21.2%
12.7%
11.6%
14.3%31.5%
29.7%
22.5%
30.1%
30.1%
38.8%
3.13.1% 5.15.1%14.514.5%
21.021.0%
8.58.5%
10.510.5%
4.24.2% 9.69.6%
12.412.4%
19.019.0%
22.422.4%17.417.4%
40.340.3%
50.250.2%57.957.9%
43.943.9%
3.1% 5.1%14.5%
21.0%
8.5%
10.5%
4.2% 9.6%
14.1%
15.7%
12.7%17.5%
12.4%
19.0%
22.4%17.4%
40.3%
50.2%57.9%
43.9%

─ 13 ─
Chapter 2: Future Challenges of Regional Areas in the Context of Social and Economic Structure Shifts
The regional areas of Japan are now facing major social and economic shifts such as the economic soar of East Asia as well as the developing population diminution, graying, and economic globalization. As we take those into consideration, two perceptions should be of great importance in deliberating upon how to maintain and improve the dynamism of the regional areas. One of those perceptions is the perception for the establishment of economic foundation which enables the regional area to thrive autonomously. To realize that, a strategic response in the respective regional blocks as units is indispensable as they have an economic scale equivalent to that of European state as shown in the fi gure on the right, as well as developing their own direct relationships with other countries including East Asian communities. The other is the perception to ensure and to improve the livelihood of the residents on the assumption of population decrease as well as on the foundation of aforesaid economic independence of the respective regional blocks. In order for the perception to be realized, it is necessary at the range of livelihood with a variety of regionality based on their own culture, tradition, and natural conditions to ensure the prosperity resulting from the convenience of life and the interaction among the residents.
[Autonomous development and social capital improvement of regional blocks](Economic globalization and regional areas)
Economic growth is a prerequisite for the dynamism of Japanese nation to be maintained under the circumstance where the population diminution, birthrate decline and graying are all intensifying, and therefore the value added production activities such as forefront industry must be maintained domestically. On the other hand, the regional areas are subjected to a challenging foreign competition where the businesses opt for the best production base location out of the options available worldwide as a result of the developing economic globalization. Such condition makes it also important for the competing regional blocks to reinforce the direct interaction and coalition with fast growing East Asia in order for those regional areas to implement autonomous development.
[Chapter 2 Key Points]
To preserve and improve the dynamism within the regional areas, ingestion of the growth in external communities including East Asia is indispensable for the respective regional blocks whereby the quality of residents' livelihood can be ensured and improved in their own milieux under the condition that the population diminution is the emerging trend, while establishing an economic foundation which enables self sustaining development.
GDP of Regional Blocks in Japan and European Countries
CountryGDP in 2003
(in nominal US$) CountryGDP in 2003
(in nominal US$)Japan 42,426 Norway 2,206
Germany 24,435 Denmark 2,111United Kingdom 18,076 Poland 2,095
France 17,892 Greek 1,733Tokyo Metropolitan Area 15,818 Hokkaido 1,682
Italy 14,683 Finland 1,618Spain 8,815 Ireland 1,521
Kinki Area 6,807 Portugal 1,472Chubu Area 6,180 Shikoku Area 1,155Netherlands 5,128 Hokuriku Area 1,062Kyushu Area 3,751 Czech Republic 906Tohoku Area 3,574 Hungary 821Switzerland 3,218 Okinawa 280
Belgium 3,047 Luxembourg 271Sweden 3,016 Bulgaria 199Austria 2,552 Iceland 104
Chugoku Area 2,427Note: “Regional Blocks” refer to the Regional Plan Districts as stipulated in the National Spatial Planning
Act. Source: Ministry of Land, Infrastructure and Transport Japan

─ 14 ─
(Relationships with East Asian region) Securing of international competitiveness in siting of industries and ingestion of the growth and drive from overseas including East Asia region requires our nation to establish general transportation network directly connecting the regional blocks and East Asia regions in order to ensure smooth logistics and passenger traffi c while maintaining the international base position for transit between East Asia region and the other global regions.
The volume of logistics between our nation and East Asia region has been soaring in recent years as evidenced by the 138.92 million tons of port freight exports from Japan to East Asia in 2004 (3.2 times as much as 1980), taking up 56% of total port freight exports from Japan to overseas. Feature of the logistic of east Asia region and Japan is that transport is done in bulk and frequently over distances similar to those of the logistics within Japan. Consequently, the logistics between our nation and East Asia calls for the swiftness and affordability at the domestic logistics level, and furthermore, promotion to develop the “Next-day Freight Service Area” that enables the freight to be delivered within the following day via express marine transport is on the agenda.
Shifts in Export and Import Tonnages of Port Freight by Regions
Notes: 1) Transaction volumes of the class “Koh” ports as stipulated in the Rules on the Port Investigation(172 Ports)2) NIEs3 is comprised of South Korea, Taiwan (the Republic of China), and Hong Kong.
Source: Port and Harbour Statistics, Ministry of Land, Infrastructure and Transport Japan
ImportsExports
0
50,000
100,000
150,000
200,000
250,000
300,000(in Thousand Tons)
1980 1990 2000 2004 (year)
East A
sia Region
55.9%
0
(in Thousand Tons)
200,000
400,000
600,000
800,000
1,000,000
1,200,000
East A
sia Region
30.3%
China NIEs3 ASEAN Others
5.2%5.2%11.4%11.4%
71.7%71.7%
63.5%63.5%
20.1%20.1%
3.1%3.1%9.2%9.2%
24.4%24.4%
52.4%52.4%
44.1%44.1%
26.8%26.8%
15.2%15.2%5.2%11.4%11.7%
71.7%
63.5%
13.3%
20.1%
3.1%9.2%
24.4%
14.0%
52.4%
44.1%
13.9%
26.8%
15.2%1.71.716.216.21.71.716.216.2
2.3%2.3%1.7%1.7% 3.6%3.6%
75.0%75.0%
4.0%4.0%
72.0%72.0%
5.8%5.8%6.9%6.9% 9.1%9.1%
5.4%5.4%
69.7%69.7%
2.3%1.7%16.2%
79.9%79.9%79.9%
3.6%17.5%
75.0%
4.0%
72.0%
15.3%
5.8%6.9% 9.1%
5.4%
15.8%
69.7%
2004 (Year)1980 1990 2000
Logistics within East Asia Region Becomes “bulk and frequency”
Ulsan 24
Pyeongtaek 4Inchon 12
Kunsan 3
Masan 15
Gwangyang 24
Yingkou 3
Dalian 24Qinhuangdao 3
Tianjin Newport 13
Longkou 4Yantai 10
Weihai 5
Shidao 5Qingdao 24Rizhao 2
Lianyungang 8Nantong 4
Shanghai 36Zhangjiagang 4Nanjing 4
Ningbo 21
Fuzhou 5Quanzhou 3
Xiamen 13
Shantou 1Hong Kong 24
Shenzhen 17Guangzhou 10
Fangcheng 3
Jilong 25Taichung 16
Gaoxiong 25
Busan 58Busan 58Busan 58
Japan: 61 Ports
South Korea: 7 Ports
Taiwan: 3 Ports
China: 24 Ports
Figures in this map represent the numbers of Japanese ports with which the port is connected by regular cargo transporter services. [as at December 2006]

─ 15 ─
The passenger traffi c between our nation and East Asia has also gained drive in late years from the sources including business demand and expansion of the tourism interaction, resulting in a 70% increase in the number of Japanese outbound passengers to East Asia over the period from 1991 to 2005.As the passenger traffi c increases its density, locations in Japan and East Asia call for the coverage expansion of the “East Asia One Day Area” where a certain amount of task can be completed at the destination on the departure date, and the development promotion of the “Day Trip Business Area” where passengers may even make the business excursion a day trip after completing the assignment.
(Roles and Challenges of Ports and Airports) Improvements in the functionalities of ports and airports handling those augmenting logistics and passenger traffi c is of great importance in ensuring the global competitiveness at the same time internalizing the uplifting pep overseas such as that of East Asia. Having issues including expensive costs and longer lead time, ports need reinforcement of the logistics functions and further improvement in the service to keep up with the increasing inbound/outbound freight from China. On the other hand, airports have been stymied in getting on a par with increasing international demand as well as in the development of national airway network by the issues such as capacity limits of central airports in the metropolitan city areas. Coping with those issues entails the network to enable effortless logistics and passenger traffi c to address globalization and reinforcement of ties with East Asia region by upgrading the ports and airports in their structural and non-structural aspects including improvement in the function and accessibilities of international hub ports as well as in the function of central airports in the metropolitan areas.
Reinforcement of Relationship with East Asia Region
Number of Visitors from East Asia*1 Soars
Shifts in Number of Foreign Tourists Visiting Japan
012
3456
78
(in million people)
2.032.03
4.434.43
2.03
4.43
3.53 Million
6.73 Million
About 90% Increase
About 120% Increase
1991 2005
Source: Statistics on tourism for Japan, JNTO
No Nationality
Oceania
South America
North America
Africa
Europe
Other Asian Countries
East Asia
(Year)
Number of Japanese Tourists Visiting East Asia*2, Particularly for Sightseeing and Business, Also Soars
Shifts in Number of Japanese Tourists Visiting East Asia Region by Air Route
0
2
4
6
8
10(in million people)
5.04 Million
1.991.99
5.185.18
0.70.7
3.713.71
0.630.63
0.7
3.71
0.63
1991
About 180% Increase
1.99
5.18
1.43
8.6 Million
2004
Source: Demographic Survey of International Air Travel, Ministry of Land, Infrastructure and Transportation Japan
Notes: *1, *3)“East Asia”refers to China, South Korea, Taiwan(theRepublic of China), Hong Kong, the Philippines, Thailand, Malaysia,Singapore, and Vietnam.*2)“East Asia”refers to China, South Korea,Taiwan(the Republic of China), Hong Kong, the Philippines, Thailand, Malaysia, and Indonesia.
(Year)
Other Purposes
Sightseeing
Business
About 70% Increase
Network between Japanese Regional Areas and East Asia Is Expanding
Shifts in Proportion of East Asia*3 in Regular International Flights from Airports in Regional Areas
0
50
100
150
200
250
300
350
Network Connecting Airports in Regional Areas and East Asia Region
(Number of Flights)
1998 1999 2000 2001 2002 2003 2004 2005 2006 (FY)
ManilaManila
CaloocanCaloocan
DavaoDavao
HangzhouHangzhou
SeoulSeoul
Quezon CityQuezon City
ChengduChengduChengdu
GuiyangGuiyangGuiyang
LanzhouLanzhouLanzhou
KunmingKunmingKunming
HanoiHanoiHanoi
ChongqingChongqingChongqing
BangkokBangkokBangkok
Ho Chi Minh CityHo Chi Minh CityHo Chi Minh City
YangonYangonYangon
GuangzhouGuangzhouGuangzhou
ShenzhenZhongshanZhongshanZhongshan
Hong KongHong KongHong Kong
WuhanWuhanWuhan
Chaoyang
FuzhouFuzhouFuzhou
ZiboZiboZibo
Kuala LumpurKuala LumpurKuala Lumpur
DalianDalian
HarbinHarbinHarbin
JakartaJakartaJakarta
Bandung
Semarang
Medan
PalembangPalembangPalembang
BeijingBeijingBeijing
ShanghaiShanghaiShanghai
TianjinTianjinTianjin
XianXianXian
NanjingNanjingNanjing
Dalian
JinanJinanJinanTaiyuanTaiyuanTaiyuan
ZhengzhouZhengzhouZhengzhou
XiamenXiamenXiamenDongguanDongguanDongguan
Manila
Caloocan
Davao
Yuzhno-Sakhalinsk
VladivostokVladivostokVladivostok
KhabarovskKhabarovskKhabarovsk
SurabayaTangerang
UlsanUlsanUlsan
DatianDatianDatian
PyongyangPyongyangPyongyang
Hangzhou
ChangshaChangshaChangsha
ChejuChejuChejuGuangzhouGuangzhouGuangzhou
QingdaoQingdaoQingdaoSeoul
Quezon City
Singapore
Makassar
InchonInchonInchonDaejeonDaejeonDaejeon
BusanBusanBusan
TaipeiTaipeiTaipei
ChangchunChangchunChangchunShenyangShenyangShenyang
0102030405060708090100(%)
Notes: 1) Cities with population of one million (two millions for cities in China) or more are indicated by dots.
2) Lines are connecting cities with actual regular flights from Japan (or the first cities of call in case of indirect services) as at April 2006.
Source: Ministry of Land, Infrastructure and Transport Japan
Number of Regular Flights to East Asia from Airports in Regional AreasProportion of East Asia in Regular International Flights from Airports in Regional Areas
* as at April 2006 (except air cargo flights)* The numbers of flights are based on the
numbers of round trip flights.* Airports in regional areas are the airports other
than Haneda International Airport, Narita International Airport, Kansai International Airport, and Chubu International Airport.

─ 16 ─
(Roles and Challenges of Roads) Smooth connection of national/international logistics via international hub ports and airports are of great importance from the perception concerning international competitiveness of regional areas. The relationship between domestic logistics situation and manufacturing locations shows the accessibility of the locations highly prioritized in the newly constructed factories in the year 2005, of which 56% are located within 5 kilometers and 78% are located within 10 kilometers from the ramps of toll highways. However, there are emerging needs of solutions for issues such as premature road network developments including existing strips where ISO container semi trailers are unable to drive even on the artery roads strategic to international logistics along with the relatively low level of road development for access to the strategic airports and ports compared to those of the Western countries.
(Status of social capital improvements in regional areas) It is of importance for the development of the regional areas in the context of the globalizing economy to internalize the growth and the vitality in the East Asia region and other oversea regions by addressing aforesaid challenges concerning international logistics and passenger traffi c. Responsiveness to the extending economic activities within the nation and promotion to augment the volume of population interacting with the region are also crucial challenges. Having considered the foregoing, the regional blocks require promotion of a strategic social capital improvement by the
“select and focus (or identify and concentrate)” method clearly setting out the prospect as to the way the regional areas should be and implementing projects in accordance with their priorities identifi ed based on such prospect. Upon such promotion, it is also of importance to enhance the effects generated by the social capital improvement in a synergistic manner by making use of non-structural measures including upgrading of port/airport procedures, and by coordinating the promotion and nongovernmental projects.
[City planning and community planning under the circumstance of defl ating population](Issues on city planning and community planning with defl ating population)
The Population Census 2005 saw more than 70% of the municipalities facing population decrease with their respective populations smaller than those of the previous Population Census implemented in 2000. The result of a survey implemented for 30 municipalities selected out of 654 municipalities with population descent of 5% or more in the period from 2000 to 2005 concerning the impact of the population diminution to the regional areas had identifi ed those areas suffering from such diffi culties in maintaining the community functions as diffi culties in passing on the traditional activities to the next generation due to the intensifying population diminution and graying. There also existed a prominent amount of answers describing decays in the agriculture, forestry, and fi shery, devastation of farm plots, and prostration of commerce and shopping malls. To address such situation, target has to be set to establish sustainable regional areas where higher quality of life is made available in the residents' livelihood spheres despite the conditions of population decrease by utilizing the culture, tradition, natural features and so forth unique to their respective own. Upon setting the city planning target, a shift from the current
Locations by Distance from Ramps of Express Highways
1995 2005
0 -5 kilometers0 -5 kilometers39% 39%
(461 locations)(461 locations)
5 -10 kilometers5 -10 kilometers24% 24%
(290 locations)(290 locations)
0 -5 kilometers39%
(461 locations)
5 -10 kilometers24%
(290 locations)
10 kilometers or more
37% (440 locations) 0 -5 kilometers0 -5 kilometers
56% 56% (543 locations)(543 locations)
5 -10 kilometers5 -10 kilometers22% 22%
(210 locations)(210 locations)
0 -5 kilometers56%
(543 locations)5 -10 kilometers
22% (210 locations)
10 kilometers or more
23% (221 locations)
Note: Totals of the numbers of locations with answers retrieved out of 1,301 newly constructed factories in 1995 and 1,545 newly constructed factories in 2005.
Source: Survey of Factory Location Trends, Ministry of Economy, Trade and Industry
Strategic Airports/Ports Located within 10 Minutes from Ramps of Express Highways
94%
82% 80%
88% 88%
60%
0%
10%
20%
30%
40%
50%
60%
70%
80%
90%
100%
United States (as at the end of year 2001)
European Countries (as at the end of year 2001)
Japan (as at the end of year 2005)
AirportsPorts
Proportion in All the Airports and Ports
91%
Proportion in All the Airports and Ports
84%
Proportion in All the Airports and Ports
66%
Source: Ministry of Land, Infrastructure and Transport
─ 17 ─
idea of city planning where infrastructure is developed in line with the increment in the population of municipalities, to the one to realize compact city that is befi t to the existing infrastructure stock is inevitable. Also, it is of great importance for the respective regional areas to engage into the rejuvenation by means of utilizing the resources characteristic to the respective regional areas.
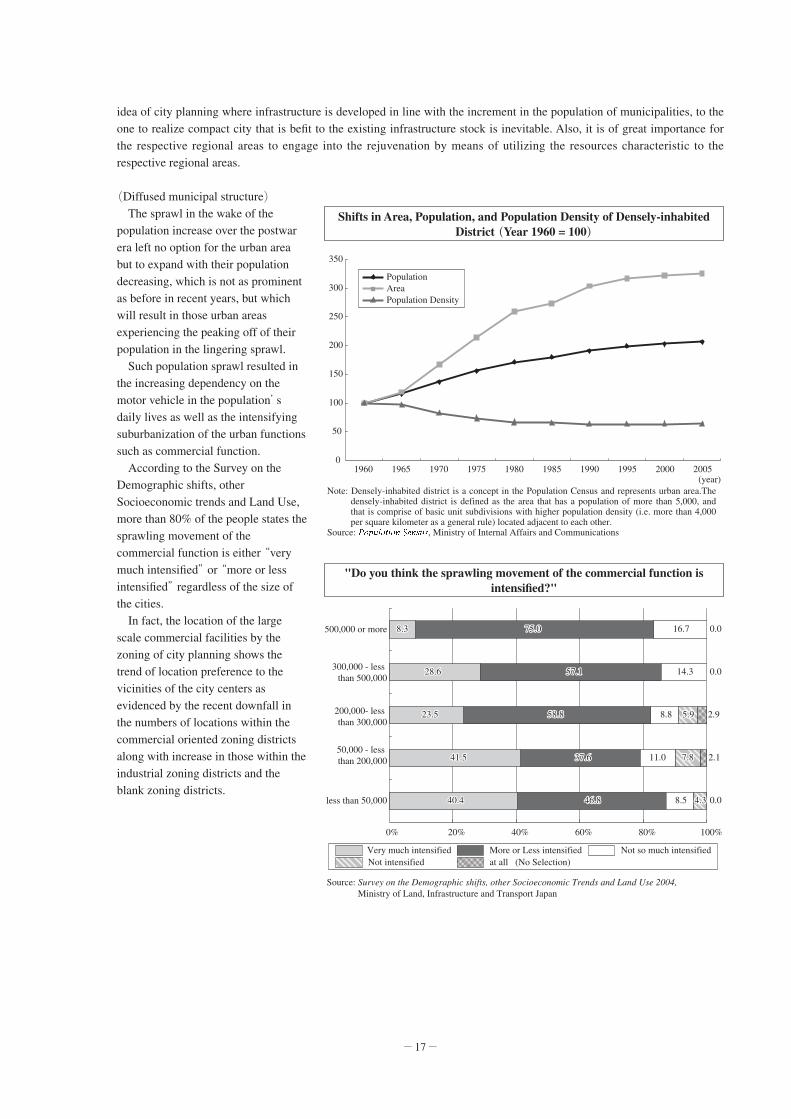
(Diffused municipal structure) The sprawl in the wake of the population increase over the postwar era left no option for the urban area but to expand with their population decreasing, which is not as prominent as before in recent years, but which will result in those urban areas experiencing the peaking off of their population in the lingering sprawl. Such population sprawl resulted in the increasing dependency on the motor vehicle in the population’s daily lives as well as the intensifying suburbanization of the urban functions such as commercial function. According to the Survey on the Demographic shifts, other Socioeconomic trends and Land Use, more than 80% of the people states the sprawling movement of the commercial function is either “very much intensifi ed” or “more or less intensifi ed” regardless of the size of the cities. In fact, the location of the large scale commercial facilities by the zoning of city planning shows the trend of location preference to the vicinities of the city centers as evidenced by the recent downfall in the numbers of locations within the commercial oriented zoning districts along with increase in those within the industrial zoning districts and the blank zoning districts.
Shifts in Area, Population, and Population Density of Densely-inhabited District (Year 1960 = 100)
0
50
100
150
200
250
300
350
PopulationAreaPopulation Density
1960 1965 1970 1975 1980 1985 1990 1995 2000 2005(year)
Note: Densely-inhabited district is a concept in the Population Census and represents urban area.The densely-inhabited district is defined as the area that has a population of more than 5,000, and that is comprise of basic unit subdivisions with higher population density (i.e. more than 4,000 per square kilometer as a general rule) located adjacent to each other.
Source: ��������� �� � , Ministry of Internal Affairs and Communications
"Do you think the sprawling movement of the commercial function is intensifi ed?"
less than 50,000
50,000 - less than 200,000
200,000- less than 300,000
300,000 - less than 500,000
500,000 or more
4040.4.4
41.541.5
23.523.5
28.628.6
8.38.3
46.846.8
37.637.6
58.858.8
57.157.1
75.075.0
4.34.3
7.87.8
5.95.9 2.9
2.1
0.0
0.0
0.0
0% 20% 40% 60% 80% 100%
40.4
41.5
23.5
28.6
8.3
46.8
37.6
58.8
57.1
75.0
8.5
11.0
8.8
14.3
16.7
4.3
7.8
5.9
Very much intensified More or Less intensified Not so much intensified Not intensified at all (No Selection)
Source: Survey on the Demographic shifts, other Socioeconomic Trends and Land Use 2004, Ministry of Land, Infrastructure and Transport Japan

─ 18 ─
On the other hand, the locations of the public facilities show 70% of the hospitals and nearly 90% of the high school and universities/colleges located in the suburbs, as well as particularly intensifi ed development of the hospitals and cultural institutions relocating to the suburbs in recent years.
Locations of Large Scale Commercial Facilities (with 3,000m2 or More of Gross Floor Area)
before 1980
1981-1985
1986-1990
1991-1995
1996-2000
2001-2004
before 1980
1981-1985
1986-1990
1991-1995
1996-2000
2001-2004
Three Metropolitan Areas Provinces
0% 20% 40% 60% 80% 100% 0% 20% 40% 60% 80% 100%
14.3%14.3%
22.2%22.2%
21.8%21.8%
30.0%30.0%
25.0%25.0%
16.5%16.5%
79.5%79.5%
67.9%67.9%
69.2%69.2%
45.4%45.4%
36.3%36.3%
35.5%35.5%
14.3%
22.2%
21.8%
30.0%
25.0%
16.5%
79.5%
67.9%
69.2%
45.4%
36.3%
35.5%
5.9%5.9%
7.4%7.4%
6.6%6.6%
5.9%
7.4%
6.6%
18.9%
33.8%
39.3%
0.3%
2.5%2.5%
2.4%2.4%
5.7%5.7%
4.9%4.9%
8.7%8.7%
2.5%
2.4%
5.7%
4.9%
8.7%
12.8%12.8%
16.4%16.4%
18.1%18.1%
28.1%28.1%
25.4%25.4%
20.9%20.9%
75.3%75.3%
56.3%56.3%
49.5%49.5%
27.0%27.0%
20.8%20.8%
25.1%25.1%
12.8%
16.4%
18.1%
28.1%
25.4%
20.9%
75.3%
56.3%
49.5%
27.0%
20.8%
25.1%
8.5%
17.5%
19.2%
26.1%
28.9%
33.5%
3.5%3.5%
9.7%9.7%
13.2%13.2%
18.8%18.8%
24.9%24.9%
20.5%20.5%
3.5%
9.7%
13.2%
18.8%
24.9%
20.5%
Residential Commercial Industrial Other
Notes: 1) Residential: Exclusively Residential Zones for Low-rise Buildings(Class 1,) Exclusively Residential Zones for Low-rise Buildings (Class 2,) Exclusively Residential Zones for Medium-and High-rise Buildings (Class 1,) Exclusively Residential Zones for Medium-and High-rise Buildings (Class 2,) Residential Zones (Class 1,) Residential Zones (Class 2,) and Semi-Residential Zones
Commercial: Neighborhood Commercial Zones and Commercial ZonesIndustrial: Semi-industrial Zones, Industrial Zones, and Exclusively Industrial ZonesOther: Urbanization Control Areas, Non-Zoning/Blank Areas, and areas other than the Town Planning Jurisdiction Areas
2) Totals of the retail premises with areas 3,000 square meters or more engaging into the merchandizing business as stipulated in the Building Standards Law.
3) As at the end of the year 2004.Source: Ministry of Land, Infrastructure and Transport Japan
Relocation of Public Facilities to Suburbs
0%
20%
40%
60%
80%
100%
Location of Facilities by Areas (2004)
City Halls Cultural Institutions
Hospitals High schools/Universities/Colleges
379379
10891089119119
237237
164164
14341434297297
14911491
379
1089119
237
164
1434297
1491
01020304050607080
(Number of Relocations)Shifts in Numbers of Relocation from Inner City to Suburbs
1970s 1980s 1990s
3232
1414 1010
5
1818 2222
8 17172525
13131616
1010
32
14 10
5
18 22
8 1725
1316
10
City Halls Cultural Institutions HospitalsHigh schools/Universities/Colleges
Inner City Suburbs
Notes: Number of subjected cities: 551 cities with provided answers out of 666 cities (exclusive of the Government Ordinance Cities)Study Term: from January 19 to February 20, 2004Source: Survey on the Demographic shifts, other Socioeconomic Trends and Land Use 2004, Ministry of Land, Infrastructure and Transport Japan

─ 19 ─
(Planning of compact cities) The diffused urban area is inefficient as to the costs related to the city operations including maintenance of public facilities. Also, as motor vehicles for personal use are prerequisite to such diffused urban area, the diffused urban area imposes not only inconvenience on senior citizens and other transportationally challenging population, but also signifi cant impacts on the environment. The goal must be the municipal structure free of excessive dependence to motor vehicles for personal use by elimination of freely diffusing urban functions and integration of commercial, governmental, medical, cultural functions with wider service area in order to manage the finance of the municipalities and to maintain the regional communities under the circumstances of the dawn of the society with decreasing population and intensifying graying. The city planning with various urban functions integrated into smaller area, for the enjoyment of comfortable livelihood by the majority of people including the minors and the senior citizens, and with abundance of prosperity must be realized by means of properly utilizing the city planning scheme and supportive measures under the “Act Concerning the City Center Revitalization”, thereby integrally promoting the proper location of the urban functions and development of city centers.
(Rejuvenation efforts utilizing regional qualities) Regional rejuvenation efforts amid population decrease require utilization of the regional characteristics. Such a point of view also emphasizes on, for example, the recovery and utilization of historical/cultural/scenic resources cumulated in many city centers, in the case of city center rejuvenation. The result of the survey concerning the regional revitalization efforts of the 30 municipalities with population decrease shows the majority of those municipalities are upon such attempt to augment the number of visitors as promotion of tourism utilizing the nature and culture characteristic to them. Also, the promotion of agriculture, forestry, fi shery and other regional industries, such as establishing specialty products of the regions as brands, is enthusiastically implemented especially by smaller municipalities. Some of the smaller municipalities are further seeking to liaise with their residents in the rejuvenation of their regions. Such approaches with residents taking initiatives are considered to be increasingly important in the rejuvenation under juxtaposing challenges in regional economy by utilizing their own unique resources.
[Public transportations supporting regional dynamism](Decrease in the number of public transportation passengers)
The public transportation playing a key role in community transit has been experiencing a decrease in its passengers due mainly because the wide spread of family vehicles. Number of railway passenger shows healthy shifts in the three metropolitan areas, but is indicating a drop in the provinces. Number of bus passengers decreasing both in the three metropolitan areas as well as in the provinces spells out the steeper downfall in the provinces. The passenger decrease is followed by a series of discontinued railway services, as well as continued decline in the number of bus routes up until recent years.
Shifts in Number of Railway/ Bus Passengers (Number of Passenger in 1975 = 100)
40
60
80
100
120
140
Trains
100109
125 124 123 123 123 124113
131 130 129 130 130 131
8695 93 92 89 87 87
40
60
80
100
120
140
Buses
1975 1985 1998 1999 2000 2001 2002 2003 (Year)
58 56 54 53 51 51
100
69 67 65 63 62 6275
49 46 46 44 43 42
78
81
1975 1985 1998 1999 2000 2001 2002 2003 (Year)
Whole Country Three Metropolitan Areas Provinces
Source: the Ministry of Land, Infrastructure and Transport Japan

─ 20 ─
(Spread of family vehicles mainly in the provinces and its impacts) As shown in the shifts in composition of passengers in the provinces by the transportation methods, the proportion of car passengers has been drastically increased, resulting in the higher dependency on family vehicles. In line with the increase, permeation of family vehicles has been on the rise, exceeding more than one car per household in 42 prefectures in March 2005.
(Emerging trends in public transportation) Circumstances surrounding public transportation are increasingly challenging as the passenger decreases especially in the provinces. To respond to such circumstances, some regional districts are developing new transportation systems corresponding to their respective demands and situations with a prospect to recover the prosperities in the streets by improving accessibility to the city center. Among those developments are introduction of LRTs
(Light-rail Transit: Next generation tramcar system) or Japanese BRTs (Bus Rapid Transit), introduction of Community Buses intended to eliminate No Transportation Areas, Implementation of paid welfare transportation services by NPOs.
(Public Transportation for regional revitalization) The public transportation in the regional areas has undertaken a vital function to ensure and improve the quality of life of the respective regions by enabling dynamic urban activities, promoting the inter-regional communications, including tourism and reducing the environmental load while supporting the independent lives of the residents. Realization of compact city planning also requires improvements in accessibility to the city centers, which makes it high on the agenda to revitalize and to reinstall the public transportation for the purpose of adding more lively breath to regions. Utilization of community buses and paid welfare transportation services by NPOs are also required in the regions highly dependent on family vehicles so as to ensure the transportation of the senior citizens and transportationally challenging population aside from the development of easily drivable vehicles and environment.
Composition of Passengers in the Provinces by Transportation Methods
0%
20%
40%
60%
80%
100%
1111 8 6 6
64
3 2 2 26 6
11 8 6 6 5 522
5 5
64
3 2 2 2
11 1 1 1 1 1 1
11 1 1 1 1 1 1
3232
19199 9 8 8 8 8
5050
68688181 8181 8282 8383 8484 8484
32
199 9 8 8 8 8
50
6881 81 82 83 84 84
226 6
1975 1985 1998 1999 2000 2001 2002 2003(Year)
JR (JNR) Private Railway Subway Bus Motor Vehicle
Notes: 1) Figures for JR, private railway (including subway) are derived by proportionally dividing the respective annual total passengers of the nation as shown in the Urban Transport Yearbook among the annual total passengers of the respective prefectures.
2) The figures for the provinces are derived by subtracting figures for the three metropolitan areas (i.e. the Metropolis of Tokyo and Saitama, Chiba, Kanagawa, Gifu, Aichi, Mie, Kyoto, Osaka, and Nara prefectures) from the national total.
Sources: Urban Transport Yearbook, Suburban Transport Yearbook, Institution for Transport Policy Studies
LRT(Toyama Light Rail)
Community Bus(Moo-bus or “Move-us” in Musashino City, Tokyo)

─ 21 ─
In fact, some activities of a regional community working as one in installation of new forms of transportation services differentiated from the conventional services and befit to the regional situations have been sprouted, which has to be nurtured into robust trees of national movement.
[Population in charge of supporting vitality of regions under population decrease and graying](Population in charge of supporting vitality of regions under population decrease)
Intensifying population decrease and graying gives rise to a question as to who are to be in charge of various regional activities. On one hand, there has been developed a concern of decreasing labor force population to support the regional economy. On the other hand, provision of governmental service at the level as has been available would become increasingly difficult due to the limitation imposed by downscaling regional economy. The former issue requires employment environment where variety of human resources can be involved and therefore it would become particularly important to develop an environment where females can easily join the labor force even in the period they are assigned with tasks as mothers. The latter requires regional planning based upon a “renovated governments” seeking to improve their services in liaison with various private entities. The trend of “Baby Boomers” with their mass retirement expected to start as of the year 2007, are particularly attracting attentions as the candidates for the population in charge.
(Planning of environment where mothers can easily join workforce) The employment rate of female by age group exhibits an M-shaped line due to the relatively lower number in their 30sThe result is believed to be attributable to many women retiring on their delivery and child care period. At the same time, the larger proportion of women in their 30s willing to work implies the fact that those retirements are not necessarily their desired option. As shown in the comparison between the female employment rate in the three metropolitan areas and that of regional districts area, the decrease in their 30s is slightly more in the three metropolitan areas than in the provinces, and so is the stagnation upon subsequent recovery. Also, the relationship between employment rate of female population and total fertility rate (or number of children a female bears in her life) by prefecture exhibits a direct proportion. There presumably exist effects of more or less developed environment where women can work at the same time being mothers in the areas with higher female employment rate at the background thereof. To support this observation, the number of child-care centers per 100,000 Individuals of Ages 0 to 5 and employment rate of female population are in direct proportion. The environment to support bringing-up of children has to be developed in the society as a whole in order for mothers to join the workforce.
Employment Rate of Female Populations in the Three Metropolitan Areas and the Provinces by Age Group
0
10
20
30
40
50
60
70
80
(in %)
Ages 15 to 19
Ages 20 to 24
Ages 25 to 29
Ages 30 to 34
Ages 35 to 39
Ages 40 to 44
Ages 45 to 49
Ages 50 to 54
Ages 55 to 59
Ages 60 to 64
Age 65 or older
Source: Population Census 2005, Ministry of Internal Affairs and Communications
Whole Country Three Metropolitan Areas Provinces
Proportion of Women Willing to Work by Age Group
0
10
20
30
40
50
60
70(in %)
Age
s 1
5 to
19
Age
s 2
0 to
24
Age
s25
to 2
9
Age
s30
to 3
4
Age
s35
to 3
9
Age
s 4
0 to
44
Age
s 4
5 to
49
Age
s 5
0 to
54
Age
s 5
5 to
59
Age
s 6
0 to
64
Age
s 6
5 to
69
Age
s 7
0 to
74
Age
75
or o
lder
16.7
47.1
63.6 61.6 63.559.7
51.5
41.6
32.6
23.6
13.65.8
1.6
Notes: 1) Proportion of individuals seeking to work out of individuals without occupation including full-time domestic engineers
2) Figures in 2002.Source: Employment Status Survey 2002, Ministry of Internal Affairs
and Communications

─ 22 ─
(Year 2007 Problem) Mass retirement of so-called “Baby Boomers” (Born in the years from 1947 to 1949) is expected to be commenced as of the year 2007.The mass retirement period of this generation called “Year 2007 Problem” is perceived as signifi cant challenges including issues in succeeding to skills and competence in a company. Meanwhile, considering the fact that the proportion of answers opted for “willing to work after 60 years of age” amounted to a signifi cant 70.7% in the group of ages 55 to 59 according to the First Longitudinal Study of Mid Aged and Senior Citizens by the Ministry of Health, Labour and Welfare (2005), utilization of such populations that is willing to join workforce will be increasingly important as decrease in the number of labor force population is expected to decrease in the future.
(Regional planning and Baby Boomers) According to the Population Census 2005, the “Baby Boomers” residing in the three metropolitan areas amounted to 50.3%, compared to only 35.2% as at the Population Census 1955.Based on the foregoing, a major scale migration of the
“Baby Boomer” generation from the provinces to the three metropolitan cities for employment and other purposes can be identifi ed.
Relationships between Total Fertility Rate and Employment Rate of Female Population / Number of Child-care Centers Per 100,000 Individuals of Ages 0 to 5
and Employment Rate of Female Population
0.9
1.0
1.1
1.2
1.3
1.4
1.5
1.6
1.7
1.8
0
100
200
300
400
500
600
700
800
50 55 60 65 70 75 80
50 55 60 65 70 75 80
Relationship between Employment Rate of Female Population and Total Fertility Rate
Relationship between Employment Rate of Female Population and Number of Child-care Centers
Sources: Employment Status Survey, Ministry of Internal Affairs and Communications, Vital Statistics, Ministry of Health, Labour and Welfare
Sources: Employment Status Survey, Prefectures from the Statistical Point of view, Ministry of Internal Affairs and Communications
Tot
al F
ertil
ity R
ate
Num
ber
of C
hild
-car
e C
ente
rs p
er
100,
000
Indi
vidu
als
of A
ges
0 to
5
Female Employment Rate (%)
Female Employment Rate (%)
Residential Address Distribution of “Baby Boomers” by Region
1955 2005Baby Boomers Total Population Baby Boomers Total Population
Total 7.28million 89.28million 6.88million 127.77millionThree Metropolitan Areas 2.56million(35.2%) 33.21million(37.2%) 3.46million(50.3%) 64.18million(50.2%)
Tokyo Area 1.16million(16.0%) 15.42million(17.3%) 1.82million(26.5%) 34.48million(27.0%)Nagoya Area 0.55million( 7.5%) 6.84million( 7.7%) 0.60million( 8.7%) 11.23million( 8.8%)Osaka Area 0.85million(11.7%) 10.95million(12.3%) 1.04million(15.1%) 18.48million(14.5%)
Note: “Baby boomers” refers to the generation born in the years from 1947 to 1949, except for the year 1955 where the term refers to the population of ages 6 to 8 as at October 1, 1955 (or as at the implementation of the Population Census in the year)
Source: Population Census, Ministry of Internal Affairs and Communications

─ 23 ─
Attentions are attracted on the preferences of the “Baby Boomers” as the generation having experienced such demographic shifts, with respect to the post retirement dwelling. Results of the Opinion Poll on the Symbiosis and Interaction of Cities and Farming, Mountain, and Fishing Villages by the Cabinet Offi ce shows a slightly larger proportion of urban residents in their 50s opted for either
“Yes I do” or “I would say I do” for the question “Do you have a desire to have habitation with two dwellings alternating urban area on weekdays and farming, mountain, or fi shing village on weekends?” than the other age groups. There is also a chance of increased activities of communicating population out of this generation, including the aforesaid two area dwelling, thereby contributing the regional revitalization in the future.
The National Survey of Lifestyle Preferences by the Cabinet Offi ce further shows that the motivation for the social action program increases in line with the age of people in their 30s or older, which is also increasing the expectation for the “Baby Boomers” to play a key role in town and region planning activities with the participation of residents.
[New role of construction industry in regions](Situation of construction sector)
Taking up about 10% in the total employees in all the sectors, and being the industry in charge of social capital improvement in arrearage and providing more job opportunities, especially in the provinces with signifi cant amount of public investment in their economy, construction sector is undertaking a role as an essential industry of region.
“Do you have a desire to have habitation with two dwellings alternating urban area on weekdays and farming, mountain, or fi shing village on
weekends?”
0% 10% 20% 30% 40% 50% 60% 70% 80% 90% 100%
43.743.7
39.439.4
32.732.7
39.139.1
39.539.5
47.047.0
61.661.6
1.41.4
0.62.41.2
1616.1.1
11.911.9
15.215.2
24.024.0
18.618.6
15.215.2
21.521.5
29.329.3
23.923.9
21.021.0
21.521.5
22.822.8
13.413.4 5.55.5
16.1
4.04.04.0
11.9
15.2
24.0
18.6
15.2
21.5
29.3
23.9
21.0
21.5
22.8
13.4
14.5
21.2
27.7
23.2
9.0
7.9
5.5
43.7
39.4
32.7
39.1
39.5
47.0
61.6
0.8
0.0
0.0
0.0
2.5
0.9
2.7
5.1
1.9
1.4
3.5
0.7
1.0
1.9
0.0
0.0
0.52.3
Yes I do.
Source: Results of the Opinion Poll on the Symbiosis and Interaction of Cities and Farming, Mountain, and Fishing Villages, 2005, Cabinet Office
I would say I do. I would say I do not. No I do not.
I have already realized the desire. I cannot specify. I do not know.
Total
Ages 20 to 29
Ages 30 to 39
Ages 40 to 49
Ages 50 to 59
Ages 60 to 69
Age 70 or older
Motivation for Participation in Social Action Programs by Age Group and Gender
0
10
20
30
40
50
60
70
80(in %)
57.9 55.848.3
58.466.7
73.1 70.167.3
58.4 54.9
64.4 65.672.5 72.2
Teens 20s 30s 40s 50s 60s 70s
Male Female
Source: �������� �� � �� ��� ���� �� � � �� � ����, Cabinet Office
Proportion of Employee in Construction Industry in All the Industries
0%
2%
4%
6%
8%
10%
12%
10.3% 10.1%
7.9%
10.8%
8.5%8.0%
9.4% 9.5% 9.7%
Source: Labour Force Survey, Ministry of Internal Affairs and Communications
Hokkaido
Tohoku
Kanto/K
oshin
Hokuriku
Tokai
Kinki
Chugoku
Shikoku
Kyushu
Proportion of Fixed Capital Formation in GDPs of Prefecture
0%
1%
2%
3%
4%
5%
6%
7%
8%
9%
Hokkaido
Tohoku
Kanto/K
oshin
Hokuriku
Tokai
Kinki
Chugoku
Shikoku
Kyushu
8.5%
7.2%
3.4%
7.0%
4.1% 4.0%
6.1%
6.9%7.1%
Source: Prefectural Accounts 2004, Cabinet Office

─ 24 ─
The construction sector in the regions are, however, now experiencing a severe management environment due to the decreasing trend of investment in construction, and particularly the impacts of signifi cant cut of public investments both from the regional and national governments.
The situation is further aggravated especially in the provinces as evidenced by the more proportion taken up by the sector in the total number of bankruptcies. The number of employee has been decreased by over one million since the number peaked off in 1997.
(Multiple tasks undertaken by construction sector in regions) However, the sector in regions, currently exposed to the severe business climate as noted above, is expected to undertake a variety of roles in the regions because of its technologies and know-how cumulated in the course of the construction activities. The sector has been contributing to the regions in the case of disasters by acting as a pivotal role in emergency measures and recovery measures against the disasters based upon agreements on disasters entered into by the national government or regional governmental organizations and construction industry associations or other organizations. In addition, approaches responding to the new demands of the regions, such as expansion of the business scopes to other fi elds within the construction sector or new fi elds are intensifi ed among the small to medium/ solid mid-range construction companies in regions. Among those are initiative trends that must be supported including 1) implementation of public facilities maintenance as the outsourcing of public undertakings expands, 2) entry to the forestry in the context of increasing land under abandonment of cultivation, and 3) public transportation and welfare service provision in the depopulated regions with intensifi ed graying, to name a few in practice. Those initiative trends must be supported.
Proportion of Construction Sector in Bankruptcy by Region
20%
25%
30%
35%
40%
45%
2002 2003 2004 2005 2006 (Year)
Source: Reference of Tokyo Shoko Research, Ltd.
Hokkaido
TohokuKanto/KoshinHokurikuTokaiKinkiChugokuShikokuKyushuNational Average
Shifts in Number of Employees in Construction Industry by Region
0
1
2
3
4
5
6
7
8
0.74
0.220.40
0.890.89 0.940.94 0.970.97 0.940.94 0.950.95 0.970.97 0.950.95 0.950.95 0.950.95 0.880.88 0.880.88 0.870.87 0.810.81 0.810.81 0.800.800.89
0.670.67 0.700.70 0.710.71 0.730.73 0.740.74 0.770.77 0.760.76 0.770.77 0.770.77 0.760.76 0.760.76 0.710.71 0.690.69 0.660.660.66 0.670.670.67
0.340.34 0.340.34 0.350.35 0.370.37 0.370.37 0.360.36 0.360.36 0.360.36 0.360.36 0.340.34 0.330.33 0.310.31 0.310.31 0.320.32 0.310.310.34
0.490.49 0.520.52 0.520.52 0.530.53 0.540.54 0.580.58 0.540.54 0.530.53 0.540.540.530.53 0.500.50 0.500.50
0.480.48 0.450.45 0.430.430.49
1.59
0.550.550.580.58 0.590.59 0.610.61 0.610.61 0.630.63
0.630.63 0.610.61 0.620.620.600.60 0.570.57 0.550.55
0.520.52 0.510.51 0.480.48
0.55
0.320.320.330.33 0.330.33 0.350.35 0.350.35 0.350.35
0.330.33 0.340.34 0.330.330.310.31 0.310.31 0.300.30
0.280.28 0.260.26 0.270.27
0.32
6.19
0.75 0.77
0.22 0.210.42 0.43
0.94 0.97
0.70 0.71
0.34 0.350.52 0.52
1.61 1.66
0.58 0.590.33 0.33
0.80
0.220.43
0.94
0.73
0.37
0.53
1.67
0.61
0.356.40 6.55 6.63
0.80
0.230.44
0.95
0.74
0.37
0.54
1.66
0.61
0.35
6.70
0.80
0.250.47
0.97
0.77
0.36
0.58
1.66
0.63
0.35
6.85
0.80
0.240.45
0.95
0.76
0.36
0.54
1.56
0.63
0.33
6.62
0.81
0.230.44
0.95
0.77
0.36
0.53
1.51
0.61
0.34
6.57
0.79
0.230.42
0.95
0.77
0.36
0.54
1.52
0.62
0.33
6.53
0.77 0.77
0.22 0.210.40 0.39
0.88 0.88
0.76 0.76
0.34 0.33
0.53 0.50
1.50 1.46
0.60 0.57
0.31 0.31
6.326.18
0.74
0.190.39
0.87
0.71
0.31
0.50
1.49
0.55
0.30
6.04
0.69
0.200.37
0.81
0.69
0.31
0.48
1.49
0.52
0.28
5.84
0.70
0.200.36
0.81
0.32
0.45
1.41
0.51
0.26
5.68
0.68
0.190.36
0.80
0.67
0.31
0.43
1.39
0.480.27
5.59
Hokkaido Southern Kanto Tohoku HokurikuNorthern Kanto/Koshin
Tokai KyushuShikokuChugokuKinki
(in million persons)
1993 1994 1995 1996 1997 1998 1999 2000 2001 2002 2003 2004 2005 2006 (Year)
1992
Source: Labour Force Survey, Ministry of Internal Affairs and Communications
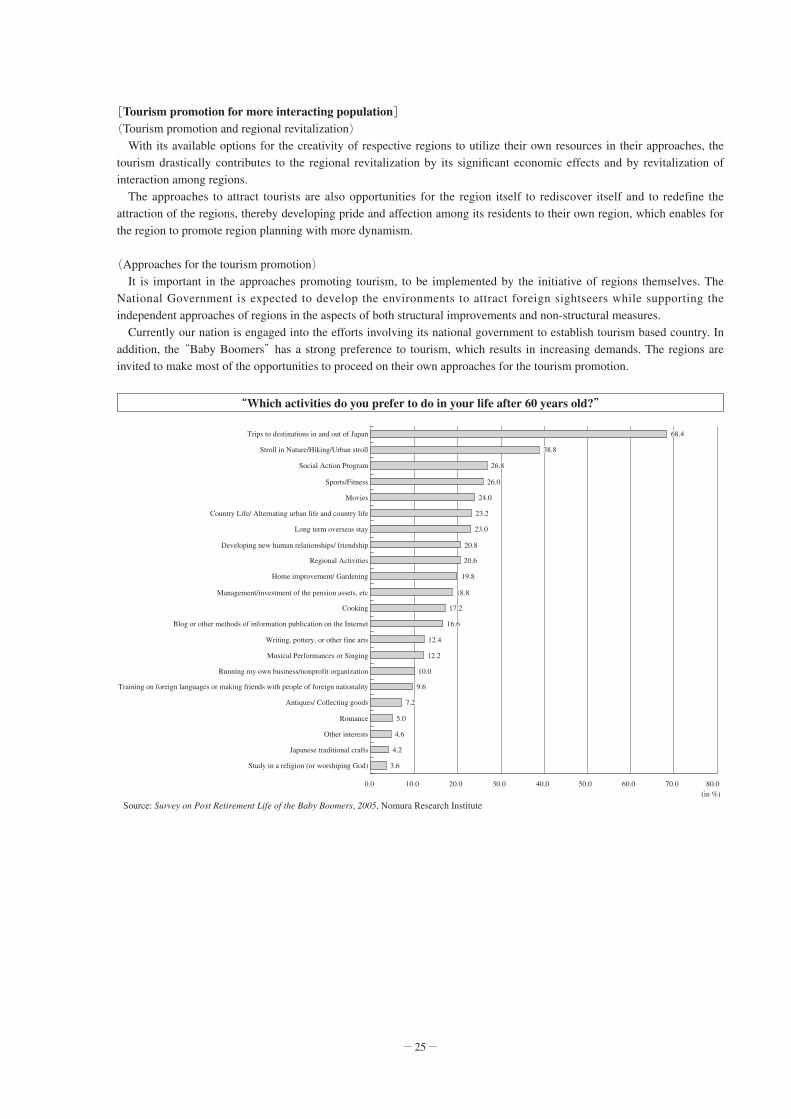
─ 25 ─
[Tourism promotion for more interacting population](Tourism promotion and regional revitalization)
With its available options for the creativity of respective regions to utilize their own resources in their approaches, the tourism drastically contributes to the regional revitalization by its signifi cant economic effects and by revitalization of interaction among regions. The approaches to attract tourists are also opportunities for the region itself to rediscover itself and to redefine the attraction of the regions, thereby developing pride and affection among its residents to their own region, which enables for the region to promote region planning with more dynamism.
(Approaches for the tourism promotion) It is important in the approaches promoting tourism, to be implemented by the initiative of regions themselves. The National Government is expected to develop the environments to attract foreign sightseers while supporting the independent approaches of regions in the aspects of both structural improvements and non-structural measures. Currently our nation is engaged into the efforts involving its national government to establish tourism based country. In addition, the “Baby Boomers” has a strong preference to tourism, which results in increasing demands. The regions are invited to make most of the opportunities to proceed on their own approaches for the tourism promotion.
“Which activities do you prefer to do in your life after 60 years old?”
Trips to destinations in and out of Japan
Stroll in Nature/Hiking/Urban stroll
Social Action Program
Sports/Fitness
Movies
Country Life/ Alternating urban life and country life
Long term overseas stay
Developing new human relationships/ friendship
Regional Activities
Home improvement/ Gardening
Management/investment of the pension assets, etc
Cooking
Blog or other methods of information publication on the Internet
Writing, pottery, or other fine arts
Musical Performances or Singing
Running my own business/nonprofit organization
Training on foreign languages or making friends with people of foreign nationality
Antiques/ Collecting goods
Romance
Other interests
Japanese traditional crafts
Study in a religion (or worshiping God)
68.468.4
38.838.8
26.826.8
26.026.0
24.024.0
23.223.2
23.023.0
20.820.8
20.620.6
19.819.8
18.818.8
17.217.2
16.616.6
12.412.4
12.212.2
10.010.0
9.69.6
7.27.2
5.05.0
4.64.6
4.24.2
3.63.6
68.4
38.8
26.8
26.0
24.0
23.2
23.0
20.8
20.6
19.8
18.8
17.2
16.6
12.4
12.2
10.0
9.6
7.2
5.0
4.6
4.2
3.6
0.0 10.0 20.0 30.0 40.0 50.0 60.0 70.0 80.0(in %)
Source: Survey on Post Retirement Life of the Baby Boomers, 2005, Nomura Research Institute

─ 26 ─
[Challenges of regions on the development of environment](Issues of regions on measures against disasters)
Implementation of measures including ones for earthquakes, landslides, and floods are among the most essential requirements to make habitable conditions in the regions of Japan, because of the conditions on its land and nature including its position, topography, and meteorology putting it in a position vulnerable to earthquakes, typhoons, and torrential rains. In view of the accidents where the senior citizens are victimized in the natural disasters in accordance with intensifying graying in recent years, the respective regions require furtherance of comprehensive measures against natural disasters including improvement in communication of the disaster information and establishment of supporting systems for the senior citizens upon such emergencies, and other non-structural measures.
(Challenges in the regions development of fundamental infrastructure of life) Improvement in the various infrastructures supporting our daily lives including sewage, city parks, community roads as well as in the quality of the residential houses is indispensable for the better regional livelihood. Particularly in relation to the graying, improvement in installation of more united and integrated barrier free environment throughout the public transportation, residential buildings and other structures, pedestrian spaces, city parks is of importance to realize regions with comfortable livelihood for all the residents including senior citizens and disabled.
(Challenges of disadvantaged regions) The situation in the regions with ongoing depopulation further intensifi es its severity as the national population had peaked off. The Population Census 2005 reveals that the number of municipalities with population decreased by 5% or more since the last census in 2000 was 654 (out of 2217 as at the census, or about 30% thereof) and 254 or about 70% of 361 in case of municipalities with population less than 5,000, and that most of those with 5% decrease and less than 5,000 are located in isolated islands, peninsulas, remote mountain ringed areas, areas with heavy snow, or other disadvantageous areas with respect to geographical and natural environment. Implementation of the region planning with achieved balance of its natural environment and production base/ habitation environment by optimal use of its resources is required in such disadvantaged areas in consideration of the signifi cance from the perception of land conservation, which calls for focused supports in the efforts including development of required infrastructure or ensuring daily transportation.

─ 27 ─
Chapter 3: Development of Measures Implemented by MLIT Aiming at Regional Revitalization
It is also of vital from the perception of national revitalization as a whole to seek “attractive regions” with full of ingenuity by promoting approaches unique to the respective regions. The National Government coordinated the “Regional Revitalization Policy Scheme” in February 2007 as describing the overview of the varieties of regional revitalization policies. The scheme also being a sort of “New Strategy for Support in of Regional Power” stipulates that the Government as a whole shall make efforts in promoting regional revitalization, and thereby promote the “motivation” of regions. Upon Implementation of the measures for regional revitalization measures, the role undertaken by MLIT is signifi cant as it covers broader administrative areas cohesively related to the regions such as land policies, social capital improvement, and transportation policies. The itemized list of basic recognition under the “MLIT Regional Revitalization Strategy” previously set out in November 2006 by MLIT is as follows.① As is stipulated in new National Spatial Strategies currently upon establishment procedures, that the measures shall be
implemented to transform the land structure with one terminal-one axis confi guration where its population and various functions are congested in the Pacifi c coastal belt with Tokyo as the single focus into the new structure with independent regional blocks, the promotion of regional revitalization calls for comprehensive support for the regional strategies of the blocks mainly consisted of projects of private sector as well as development of a base for competition of ingenuity in order for the regional blocks to be independent and to prosper.
② It is also required within the regional blocks to support the approaches utilizing unique regional resources based upon the ideas of the “people” in the livelihood spheres and the level of grass roots, aiming to emphasize on the wealth of regional characteristics rooted upon the unique cultures, traditions, and natural environment, and to establish livelihood spheres with full of attraction.
③ In addition, promotion of tourism based country such as internalizing the demand of tourism in fast-growing Asian region or expanding international exchange with the region has tremendous contribution to the regional revitalization by increasing interacting population and by creating of new industries or employment.
④ On the other hand, land planning for the safe and peaceful land durable against disasters, realization of regions with comfortable living by improving the fundamental infrastructure for life, and efforts from the point of view to rectify the disadvantages due to the geographical/natural conditions such as isolated islands, peninsulas, heavy snowfall areas are all considered to be prerequisites to the promotion of regional revitalization as the development of the condition for the autonomous development of regions.
MLIT shall address the regional revitalization by utilizing all the measures concerned under the aforesaid basic understanding.
[Chapter 3 Key Points]
Upon Implementation of the measures for regional revitalization, the role undertaken by MLIT has certain signifi cance as it covers broader administrative areas cohesively related to the regional areas such as national land policies, social capital improvement, and transportation policies. This chapter sets out the development of MLIT measures in accordance with the basic understandings on the “MLIT Regional Revitalization Strategy” previously coordinated in November 2006.
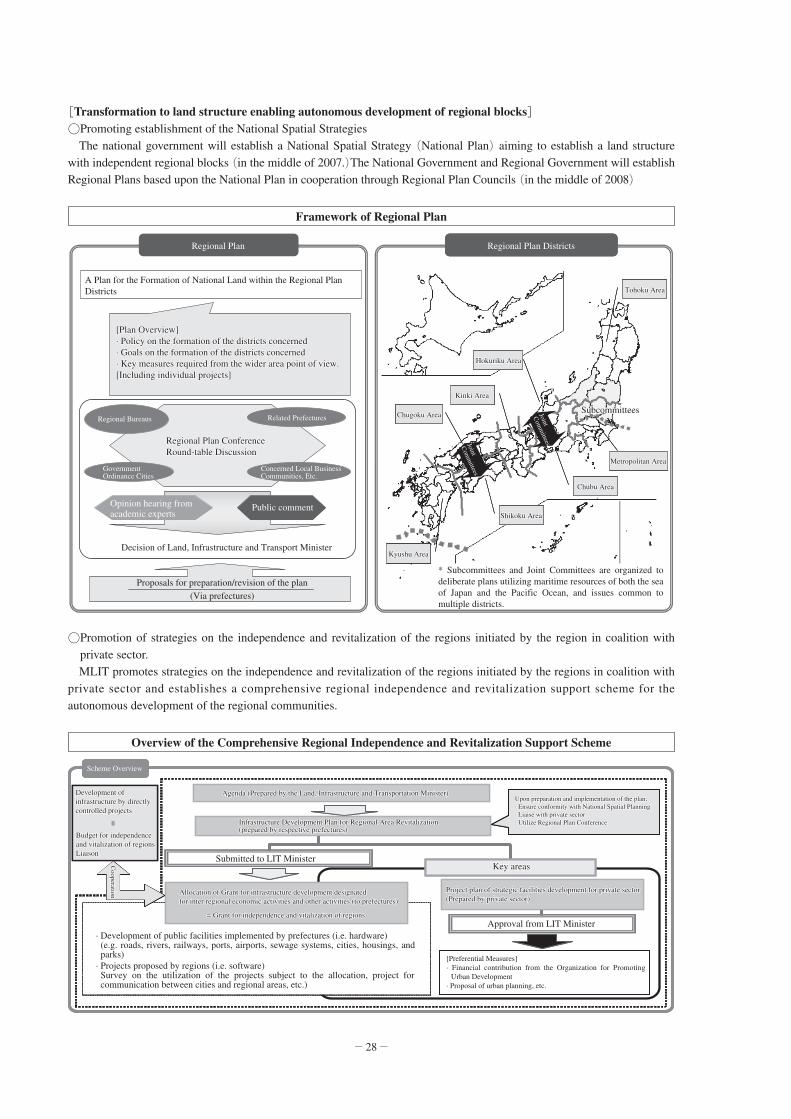
─ 28 ─
[Transformation to land structure enabling autonomous development of regional blocks]○Promoting establishment of the National Spatial Strategies The national government will establish a National Spatial Strategy (National Plan) aiming to establish a land structure with independent regional blocks (in the middle of 2007.)The National Government and Regional Government will establish Regional Plans based upon the National Plan in cooperation through Regional Plan Councils (in the middle of 2008)
○ Promotion of strategies on the independence and revitalization of the regions initiated by the region in coalition with private sector.
MLIT promotes strategies on the independence and revitalization of the regions initiated by the regions in coalition with private sector and establishes a comprehensive regional independence and revitalization support scheme for the autonomous development of the regional communities.
Framework of Regional Plan
Regional Plan
Tohoku AreaTohoku Area
Metropolitan AreaMetropolitan Area
Hokuriku AreaHokuriku Area
Kinki AreaKinki Area
Chubu AreaChubu Area
Shikoku AreaShikoku Area
Chugoku AreaChugoku Area
Kyushu AreaKyushu Area
Tohoku Area
Metropolitan Area
Hokuriku Area
Kinki Area
Chubu Area
Shikoku Area
Chugoku Area
Kyushu Area
* Subcommittees and Joint Committees are organized to deliberate plans utilizing maritime resources of both the sea of Japan and the Pacific Ocean, and issues common to multiple districts.
Regional Plan Districts
A Plan for the Formation of National Land within the Regional Plan Districts
Regional Plan ConferenceRegional Plan ConferenceRound-table DiscussionRound-table Discussion
[Plan Overview][Plan Overview]· Policy on the formation of the districts concerned· Policy on the formation of the districts concerned· Goals on the formation of the districts concerned· Goals on the formation of the districts concerned· Key measures required from the wider area point of view.· Key measures required from the wider area point of view.[Including individual projects][Including individual projects]
[Plan Overview]· Policy on the formation of the districts concerned· Goals on the formation of the districts concerned· Key measures required from the wider area point of view.[Including individual projects]
Public comment
Regional Bureaus
Regional Plan ConferenceRound-table Discussion
Government Ordinance Cities
Concerned Local Business Communities, Etc.
Related Prefectures
Decision of Land, Infrastructure and Transport Minister
(Via prefectures)
Proposals for preparation/revision of the plan
SubcommitteesSubcommitteesSubcommitteesJoint
Com
mitteesJoint
Com
mittees
Opinion hearing from academic experts
Overview of the Comprehensive Regional Independence and Revitalization Support Scheme
Scheme Overview
Budget for independence Budget for independence and vitalization of regionsand vitalization of regionsLiaisonLiaison
Development of Development of infrastructure by directly infrastructure by directly controlled projectscontrolled projects
=
Budget for independence and vitalization of regionsLiaison
Development of infrastructure by directly controlled projects
Upon preparation and implementation of the plan;Upon preparation and implementation of the plan;· · Ensure conformity with National Spatial PlanningEnsure conformity with National Spatial Planning· · Liaise with private sectorLiaise with private sector· · Utilize Regional Plan ConferenceUtilize Regional Plan Conference
Key areasKey areas
Project plan of strategic facilities development for private sectorProject plan of strategic facilities development for private sector(Prepared by private sector)(Prepared by private sector)
Upon preparation and implementation of the plan;· Ensure conformity with National Spatial Planning· Liaise with private sector· Utilize Regional Plan Conference
Allocation of Grant for infrastructure development designated Allocation of Grant for infrastructure development designated for inter regional economic activities and other activities (to prefectures)for inter regional economic activities and other activities (to prefectures)
= Grant for independence and vitalization of regions= Grant for independence and vitalization of regions
Infrastructure Development Plan for Regional Area Revitalization Infrastructure Development Plan for Regional Area Revitalization (prepared by respective prefectures)(prepared by respective prefectures)
Agenda (Prepared by the Land, Infrastructure and Transportation Minister)Agenda (Prepared by the Land, Infrastructure and Transportation Minister)
Allocation of Grant for infrastructure development designated for inter regional economic activities and other activities (to prefectures)
= Grant for independence and vitalization of regions
· Development of public facilities implemented by prefectures (i.e. hardware)(e.g. roads, rivers, railways, ports, airports, sewage systems, cities, housings, and parks)
· Projects proposed by regions (i.e. software)Survey on the utilization of the projects subject to the allocation, project for communication between cities and regional areas, etc.)
Key areas
[Preferential Measures]· Financial contribution from the Organization for Promoting
Urban Development· Proposal of urban planning, etc.
Approval from LIT Minister
Project plan of strategic facilities development for private sector(Prepared by private sector)
Infrastructure Development Plan for Regional Area Revitalization (prepared by respective prefectures)
Agenda (Prepared by the Land, Infrastructure and Transportation Minister)
Cooperation
Cooperation
Cooperation
=
Submitted to LIT Minister

─ 29 ─
○Development of basic infrastructure for growth covering wider area MLIT promotes basic infrastructure for growth covering wider area as follows to internalize the growth and dynamism overseas including East Asia while promoting inter regional liaison and exchange by improving the function as an Asian gateway.
・ Reinforcement of the function of hub ports
・ Improvement of accessibility by augmenting fl ights of air routes between regional airports resulting from re-expansion project of Haneda International Airport, etc.
・ Development of highways and railways for the access to airports/ports
・ Development of a network consisting of higher specifi cation roads to emphasize the inter regional cooperation/exchange
・ Robust promotion of new Shinkansen projects
[Comprehensive support for the autonomous regional planning within livelihood spheres]○Promoting creation of prosperity and dynamism in regional/ urban revitalization MLIT develops the following measures to promote urban revitalization while creating dynamism in regions.
・ Utilization of Community Renovation Grants
・ Revitalization of City Centers
・ Supports for the private urban development
・ Reinforcement of the measures against the Dense Urban District
・ Regional promotion by developing strategic location for exchange
・ Promoting development of Smart Interchanges on tolled highways
・ Promoting two area dwelling
・ Promoting reinforcement of business bases by construction sector expanding to new fi elds
Construction of International Level Logistics Network
“Ten-minute Access from Express Highway Ramp” Statusexpress way s to Strategic Airports and Ports
(“Strategic Airports/Ports)Subjected Airports: Class 1 Airports and Class 2
Airports with regular interna-tional flights
Subjected Ports: The designated ports and the specially-designated ports with annua l f r e igh t t r ansac t ion volume of 10 million tons or annual international freight transaction volume of 5 million tons or more, exclusive of ports without international cargo transporter service, international ferry service, or domestic unit service.)
Ten-minutes access currently available (as at 2005)(16 airports and 28 ports)
Ten-minute access to be installed within about ten year prospect (3 airports and 13 ports)
Other (1 airport and 6 ports)
Locations with scheduled ten-minute access completion (in FY2006-2009)Completion scheduled in FY2006: Yokkaichi PortCompletion scheduled in FY2007: Naha AirportCompletion scheduled in FY2009: Mizushima Port, Hiroshima Port
Projects for access highways to airports and ports with ten-minute access to be installed with in about ten year prospect, except for those with scheduled completion dates shown as above are also currently underway.
Designated national road
Express Highway
Otaru Port
Tomakomai Port
Kushiro Port
New Chitose AirportMuroran Port
Hakodate Airport
Hakodate Port
Aomori Port
Akita Airport
Nigata Airport
Nigara Port
FushikiToyama Port
Nagoya PortTsuruga Port
Osaka International AirPort
Kobe Port
Himeji Port
Uno Port
Mizushima Port
Fukuyama Port
Kure Port
Hiroshima Airport
Hiroshima Port
Iwakuni Port
Oita Airport
Ube Port
Shimonoseki Port
Kitakyushu Port
Kanda Port
Hakata PortFukuoka Airport
Nagasaki Airport
Kumamoto Airport
Hachinohe Port
SendaiShiogama Port
Sendai Airport
Onahama Port
Oarai Port
Chiba Port
Narita International Airport
Tokyo Port
Tokyo International Airport
Yokohama PortYokosuka Port
Kawasaki Kawasaki PortPortKawasaki Port
Shimizu Port
Mikawa Mikawa PortPortMikawa Port
Chubu Centrair International Airport
Yokkaichi Port
Osaka Port
Sakaisemboku PortKansai International Airport
WakayamaShimotsu Port
TokushimaKomatsu Port
Takamatsu Takamatsu PortPortTakamatsu Port
Takamatsu Airport
Kouchi Port
Toyo Port
Matsuyama Airport
Matsuyama PortMatsuyama PortMatsuyama Port
TokushimaTokushimaShimomatsu PortShimomatsu PortTokushimaShimomatsu Port
Oita Port
Beppu Port
Miyazaki Airport
Kagoshima Airport
Kagoshima port
Naha Airport

─ 30 ─
○Promotion of measures for transportation/logistics supporting the regional dynamism MLIT promotes the following measures for revitalization of transportation supporting regional dynamism, improvement in accessibility, and streamlining of the logistics.
・ Promotion of general transportation strategy in the urban/regional areas.
・ Improvement in urban railway network and revitalization of regional railway
・ Facilitating cargo companies to expand to the Third Party Logistics (3PL) projects
・ Establishment of urban logistics total plan.
Conceptual Chart of Comprehensive Transportation
Municipal BoundaryMunicipal BoundaryMunicipal Boundary
Urban AreaR
ailway
Inner City
P & RP & R : Park and Ride: Park and Ride
C & RC & R
T
P & R : Park and Ride
C & R : Cycle and Ride (Bike and Ride)
T : Transit Center
Railway platform providing cross-platform Railway platform providing cross-platform transfer to a different public transportationtransfer to a different public transportation
T : Transit Center: Transit Center
Railway platform providing cross-platform transfer to a different public transportation
T : Transit Center
Bus LRT
Introduction of LRTs & BRTs or other public Introduction of LRTs & BRTs or other public transportation facilitiestransportation facilitiesIntroduction of LRTs & BRTs or other public transportation facilities
LRTBRT
C & RC & R
P & RP & RT
C & R
P & RT TT
Station
Bus Only Lane
Development of Bikeways Community Bus
Busy Car-free Zone
Reorganization of Bus Routes Development
of BikewaysReorganization of Bus Routes
University
City Hall
Foundation Hospital
Car-free ZoneCar-free ZoneCar-free Zone
Development of Traffic Nodal PointsDevelopment of Traffic Nodal PointsDevelopment of Traffic Nodal Points
Framework of the Law on Revitalization and Reinstallation of Regional Public Transportation
Framework of the Law on Revitalization and Reinstallation of Regional Public Transportation Framework of the Law on Revitalization and Reinstallation of Regional Public Transportation Framework of the Law on Revitalization and Reinstallation of Regional Public Transportation
Agenda (Guide Line of National Government)
1. Preparation and implementation of Plans1. Preparation and implementation of Plans1. Preparation and implementation of Plans
Cities/Towns/Villages
Public Transportation Operators*
Road Administrators Port Administrators National Public
Safety CommissionResidents*
Commitment to respect the resolution Commitment to respect the resolution of the participants in the conferenceof the participants in the conferenceCommitment to respect the resolution of the participants in the conference
· Suggestion systems including plan preparation, etc.· Obligation to accept application for participation
in the conference(*Exclusive of the National Public Safety Commission and residents)
Comprehensive Coordination Project of the Regional Public Transportation
Building Consensus among the interested parties in a region by comprehensively evaluating the region for the purpose of revitalization and reinstallation of regional public transportation
Development of LRTsDevelopment of BRTsPromotion of the Omnibus Towns
Improvement in marine route transport service
Facilitation of transfers Reinstallation of Regional Railways
Others including:· Improvement in the public transportations for locals and sightseers.
· Activities to promote utilization by the region, etc.
Preferential measures in legislationPreferential measures in legislationPreferential measures in legislation
· Introduction of the “rolling stock operator / infrastructure administrator separation scheme” concerning the development of LRTs
Bond issuance authorization of the portion subsidized by municipalities concerning development of LRTs and BRTs, and promotion of the Omnibus Town· Exceptions in the other related laws and regulations
· Support for the planning costs· Prioritized distribution and consideration regarding the related budgets as much as practicable, etc.
Comprehensive support of the National Government
BudgetBudgetBudget etc.
2. Facilitation in introducing new forms of transportation method2. Facilitation in introducing new forms of transportation method2. Facilitation in introducing new forms of transportation methodStreamlining the procedures of authorization under related transportation operator laws and regulations, etc.
DMV (Dual-mode Vehicle)· Vehicles compatible with railways and roads
IMTS (Intelligent Multimode Transit System)
· A vehicle traveling both on the dedicated tracks with navigation by magnetic markers and on regular roads.
amphibious vehicle
etc.
etc.
Conference
*Railroad, Railways, Bus, Taxi, Passenger ship, etc.

─ 31 ─
○Promoting scenic city planning MLIT promotes the construction of favorable scenery, Scenic Byway, underground construction of electric wire, restoration of riparian scenery by utilizing the Landscape Act.
○Regional planning/ dwelling planning to respond to the aging society with fewer children MLIT promotes house planning for the comfort of households with senior citizens, newly married couple, and parents with children, as well as improvement in the livelihood quality by utilizing the Regional Housing Grants.
○Regional planning in liaison with residents in the region MLIT implements regional planning with a new concept of “New Public” that offers meticulous services in cooperation of public organizations and various private entities, and promotes activities for the maintenance and improvement of residential neighborhood by the residents, development and utilization of road/roadside space with participation of various entities, and furtherance of city planning with participation of residents and NPOs.
[Promoting tourism based country for more exchange of regional population] To promote tourism based country for more exchange of regional population, MLIT comprehensively develops both structural improvements and non-structural measures regarding the creation of attractive points of interests, promotion of foreign sightseers’ visits including aforesaid measures such as promoting creation of regional dynamism and scenic region.
○Creation of attractive points of interests MLIT promotes reinforcement of accessibility to the points of interests while promoting utilization of tourism renaissance projects and training of the personnel to be in charge of the creation of points of interests for the purpose of creating attractive points of interests.
○Promoting foreign visitors to Japan MLIT promotes upgrading of Visit Japan Campaign and development of facilities to accept foreign tourists to promote foreign visitors to Japan.
○Revitalization of tourism MLIT promotes “New Tourism” where emerging tourism demand and nature of tourism resources are taken into consideration.
Upgrading the Visit Japan Campaign
6.73 million people (2005)6.73 million people (2005)
17.40 million people (2005)17.40 million people (2005)The initial goal has been set to achieve 10 million foreign The initial goal has been set to achieve 10 million foreign travellers per annum visiting Japan by the year 2010.travellers per annum visiting Japan by the year 2010.
It is of great importance for Japan to make effort to be a tourism based country It is of great importance for Japan to make effort to be a tourism based country from the perception of international communication promotion and its economic from the perception of international communication promotion and its economic revitalization.revitalization.
6.73 million people (2005)
17.40 million people (2005)The initial goal has been set to achieve 10 million foreign travellers per annum visiting Japan by the year 2010.
It is of great importance for Japan to make effort to be a tourism based country from the perception of international communication promotion and its economic revitalization.
Strategic Transmissions (Exposures) of Japan as a Brand
Korea World Travel FairKorea World Travel Fair(June 2006)(June 2006)
Meeting of China, Japan, Rep. of Meeting of China, Japan, Rep. of Korea Travel MinistersKorea Travel Ministers
(July 2006)(July 2006)
Korea World Travel Fair(June 2006)
Meeting of China, Japan, Rep. of Korea Travel Ministers
(July 2006)
Expansion of business demand utilizing international conferences, cultural events, etc.
Promotion of tourism exchange expansion by Japan, China, Korea in liaison
Realization of big-ban in the tourism of Japan, China, and Korea)
Publicity activities promoting attractions in Japanese tourism by utilizing overseas media
Opening up emerging (prospective) markets(India, Russia, and Malaysia)
Assisting travel agencies overseas in developing attractive tour products visiting Japan
Objectively evaluate the projects and focus/place emphasis on the more effective projects
(Events accelerating international exchange)· Visa Issuance Coverage for Chinese Group Tourist
to Japan Expands to All the Corners of China.(Subjected Population has increased to 1,300 million, compared to 370 million in 3 cities and 5 states before the expansion)
2007Japan-China Exchange Year of Culture and Sports Thailand-JapanTourism Exchange Year Japan-India Tourism Exchange YearCanada-Japan Tourism Exchange YearWorld Chinese Entrepreneurs Convention/ 11th IAAF World Championships in Athletics (Osaka)No.2 Runway Starts Its Service at Kansai Int’l Airport
Large-scale Marketplace Large-scale Marketplace (YOKOSO! JAPAN Travel Mart) (YOKOSO! JAPAN Travel Mart)
(September 2006)(September 2006)
Reporting teams of Overseas Reporting teams of Overseas TV stations are invited to TV stations are invited to
produce programs on Japanese produce programs on Japanese tourism for broadcast.tourism for broadcast.
Large-scale Marketplace (YOKOSO! JAPAN Travel Mart)
(September 2006)
Reporting teams of Overseas TV stations are invited to
produce programs on Japanese tourism for broadcast.

─ 32 ─
[Development of condition for the regional revitalization] MLIT promotes integrated structural improvements and non-structural measures against disasters as a set, development of infrastructure for the comfortable living in regions, formation of quality housing stocks, furtherance of comprehensive barrier free policy, promotion of disadvantaged regions including isolated islands, peninsulas, and heavy snowfall areas, utilization of geographical space information, preparation of land registry, etc. as the precedents to the regional revitalization promotion.

Part II
Trends in MLIT Administration

─ 34 ─
Chapter 1: New MLIT Policies Accommodating the Needs of the Times
[Result-oriented policy development] MLIT implements its policies based on its performance that has been assessed in their PDCA (i.e. Deming cycle: Plan, Do, Check, Act.) Under its policy evaluation basic plan, MLIT implements policy assessment (i.e. ex ante valuation), policy checkup (i.e. performance measurement), and policy review (i.e. program evaluation) with respect to the policy performance evaluation. The project evaluation system for individual public works projects is already in place that integrates evaluation at project approval, reevaluation, and ex-post evaluation after project completion.
[Effi ciency and competitiveness-oriented policy initiative]○Promoting reform of the cost structure of public works projects MLIT is reviewing the whole processes of public works projects in terms of cost reduction under the ministry’s
“program of cost structural reform on public works projects,” which found 9.9% of overall cost reduction rate in FY 2005.
○Ensuring quality of public works and implementing appropriate tender contracts In view of the Law on Quality Assurance Promotion of Public Works, improvement in the overall evaluation methods, including trial introduction of the “Construction System Verifi cation Oriented Overall Evaluation Method” to the directly managed constructions and various supports relating to the outsourcing parties provided by the Regional Development Bureau to the municipalities, are implemented to better ensure the quality of public works. In addition, as a part of condition ordering for the ongoing efforts to enlarge open tender coverage and to improve comprehensive evaluation method, the bid bond scheme has been introduced for elimination of bad/ incompetent suppliers and increasing clerical tasks, to be gradually implemented in the future while observing the implementation status. The effort to eliminate so called “order intake at dumping price” has been further enforced considering its negative effect for the nation’s safety and healthy development of construction industry.
○Making effective use of the existing infrastructure stock and strategic facility management To implement strategic facility management, introduction of the asset management method which prolongs the useful lives of facilities while reducing life cycle cost by appropriate maintenance is deliberated in a horizontal liaison between facilities, at the same time introducing facility management method for the government buildings.
○Clearer information provision for consumers To retrieve nation's trust in housing/construction/public transportation as promptly as possible, it is effective to ensure security by means of transparent disclosure of negative information including penalty history and monitoring of the market, based on which a cross-sectoral evaluation of the way publication should be is under way.
Cost Structure Reform
Numerical Numerical TargetTarget
13.6% (21.3% after adjustments) 13.6% (21.3% after adjustments) reduction up to FY2002 reduction up to FY2002 (compared to FY1996)(compared to FY1996)
Numerical Target
Reduce by 15% in overall costs within 5 years (FY2003-2007) compared to average public works projects in FY2002(*before adjustments)
Efforts to reduce project costs
Further efforts
13.6% (21.3% after adjustments) reduction up to FY2002 (compared to FY1996)
* Follw up on year end results and numerical targets* Follw up on year end results and numerical targets* Follw up on year end results and numerical targets
6.1%6.1%6.1%
2003 2004 2005
1997 1998 1999 2000 2001 2002
5 years2007
9.9%
7.3%7.3%7.3% 15%
13.6%
In addition to present cost reduction in construction works, evaluate:1. Cost reduction in construction works by reviewing
specifications and standards2. Early realization of project benefits by speeding
up the project processes3. Reduction in administrative andmaintenance costs
─ 35 ─
○Reform of quasi-governmental corporations The Housing Loan Corporation is scheduled to be abolished as of April 2007 to organize Japan Housing Finance Agency supporting and supplementing the housing fi nancing of private fi nancial institutions. With respect to the Nippon Foundation, the “Bill Concerning the Amendment to the Motor Boat Racing Law” was submitted to the 166th session of the Diet, aiming at introduction of Designated Corporation Scheme, revision of subsidy scheme, etc.
○Overhaul of special accounting and tax revenues exclusively reserved for road construction The revision of special accounts have been scheduled for the integration of the special accounts of loans for road development, river improvement, port improvement, airport improvement, urban development into “Special Account for Social Capital Improvement Projects”, as well as integration of special accounts for motor vehicle liability insurance business and motor vehicle inspection and registration into “Special Account for Motor Vehicle Safety” within FY2008. Deliberations has been under way in reference to the “Law on Promotion of the Administrative Reform to Bring About a Simple and Efficient Government (Administrative Reform Promotion Law)” regarding overhaul of tax revenues exclusively reserved for road construction, resulting in a cabinet approval of “Practical Measures on Tax Revenues Exclusively Reserved for Road Construction” in December 2006.
[Establishing new relationships among national government, regional government and private sector]○New relationship between the National government and regions MILT is currently implementing reforms on subjects including improvement in regional initiative and discretion by replacing subsidies with grants. It is also promoting establishment of flexible standards/criterion to make appropriate options available for the regions in accordance with their own circumstances (i.e. introduction of the local rules.)
○Utilization of the creativity and ingenuity of private sector The number of projects with proactively promoted PFI method amounted to 57 cases implemented as MILT related projects as at the end of December 2006. The “Headquarter for Overhauling Regulation Reformation of MLIT” established in 2005, overhauled the regulation reformation and made a decision in March 2006 to implement 55 regulation reformations including installation of street bicycle parking lots under the scheme for long term occupancy of road property. On the other hand, designated structural reform districts are aggressively promoted as seen in the nationwide regulation reforms implemented with respect to 14 preferential measures refl ecting the accomplishments in the districts.
○Administrative operation open to the nation and promotion of interactive government 77 public projects had been implemented as at the end of December 2006 for the goal of “Guideline for the Resident Participation Procedure at the Planning Stage of Public Project under Control of MLIT.” In addition, “MLIT Hotline Station” set up to retrieve a broader knowledge of the nation’s opinions and demands and to develop administration directly connected to the nation has monthly average of almost 1,400 communications including opinions.
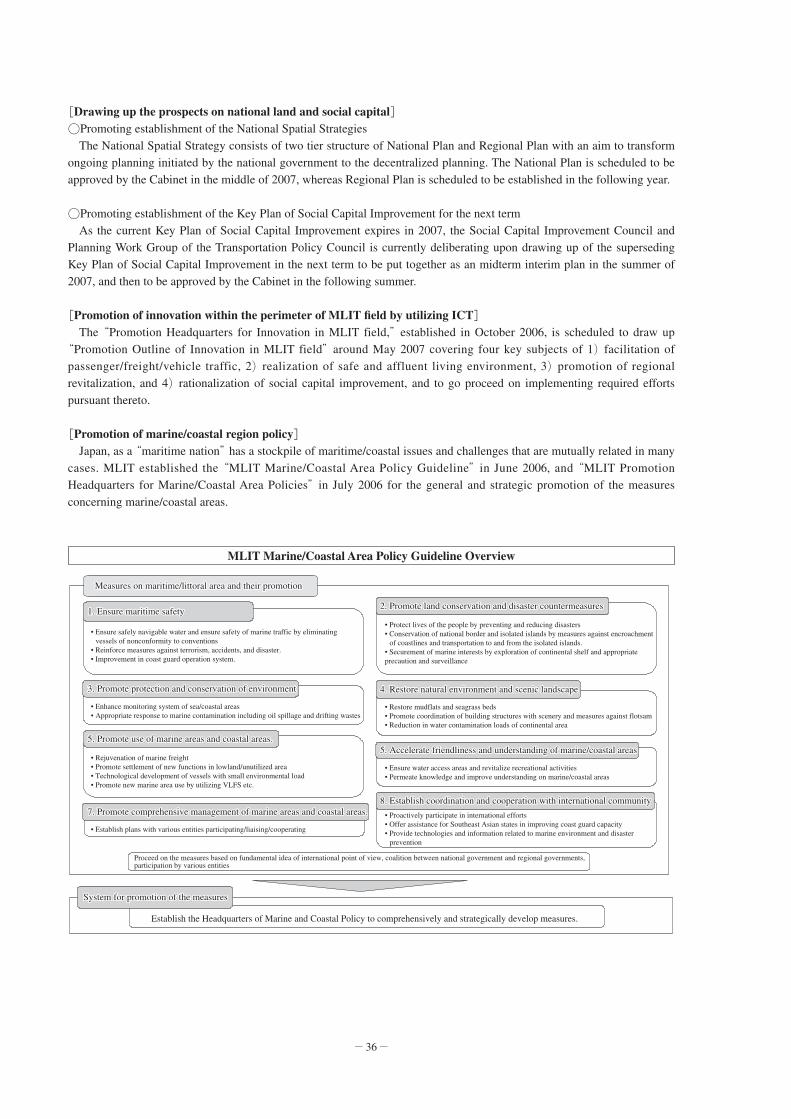
─ 36 ─
[Drawing up the prospects on national land and social capital]○Promoting establishment of the National Spatial Strategies The National Spatial Strategy consists of two tier structure of National Plan and Regional Plan with an aim to transform ongoing planning initiated by the national government to the decentralized planning. The National Plan is scheduled to be approved by the Cabinet in the middle of 2007, whereas Regional Plan is scheduled to be established in the following year.
○Promoting establishment of the Key Plan of Social Capital Improvement for the next term As the current Key Plan of Social Capital Improvement expires in 2007, the Social Capital Improvement Council and Planning Work Group of the Transportation Policy Council is currently deliberating upon drawing up of the superseding Key Plan of Social Capital Improvement in the next term to be put together as an midterm interim plan in the summer of 2007, and then to be approved by the Cabinet in the following summer.
[Promotion of innovation within the perimeter of MLIT fi eld by utilizing ICT] The “Promotion Headquarters for Innovation in MLIT field,” established in October 2006, is scheduled to draw up
“Promotion Outline of Innovation in MLIT field” around May 2007 covering four key subjects of 1) facilitation of passenger/freight/vehicle traffic, 2) realization of safe and affluent living environment, 3) promotion of regional revitalization, and 4) rationalization of social capital improvement, and to go proceed on implementing required efforts pursuant thereto.
[Promotion of marine/coastal region policy] Japan, as a “maritime nation” has a stockpile of maritime/coastal issues and challenges that are mutually related in many cases. MLIT established the “MLIT Marine/Coastal Area Policy Guideline” in June 2006, and “MLIT Promotion Headquarters for Marine/Coastal Area Policies” in July 2006 for the general and strategic promotion of the measures concerning marine/coastal areas.
MLIT Marine/Coastal Area Policy Guideline Overview
1. Ensure maritime safety1. Ensure maritime safety
3. Promote protection and conservation of environment3. Promote protection and conservation of environment
5. Promote use of marine areas and coastal areas.5. Promote use of marine areas and coastal areas.
7. Promote comprehensive management of marine areas and coastal areas.7. Promote comprehensive management of marine areas and coastal areas.
2. Promote land conservation and disaster countermeasures2. Promote land conservation and disaster countermeasures
4. Restore natural environment and scenic landscape4. Restore natural environment and scenic landscape
5. Accelerate friendliness and understanding of marine/coastal areas5. Accelerate friendliness and understanding of marine/coastal areas
8. Establish coordination and cooperation with international community8. Establish coordination and cooperation with international community
System for promotion of the measuresSystem for promotion of the measures
1. Ensure maritime safety
Measures on maritime/littoral area and their promotionMeasures on maritime/littoral area and their promotionMeasures on maritime/littoral area and their promotion
3. Promote protection and conservation of environment
5. Promote use of marine areas and coastal areas.
7. Promote comprehensive management of marine areas and coastal areas.
Proceed on the measures based on fundamental idea of international point of view, coalition between national government and regional governments, participation by various entities
2. Promote land conservation and disaster countermeasures
4. Restore natural environment and scenic landscape
5. Accelerate friendliness and understanding of marine/coastal areas
8. Establish coordination and cooperation with international community
System for promotion of the measures
Establish the Headquarters of Marine and Coastal Policy to comprehensively and strategically develop measures.
• Ensure safely navigable water and ensure safety of marine traffic by eliminating vessels of nonconformity to conventions
• Reinforce measures against terrorism, accidents, and disaster.• Improvement in coast guard operation system.
• Enhance monitoring system of sea/coastal areas• Appropriate response to marine contamination including oil spillage and drifting wastes
• Rejuvenation of marine freight• Promote settlement of new functions in lowland/unutilized area• Technological development of vessels with small environmental load• Promote new marine area use by utilizing VLFS etc.
• Establish plans with various entities participating/liaising/cooperating
• Protect lives of the people by preventing and reducing disasters• Conservation of national border and isolated islands by measures against encroachment
of coastlines and transportation to and from the isolated islands.• Securement of marine interests by exploration of continental shelf and appropriate precaution and surveillance
• Restore mudflats and seagrass beds• Promote coordination of building structures with scenery and measures against flotsam• Reduction in water contamination loads of continental area
• Ensure water access areas and revitalize recreational activities• Permeate knowledge and improve understanding on marine/coastal areas
• Proactively participate in international efforts• Offer assistance for Southeast Asian states in improving coast guard capacity• Provide technologies and information related to marine environment and disaster
prevention

─ 37 ─
Chapter 2: Realizing a Tourism-based Country of Beauty
[Tourism trends]○Signifi cance of establishing tourism-based country Tourism not only lends relaxation and colors to the lives of individual people, it also plays a key role in the growth of domestic economy, promotion of international understanding, and many other areas. MLIT is moving forward with two centerpieces of “strategic dissemination abroad of the Japan as a brand” and “creation of attractive points of interest/tourism” to realize a tourism based nation. “Tourism-based Country Promotion Master Plan” is going to be established pursuant to the “Tourism-based Country Promotion Basic Act” in effect as of January 2007.
○International/national tourism today The estimated number of foreign tourists visited Japan in 2006 surpasses 7 million for the first time in its history amounting to about 7.33 million. The estimated number of Japanese tourists visited locations abroad in the year is 17.54 million, thereby the international tourist traffi c is expected to hit all time high.
[Expansion of international tourism exchange]○Upgrading the Visit Japan campaign The Visit Japan Campaign is currently under operation with a goal to achieve 10 million foreign tourists visiting Japan per annum by 2010. Expansion of international exchange in tourism is promoted by various efforts including hosting the 1st Meeting of China, Japan, Rep. of Korea Travel Ministers in July 2006.
○Development of facilities to host foreign tourists visiting Japan System to provide information on points of interest is being developed, including information provision in the public transportation in foreign languages, while improving system of interpreter tour guides.
Shifts in Number of Foreign Tourists Visiting Japan and Number of JapaneseTourists Visiting Abroad
18,000
16,000
14,000
12,000
10,000
8,000
6,000
4,000
2,000
0
Population (in thousand persons)
1975 1980 1985 1990 1995 2000 2001 2002 2003 2004 2005 2006
Japanese International TouristsForeign Tourists Visiting Japan
17,535
6,728
7,334
1,317
2,327
3,345
4,757 4,7725,239 5,212
6,138
3,236
4,948
10,997
15,298
16,216
13,296
16,83117,404
16,523
17,819
812
3,909
2,466Visit Japan Campaign
Commenced (2003)
New Tokyo Int’l Airport opened
(1978)
Unrestricted passage from Taiwan (1979)
Plaza Accord; Tsukuba Expo (1985)
The yen skyrocketed (1993) (Yen per Dollar:
less than 100 JPY)
Gulf War (1991)
The dollar hit all time low of below 130JPY ; Seoul Olympics (1988)
Asian currency crisis (1997)
Unrestricted passage from South Korea (1989)
Kansai Int’l Airport opened (1994)
9.11 terrorist attack (2001)
World Cup Soccer in Japan and Korea
(2002)
Iraq War/ SARS outbreak (2003)
Haneda-Gimpo service Commenced (2003)
Expo 2005 in Aichi/ Chubu Int’l Airport
opened (2005)
(Year)
Notes: 1) “Foreign Tourists Visiting Japan” represents foreign nationals who entered Japan in the Ministry of Justice’s statistics less that of those residing in Japan, and that of foreign nationals who landed on Japan temporarily.
2) Both “No. of Japanese travelers overseas” and “No. of overseas visitors to Japan” for 2006 are estimates.Source: Data of the Ministry of Justice
Prime Minister Abe inviting foreign tourists to Japan in a promotion video footage

─ 38 ─
[Creation of attractive points of interest/tourism] In support of a variety of activities implemented for the planning of points of interests attracting tourists from inside/outside of the country, efforts are taken to utilize Japanese culture and industrial legacy as tourism resources, and to upgrade tourism at the same time promoting tourism renaissance. In addition, “Statistical Survey on Lodging and Travel" was commenced as of March 2007 to be utilized in planning and verifi cation of policies on tourism. Travel environment of the nation is further developed by implementing promotion of tourism based upon the idea of universal design.
[Developing scenic landscapes and other aesthetic land planning]○Developing good landscapes In June 2005, the“Three Laws on Landscape and Greenery”went into full force. The number of landscape administrative organizations under the Landscape Law increased to 249 as at December 2006, whereas 23 organizations have established landscape plans. To promote infrastructure development that pays adequate attention to landscapes, MLIT is piloting a landscape assessment system for some of the projects under the ministry’s direct jurisdiction or management.
○Development of attractive landscapes the public can be proud of As a matter of principle, MLIT ensures that projects under its jurisdiction contribute to landscape development, in line with which the ministry formulated and announced landscape development guidelines for government buildings, urban development, roads, rivers, sediment control, coasts, residences and buildings, ports, and improvement projects for aids to navigation by the end of FY2006. MLIT is also moving forward with the cosmetic removal of power poles based on the 2004-2008 “Plan to Dispense with Power Poles.” MLIT is also promoting the “Scenic Byway Japan” project, for which the “Scenic Byway Japan Strategic Council” was established with knowledgeable individuals and corporate executives in December 2005 to consider and establish the principle, system, and scheme of the project.
Areas Selected for the Tourism Renaissance Subsidizing Scheme and Practical Plan for Tourist Destination Development
37
32323233
30
29
27
25252526
28
24
232323
22
212121
18
14
13
19
111111
16
101010
98
7
6
54
1 2
3
34 363636
17
35
20
31
151515
12
35
Katori City (Former Sahara City)
Taito Word/ Sumida Word
Fuji-Kawaguchiko City
Toba City
Tanabe City & Five other cities and towns
Beppu City
Aso City and Four other municipalities
Murakami City
Sakata City
Kusatsu City
Osaka City
Kaga City
Matsuyama City
Kurashiki City
Hida City
Kyoto City
• • •
• • •Areas eligible for the Tourism Renaissance subsidy (19 areas)
Areas selected for the practical plan for creating tourism destinations (37 areas)
Sasebo City
Kushiro city (former Akan Town)Furano City
1. Shiribeshi district council for tourism exchange promotion in broad-based partnership (Hokkaido)
2. Furano City council for international tourism promotion (Hokkaido)3. Ozora town council for tourism and town development promotion
(Hokkaido)4. Akita-Iwate council for tourism exchange promotion in broad-based
partnership (Akita and Iwate)5. Omonogawa river council for tourism exchange and local revitalization
(Akita)6. Circum-Chokai region council for tourism exchange promotion (Akita and
Yamagata)7. Mogami river basin council for tourism exchange promotion (Yamagata)8. Aizu council for tourism exchange promotion in broad-based partnership
(Fukushima)9. Iwaki-Kitaibaraki-Takahagi broad-based tourism promotion council
(Fukushima and Ibaraki)10. Hitachi and Fusa “joint-up” project promotion council (Chiba and Ibaraki)11. West sagami district council for tourism exchange promotion (Kanagawa)12. Shinetsu region council for tourism exchange promotion (Niigata and
Nagano)13. Noto Peninsula council for tourism exchange promotion in broad-based
partnership (Ishikawa)14. Kaga City council for tourism exchange promotion (Ishikawa)15. Mt.Fuji Four Lakes region council for tourism exchange promotion in
broad-based partnership Shinshu Azumino council for tourism network promotion (Nagano)
16. Komagane City council for planning city of hospitality (Nagano)17. Shinshu-Azumino tourism network promotion council (Nagano)18. Nihon Rhine broad-based tourism promotion council (Aichi and Gifu)19. Izu district council for tourism promotion (Shizuoka)20. Arimatsu Okehazama council for the advancement of tourism and creation of
tourist areas (Aichi)21. Ise-Futami region council for tourism exchange promotion (Mie)22. Shrine and pilgrimage road in Kii mountains council for tourism exchange
place promotion in broad-based partnership (Mie, Nara and Wakayama)23. Kyoto-Otsu-Uji region council for tourism exchange promotion in broad-based
partnership (Shiga and Kyoto)24. Tango council for tourism exchange promotion in broad-based partnership
(Kyoto)25. Takarazuka City customer traffic exchange promotion council (Hyogo)26. Tottori “grand design” council for tourism strategies promotion (Tottori)27. Oki-dougo district council for tourism exchange promotion in broad-based
partnership (Shimane)28. Hagi-Masuda-Tsuwano region council for tourism exchange promotion in
broad-based partnership (Shimane and Yamaguchi)29. East Seto inland sea council for tourism (Okayama and Kagawa)
30. Unexplored Shikoku Central-Miyoshi tourism exchange promotion council (Tokushima)
31. Konpira region council for tourism promotion through town development (Kagawa)
32. South Iyo district council for tourism exchange promotion in broad-based partnership (Ehime)
33. Shimanto river broad-based tourism promotion council (Kouchi)34. Nakatsu-Buzen-Chikujo prefectural border area council for tourism exchange
promotion in broad-based partnership (Fukuoka and Oita)35. Unzen City tourism council (Nagasaki)36. Usa-Kunishaki Peninsula council for tourism exchange promotion in broad-based
partnership (Oita)37. Miyako district council for tourism exchange promotion in broad-based
partnership (Okinawa)
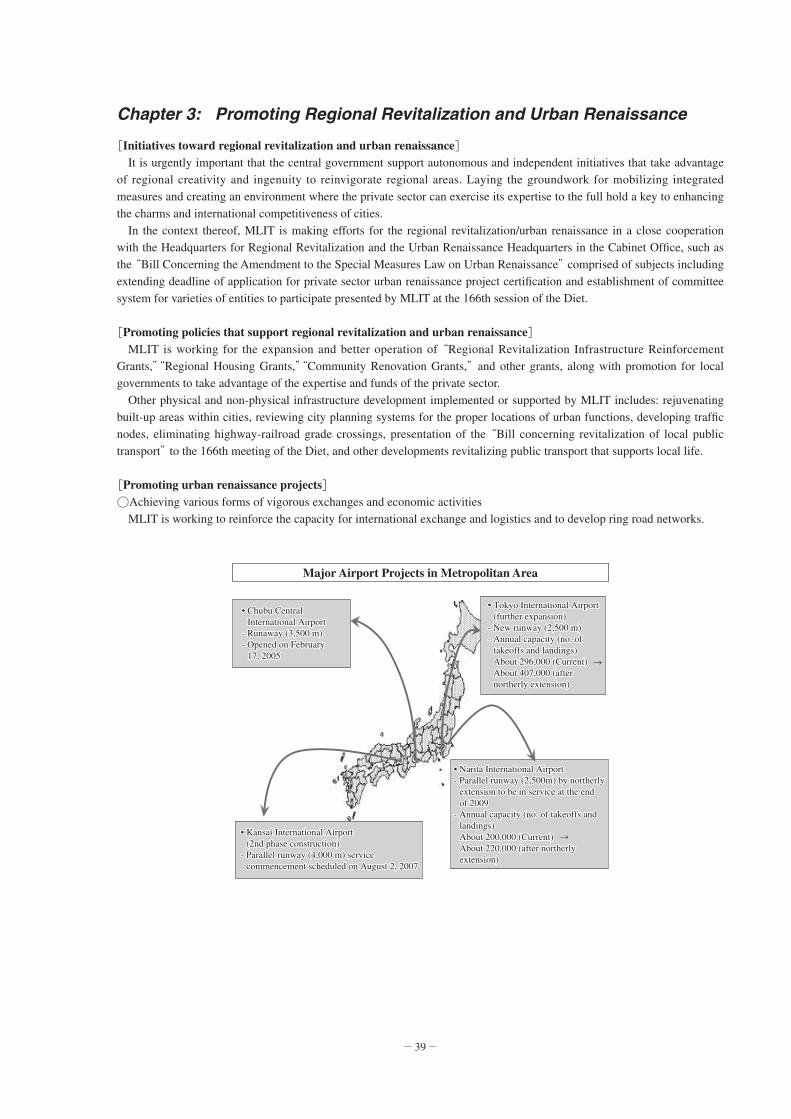
─ 39 ─
Chapter 3: Promoting Regional Revitalization and Urban Renaissance
[Initiatives toward regional revitalization and urban renaissance] It is urgently important that the central government support autonomous and independent initiatives that take advantage of regional creativity and ingenuity to reinvigorate regional areas. Laying the groundwork for mobilizing integrated measures and creating an environment where the private sector can exercise its expertise to the full hold a key to enhancing the charms and international competitiveness of cities. In the context thereof, MLIT is making efforts for the regional revitalization/urban renaissance in a close cooperation with the Headquarters for Regional Revitalization and the Urban Renaissance Headquarters in the Cabinet Offi ce, such as the “Bill Concerning the Amendment to the Special Measures Law on Urban Renaissance” comprised of subjects including extending deadline of application for private sector urban renaissance project certifi cation and establishment of committee system for varieties of entities to participate presented by MLIT at the 166th session of the Diet.
[Promoting policies that support regional revitalization and urban renaissance] MLIT is working for the expansion and better operation of “Regional Revitalization Infrastructure Reinforcement Grants,”“Regional Housing Grants,”“Community Renovation Grants,” and other grants, along with promotion for local governments to take advantage of the expertise and funds of the private sector. Other physical and non-physical infrastructure development implemented or supported by MLIT includes: rejuvenating built-up areas within cities, reviewing city planning systems for the proper locations of urban functions, developing traffi c nodes, eliminating highway-railroad grade crossings, presentation of the “Bill concerning revitalization of local public transport” to the 166th meeting of the Diet, and other developments revitalizing public transport that supports local life.
[Promoting urban renaissance projects]○Achieving various forms of vigorous exchanges and economic activities MLIT is working to reinforce the capacity for international exchange and logistics and to develop ring road networks.
Major Airport Projects in Metropolitan Area
• Chubu Central • Chubu Central International AirportInternational Airport
- Runaway (3,500 m)- Runaway (3,500 m)- Opened on February - Opened on February
17, 200517, 2005
• Kansai International Airport • Kansai International Airport (2nd phase construction)(2nd phase construction)
- Parallel runway (4,000 m) service - Parallel runway (4,000 m) service commencement scheduled on August 2, 2007commencement scheduled on August 2, 2007
• Narita International Airport• Narita International Airport- Parallel runway (2,500m) by northerly - Parallel runway (2,500m) by northerly
extension to be in service at the end extension to be in service at the end of 2009of 2009
- Annual capacity (no. of takeoffs and - Annual capacity (no. of takeoffs and landings)landings)About 200,000 (Current) About 200,000 (Current) About 220,000 (after northerly About 220,000 (after northerly extension)extension)
• Tokyo International Airport • Tokyo International Airport (further expansion)(further expansion)
- New runway (2,500 m)- New runway (2,500 m)- Annual capacity (no. of - Annual capacity (no. of
takeoffs and landings)takeoffs and landings)About 296,000 (Current) About 296,000 (Current) About 407,000 (after About 407,000 (after northerly extension)northerly extension)
• Chubu Central International Airport
- Runaway (3,500 m)- Opened on February
17, 2005
• Kansai International Airport (2nd phase construction)
- Parallel runway (4,000 m) service commencement scheduled on August 2, 2007
• Narita International Airport- Parallel runway (2,500m) by northerly
extension to be in service at the end of 2009
- Annual capacity (no. of takeoffs and landings)About 200,000 (Current) About 220,000 (after northerly extension)
• Tokyo International Airport (further expansion)
- New runway (2,500 m)- Annual capacity (no. of
takeoffs and landings)About 296,000 (Current) About 407,000 (after northerly extension)

─ 40 ─
Functional Reinforcement of International Airports and Ports
Improved accessibility from the arterial road network
Improved operating rate
High specification container terminal
Open 24 hours a day including public services
One-stop service for import/export/other port procedures
Port logistics information system platform
Enhancement of port security measures
International Comparison of Metropolitan Ring Expressway Networks
Paris LondonMetropolitan Area Berlin
Ring toll highways in servicePlanned ring toll highwaysOther toll highwaysOther highways
Length as at the survey conducted in March 2006Population as at the survey conducted in March 2005
Population: 28.57 millionPopulation density 4,459 per sq. km.
Source: MLIT
521 km
180 km
35%
Planned length:
Length currently in service:
Installation completion rate:
Ring toll highways in servicePlanned ring toll highwaysOther toll highwaysOther highways
Length as at the survey conducted in March 2006Population as at the survey conducted in 1999
Population: 8.61 millionPopulation density 4,482 per sq. km.
Source:Length: Regional Road and Infrastructure Planning division, Île-de-France
313 km
262 km
84%
Planned length:
Length currently in service:
Installation completion rate:
Ring toll highways in servicePlanned ring toll highwaysOther toll highwaysOther highways
Length as at the survey conducted in March 2003Population as at the survey conducted in 2004
Population: 9.06 millionPopulation density 2,208 per sq. km.
Source:Length: Department of Transport
188 km
188 km
100%
Planned length:
Length currently in service:
Installation completion rate:
Ring toll highways in servicePlanned ring toll highwaysOther toll highwaysOther highways
Length as at the survey conducted in 2006Population as at the survey conducted in 2003
Population: 4.19 millionPopulation density 994 per sq. km.
Source:Length: MAXIATLAS 2006/2007, Autobahn HP
222 km
216 km
97%
Planned length:
Length currently in service:
Installation completion rate:

─ 41 ─
○Making cities for safer life MLIT aims to further develop key broad-based disaster prevention bases that serve as the center for disaster prevention activities covering many local governments. The ministry also focuses on rebuilding safe and secure cities through coordination between anticrime measures and community building initiatives.
○Building a favorable urban environment MLIT is promoting city makeovers to zero emissions of waste in metropolitan areas, revitalization of urban environment infrastructure, and improvement of Lake Biwa and the Yodo River basin environment.
○Promoting urban development initiatives by private sector The number of “the Prompt Development Area for Urban Renaissance” under the “Special Measures Act for Urban Renaissance” to be developed as the center of urban renaissance in the fi rst opportunity amounted to total 64 designated areas where various urban development initiatives by the private sector are under way (as at the end of December 2006) in Tokyo, Osaka, and other Designated Cities and/or Prefectural Capital Cities.
○Flexible budget allocations promoting urban renaissance Flexible allocation measures of budgets including the Urban Renaissance Project Promotion Budget are available throughout a fi scal year to facilitate effective project implementation by various government offi ces.
Private Urban Renaissance Projects in the “Prompt Development Area for Urban Renaissance”
[Nagoya Chigusa and Tsuruma areas]• Chigusa 2-Chome (Interim Title) District
Community Development Project(Completed in May 2005)
[Area around Nagoya Station, Fushimi, and Sakae areas]
° Meieki 4-Chome District{• Meieki 4-Chome Block 7 District
Community Building Construction Project (interim title)}(Completed in March 2007)
° Meieki 4-Chome Block 27 District[Area around Osaka Station, Nakanoshima, Midosuji and surrounding areas]
° Shinsaibashisuji 1-Chome District ° Umeda 2-Chome District
° Yodoyabashi District ° Kakudacho District ° Osaka Station District
° Nishihonmachi 1-Chome District
[Namba and Minato-town areas]• Namba Parks 2nd Term program (Completed in March 2007)
[Takatsuki Station and surrounding areas]
° Daigaku-town District
[Sakai Oceanfront area]• Sakai District 2 Seaside
Area Development Program (Completed in March 2006)
[Gifu Station North, Yanagase-dori, and surrounding areas]
° Hinode-town 2-Chome District
[Sapporo Station, Odori Station, and surrounding areas]
° North 3 West 4 District
[Area around Kawaguchi Station]• Development Program for the
Former Site of the Sapporo Beer Saitama Factory (Ribbon City)(Completed in September 2006)
[Beltline #2 area around Shimbashi, Akasaka, and Roppongi areas]
• Minami-Aoyama 1-Chome Apartment Complex Reconstruction Project(Completed in March 2007)
[Tokyo Station, Yurakucho Station, and surrounding areas]• (Interim Title) Tokyo Station Yaesu Exit Development Program
(To be completed in March 2011)
° Marunouchi 1-1 District ° Otemachi District ° Marunouchi 2-1 District• (Interim Title) Otemachi District Phase 1 Redevelopment Program
(To be completed in March 2009)• Reconstruction of Mitsubishi Corp. /Furukawa/Marunouchi-yaesu Buildings
(To be completed in April 2009)
[Beltline #2 area around Shimbashi, Akasaka, and Roppongi areas]• Tokyo Midtown Project (Completed in December 2006)• (Interim Title)TBS at Akasaka 5 Cho-me Development Program
(To be completed in January 2008)
[Akihabara and Kanda areas]• (Interim Title) UDX Building Plan (Akihabara 3-1 block)(Completed in March 2006)
[Tokyo Oceanfront area]• Tokyo Waterfront Sub-center Ariake Minami LM 2 and 3 Blocks Redevelopment
Program (Completed in August 2006)• Harumi 2-Chome District Urban Revitalization Program
(To be completed in November 2011)• Kachidoki 6-Chome District First-Class Urban Area Redevelopment Program
(To be completed in January 2008)• (Interim Title) Fuji Television at Waterfront Subcenter Studio Project
(Completed in March 2007)• Toyosu 2 Cho-me Blocks 4-1 and 6 Industrial Complex Construction Project
(Completed in August 2006)
• Certificated urban renaissance projects (24 projects)
° Special District for Urban Renaissance (22 districts)
[Yokohama Yamanouchi Wharf area]
° Yamanouchi Wharf and surrounding areas
[Area around Kawasaki Station]• (Interim Title) Kawasaki
Station West Exit Horikawacho District Development Program(Completed in March 2007)
[Sendai Station West and Ichibancho areas]
° Ichibancho 3-Chome South District
[Moriguchi-Dainichi area]• Sanyo Electric - Dainichi District
Development Plan(Completed in September 2006)
[Area around Hiroshima Station]
° Block 1/2 of Wakakusa-cho
[Fukuoka-Tenjin and Watanabe-dori areas]• New Tenjin Underground Shopping Arcade Construction
Program (Completed in June 2005) [Kobe Sannomiya South area]
° Sannomiya Station District 1{• Sannomiya Station District 1 Urban
Revitalization Program}(Completed in November 2006)
[Yokohama Minato Mirai Area]• Minato Mirai 50th Block W district Development Project
(To be completed in July 2008)
[Area around Takamatsu Station and Marugame-town areas]
° Takamatsu Marugame-town Shopping Mall“A” and Uchimachi Blocks
• Takamatsu Marugame-town Shopping Mall Revitalization by Private Sector Project(To be completed in April 2008)
[Area around Shinjuku Station]
° Nishi-shinjyuku 1 Cho-me, Block 7
[Area around Osaki Station]
° Osaki Station West Exit “E” East District{• (Interim Title) Osaki West Exit Development Plan}(To be completed in August 2007)
° Osaki Station West Exit “A” District

─ 42 ─
Chapter 4: Setting the Stage for an Independent and Vibrant Life
[Realization of a barrier-free society based on the concept of universal design] The society of universal design is addressed to be realized by improving in both structural and non-structural aspects as the “Law for Promoting Barrier-free Transport and Facilities for the Elderly and the Disabled (New Barrier-free Law)” has entered into force as of December 2006.
[Development of parenting environment in the society with declining birth rate (Nesting Aid)] MLIT is making efforts in developing environment without any obstacles for children's growth, such as support in obtaining residence befi t to newly married couples and parents with children, development of safe pedestrian spaces, and furtherance of safety measures in the city parks, as well as in providing support to join workforce at the same time being a mother, including promotion of telework and child support transportation service.
Percentage of Barrier-free Facilities in Public Transportation
Number of Accreditations under the Accessible and Usable Building Law
FY: 1994 1995 1996 1997 1998 1999 2000 2001 2002 2003 2004 2005FY total 11 120 229 320 382 366 332 232 280 367 386 345
Cumulative total 11 131 360 680 1,062 1,428 1,760 1,992 2,272 2,639 3,025 3,378Source: Ministry of Land, Infrastructure and Transport Japan
As at March 31, 2006
○Transportation system facilities (with daily average total of users being 5,000 or more)
TotalFacilities in conformity with transport
accessibility improvement standard (Note 1)Proportion in
totalRailway/tramway stations 2,771 1,560 56.3%Bus terminals 44 33 75.0%Passenger ship terminals 7 5 71.4%
Airport terminals 23 10 43.5%
(100%) (Note2)1) Total of those in conformity with the transport accessibility improvement standard (in relation to the width of passageways, slopes, escalators,
elevators, etc.) as stipulated in Article 4 of the Transport accessibility improvement Law.
2) All the airport terminals are equipped with elevators, escalators and slopes accessible to the disabled as at the end of March 2001.
○Vehicles, etc.
Total of vehicles, etc.
Facilities in conformity with transport accessibility improvement standard
Proportion in total
Railway/tramway rolling stocks 51,595 16,586 32.1%Buses 57,739
Low-deck buses 16,237 28.1%Non-step buses 8,639 15.0%
Passenger vessels 1,131 90 8.0%Airplanes 483 227 47.0%

─ 43 ─
[Responding to the aging society] In addition to the efforts to develop a safely habitable environment for the senior citizens, MLIT is striving to provide transportation service to address aged society as evidenced in the entry into force of the “Revised Road Transportation Law” entered into force as of October 2006 creating a registration system enabling NPOs and other entities to provide paid welfare transportation and paid transportation in depopulating area.
[Providing quality housing]○Promotion of the Basic Program for Housing (National Plan) The “Basic Act for Housing” was enacted in June 2006 followed by the approval of the Basic Program for Housing
(National Plan) in September by the Cabinet. MLIT is currently working on the development of quality housing stocks and their inheritance to the future generation, development of environment for housing market where various habitation demands are realized, and securement of housing stability for those with signifi cant requirement of housing stability.
○Promotion of favorable housing supply MLIT is making efforts for effective use of fi xed term lease on land and the revitalization of “new towns.”
International Comparison of Existing Home Sales
Existing homes for sale Share of existing home sales (Existing home/ Existing home + Newly built home)
0
1
2
3
4
5
6
7
8(in %)
0%10%20%30%40%50%
60%70%80%90%100%
Japan US UK France
6.78
1.79
0.780.18
77.6%77.6%77.6%
88.8%
66.4%
13.1%
Notes: 1) The number of newly built homes in 2003 (Japan,) 2004 (US/UK,) or 2005 (France) is used in the calculation.Notes: 1) The number of existing homes in 2003 (Japan,) 2004 (US/UK,) or 2000 (France) is used in the calculation.Sources) Japan: New Dwellings Started (FY2004) MLIT, , 2003 Housing and Land Survey, Ministry of Public Management, Home Affairs, Posts
and Telecommunications (MPHPT) US: Statistical Abstract of the U.S. 2006 UK: Communities and Local Government Website (http://www.communities.gov.uk/) France: Ministry of Transportation, Facilities, Tourism and Ocean (http://www.equipement.gouv.fr/)
(in million units)

─ 44 ─
[Realizing comfortable living]○Sewerage development MLIT is working for the upgrading functions and improvement in the maintenance of sewage facilities while promoting dissemination of waste water disposal by sewage.
○Development of city parks, etc. Development of city parks is promoted while improving the functionalities benefi cial to achieve comfortable residential experience.
○Stable supply of water resources MLIT is ensuring constant water availability under the extremely disadvantageous meteorological/geographical conditions of Japan.
○Promotion of road planning prioritizing pedestrians/bicycles MLIT is promoting street guides utilizing the street names and installation of multilingual street maps/signs while working to construct the Life Road Zones, bilking tours, and pedestrian areas. On the other hand, MLIT presented “Bill Concerning the Amendment to the Special Measures Law on Urban Renaissance” at the 166th session of the Diet to construct fl exible road management scheme that better match the needs of the municipalities and residents regarding roads.
[Realizing more convenient transportation] MLIT is making efforts to revitalize Traffi c Demand Management (TDM) and public transportation while promoting comprehensive traffi c strategy in cities and regions. Furthermore, MLIT is developing urban railways, urban monorails/ automated guideway transits, and light rail transit (LRT) systems as well as improving bus/taxi accessibility.
Sewerage Coverage in Municipalities of Different Population Scales (as at the end of FY2005)
100
100%
Population
Total population(in million people)
Over 1 million 0.5-1 million
0.3-0.5 million 0.1-0.3 million 50,000-100,000 less than 50,000 Total
26.19 10.76 17.79 30.45 19.62 22.25 127.06
90
80
70
60
50
40
30
20
10
National Average: 69.3%
98.3%98.3%
80.8%80.8%76.8%76.8%
67.7%67.7%
53.8%53.8%
39.3%39.3%
98.3%
80.8%76.8%
67.7%
53.8%
39.3%
96%94%
90%
81%
68%
Coverage estimated after the completion of current prefectural plans: 88%
People with sewage access in prospect
People with current access to sewage
Source: Ministry of Land, Infrastructure and Transport Japan

─ 45 ─
[Utilization of ICT]○Developing location information systems using ubiquitous technologies Since FY2004, MLIT has been promoting the “Free Mobility Project,” which makes use of Japan’s advanced ubiquitous network technology, through the coordination and cooperation of industry, government, academic institutions, and citizens. It is going to further explore the multifaceted application of ubiquitous location information systems as a new kind of social infrastructure.
○ICT promotion in transportation fi eld MLIT is implementing ICT in the public transportation fi eld such as development of public transportation information system upon emergency situations, at the same time promoting the Intelligent Transportation System (ITS) including support for upgrading of service by utilization of map information.
○Realization of “Digital Japan” MILT is promoting the digitization and provision of geographic information to realize “Digital Japan.”
○Realization of Electronic Government MLIT is promoting the facilitation of online usage, one-stop service for procedures associated with automobile ownership, and electronic bidding and contract procedures.
○Optical fi ber networks for public facility management and development/offer of their space for network installation MLIT is promoting optical fiber networks for public facility management and development/offer of their space for network installation of private operators.
Development of Public Transportation Information System upon Emergency
Liaise with private sector
Provide the latest, unified, and real-time service information of public transportation upon emerging aggravated catastrophic disastersInformation provision for passengers via cell phones/DTTV (also utilizing 1seg and other latest ICTs)Start with deliberation with interested parties upon information collection/provision methods to realize the promptest completion of the system
Current Status
Service information of public transportation upon emergency is not real-time for passengers.
Provision by private sector has limitations in comprehensiveness and synoptic property
Cross-modality not implementedInsufficient alternate transit information
Public transportation information system
MLIT
RailwaysPassenger
vesselsBusesAviation
Public transportation information Public transportation information reported to MLIT upon reported to MLIT upon
emergency outbreakemergency outbreak
Public transportation information reported to MLIT upon
emergency outbreak
Cross-modal informationCross-modal informationCross-modal information
Real-timeReal-timeReal-time
[website] [website for cell phones/1seg]
Passengers
Information provided for passengers
· operation information· delay information· alternate transit information etc.
Real-time provision with various methods
· Mobile sites, PC websites· DTTV(1seg, etc.)· direct emails etc.

─ 46 ─
Chapter 5: Forging Open Economic Society with a Competitive Edge
[Improvement in transportation networks]○Developing highways Lagging behind the U.S. and European countries in terms of the level of highway development, Japan is facing a requirement to promptly build highway networks, especially high standard highways, for the development of safe and secure national land.
○Developing the trunk railway network MLIT has been committed to the construction of new Shinkansen lines based on the agreement between the government and ruling party while promoting speedups of conventional artery railways and the technological development of a superconducting magnetically levitated train and Variable gauge train.
Seibi-Shinkansen Today
• Hokkaido Shinkansen Line Shin-aomori – Shin-Hakodate To be completed by the end of FY2015
• Tohoku Shinkansen Hachinohe – Shin-aomori To be completed by the end of FY2010
• Hokuriku Shinkansen Nagano – Kanazawa (Hakusan General Rail yard) To be completed by the end of FY2014Fukui Station To be completed by the end of FY2008
• Kyushu Shinkansen (Kagoshima Route) Hakata – Shin-yatsushiro To be completed by the end of FY2010
• Kyushu Shinkansen (Nagasaki Route) Takeo-onsen - Chihaya To be commenced as soon as
adjustment completion
Hokkaido Shinkansen Line
• Shin-hakodate - Sapporo
Tohoku Shinkansen
• Hachinohe – Shin-aomori To be completed at the end of FY 2010
[211km]
[149km]
[82km]
Service commenced in Dec. 2002Morioka
HachinoheShin-aomori
Shin-hakodate
Sapporo
• Nan-etsu - Tsuruga
• Fukui Station To be completed at the end of FY 2008
[31km]• Kanazawa - Nanetsu
*Super express for Isurugi – Kanazawa stretch Full StandardTo be completed at the end of FY 2014To be completed at the end of FY 2014To be completed at the end of FY 2014
[86km]
Niigata
KanazawaHakusan General Railyard
IsurugiFukui
NanetsuTsuruga
Toyama
NaganoTakasaki
Service commenced in Oct. 1997
OmiyaTokyo
Kyushu Shinkansen (Nagasaki Route)
• Takeo-onsen - Chihaya Free-Guage Train (Super Express)
[45 km]
• Isahaya - Nagasaki (Super Express) [21km]
Nagasaki
HakataTakeo-onsenTakeo-onsenTakeo-onsenIsahaya
Kyushu Shinkansen (Kagoshima Route)
• Hakata – Shin-yatsushiro
To be completed at the end of FY 2010
[130km]
Shin-tosuShin-tosuShin-tosu
Shin-yatsushiro
Kagoshima-chuoService commenced in March 2004
LegendsCompleted SectionSections under constructionSections with constructions commencingSections with construction not commenced (construction application pending) Sections with construction not commenced (construction application not submitted)
• Shin-aomori − Shin-hakodate To be completed at the end of FY 2015
Hokuriku Shinkansen
[68 km]• Toyama - Kanazawa
[170 km]• Nagano - Toyama
Osaka
Stretch for development negotiated between the National Government and the ruling party
Comparison between Toll Highway Development Levels of Countries
1983 85 90 95 2000 05
(in kilometers)
US(+10,886km)
China(+41,005km)
France(+5,376km)
Germany(+4,094km)
Japan(+3,954km)
(Year, Fiscal Year)
45,000
40,000
35,000
30,000
25,000
20,000
15,000
10,000
5,000
0
Notes 1) Japan: total as at the end of FYsUS, France, Germany, and China: total as at the end of calendar years(CY or FY)
2) The total for Japan is the total of national express highways.Sources: US: Highway Statistics
France: Reference of SETRA, Ministry of Facilities websiteGermany: Verkehr in Zahlen 2005/2006,Verkehr in Zahlen 1998China: National Transportation Yearbook, and Reference of the
Ministry of Land, Infrastructure and Transportation of ChinaJapan: Ministry of Land, Infrastructure and Transport Japan
Length as at 1983US: 80,534kmFrance: 5,467kmGermany: 8,080kmChina: 0kmJapan: 3,435km
Length in recent yearsUS: 91,420km (2004)France: 10,843km (2005)Germany: 12,174km (2004)China: 41,005km (2005)Japan: 7,389km (2005)
Total Length of Installed H
ighway
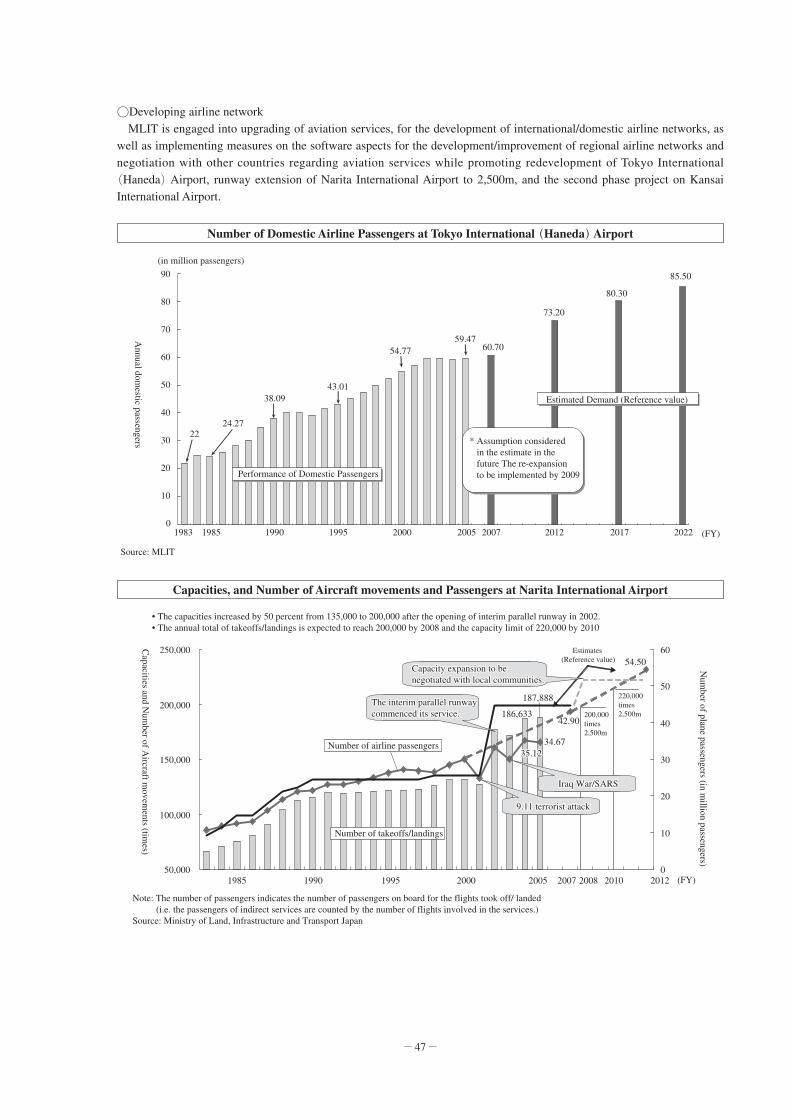
─ 47 ─
○Developing airline network MLIT is engaged into upgrading of aviation services, for the development of international/domestic airline networks, as well as implementing measures on the software aspects for the development/improvement of regional airline networks and negotiation with other countries regarding aviation services while promoting redevelopment of Tokyo International
(Haneda) Airport, runway extension of Narita International Airport to 2,500m, and the second phase project on Kansai International Airport.
Number of Domestic Airline Passengers at Tokyo International (Haneda) Airport
Annual dom
estic passengers
0
10
20
30
40
50
60
70
80
90
(in million passengers)
Performance of Domestic Passengers
* Assumption considered in the estimate in the future The re-expansion to be implemented by 2009
Estimated Demand (Reference value)
59.47
38.09
2224.27
43.01
85.50
80.30
73.20
54.77 60.70
1983 1985 1990 1995 2000 2005 2007 2012 2017 2022 (FY)
Source: MLIT
Capacities, and Number of Aircraft movements and Passengers at Narita International Airport
• The capacities increased by 50 percent from 135,000 to 200,000 after the opening of interim parallel runway in 2002.• The annual total of takeoffs/landings is expected to reach 200,000 by 2008 and the capacity limit of 220,000 by 2010
50,000
100,000
150,000
200,000
250,000Capacities and N
umber of A
ircraft movem
ents (times)
Capacity expansion to be Capacity expansion to be negotiated with local communities.negotiated with local communities.
The interim parallel runway The interim parallel runway commenced its service.commenced its service.
Iraq War/SARSIraq War/SARS
9.11 terrorist attack9.11 terrorist attack
Capacity expansion to be negotiated with local communities.
The interim parallel runway commenced its service.
Iraq War/SARS
9.11 terrorist attack
Estimates (Reference value)
200,000 times2,500m
220,000 times2,500m
Num
ber of plane passengers (in million passengers)
Note: The number of passengers indicates the number of passengers on board for the flights took off/ landed (i.e. the passengers of indirect services are counted by the number of flights involved in the services.)Source: Ministry of Land, Infrastructure and Transport Japan
Number of takeoffs/landings
Number of airline passengers
1985 1990 1995 2000 2005 2007 2008 2010 20120
(FY)
10
20
30
40
50
60
187,888
186,633
35.1235.1235.1234.67
42.90
54.50

─ 48 ─
[Improving coordination among transportation modes]○Developing multi-modal transport systems MLIT is working for improvement in speed and facilitation of transit/transshipment by prioritized improvement of coordination among key transportation facilities including airports, ports, train stations, high-standard highways, etc. as well as roads and access railways that connect those key facilities, and functional enhancement of those facilities.
○Improving access to airports MLIT aims to improve rail access to Narita International Airport to reduce its traveling time between central Tokyo and the airport to less than forty minutes by supporting the construction of Narita Rapid Rail Access, as well as to improve road access to the airport. In addition, MLIT is working to further improve access to Tokyo International Airport (Haneda Airport) and Sendai Airport
[Promoting comprehensive and integrated logistics policies] Comprehensive and integrated promotion of logistics is implemented based on the “Comprehensive Logistics Policy Outline (2005-2009)” adopted at a Cabinet meeting in November 2005. MLIT also proceeds with policies to promote
“Asia Gateway Project.” The “International Logistics Competitive Edge Partnership Committee,” established in 2006, drew up action plans to realize East Asia Seamless Logistics Area, whereas the 1st Meeting of China-Japan-Korea Ministerial Conference on Maritime Transport and Logistics was held in Seoul in September 2006.
○Measures to strengthen international logistics functions International logistics policies refl ecting emerging needs are promoted based upon “Development of practical policies in response to ‘Future Challenges of Logistics’” prepared in July 2005 by Headquarter for Promotion of International Logistics Policies of MLIT. MLIT also enhances the foundation of international maritime transport network by promoting“Super-hub Port” project while at the same time upgrading airborne freight functions and promoting international inter-modal transportation.
Next Generation Container Terminal to be Developed in Super Hub-Port Project
Length: 350-400m Widt
h: 35
0m14-15m below 14-15m below sea-level sea-level14-15m below sea-level
Current Terminal
Management by separate facilities and operation systems
Application of higher standards and expansionIntegrated management
[Conceptual figure of the development of next-generation high-standard mega container terminals]
Next-generation high-standard mega container terminal
Railway transshipment facility(Other facility fee)
To local regions
Joint depot(Other facility fee)
Cargo handling facilities, etc.(Interest free loans/ Special tax scheme)
Support facility open 24 hours(Other facility fee)
Long term lease of quay yard(Exceptions to the National
Property Law, etc.)
Application of higher standards to the gate for freight traffic
16m below sea-level
Length: 500m+
Develop advanced specification container terminal
Reformation of wharf public corporations to streamline the administration of terminal (demutualization/special tax scheme)
Reinforcement of domestic networkImprovement of domestic feeder container transport efficiency(Pilot program)
Wid
th: 1
,000
m+

─ 49 ─
○Measures to develop an effi cient logistics system MLIT has been promoting the wider application of IT in logistics, including the development of more convenient electronic application systems for the administrative procedures required for import and export processes and at ports. MLIT is also addressing cargo effi ciency improvement by establishing “Total Plan for Urban Area Logistics,” in March 2007, while at the same time implementing interregional logistics by developing ports, railroad freight terminals, and other distribution hubs, by boosting the effi ciency of cargo capacity on key routes, and by developing access roads that operate as nodes connecting distribution hubs to expressways. MLIT is developing environment where small to medium freight businesses require to expand their businesses to 3PL
(3rd Party Logistics,) a new type of logistics services the ministry promotes.
[Revitalizing industry]○Trend and policies in railway-related industries The railway industry is making effort to improve services considering the severe business environment, including introduction of train cars with amenity for women and smart card train tickets. On the other hand, efforts for the complete privatization of JR are still under way.
○Trend and policies of motor-vehicle transportation industries With respect to the taxi industry, “Bill Concerning the Amendment to the Special Measures Law on Appropriate Taxi Operation” proposing review of the driver registration system was presented at the 166th session of the Diet to ensure and improve safety of transportation and service quality of the industry. On the other hand, for the current devastating situation trucking business is facing, due mainly because of the recent crude oil price soar, MLIT is implementing supports including requests to give consideration for shipping fee and subsidization upon purchase of low-emission vehicles or energy saving devices.
○Trend and policies of maritime industries Tax preferential treatments are implemented by the international vessel scheme to overseas shipping business, whereas
“Action Plan for Substituted Construction of Domestic Vessels” was established in March 2006 for domestic business to implement various measures.The amended “Port Transportation Business Law” entered into force in May in the year to implement deregulation to the port transportation industries including introduction of authorization method for the ports other than nine major ports to participate in projects as the nine major ports do. MLIT is taking further efforts to enhance the international competitive edge of shipbuilding industry, to revitalize ship machinery industry, to reinforce business infrastructure of small to medium shipbuilding/ship machinery industries. In addition, securement and education of ship crews, employment measures, work environment development and other measures for ship crews are promoted.
○Trend and policies of aviation industries Competition is provoked in aviation industries by policies such as applying larger coverage for treatment to prioritize newly launched airway companies in allocating arrival and departure slots in congested airports.
○Trend and policies of the freight forwarding industries The “Freight Forwarder Business Law” currently in effect has emerging issues regarding multimodal transportation including increasingly complicated administrative procedures of the operators and user protection, which prompted review including review of the business categories subject to the law commenced in 2006.

─ 50 ─
○Trend and policies of warehousing industries Recent trend shows addition of new operators, of which about 60% comprise truck transport operator, indicating the accelerated preference to comprehensive logistics service business.
○Trend and policies of real estate industries Proper application of the Building Lots and Buildings Transaction Business Law and securement of proper management by condominium property management operators, as well as development of conditions for the real estate market, utilization of tax system, and configuration of real estate market with adjustment to the new era are implemented to revitalize the market.
○Rejuvenating construction industry Management reforms are promoted by promoting small to medium sized/solid medium sized companies to explore new fi eld and other measures, while ensuring proper construction by measures such as expulsion of bad/ incompetent suppliers.Improvement of labor standards in the industry, provision of more solid management base for subcontractor and
Shifts in Total Construction Investment Amount (Nominal,) Number of Licensed Contractors and Workers
0
10
20
30
40
50
60
70
80
90
1976197719781979198019811982198319841985198619871988198919901991199219931994199519961997199819992000200120022003200420052006
(in trillion JPY) (x 1000 companies/ x 10000 people)
0
100
200
300
400
500
600
700
800
900
(FY)
Private investment (in trillion JPY)Governmental investment (in trillion JPY)Licensed contractors (x 1,000 companies)Workers (x 10,000 people)
Private investment peaked off at 55.7 trillion JPY in FY1990
Governmental investment peaked off at 35.2 trillion JPY in FY1995
Number of licensed contractors peaked off by hitting 600,000 at the end of FY1999
Investment in construction peaked off at 84.0 trillion JPY in FY1992
The number of employees peaked off at 6.85 million in FY1997 average
5.59 million people5.59 million people(average in 2006)(average in 2006)
542,000 companies542,000 companies(at the end of 2005)(at the end of 2005)
Investment in constructionInvestment in construction52.9trillion52.9trillion
Private investmentPrivate investment34.8trillion34.8trillion
Governmental InvestmentGovernmental Investment18.2trillion18.2trillion
5.59 million people(average in 2006)
542,000 companies(at the end of 2005)
Investment in construction52.9trillion
Private investment34.8trillion
Governmental Investment18.2trillion
2.2%increase compared to the peak value of investment in construction
37.0%decrease compared to the peak value of investment in construction
32.7%decrease compared to the peak value of investment in construction
43.9%decrease compared to the peak value of investment in construction
Notes: 1) The investment amounts are the actual values for the FY2003 and before, Interim values for the FYs 2004 and 2005, and Estimated value for FY 2006.The number of licensed contractors represents the figure at the end of each fiscal year (the end of March of the following year).The number of workers represents the annual average.
Sources: Estimate of Construction Investment and Survey of the Number of Licensed Contractor MLIT, Labour Force Survey, MPHPT

─ 51 ─
Chapter 6: Formulating Safe and Peaceful Society
[Measures against natural disasters] The extremely severe natural conditions where Japan is situated render the protection of life and assets from natural disaster one of the fundamental challenges.In addition to the conditions, chances of disaster are further increasing due to the population and properties concentrated on the urban area, and so is the importance of measures against possible disasters.
○Building a more disaster resistant nation MLIT is committed to integrated structural improvements and non-structural measures, including fl ood control measures like provisions to mitigate damage in case of fl ood, measures against sediment related disasters, improving the earthquake resistance and overall safety of homes, and buildings, measures against earthquakes including urgent improvements in built-up areas, measures against tsunamis, storm surge, and coastal erosion, measures for snow damage control, and works for erosion and sediment control in volcano areas.
Number of Sediment Related Disasters for the Past Ten Years (1997-2006)
0
500
1,000
1,500
2,000
2,500
3,000(Number of disasters)
1997
136136
917917
1998
317317
152152
1,1601,160
1999
1,135
1,6291,501
608509 539
897
373373
168168
960960
2000180180137137
291291
2001
3653659696
2002
218218
275275
2003
128128
712712
2004
565565
461461
2005158158173173
483483
2006169169215215
1,0571,057 773773
200200188188
773
200188
82136
917
317
152
1,160
373
168
960
180137
291365
4896 46218
275
57128
712
565
461
1,5111,5111,511
814
1,441
1,161
158173
483
169215
1,057
Average (1997 -2006)
2,537
Slope failuresLand SlidesDebris flows
Source: MLIT
Mudslide Disaster Took Place following Heavy Rainfall of a Seasonal Rain Front in 2006 (Okaya City, Nagano Prefecture)
Suwa Lake
Chuo Expressway
Disaster Prevention Axis
Before
After
· Emergency evalua-t i o n r o u t e n o t developed/ More risk for fire spread
· Absolute shortage of green space or other open areas
· Advanced utilization not available (due to t h e n a r r o w r o a d width/smaller lots)
· F u n c t i o n a s t h e evacuation route/anti fire spread structure upon emergency.
· A r e a w i t h a m p l e greenery
· Advanced utilization and housing supply
· “Axis of living” with living service facili-ties for residents
Fireproof installation Promotion
Conceptual Figure of development effect
Ensure evacuee’s security while prevent fire spread to the adjacent blocks.
Evaluation route
About 30m About 30m

─ 52 ─
○Better disaster prevention arrangements Aside from the “Promotion Scheme of Non-Structural Measures for Safety and Security” established in June 2006, promotion is implemented for more sophisticated information for disaster prevention, including improved hazard maps, improvement in disaster prevention capacity such as measures to care for the elderly, small children, and others with special needs during emergencies, arrangements to boost emergency responsiveness, reinforcement for monitoring earthquakes and volcanic activities, and upgrading of the existing stock by introducing ICTs.
○Ensuring disaster-resistant transportation system Earthquake proof property is promoted to be installed in vital transportation facilities including roads, ports, airports along with efforts to ensure multiple access and optionality. Disaster prevention is also promoted for roads and other transportation facilities.
[Ensuring safety of building structures] Efforts to ensure trustworthiness to the construction/supply systems are taken, including enactment of the “amended Housing Standards Law, etc. to enforce safety of building structures,” and the “amended Kenchikushi Law, etc.” and presentation of the “Bill concerning execution of designated defect liability of a new house” at the 166th session of the Diet, as well as proper response to the accidents involving elevators.
[Reinforcing safety measures in the transportation sector]○Coordinating safety management system for public transportation The “Law Concerning Revision of Railroad Operation Law, Etc. to Improve Safety of Transportation” entered into force as of October 2006, refl ecting numbers of accidents and problems presumably attributable to the human error, including the derailment of the West Japan Railway Fukuchiyama Line. The Law requires preparation and submission of a “Safety Management Manual” to Transport Operators who also became obligated to elect a “Safety General Manager” and to report thereof under the Law. The government also started conducting “Transportation Safety Management Assessment” to the operators.
Hazard Map Development Status
Flood hazard map
Published:Published: 510 municipalities 510 municipalities
(As at the end of December 2006As at the end of December 2006)
Published: 510 municipalities
(As at the end of December 2006)
Notes 1: The number of municipalities where the map, in whole or in part, is scheduled to become available by the end of March 2007 as at the survey conducted in January 2007.
2: Including areas with recent major scale disaster experience, or with facilities for individuals requiring special needs in case of emergenciesSource: Ministry of Land, Infrastructure and Transport Japan
Published: Published: 232 municipalities232 municipalities
(Interim as at the end of March 2007Interim as at the end of March 2007)Note1Note1
Published: 232 municipalities
(Interim as at the end of March 2007)Note1
Published: Published: 56 municipalities56 municipalities
(Interim as at the end of March 2007Interim as at the end of March 2007) Note1 Note1
Published: 56 municipalities
(Interim as at the end of March 2007) Note1
Subject: About 1,500
Municipalities
Tsunami hazard map
Subject: 657
Municipalities
Subject: 657
Municipalities
High hazard zonesNote2
About 6,000 areas
Storm surge hazard map Sediment-related disaster hazard map
Published: Published: 1,109 locations1,109 locations
(As at the end of December 2006As at the end of December 2006)
Published: 1,109 locations
(As at the end of December 2006)
Volcanic hazard map
Subject: 30 Volcanoes
Published: 30 VolcanoesPublished: 30 Volcanoes(As at the end of December 2006As at the end of December 2006)
Published: 30 Volcanoes(As at the end of December 2006)

─ 53 ─
○Safety measures in railway/tracks traffi c Amended ordinance of the ministry with newly included obligation to install ATS or other speed control device over narrower curves entered into force in July 2006. In consideration to the JR East Japan Railway Uetsu Main Line Derailment, deliberation upon measures for railways against wind blast is under way, which had reached a midterm interim conclusion in September of the year to install additional anemometers at 370 points to reinforce wind blast observation by the railroad operators. Efforts are further taken for the preventive measures against accidents at rail road crossing.
○Safety measures in maritime traffi c MLIT is addressing improvement in the safety of vessels including review of safety standards in line with entry into force of amended SOLAS convention. MLIT is engaged into securing the safety of navigation by measures including
“Safety Measure Committee on High-speed Vessels” held following accident of a hydrofoil hi-speed vessel collided with drift wood and a whale, as well as amendment to the Marine Pilot Law. Promotion of safety measures for crew and passengers on board, enhancement of rescue system, investigation into maritime accidents and prevention thereof are also addressed by MLIT.
○Safety measures in aviation MLIT is working on the enhancement of measures for aviation safety including imposing an obligation on airlines to report safety related troubles other than accidents and serious incidents by amendments to the Civil Aeronautics Law and implementing specialized and systematic safety audits at higher frequency. An aviation safety system for safer and smoother aviation traffi c is being constructed, including efforts to reduce congestion of airways and holding by utilizing the latest ICT technologies and new systems installed aboard.
Conceptual Diagram of New Transportation Safety Management System Implementation
Government
Managing directors(Presidents)
Safety General Manager(Vice Presidents, etc.)
Transportation management Department
(General Managers of the Transportation Dept.)
Corporate Planning Departments(General Manager of Corporate
Planning Dept.)
Inspect the level of effort for the safety management system and offer advice by interview and examination to the managing directors and other personnel at the headquarters.
Government
Railways Motor Vehicles
Marine Transportation Airlines
Sites
Operators
Operators
Operators
Inspect the compliance to technical standards and other efforts for the safety by management interviews and on-site inspection at the offices/transportation service sites at the headquarters and branch offices/other business locations, and issue corrective action requests as required.
▲
Inspect whether the organized safety management system is properly functioning as a system or not.⇒Cross-modal approach
▲
Whether a system where the management top can practically monitor the safety management system and feedback of information and issues on site are available is established or not.
1)Whether Safety policy/objectives are properly established or not.2)Whether near-miss incident reports are thoroughly communicated within the organization or not.3)Whether internal audit system are functioning or not.4)Whether proper system to review safety management system in a timely fashion is established or not.etc.
1. Fundamental idea of Inspection
2. Examples of items to be confirmed
▲
Inspect the compliance with standards, etc. in respective elements(i.e. transportation facilities/ drivers, etc.)of transportation activities and the implementation of preventive measures against accidents
⇒Methods corresponding to the features characteristic to respective modes
1)Whether the airplane/rolling stocks/facilities are in compliance with the safety standards or not.2)Whether the operation/management are implemented by personnel with proper qualification or not.3)Whether operation representative(operation manager)is appointed or not.4)Whether accident prevention measures are properly implemented or not.etc.
1. Fundamental idea of Inspection
2. Examples of items to be confirmed
Management DepartmentHeadquarters
Safety audit of an airline

─ 54 ─
○Safety measures in road traffi c MLIT is taking focused measures to reduce traffi c accidents at black spots, including improving intersections, intensively developing sidewalks, with special emphasis on highways. The ministry’s comprehensive automobile safety initiative involves expansion and strengthening of safety standards, provision of safety information through automotive assessments, development and dissemination of Advanced Safety Vehicles (ASV,) countermeasures to prevent the recurrence of dishonest behavior in the automobile recall system.
[Crisis management and security]○ Promoting measures against crime and
terrorism MLIT is working to materialize agreed items on the “Ministerial Conference on International Transport Security” held in Tokyo in January 2006, MLIT is also enforcing and enhancing anti crime and terrorism measures in the respective areas including railways, vessels, ports, aviation, motor vehicles, and important installations. MLIT is further working on coping with both security and effi ciency in logistics and measures for information security.
○Establishing responsiveness to incidents In case of incidents on vessels, aircraft, or railway, MLIT shall establish countermeasures headquarters. The Law Relating to the Prevention of Marine Pollution and Maritime Disaster entered into force in April 2007, stipulating efforts shall be made to establish system that is capable of prompt and effective response to noxious liquid substances. “Countermeasures of MLIT against a Large Scale Power Outage” was drawn up in September 2006 following a mega scale power outage, or metropolitan area blackout took place in August 2006.
Damage Saving Break System for Oversized Vehicles
• Approaching for a car driving ahead
EHF radar continuously monitors the forward situation.
Prompts driver to brake by beeping when the driver is considered to be unaware of the existence of the vehicle ahead.
Activates brake when the computer considered that collision is going to, or is most likely to happen.
Beep beep beep...
Activates Brake
Implementation of Measures against Railway Terrorism with “High-profi le Security/Participation by Users” Concept
Utilize train communicators upon discovery of suspected articles (by adding notes clearly articulat-ing “When any suspected article is found” as a cause of report)
Explicit posting of messages such a s “ W a r n i n g : m o n i t o r e d b y surveillance camera” or other warning messages.
“Risk management poster” posted in the premises of stations “Antiterrorism supporter badge”
of kiosk attendants.
Caption message on train platforms requesting cooperation for the discovery of suspected articles
Patrol by employees and guards

─ 55 ─
○Enhancement of coastguard system Enhancement of coastguard system has been implemented by promoting and enhancing framework, promotion of measures against terrorism, suspicious ships, spy boats, and marine crimes.
○Protecting Japan’s interests in the ocean In the perception that maintaining the order in the ocean is vital for the protection of Japan’s interests in the ocean, Japan is enhancing the patrol around the Senkaku Islands. Efforts to prepare appropriate nautical charts of the sea area in the vicinity of Japan are going to be continued, along with proper oceanographic investigation in the Sea of Japan. MLIT is working with government ministries concerned to conduct continental shelf survey that is necessary to establish the outer limit of the continental shelf at the same time implementing conservation efforts to Okinotorishima Island.
○Ensuring safety and protecting national lives and property In October 2005, MLIT, the Geographical Survey Institute, the Japan Meteorological Agency, and the Japan Coast Guard put together the “Citizens’ Protection Plan,” a plan detailing measures for armed attacks on the country. Upon launch of North Korea’s ballistic missiles including Taepodong-2 in July 2006, Mangyongbong-92 was put under embargo in an effort of the entire government , and also embargo was further put on all the chartered fl ights between Japan and North Korea, as well as other measures to ensure safety of navigation both by airplanes and vessels were taken by MLIT. MLIT further took measures and put all the North Korean fl agged vessels under embargo as well as monitored all the information on North Korean fl agged vessels in response to the statement of North Korea regarding the execution of the nuclear test in October 2006.MLIT thereafter properly responded to the cabinet approval of the import ban from North Korea and entry ban of the North Korean citizens, and is performing boarding inspections as required for arriving vessels.

─ 56 ─
Chapter 7: Creating and Conserving a Beautiful and Favorable Environment
[Promoting measures against global warming]○Implementation and revision of plan to achieve target set under the Kyoto Protocol To achieve its target value in the Kyoto Protocol, Japan is implementing measures against the global warming effect in the transport sector as well as in the house, building, and industrial sector of the minsei sector, and sewage system at the same time working for urban greening. As Kyoto Protocol Target Achievement Plan set to be quantitatively evaluated and revised in 2007, or one year prior to the commitment period, Environment Subcommittee of Council of Transport Policy and Environment Subcommittee of the Panel on Infrastructure Development will give a comprehensive evaluation and revision of the measures as well as its progress to be compiled in Summer 2007, and to be fi nalized at the end of 2007.
○Measures in the transport sector For CO2 reduction of the Transportation sector, improvement of gas mileage, reduction in emission gas, development of systems promoting improvement in fuel performance, and green tax plan on vehicles are implemented as the measures for individual vehicles, along with dissemination and promotion of the Eco-drive. MLIT also proceeds on achieving smooth road traffic flows through the formulation of the “Action Program for CO2 Reduction in Road Policy,” promotion of environmental policy measures in the logistics sector through the holding of “Green Logistics Partnership Conferences” and similar initiatives, promoting the use of public transportation by improving convenience and other measures.
Measures Implemented by MLIT against Global Warming Effect
Provisions for individual vehicles and environmentally
friendly forms of drivingabout 8.2 million tons (-) (*)
Promoting more efficient logistics
about 8.4 million tons(about 4.1 million)
Traffic flow managementabout 5.1 million tons
(about 3.2 million)
Promoting the use of public transport
about 2.8 million tons(about 3.3 million)
Policy continued from the past: Prerequisite
to estimated CO2 emission quantities for the year 2010
Road development
Measures against road transport
Reducing 24.5 million tons of CO2 emissions
(about 10.6 million)
Transport sectorTransport sector Civilian Sector (homes and buildings)Civilian Sector (homes and buildings)
Reducing 34 million Reducing 34 million tons of COtons of CO2 emissions emissions
Reducing 0.20 million Reducing 0.20 million tons of COtons of CO2 emissions emissions
Industry sectorIndustry sector
(*) CO(*) CO2 emission reduction by the emission reduction by the Top Runner standard is about 21 Top Runner standard is about 21 mill ion tons, including the mill ion tons, including the portion previously achieved.portion previously achieved.
Reducing 1.3 million Reducing 1.3 million tons of COtons of CO2 emissions emissions
Measures against dinitrogen monoxide (laughing gas)Measures against dinitrogen monoxide (laughing gas)
Absorbing 0.28 million Absorbing 0.28 million tons of COtons of CO2 emissions emissions
Developing carbon sinksDeveloping carbon sinks
Transport sector Civilian Sector (homes and buildings)(Including areas not administered by MLIT)
Developing transport systems with less environmental load
Promoting the use of railways and marine transportIncreasing the efficiency of vehicle transportation
Reducing the land trip mileage of international freight
Promoting clean energy vehicles and other low-emission vehicles
Promoting “eco-driving”Non-sulfur fuels, biomass fuels
Promoting ITSReduction of
on-road constructionsetc.
Developing of highway networksMeasures against traffic bottlenecks
Developing new railways, etc.Promoting the use of existing railways
and bus servicesManaging commuter traffic, etc.
Reducing 34 million tons of CO2 emissions
Reducing 0.20 million tons of CO2 emissions
Industry sector
Promoting the use of fuel-efficient construction Promoting the use of fuel-efficient construction machinery in the construction sectormachinery in the construction sector
HomesHomes
BuildingsBuildings
High-temperature (850˚C) combustion High-temperature (850˚C) combustion of sewage sludgeof sewage sludge
Promoting urban plantingPromoting urban planting
Promoting the use of fuel-efficient construction machinery in the construction sector
(*) CO2 emission reduction by the Top Runner standard is about 21 mill ion tons, including the portion previously achieved.
HomesImproving thermal
insulation performanceImproving the efficiency
of air-conditioners
Buildings
Homes: about 8.5 million tons Buildings: about 25.5 million tonsRequiring notification for houses over a certain size, and upon new construction,
extensions, large-scale renovations, etc. (revision of the energy saving law)Making use of the framework for Housing Loan Corp. loans and securitized loans
Support through Development Bank of Japan loans, the tax system, etc.
Reducing 1.3 million tons of CO2 emissions
Measures against dinitrogen monoxide (laughing gas)
High-temperature (850˚C) combustion of sewage sludge
Absorbing 0.28 million tons of CO2 emissions
Developing carbon sinks
Promoting urban planting
Note: Parentheses indicate the cumulative emission reduction quantity achieved by the year 2002.

─ 57 ─
○Measures concerning houses, buildings, sewerage, and urban greening The revised “Act concerning the Rational Use of Energy (Energy Saving Law),” as amended in April 2006, further enhanced the measures by stipulating mandatory reports concerning energy saving measures for new construction and renovation, improvement and major scale improvement of houses, and major scale improvement for buildings, at the same time revised the energy saving standards. The ministry is also promoting the reduction of the environmental load from government facilities, advancing the popularization of symbiosis housing, taking steps to implement measures against global warming effect on sewerage systems, and promoting urban greening (planting) and other provisions for carbon sinks, among other environmental measures.
[Promoting a Sound Material-Cycle Society]○Construction materials recycling promotion MLIT is committed to promoting recycling construction waste accounting for about 20 percent of waste discharged from all industries, reducing and recycling sewage sludge and promoting solid waste management in the housing and construction fi elds.
Conceptual Diagram of the Promotion Efforts through Green Logistics Partnership Conferences
Working Group for Project Coordination and Evaluation
Increasing trucking efficiency Optimizing logistics through 3PL programs
Working Group for Publicity
Modal shift by multiple shippers
Corporate shippers, distribution businesses, Corporate shippers, distribution businesses, organizations in each industryorganizations in each industry
Logistics businesses Logistics businesses and business organizationsand business organizations
Auditing corporations, etc. Think tanks Research institutions ResearchersAuditing corporations, etc. Think tanks Research institutions ResearchersLocal offices of the Central Government Local authorities OthersLocal offices of the Central Government Local authorities Others
Corporate shippers, distribution businesses, organizations in each industry
Green Logistics Partnership Conference
JILS Japan Federation of Freight Industries Ministry of Economy, Trade and Industry MLIT Nippon Keidanren
Logistics businesses and business organizations
Auditing corporations, etc. Think tanks Research institutions ResearchersLocal offices of the Central Government Local authorities Others
Main-line transport and partnership for many shippers through effective use of different racks for different shippers and larger sized trucks
Engineering out/ Evaluation of the project
Formulate and standardize calculation methods to accommodate diverse efforts
Selection of good practice examples and public relations
Publication for the purpose of dissemination
Implementation of large-scale modal shift through the participation of multiple shippers
Optimizing logistics systems by comprehensively making storage, transport, and distribution more efficient through the development of logistics centers
Making use of flat rack containers to conduct international inter-modal transport with JR’s 12-foot multi-purpose containers.
Working Group for CO2 Emmission Accounting
International inter-modal transport
Recycling Rates of Construction Waste by Item
FY2005Performance value
FY2005Target Value
FY 2010Target Value
Recycle rate of asphalt/concrete blocks 98.6% Achieved 98% or more Achieved 98% or more
Recycle rate of concrete blocks 98.1% Achieved 96% or more Achieved 96% or more
Recycling rate, etc. for construction-derived wood chips 90.7% Achieved 90% Not achieved 95%
rate for construction-derived wood chips 68.2% Achieved 60% Achieved 65%
rate for construction derived sludge 74.5% Achieved 60% Not achieved 75%
Reduction in mixed construction waste
emissions compared to FY2000 (%)39.6%Reduction Achieved 25% Reduction Not Achieved 50% Reduction
Recycle of industrial wastes 92.2% Achieved 88% Achieved 91%
Proportion of spun off recycled soil in the construction gravel 62.% Not Achieved 75% Not Achieved 90%
Note: The target values are based on the Healthy recycle promotion plan 2002.Source: 2002 survey on the state of construction byproducts .by MLIT

─ 58 ─
○Developing logistics systems for recyclable resources MLIT has recently designated 21 Recycle Ports nationwide, and is deliberating upon development of an appropriate and effi cient venous logistics networks. MLIT presented the “Bill to amend the Ports and Harbours Law and the Law Concerning the Port Construction for Development of Hokkaido” requesting increase of national budget proportion in the costs of promoting sea surface waste disposal facilities to facilitate formation of recycling communities and to continue the appropriate terminal management for the wastes, in the 166th meeting of the Diet.
○Recycling of vehicles and FRP boats Promotion of proper disposal and prevention of illegal dumping is addressed by implementation of deletion registrations under the Road Transport Vehicle Law and reimbursement scheme of the automobile weight tax. Japan Boating Industry Association is taking initiative in recycling of FRP (Fiber Reinforced Plastic) boats under the support of MLIT.
○Promoting procurement of materials contributing in the reduction of environmental load MLIT is promoting green procurement efforts and wider use of wood materials in public works projects.
[Conserving and regenerating an affl uent and beautiful natural environment] MLIT is promoting the development and conservation of harmonized coastal/riparian environment by formulating rich and beautiful fl uvial environment and by participating in the “High-level Inter-ministry Meeting on Marine Litter.” The ministry is also working on other initiatives called “greening of port administration” in the port/harbor fi eld. MLIT is also working on the measures including greening of roads, measures against natural environment.
Promotion of Sediment Management
Sediment controlDam
Coast
Install gates to flush deposited Install gates to flush deposited sediment in the reservoir sediment in the reservoir downstream.downstream.
Construct screen check dams Construct screen check dams permitting harmless sediment to permitting harmless sediment to flow downstream.flow downstream.
Install gates to flush deposited sediment in the reservoir downstream.
Construct screen check dams permitting harmless sediment to flow downstream.
Excavate Excavate riverbed to riverbed to maintain a maintain a sufficient sufficient run-down of run-down of sediment to sediment to coastal area.coastal area.
Transport sediment to corrosion Transport sediment to corrosion point of beach to restore.point of beach to restore.
Excavate riverbed to maintain a sufficient run-down of sediment to coastal area.
Transport sediment to corrosion point of beach to restore.
River
Sediment collection
Release collected sediment
littoral current
Example of a project
concertedly implemented

─ 59 ─
[Promoting sound hydrological cycles] MLIT is working on promoting sound hydrological cycles in association with other ministries and agencies concerned. The ministry is also implementing the phase II emergency action plan for improvement of water environment called “Clear Water Renaissance II” as well as recovery of the water system befi t to the needs of the area, and other various measures from the perception to nurture and to make good use of water.
[Conservation of marine environment] MLIT is promoting measures against large scale oil pollution by participating in an international activity to eliminate sub-standard vessels, and by enhancement of port state control (PSC). Other promotions of MLIT include measures against emission gas from vessels and exploration concerning control of harmful aquatic organisms in ballast water.
[Improving the living environment through measures against air and noise pollution]○Addressing environmental degradation associated with road transport Along with strict auto emission standards imposed on individual motor vehicles, MLIT is promoting measures for smoother traffi c including traffi c demand management through TDM.
○Environmental measures for airports and their vicinities MLIT is taking measures against the aircraft noise source and improvement in the airport structure, as well as making efforts to preserve and create more favorable environments in airports and surrounding areas.
○Measures against railroad noise Measures for the noise sources are implemented for Shinkansen noise, and further soundproof improvement will be installed in the subjected houses in case the measures for the sound sources cannot achieve the desired result. Noises of other lines are addressed by giving instructions to the operators based on the “Policy for Noise Measures upon Newly Installed or Drastically Improved Conventional Lines.”
○Addressing urban heat-island issues MLIT is focusing on the practical measures in the “Outline of Measures against urban Heat Island Effect” as established in march 2004, at the Related Offi ces and Ministries Liaison Conference.
Promoting Sound Hydrological Cycles
Vaporization
Precipitation
impoundment
infiltration
water use
water disposal
river runoff
Clean water tank
General service water tank
Green
Fountain/Carwash
Sewage works
Filtration plant
water for domestic use
Water for irrigationWater for industrial use
Sewage works
Clean water
General service water utilization
Conservation of bosomDevelopment of Green areas
Reorganizing water inlet/outlet points
Constructing healthy water circulation system
infiltration facilities
Recycle treatment
Advanced sewage treatment
installation of permeation tank
Rice paddy conservation
Forest conservation
Recycled water utilization

─ 60 ─
○Responding to Sick building syndrome issue and soil contamination issue MLIT is addressing sick building syndrome, soil contamination dioxin issue while taking necessary measures against asbestos issue, including amended “Building Standards Law” prohibiting air-borne asbestos entering into force as of October 2006.
○Measures for environment construction Regulation on the use of non-road special motor vehicles pursuant to the “Act on Regulation, Etc. of Emissions from Non-road Special Motor Vehicles” was commenced as of October 2006.
[Observation/monitoring/predicting the global environment] MLIT is conducting observation/monitoring of global environments, including observation/monitoring of the climate change, ocean, and ozone layer, as well as regular observation at Antarctica. MLIT is also issuing predictions of future global environment, as well as developing global maps.
Addressing Urban Heat-Island Issues
Green facilities development project certification program・Promote greenery of buildings fulfilling certain requirements
including ground floor area of 1,000m2 or more/ 20% ore more green rate. 17 facilities certified as at the end of 2005.
Creation of areas with greening on the rooftop/wall surface・Implement studies for
companies concerned to monitor recent development in the areas with greening on the rooftop/wall surface.・Rooftop greening: About
124 ha, Wall greening: About 4.6 ha(Total of the period 2000-2005)
・The Roadside Environment Improvement Project is expanded in FY 2005 by adding “Paved Facilities to reduce road surface temperature.”・Development status in 2005: Special words area of Tokyo: 6.5km (Sum of Designated and Subsidized roads)/ Osaka City: 2.2km・Development prospect in 2006: Special words area of Tokyo:
7.9km (Sum of Designated and Subsidized roads)/ Osaka City: 7.9km
・A series of meteorological observation was conducted for location several hundred meters away from each other within the perimeter of oceanfront/central areas of Tokyo over July and August 2005.
・Promoting the “Eco-Town Network Project” where multiple heat supplying plants are provided for the cooperating facilities to implement measures to reduce environmental load in a harmonized effort with urban development in the urban revitalization emergency development area expecting numbers of urban development projects.
・A demonstrative experiment was conducted to use snow and ice made by the cold climate in winter time of Hokkaido for air conditioning around the Metropolitan area in the summer.・Regional areas in corporation with
the competent authorities in regional areas
・A large scale urban city simulation program with emulation of all the individual buildings and streets by creating heat island forecasting model and globe simulation(Accuracy within 1 degree Celsius compared to the actual measurement)・As practicability of the
simulator was confirmed, the various measures against heat island effects is going to be quantified.
Ensure greenery and open area in a tactical manner
Installation of water retentive paving
Implementation prioritizing related facilities in Tokyo
Eco-Town Network Development Project
Establishment of Heat Island Effect Prediction Model
Evaluation of Snow and Ice Transportation System
Elimination of urban Elimination of urban heat island effectsheat island effects
Elimination of urban heat island effects
・Installed the paving and sprinkler around the National Diet Building for experimental purpose.Road surface temperature data retrieved in August 2005.・The water retentive paving with
sprinkler was confirmed of its temperature 10 degree Celsius lower than the conventional paving on sunny days.
Water sprinkler system for the water retentive paving by utilizing wind/photovoltaic power generation
Improvement in land surface coating
Improvement in urban form
Promotion of observation/survey/study
Reduction in artificial heat exhaust
Sprinkler nozzle
water retentive paving
Control system utilizing wind/photovoltaic power generation
Shifts in Cumulative Area of Rooftop/Wall Greening Installation
2000 2001 2002 2003 2004 2005 (Year)
Total
124,058m2
259,367m2
493,021m2
737,351m2
1,024,004m2
1,283,011m2
122,623m2
256,286m2
484,693m2
718,746m2
995,960m2
1,236,840m2
1,236,840m2
1,435m2 3,081m2 8,328m2 18,605m2 28,044m2 46,171m2
(in m2)
1,400,000
1,200,000
1,000,000
800,000
600,000
400,000
200,000
0
Rooftop Greening Total
Wall Greening Total
Urban Heat Management Method
Heat Distribution Heat Distribution AreaArea
Heat Distribution Heat Distribution AreaArea
Heat Distribution Heat Distribution AreaArea
Heat Distribution Heat Distribution AreaArea
Heat Distribution Area
Heat Distribution Area
Rivers/Sea
Hokkaido Manufacture ice with cold air in winter season to be stored with simple methods
Load ice on trailer trucks with empty container right before their boarding.
Use ro-ro vessels, etc. from Tomakomai Port.
Provide cold energy resources for office building complexes in the district
Ice Thermal Storage TankIce Thermal Storage TankIce Thermal Storage Tank
Ship to destinations of demand in the Rinkai district of TokyoMetropolitan area
Heating PlantHeating PlantHeating Plant
SewerageSewerageSewerage
Heat Distribution Area
Heat Distribution Area
Linked-Plant Method
Mitigate heat island
effect by releasing
exhaust heat from air
conditioning
system to
river/sewerage
systems
Manufacture and manage ice with natural cold energy resources to be providedin the metropolitan areas as freight of a new kind (elimination of emptytruck beds on return trips.)
Metropolitan AreasUtilize ice as a clean cold energy resource for air conditioning in officebuilding complexes in Rinkai area.
Link multiple heating
plants to improve
urban environment
by reducing CO2
emission and urban
heat emission

─ 61 ─
Chapter 8: Promoting Formation of Vibrant and Diverse Regions
[Directions in regional and national development] MLIT is not only implementing National Land Planning, but also deliberating for the next National Spatial Strategy. MLIT is also promoting regional hub location to be developed.
[Developing regions and communities with vibrancy that builds on local characteristics] MLIT is supporting, yet respecting regional autonomy, local initiatives to develop networks that facilitate exchange and cooperation among municipalities and other local entities, and to develop regions and communication nodes among them that make good use of local characteristics. The ministry is also supporting cities, towns, and villages merging together as well as promoting settlement into the regions concerned.
[Providing local public transport service] MLIT is implementing development of local railway facilities, the continued operation of bus service in rural areas, and the continued operation and revitalization of air and shipping services to and from remote islands to ensure that local residents have access to everyday public transport.
[Promoting measures for development of specifi c regions] MLIT is proactively promoting the development of heavy snow belts, remote islands, including the Amami Islands and the Ogasawara Islands, and peninsulas.
[Promoting comprehensive development of Hokkaido] Pursuant to the 6th-term Hokkaido Comprehensive Development Plan, MLIT is working for : strengthening of food supply capacity ; utilization of clean energy sources ; promotion of tourism ; infrastructure development that respects the autonomy and discretion of local governments ; development of the region adjacent to the Northern Territories ; and promotion of the Ainu Culture. As the 6th-term Plan faced its target year, FY2007, the Hokkaido Development Committee compiled in December 2006 a report about reviews of the plan and principles of a new plan.
Shifts in Number of Registered “Stations of Road”
900
800
700
600
500
400
300
200
100
0
Hokkaido
Tohoku
Kanto
Hokuriku
Chubu
Kinki
Chugoku
Shikoku
Kyushu/Okinawa
103
155
285
551
845
1413 8
65
15151899
2316
10201922161415 28
233533
31243147
33
52
53
57
69
62
43
71
80
64
97
72
76
97
103
63
123
119
95
Kyushu/Okinawa
Shikoku
Chugoku
Kinki
Chubu
Hokuriku
Kanto
Tohoku
Hokkaido
1st4/1993
5th4/1994
104/1996
15th8/1999
22nd8/2006
Source: Ministry of Land, Infrastructure and Transport Japan
Traditional Handicrafts of Ainu - Demonstrated in Ainu Cultural Festival 2006 in Shiraoi

─ 62 ─
Chapter 9: International Partnership and Contribution for the Nation’s Sustainable Development
[Developing international partnership and coordination mechanism under the initiative of Japan] MLIT is working to bolster partnership in ASEAN and other East Asia areas as a whole in such sectors as transport, construction, and marine environment management while at the same time developing a policy network involving transport ministers in world major countries and a network of ministers in charge of infrastructure development in the Asia-Pacifi c region. Moreover, MLIT is taking steps to ensure free and fair construction markets overseas and to fi nd solutions to the water problems in the world.
[Efforts concerning international standards] MLIT is addressing a number of issues concerning international standards including harmonization of vehicle regulations and mutual recognition of certifi cation; international standardization of railway specifi cations; promoting of formulation of international standardization concerning vessels and seafarers; international harmonization of civil engineering and construction standards and certification system; international standardization of ITS and geographical information. In addition, the ministry is implementing all possible measures to address the issue over the internationally recognized name of the Sea of Japan.
[International cooperation that takes advantage of Japan’s experience, technology and expertise] MLIT is pursing strategic international cooperation in transport and infrastructure development. The ministry is focusing such sectors as the development of broad-based socioeconomic infrastructure, disaster preparedness, the environment and security.
[Multilateral and bilateral talks] MLIT has been participating in multilateral talks and forums, including the World Trade Organization (WTO), the Asia-Pacifi c Economic Cooperation (APEC). The ministry is also involved in multilateral efforts in such sectors as roads, ports, and maritime safety and in bilateral negotiations regarding Economic Partnership Agreements (EPAs) and Free Trade Agreements (FTAs).
Instruction of Spilled Oil Removal on an Emulation Board
Bai Chay Bridge constructed with ODA of Japan

─ 63 ─
Chapter 10: Technical R&D Supporting Public Life in Japan in the Future
[Promoting technical R&D] Based on “its basic plan on technical R&D”, MLIT is promoting cross-sectoral and integrated R&D of technologies at all levels of the ministry, including bureaus at the headquarters, affiliated research institutions, regional development bureaus, and the Hokkaido Regional Development Bureau, while improving the framework for the partnership among industry, government and academia. The results are actively refl ected in construction and transport industries, as well as in related public works projects. The plan fi nishes the last year of the term in 2007, the next plan to be established is currently negotiated.
[Improving construction management technique] MLIT is making efforts to improve its cost estimation technique in public works projects, including and attempt to shift from the traditional “Capital Cost Estimate method” to the “unit price-type estimation method.” The ministry is promoting the application of ISO management systems to public works projects.
[R&D on construction machinery/equipment] For more efficient and effective construction projects, MLIT is also working to develop and upgrade construction machinery. MLIT is also implementing measures for safety management in construction works