WHERE ARE THE MOST INTENSE THUNDERSTORMS ON EARTH?snesbitt/publications/zipser06.pdf · WHERE ARE...
15
WHERE ARE THE MOST INTENSE THUNDERSTORMS ON EARTH? BY E. J. ZIPSER, DANIEL J. CECIL, CHUNTAO LIU, STEPHEN W. NESBITT, AND DAVID P. Y ORTY A satellite mission aimed at rainfall measurements has also provided unparalleled information on the global distribution of intense convective storms. T he Tropical Rainfall Measuring Mission (TRMM) satellite was launched in late 1997 with its primary focus being rainfall estimation. While it was originally an experi- mental mission with a 3–5-yr expected lifetime, 1057 AUGUST 2006 AMERICAN METEOROLOGICAL SOCIETY |
-
Upload
vuongxuyen -
Category
Documents
-
view
215 -
download
0
Transcript of WHERE ARE THE MOST INTENSE THUNDERSTORMS ON EARTH?snesbitt/publications/zipser06.pdf · WHERE ARE...

WHERE ARE THE MOST INTENSE THUNDERSTORMS ON EARTH?
BY E. J. ZIPSER, DANIEL J. CECIL, CHUNTAO LIU, STEPHEN W. NESBITT, AND DAVID P. YORTY
A satellite mission aimed at rainfall measurements has also provided unparalleled information on the global distribution of intense convective storms.
T he Tropical Rainfall
Measuring Mission
( T R M M) s at e l l i t e
was launched in late 1997
with its primary focus being
rainfall estimation. While
it was originally an experi-
mental mission with a 3–5-yr
expected lifetime, �
1057AUGUST 2006AMERICAN METEOROLOGICAL SOCIETY |

it continues at the time of writing to provide high-
quality data for many more scientific and opera-
tional purposes than its name implies. Its unique
attributes include a suite of complementary active
and passive sensors f lown on a single platform and
its orbital characteristics. In addition to the only
precipitation radar (PR) in space, its passive Micro-
wave Imager (TMI), Visible and Infrared Scanner
(VIRS), and Lightning Imaging Sensor (LIS) provide
a powerful overlap of instruments (Kummerow et
al. 1998, 2000). TRMM’s 35° inclination, low-alti-
tude, non-sun-synchronous orbit permits sampling
throughout the diurnal cycle of precipitation. There
are numerous papers describing the improved quan-
titative estimates of precipitation and its variability
(e.g., Adler et al. 2000, 2003; Nesbitt et al. 2004),
the diurnal cycle (e.g., Negri et al. 2002; Nesbitt and
Zipser 2003), the partitioning between convective
and stratiform precipitation (e.g., Schumacher and
Houze 2003), and latent heating profiles (e.g., Tao
et al. 2001; Lin et al. 2004; Schumacher et al. 2004),
among many others. However, the TRMM database
has accelerated a quiet revolution in our capability to
use remote sensing to infer the properties of convec-
tive systems. This paper exploits this same database
to go beyond the originally stated goals of the mis-
sion to analyze the growing sample of observations
of extreme events.
Climate consists not only of long-term averages,
but also of deviations from those averages, and it is
often the more extreme deviations that have the great-
est impact on humankind. With each year of data
added, the statistics of extreme events such as severe
storms are less susceptible to sampling uncertain-
ties. TRMM PR data are unique in their capability to
measure the vertical extent of strong radar echoes, a
clear indicator of strong convective updrafts. At the
same time, the high-frequency channels of the TMI
give a good indication of the columnar mass and/or
density of precipitating ice (e.g., Vivekenandan et al.
1991), both of which are related to updraft strength.
And for each event sampled by the PR and TMI, the
LIS gives the lightning flash rate. The main purpose
of this paper is to map the quantitative frequency and
intensity of storms observed by TRMM between 36°N
and 36°S using a carefully controlled database over
seven full years.
Satellite remote sensing of storm severity did not
begin with TRMM. The cloud-top temperature of
storms has been measured using infrared (IR) bright-
ness temperature (Tb) for decades. Despite some
notable advances, such as using specific patterns of
cloud-top temperature to diagnose severe storms
(e.g., Heymsfield et al. 1983; Adler et al. 1985), the
limitations of IR Tb as a severe-weather proxy are well
known. First from aircraft (Heymsfield and Fulton
1988; Adler et al. 1991; Heymsfield et al. 1991; Spencer
et al. 1994), and then from satellites (Spencer et al.
1989; Negri et al. 1994; Mohr and Zipser 1996a,b),
passive microwave data became an important source
of estimates of rainfall and convective intensity. Spen-
cer and Santek (1985) may have been the first to use
the brightness temperature depression at 37 GHz to
map convective storms from space. Lightning data
from space first demonstrated the dramatic domina-
tion of land over ocean storms (Orville and Hender-
son 1986), later confirmed by the Optical Transient
Detector (Christian et al. 2003).
With the launch of TRMM, IR, passive microwave,
and lightning data could be combined with high-
resolution radar ref lectivity profiles (with 250-m
vertical resolution at nadir), opening the door to more
quantitative studies of storm structure from space
(e.g., Nesbitt et al. 2000; Petersen and Rutledge 2001;
Toracinta et al. 2002; Houze 2003; Cecil et al. 2005;
Boccippio et al. 2005; Liu and Zipser 2005; Nesbitt
et al. 2006). In this paper, we focus on the most
extreme events using several proxies for convective
intensity (to be defined shortly). The capabilities of
TRMM to observe such storms are best illustrated by
a specific example.
INTENSE THUNDERSTORM CASE OVER SOUTHERN OKLAHOMA. The database for
this paper is described in Nesbitt et al. (2000) and
Cecil et al. (2005). It consists of precipitation features
(PFs), defined as contiguous regions of precipitation.
Over the 7-yr period there are over 13 million PFs in
AFFILIATIONS: ZIPSER AND LIU—University of Utah, Salt Lake City, Utah; CECIL—University of Alabama at Huntsville, Huntsville, Ala-bama; NESBITT—Colorado State University, Fort Collins, Colorado; YORTY—North American Weather Consultants, Sandy, UtahCORRESPONDING AUTHOR: Edward J. Zipser, Department of Meteorology, University of Utah, 135 S 1460 E, Room 819, Salt Lake City, UT 84112-0110
E-mail: [email protected]
The abstract for this article can be found in this issue, following the table of contents.DOI:10.1175/BAMS-87-8-1057
In final form 7 April 2006©2006 American Meteorological Society
1058 AUGUST 2006|
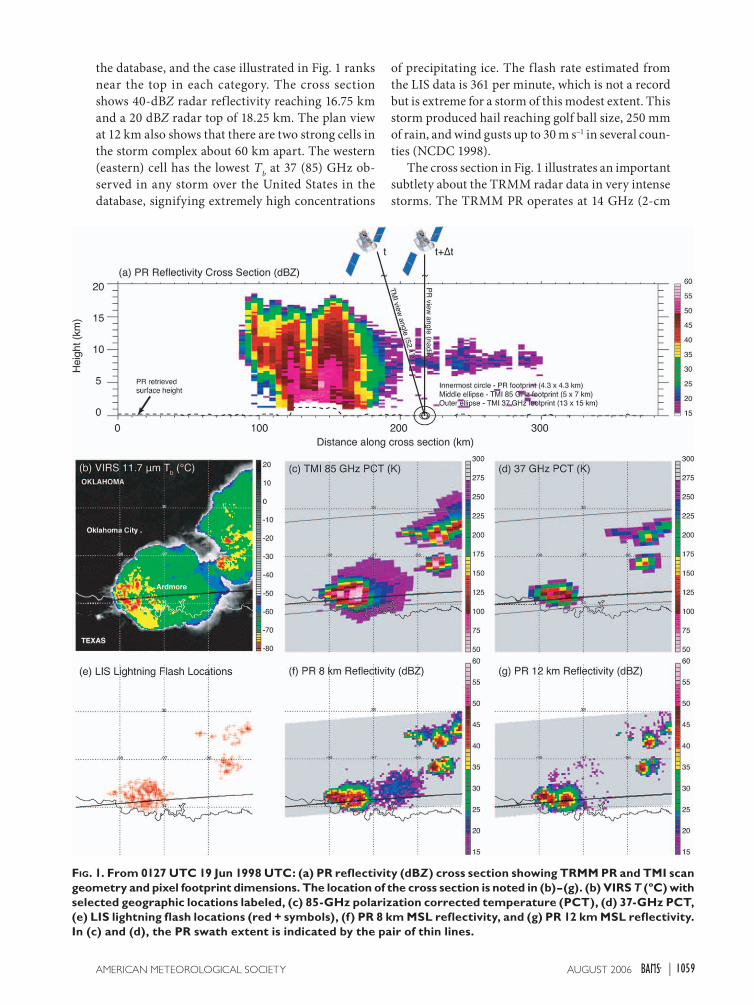
FIG. 1. From 0127 UTC 19 Jun 1998 UTC: (a) PR reflectivity (dBZ) cross section showing TRMM PR and TMI scan geometry and pixel footprint dimensions. The location of the cross section is noted in (b)–(g). (b) VIRS T (ºC) with selected geographic locations labeled, (c) 85-GHz polarization corrected temperature (PCT), (d) 37-GHz PCT, (e) LIS lightning flash locations (red + symbols), (f) PR 8 km MSL reflectivity, and (g) PR 12 km MSL reflectivity. In (c) and (d), the PR swath extent is indicated by the pair of thin lines.
the database, and the case illustrated in Fig. 1 ranks
near the top in each category. The cross section
shows 40-dBZ radar reflectivity reaching 16.75 km
and a 20 dBZ radar top of 18.25 km. The plan view
at 12 km also shows that there are two strong cells in
the storm complex about 60 km apart. The western
(eastern) cell has the lowest Tb at 37 (85) GHz ob-
served in any storm over the United States in the
database, signifying extremely high concentrations
of precipitating ice. The f lash rate estimated from
the LIS data is 361 per minute, which is not a record
but is extreme for a storm of this modest extent. This
storm produced hail reaching golf ball size, 250 mm
of rain, and wind gusts up to 30 m s–1 in several coun-
ties (NCDC 1998).
The cross section in Fig. 1 illustrates an important
subtlety about the TRMM radar data in very intense
storms. The TRMM PR operates at 14 GHz (2-cm
1059AUGUST 2006AMERICAN METEOROLOGICAL SOCIETY |

wavelength), a significantly attenuating frequency
in moderate to heavy precipitation compared with
lower radar frequencies such as S band, which is
the frequency used by the National Weather Service
(NWS) Next-Generation Weather Radar (NEXRAD).
While the attenuation correction algorithms devel-
oped for TRMM are highly refined (Iguchi et al. 2000;
Meneghini et al. 2000) and are deemed adequate
for rain estimation in most cases, they were never
intended to apply to storms with 40-dBZ echoes
through such a deep layer. In extreme storms, the
surface echo may disappear entirely, so attenuation
correction is basically impossible. Similarly, the
TMI rain algorithm sometimes deems the unusual
brightness temperatures from these extreme storms
“ambiguous” and fails to assign them a rain rate.
Fortunately for the TRMM rain estimates, such ex-
treme storms are rare. Yet the most accurate informa-
tion from the radar is precisely the maximum height
attained by specific dBZ values, before the need to
make attenuation corrections is acute.
DEFINITION OF “INTENSE” STORMS AND PROXIES FOR INTENSITY. Does not everyone
know an intense storm when they see one? Defining
intensity is not as easy as
it may seem. The term is
not defined in Glickman
(2000). But, a search for
“intense convection” will
f ind over 1,000 Ameri-
can Meteorological Society
(AMS) papers that use this
adjective for convective
storms. Mostly, the context
signals the author’s intent.
For example, if the subject
is severe weather analysis
or forecasting, the National
Weather Service defini-
tion is often used or im-
plied, requiring wind gusts
> 25 m s–1, hail > 1.9 cm in
diameter, or a tornado. If
the subject is storm elec-
trification, the writer often
equates storm intensity
with lightning f lash rate.
Many papers implicit ly
equate intensity with up-
draft magnitude, and in
this paper we also adopt
the position that the greater
the convective vertical velocity, the more intense the
storm. Doswell (2001) has an extended discussion of
the arbitrariness in defining the severity of storms,
but in several places he credits large, intense vertical
drafts with producing “a disproportionate share of
the most intense forms of convective severe weather,
excluding heavy precipitation.” This last phrase is
prescient, because it will be obvious that the locations
of the heaviest rainfall on Earth (tropical oceans and
certain mountain slopes) are rarely where the most
intense storms are found.
While we adopt this view that intensity can be
defined by the properties of the convective updrafts
in a storm, it is impossible to measure them around
the world. Therefore, we define proxies for convective
intensity that can be measured by the TRMM satellite.
Specifically, following the physical reasoning outlined
in many papers, for example, section 2c of Cecil et al.
(2005), we assume that, at least in a statistical sense,
• the higher the height attained by the 40-dBZ level
in a PF, the more intense the storm,
• the lower the minimum brightness temperature
attained in a PF at 37 and 85 GHz, the more intense
the storm, and
FIG. 2. Cumulative distribution functions for PF properties, i.e., probability of a PF having a measure of each parameter more extreme than the value on the abscissa. For each parameter, increasingly rare events are marked by a color change, from green (1% of events), through orange (0.1%), purple (0.01%) and black (0.001%). Not all events have 40-dBZ echoes or have LIS-observed lightning flashes, so those plots do not start at 100%.
1060 AUGUST 2006|

• the greater the lightning flash rate attained in a
PF, the more intense the storm.
RELATIVE FREQUENCY OF EXTREME EVENTS. The database for this study consists of all
TRMM PFs greater than four pixels in size (> 75 km2)
between 1 January 1998 and 31 December 2004. Au-
gust 2001 was not used because the TRMM satellite
orbit was boosted from 350 to 402 km during that
month to increase its lifetime, and the PR data are
compromised for that period; August 2005 was sub-
stituted. The frequency of rare events is quantified in
Fig. 2. For example, of the ~13 million PFs, only about
1% have lightning flash rates greater than 2.9 min–1,
0.1% greater than 32.9 min–1, etc. As the intensity
of the event increases, it becomes increasingly rare,
with the thresholds for each order of magnitude in
rarity signified by the green, orange, purple, and black
lines, respectively. These same colors are then used
to show the geographic distribution of rare, intense
events in Fig. 3.
The most significant result demonstrated in Fig.
3 is the similarity of the distributions of extreme
events as defined by each criterion. Each distribution
comes from a different sensor (or frequency) and is,
in principle, mostly independent of the others. To
the extent that extreme values of one parameter are
indicative of the intense vertical speed of convective
FIG. 3. Locations of intense convective events using the color code matching their rarity. The parameter limits for each category are indicated above each color bar. For example, of the 12.8 million PFs, only about 0.001% (128) have more than 314.7 lightning flashes per minute. The exact percentages for the break points are slightly different from the 40-dBZ echo-top figure because radar data are reported in discrete increments of 250 m.
1061AUGUST 2006AMERICAN METEOROLOGICAL SOCIETY |

updrafts, this figure is suggestive of locations of the
most intense thunderstorms on Earth.
There is a strong preference for extreme events
to be located over land. For lightning this has been
known for a long time (e.g., Orville and Henderson
1986). Many have commented on the poor correspon-
dence between the rainfall and lightning distributions
(e.g., Zipser 1994), using this fact as evidence for
showing ocean storms to be weaker (Lucas et al. 1994;
Williams and Stanfill 2002), although some point out
that aerosol concentrations may also be a factor (e.g.,
Rosenfeld and Lensky 1998; Williams et al. 2002).
The oceanic intertropical convergence zones have
heavy rain totals and regional maxima for moderately
strong storms (green), but contain few storms from
the three most intense categories. There is a clear
tendency for the most intense storms over oceans to
be adjacent to land, in locations favoring storm mo-
tion from land to ocean. Examples include tropical
oceans west of Central America and west Africa,and
subtropical oceans east of the southeastern United
States, South America, Australia, and Africa.
TRMM has a higher sampling frequency near 35°N
and 35°S compared with lower latitudes, which exag-
gerates the number of events toward those poleward
limits of the orbit. However, we show later that the
“hot spots” of Fig. 3 are indeed populated by genuinely
intense events, notably the United States and southeast
South America. While these continental maxima are
well known, the cluster of strong storms offshore of
eastern North America and South Africa may be some-
thing of a surprise, worthy of further study.
There are more subtle facts revealed by Fig. 3. The
equatorial land areas of Amazonia and Indonesia
FIG. 4. Seasonal cycle of the two most extreme categories (purple and black in Figs. 2 and 3) for each parameter.
1062 AUGUST 2006|

FIG. 5. Diurnal cycle of the three most extreme categories (top 0.1%; Figs. 2 and 3) for each parameter separated by land and ocean PFs. There are not enough extreme events over oceans to use only the top two categories.
have many moderately in-
tense but fewer extreme
storms than those of equa-
toria l Africa. Wil l iams
et al. (2002) recognized the
weaker storms in Amazonia
using the meteorological
metaphor “green ocean,”
and McCollum et al. (2000)
pointedly contrasted the
properties of Amazon and
equatorial African storms.
Figure 3 shows some re-
gions such as the Sahel
(just south of the Sahara)
that have extreme storms
concentrated in a single
season, as shown in Fig. 4.
Such strong seasonal cycles
often mark a single storm
season in an otherwise dry climate.
Focusing only on the two most extreme categories
(purple and black in Fig. 3) helps Fig. 4 illustrate the
strong seasonal preference in most regions. Most
are as expected, such as spring and summer in the
south-central United States and June–August in the
Sahel (10°–18°N across west Africa). The geographic
split over the Indian subcontinent is also a sea-
sonal split, with the intense premonsoon storms in
March–May over the Ganges Plain and Bangladesh,
while the heavy monsoon rains of June–August have
few intense storms. In contrast, the short monsoon
season in Kashmir (June–August) is also the season
of intense storms, as it is in the Sahel–Sahara transi-
tion zone, and, in the opposite season, in the transi-
tion zone between the Australian monsoon and the
desert just to the south. Southeast South America and
equatorial Africa are unusual in that they have some
intense storms in all seasons. The September–No-
vember period from 5° to 15°S in Brazil has been the
subject of field campaigns focused on the influence
of smoke from biomass burning, called the dry-to-
wet transition (Williams et al. 2002; Andreae et al.
2004); it is of interest that some storms of this season
are very intense.
The diurnal cycle of intense storms in Fig. 5 fea-
tures a strong afternoon maximum over land and a
broad nocturnal maximum over oceans. This is not
an unexpected result, so it serves as a “sanity check”
on the quality of the data. There are a few interest-
ing points, such as the stronger peak in the radar
proxy than the others, for which we have no obvious
explanation. The diurnal cycle of intense storms
peaks at the same time, but is much sharper than that
of rainfall over land (Nesbitt and Zipser 2003). The
amplitude of the oceanic extreme storm cycle is about
as small as that for rainfall, but it tends to be more of
a broad peak throughout the night, while the diurnal
cycle of rainfall has its peak near sunrise.
A different way to compare storm intensity around
the world is to calculate the cumulative distribution
function for each of the proxies for each 2° latitude
× 2° longitude box, and then map the top 0.1% (1%)
of the distribution in Fig. 6a (Fig. 6b). In this way,
the latitudinal sampling bias is accounted for in a
different way than in Figs. 3 and 4; regions with a
marginal number of PFs observed (Fig. 6c) are guar-
anteed to have the properties of the strongest storm
observed over the 7 yr shown. Regions with a very
large number of PFs (subtropical oceans, ITCZ) will
show properties of storms not quite at the top of the
local distribution. The result is similar: for each proxy,
the United States, Argentina, Congo, and parts of the
Indian subcontinent stand out as having the most
extreme convective events. (The Sahel has too small
a sample for Fig. 6a, but it shows up prominently in
Fig. 6b.) Note how nearly absent the tropical oceans
are in these measures, especially for the lack of high
40-dBZ tops and high flash rate storms.
Previous figures have emphasized pinpointing the
locations of some of the very strongest storms. Now,
we take the top 0.1% of the entire TRMM sample
(about 12,800 PFs) in each category, and ask what
fraction of these intense PFs (for each proxy) is found
in each 2° × 2° box? We remove all sampling bias by
normalizing by the total samples of the PR in each
1063AUGUST 2006AMERICAN METEOROLOGICAL SOCIETY |

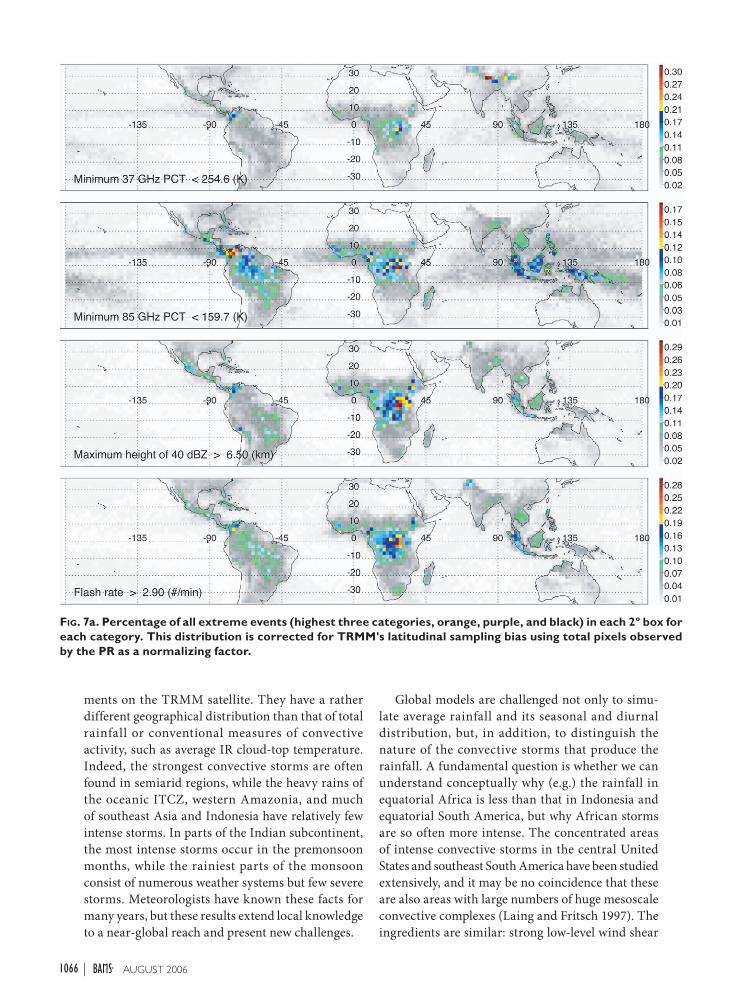
box. The resulting map (Fig. 7a) shows the geographic
distribution of the relative number of these strong
storms (rather than the very top of the distribution).
Now Africa is revealed for its major share of the
“moderately intense” storms while the United States,
Argentina, and the Ganges Plain somewhat less so,
although they have more of the most extreme events.
Note the utter dominance of land over oceans. Only
by admitting an additional order of magnitude (top
1% or 128,000 PFs; Fig. 7b) do the ocean storms in the
ITCZ emerge clearly, but only with some coherence
for the 85-GHz category.
HIGHER-LATITUDE STORMS. The TRMM
PR swath extends only about 1° latitude on either
side of nadir, meaning that we can only analyze the
properties of PFs between 36° and 36°S. To find out
whether there are equally intense storms outside of
these limits, we cannot use data from TRMM, so we
make use of 85-GHz passive microwave channels on
the Special Sensor Microwave Imager (SSM/I) on the
F-14 satellite with a sun-synchronous polar orbit, with
ascending nodes near 1900 local time (LT) and de-
scending nodes near 0700 LT (Fig. 8). Note that many
of the events in Fig. 8 in the Arctic and Antarctic are
likely artifacts due to the low 85-GHz emissivity of
snow cover.
The North American maximum extends well
into Canada, and there are some vigorous storms
observed across Eurasia as far as 60°N. Of these,
however, only the north-central United States and
central Canada approach the extreme intensity of the
south-central U.S. storms. The lack of landmasses
in the Southern Hemisphere higher latitudes leaves
FIG. 6a. Most extreme 0.1% PFs in each category for each 2°latitude × 2° longitude box. Boxes with less than 1000 PFs are left blank; sample size is shown in Fig. 6c.
1064 AUGUST 2006|

very few extreme storms occurring there. The close
similarity of the distributions shown in Figs. 3 and
8 between 36°N and 36°S indicates that calendar
year 2004 is reasonably representative of the 7-yr
database. Therefore, with the exceptions in North
America and Eurasia noted above, the TRMM PR
domain from 36°N to 36°S does capture the global
distribution of extreme convective storms. Brooks et
al. (2003) anticipated a similar global distribution of
intense storms by assuming that it would resemble
the distribution of environmental parameters ob-
tained from reanalysis data known to be associated
with severe storms.
SUMMARY. Extremely intense thunderstorms are
detected and diagnosed by a combination of instru-
FIG. 6b. As in Fig 6a, but most extreme 1%, leaving blank only boxes with less than 150 PFs.
FIG. 6c. Number of samples of PFs in each 2º × 2º box.
1065AUGUST 2006AMERICAN METEOROLOGICAL SOCIETY |
ments on the TRMM satellite. They have a rather
different geographical distribution than that of total
rainfall or conventional measures of convective
activity, such as average IR cloud-top temperature.
Indeed, the strongest convective storms are often
found in semiarid regions, while the heavy rains of
the oceanic ITCZ, western Amazonia, and much
of southeast Asia and Indonesia have relatively few
intense storms. In parts of the Indian subcontinent,
the most intense storms occur in the premonsoon
months, while the rainiest parts of the monsoon
consist of numerous weather systems but few severe
storms. Meteorologists have known these facts for
many years, but these results extend local knowledge
to a near-global reach and present new challenges.
Global models are challenged not only to simu-
late average rainfall and its seasonal and diurnal
distribution, but, in addition, to distinguish the
nature of the convective storms that produce the
rainfall. A fundamental question is whether we can
understand conceptually why (e.g.) the rainfall in
equatorial Africa is less than that in Indonesia and
equatorial South America, but why African storms
are so often more intense. The concentrated areas
of intense convective storms in the central United
States and southeast South America have been studied
extensively, and it may be no coincidence that these
are also areas with large numbers of huge mesoscale
convective complexes (Laing and Fritsch 1997). The
ingredients are similar: strong low-level wind shear
FIG. 7a. Percentage of all extreme events (highest three categories, orange, purple, and black) in each 2º box for each category. This distribution is corrected for TRMM's latitudinal sampling bias using total pixels observed by the PR as a normalizing factor.
1066 AUGUST 2006|

and a low-level jet bringing very moist air, with oc-
casional disturbances moving over the Rockies and
Andes that act to lift the low-level air and release
convective instability. Brooks et al. (2003) attribute
the steep tropospheric lapse rates in these regions to
midlevel air crossing these mountains. They also cite
the strong 0–6-km shear as favoring severe storms in
the midlatitudes, although we believe that low-level
wind shear is a more appropriate measure globally
because it is important to consider the shear below
midlevel jets such as the African Easterly Jet in the
Sahel, which often reverses above 3–4 km.
We used a very limited set of parameters from
the TRMM database for this paper. The relationship
of these parameters to convective vertical velocity is
plausible but not proven, and may only be valid in a
statistical sense. For example, for individual storms,
there is considerable overlap between very low bright-
ness temperatures at 85 and 37 GHz and very high
40-dBZ echoes, but the relationship is not one to one.
Radar reflectivity is a function of the sixth power of
the diameter of the scattering particles, while low
brightness temperatures are more closely related to
the third power, and only in the sense of an integrated
ice water content. We have much to learn about relat-
ing these observations to the cloud and precipitation
microphysics of convective storms.
The TRMM observations have great power for
studying convection, and the PR data have superior
vertical resolution. But, either all of the TRMM
data have footprints that are often larger than that
of convective cells, or nonuniform beam filling is
FIG. 7b. As in Fig. 7a, but showing percentage of all strong events (highest four categories, all colors in Figs. 2–3) in each 2º × 2º box.
1067AUGUST 2006AMERICAN METEOROLOGICAL SOCIETY |

a very significant issue. Severe convective storms
organized by strong wind shear often have large-di-
ameter rotating updrafts that may contain large ice
particles that may fill the radar beam (4.2 km × 4.2
km) and even the 85-GHz footprint (5 km × 7 km),
but rarely the 9 km × 16 km 37-GHz footprint. In
addition, in high-shear environments the storms'
convective regions (and thus the column of ice)
may be characteristically tilted by shear such that
it makes more common the observation of lower ice
scattering brightness temperatures due to the incli-
nation of the TMI ray paths (e.g., Hong et al. 2000).
Therefore, storms with equally intense updrafts but
a different horizontal scale or vertical tilt may ap-
pear to be of different “intensities” according to our
proxy variables. Specifically, some higher-latitude
storms may be supercells large enough to fill the
37-GHz footprint, while this may be very rare in
the deep Tropics. This is speculation that may help
explain why there are relatively more extreme events
in the subtropics using this proxy.
This paper focused on four parameters from this
database of extremely intense convective storms to
introduce the possibilities to the scientific com-
munity. Additional details are available for the
three-dimensional radar ref lectivity, lightning,
passive microwave, and visible and infrared chan-
nels. Interested scientists should contact any of the
authors to access the database. As the length of
record increases, we anticipate increasing robust-
ness of the statistics, but we believe that the data in
hand are already of great value for investigating the
occurrence, frequency, and properties of the most
intense storms on the planet.
FIG. 8. Extreme events at 85 GHz observed globally from one full year (2004) of SSM/I data from the Defense Meteorological Satellite Program (DMSP) F-14 satellite. Ascending orbits are near 1900 LT, descending orbits near 0700 LT. The limits of the TRMM database are shown at 36ºN and 36ºS. Color code is derived similarly to that for the TRMM database. The thresholds are different from those in Fig. 3 in part due to SSM/I's reduced spatial resolution.
1068 AUGUST 2006|

ACKNOWLEDGMENTS. This research has been
supported by NASA Precipitation Measurement Missions
under Dr. Ramesh Kakar. We thank Erich Stocker, John
Kwiatkowski, and the staff of the TRMM Science Data
and Information Systems for assistance in producing the
precipitation feature database.
REFERENCESAdler, R. F., M. J. Markus, and D. D. Fen, 1985: Detection
of severe Midwest thunderstorms using geosyn-
chronous satellite data. Mon. Wea. Rev.,
113, 769–781.
—, H.-Y. M. Yeh, N. Prasad, W.-K. Tao,
and J. Simpson, 1991: Microwave simu-
lations of a tropical rainfall system with
a three-dimensional cloud model. J.
Appl. Meteor., 30, 924–953.
—, G. J. Huffman, D. T. Bolvin, S.
Curtis, and E. J. Nelkin, 2000: Tropi-
cal rainfall distributions using TRMM
combined with other satellite and rain
gauge information. J. Appl. Meteor., 39,
2007–2023.
—, G. J. Huffman, C. Kummerow, D. T.
Bolvin, S. Curtis, and C. Kidd, 2003:
Status of TRMM monthly estimates of
tropical precipitation. Cloud Systems,
Hurricanes, and the Tropical Rainfall
Measuring Mission (TRMM): A Tribute
to Dr. Joanne Simpson, Meteor. Monogr.,
No. 51, Amer. Meteor. Soc., 223–234.
Andreae, M. O., D. Rosenfeld, P. Artaxo,
A. A. Costa, G. P. Frank, K. M. Longo,
and M. A. F. Silva-Dias, 2004: Smoking
rain clouds over the Amazon. Science,
303, 1337–1342.
Boccippio, D. J., W. A. Petersen, and D.
J. Cecil, 2005: The tropical convective
spectrum. Part I: Archetypal vertical
structures. J. Climate, 18, 2744–2769.
Brooks, H. E., J. W. Lee, and J. P. Craven,
2003: The spatial distribution of severe
thunderstorm and tornado environ-
ments from global reanalysis data.
Atmos. Res., 67–68, 73–94.
Cecil, D. J., S. J. Goodman, D. J. Boccippio,
E. J. Zipser, and S. W. Nesbitt, 2005:
Three years of TRMM precipitation
features. Part I: Radar, radiometric, and
lightning characteristics. Mon. Wea.
Rev., 133, 543–566.
Christian, H. J., and Coauthors, 2003: Global
frequency and distribution of lightning as observed
from space by the Optical Transient Detector. J. Geo-
phys. Res., 108, 4005, doi:10.1029/2002JD002347.
Doswell, C. A., III, 2001: Severe convective storms—An
overview. Severe Convective Storms, Meteor. Monogr.,
No. 5, Amer. Meteor. Soc., 1–26.
Glickman, T., Ed., 2000: Glossary of Meteorology. 2d ed.
Amer. Meteor. Soc., 855 pp.
Heymsfield, G. M., and R. Fulton, 1988: Comparison
of high-altitude remote aircraft measurements with
the radar structure of an Oklahoma thunderstorm:
How representative is a 7-yr sample of extreme thunder-
storms? It tells the basic story, but each additional observation holds the possibility of fi nding something new. This 30 Dec 1997 storm from northern Argentina occurred 2 days too early to be included in our 1998–2004 sample. But, its (a) 37-GHz scattering far exceeds any other storm in our study. Several of its pixels have 37-GHz PCT values below the 99-K minimum that was found for 1998–2004; one even reaches an astounding 69 K. The scattering core is horizontally displaced from the (b) 12-km radar refl ectivity core due to parallax from the TMI’s 52.1° incidence angle. Even the 19-GHz channel had substan-tial scattering, with a brightness temperature below 150 K. This strongly suggests the presence of very large hail. “Only” 225 fl ashes per minute were observed, due to its limited areal extent (compared with broad squall lines).
The (c) radar cross section is similarly impressive. The 40-dBZ echo reaches 19.5 km, taller than any others in our study, and one location (not shown) even has 34 dBZ in the uppermost PR altitude level (20 km). It should be noted here that the radar slant path has not been accounted for in our statistics. This can lead to a ~5% overestimate at the edge of the PR swath, where the viewing angle is 17°. For the cross section in this fi gure, the 11.4° viewing angle accounts for a 2% overestimate. Note that this is still small, compared to uncertainty in determining echo-top height from many ground-based radars. All of this is from a storm that looks strong, but not particularly out of the ordinary according to (d) its IR image.
TRMM’S CHAMPION THUNDERSTORM
1069AUGUST 2006AMERICAN METEOROLOGICAL SOCIETY |
Implications for precipitation estimation from space.
Mon. Wea. Rev., 116, 1157–1174.
—, G. Szewach, S. Schotz, and R. H. Blackmer Jr.,
1983: Upper-level structure of Oklahome tornadic
storms on 2 May 1979. II: Proposed explanation of
“V” pattern and internal warm region in infrared
observations. J. Atmos. Sci., 40, 1756–1767.
—, R. Fulton, and J. D. Spinhirne, 1991: Aircraft
overflight measurements of midwest severe storms:
Implications on geosynchronous satellite interpreta-
tions. Mon. Wea. Rev., 119, 436–456.
Hong, Y., J. L. Haferman, W. S. Olson, and C. D.
Kummerow, 2000: Microwave brightness tempera-
tures from tilted convective systems. J. Appl. Meteor.,
39, 983–998.
Houze, R. A., Jr., 2003: From hot towers to TRMM:
Joanne Simpson and advances in tropical convection
research. Cloud Systems, Hurricanes, and the Tropical
Rainfall Measuring Mission (TRMM): A Tribute to
Dr. Joanne Simpson, Meteor. Monogr., No. 51, Amer.
Meteor. Soc., 37–48.
Iguchi, T., T. Kozu, R. Meneghini, J. Awaka, and K.
Okamoto, 2000: Rain-profiling algorithm for the
TRMM precipitation radar. J. Appl. Meteor., 39,
2038–2052.
Kummerow, C., W. Barnes, T. Kozu, J. Shiue, and J.
Simpson, 1998: The Tropical Rainfall Measuring
Mission (TRMM) sensor package. J. Atmos. Oceanic
Technol., 15, 809–817.
—, and Coauthors, 2000: The status of the Tropical
Rainfall Measuring Mission (TRMM) after two years
in orbit. J. Appl. Meteor., 39, 1965–1982.
Laing, A. G., and J. M. Fritsch, 1997: The global popu-
lation of mesoscale convective complexes. Quart. J.
Roy. Meteor. Soc., 123, 389–405.
Lin, J., B. Mapes, M. Zhang, and M. Newman, 2004:
Stratiform precipitation, vertical heating profiles,
and the Madden–Julian oscillation. J. Atmos. Sci.,
61, 296–309.
Liu, C., and E. J. Zipser, 2005: Global distribution
of convection penetrating the tropical tropo-
pause. J. Geophys. Res., 110, D23104, doi:10.1029/
2005JD006063.
Lucas, C., M. A. LeMone, and E. J. Zipser, 1994: Vertical
velocity in oceanic convection off tropical Australia.
J. Atmos. Sci., 51, 3183–3193.
McCollum, J. R., A. Gruber, and M. B. Ba, 2000:
Discrepancy between gauges and satellite estimates
of rainfall in equatorial Africa. J. Appl. Meteor., 39,
666–679.
Meneghini, R., T. Iguchi, T. Kozu, L. Liou, K. Okomoto,
J. A. Jones, and J. Kwiatkowski, 2000: Use of the
surface reference technique for path attenuation
estimates from the TRMM precipitation radar. J.
Appl. Meteor., 39, 2053–2070.
Mohr, K. I., and E. J. Zipser, 1996a: Defining me-
soscale convective systems by their 85-GHz ice-
scattering signature. Bull. Amer. Meteor. Soc., 77,
1179–1189.
—, and —, 1996b: Mesoscale convective systems
defined by their 85-GHz ice scattering signature: Size
and intensity comparison over tropical oceans and
continents. Mon. Wea. Rev., 124, 2417–2437.
NCDC, 1998: Storm Data. Vol. 40, No. 6, 526 pp.
Negri, A. J., R. F. Adler, E. J. Nelkin, and G. J. Huffman,
1994: Regional rainfall climatologies derived from
Special Sensor Microwave Imager (SSM/I) data. Bull.
Amer. Meteor. Soc., 75, 1165–1182.
—, T. L. Bell, and L. Xu, 2002: Sampling of the diurnal
cycle using TRMM. J. Atmos. Oceanic Technol., 19,
1333–1344.
Nesbitt, S. W., and E. J. Zipser, 2003: The diurnal cycle
of rainfall and convective intensity according to
three years of TRMM measurements. J. Climate,
16, 1456–1475.
—, —, and D. J. Cecil, 2000: A census of precipita-
tion features in the Tropics using TRMM: Radar,
ice scattering, and ice observations. J. Climate, 13,
4087–4106.
—, —, and C. D. Kummerow, 2004: An examina-
tion of version-5 rainfall estimates from the TRMM
Microwave Imager, Precipitation Radar, and rain
gauges on global, regional, and storm scales. J. Appl.
Meteor., 43, 1016–1036.
—, R. Cifelli, and S. A. Rutledge, 2006: Storm mor-
phology and rainfall characteristics of TRMM pre-
cipitation features. Mon. Wea. Rev., 134, in press.
Orville, R. E., and R. W. Henderson, 1986: Global dis-
tribution of midnight lightning: September 1977 to
August 1978. Mon. Wea. Rev., 114, 2640–2653.
Petersen, W. A., and S. A. Rutledge, 2001: Regional
variability in tropical convection: Observations from
TRMM. J. Climate, 14, 3566–3586.
Rosenfeld, D., and I. M. Lensky, 1998: Satellite-based
insights into precipitation formation processes in
continental and maritime convective clouds. Bull.
Amer. Meteor. Soc., 79, 2457–2476.
Schumacher, C., and R. A. Houze Jr., 2003: Stratiform
rain in the Tropics as seen by the TRMM Precipita-
tion Radar. J. Climate, 16, 1739–1756.
—, —, and I. Kraucunas, 2004: The tropical dy-
namical response to latent heating estimates derived
from the TRMM Precipitation Radar. J. Atmos. Sci.,
61, 1341–1358.
Spencer, R. W., and D. A. Santek, 1985: Measuring the
global distribution of intense convection over land
1070 AUGUST 2006|
with passive microwave radiometery. J. Appl. Meteor.,
24, 860–864.
—, H. M. Goodman, and R . E . Hood, 1989 :
Precipitation retrieval over land and ocean with
the SSM/I: Identification and characteristics of
the scattering signal. J. Atmos. Oceanic Technol.,
6, 254–273.
—, R. E. Hood, F. J. LaFontaine, E. A. Smith, R.
Platt, J. Galliano, V. L. Griffin, and E. Lobl, 1994:
High-resolution imaging of rain systems with the
Advanced Microwave Precipitation Radiometer. J.
Atmos. Oceanic Technol., 11, 849–857.
Tao, W.-K., S. Lang, W. S. Olsen, R. Meneghini, S. Yang,
J. Simpson, C. Kummerow, E. Smith, and J. Halver-
son, 2001: Retrieved vertical profiles of latent heat
release using TRMM rainfall products for February
1998. J. Appl. Meteor., 40, 957–982.
Toracinta, E. R., D. J. Cecil, E. J. Zipser, and S. W. Nes-
bitt, 2002: Radar, passive microwave, and lightning
characteristics of precipitating systems in the Trop-
ics. Mon. Wea. Rev., 130, 802–824.
Vivekanandan, J., J. Turk, and V. N. Bringi, 1991: Ice water
path estimation and characterization using passive
microwave radiometry. J. Appl. Meteor., 30, 1407–1421.
Williams, E. R., and S. Stanfill, 2002: The physical ori-
gin of the land–ocean contrast in lightning activity.
Comp. Rendus Phys., 3, 1277–1292.
—, and Coauthors, 2002: Contrasting convec-
tive regimes over the Amazon: Implications for
cloud electrification. J. Geophys. Res., 107, 8082,
doi:10.1029/2001JD000380.
Zipser, E. J., 1994: Deep cumulonimbus cloud systems in
the Tropics with and without lightning. Mon. Wea.
Rev., 122, 1837–1851.
1071AUGUST 2006AMERICAN METEOROLOGICAL SOCIETY |