What´s New? SAP HANA SPS 07 - blog.scherbinek.de · What´s New? SAP HANA SPS 07 Administration &...
27
What´s New? SAP HANA SPS 07 Administration & Monitoring (Delta from SPS 06 to SPS 07) SAP HANA Product Management November, 2013
Transcript of What´s New? SAP HANA SPS 07 - blog.scherbinek.de · What´s New? SAP HANA SPS 07 Administration &...

What´s New? SAP HANA SPS 07 Administration & Monitoring (Delta from SPS 06 to SPS 07)
SAP HANA Product Management November, 2013

© 2013 SAP AG. All rights reserved. 2 Public
Content
This presentation provides an overview of the changes regarding administration, monitoring and
supportability of the SAP HANA database between the SPS 06 version and the SPS 07 version.
It covers changes to the SAP HANA studio administration perspective and changes to the SAP HANA
database.
Functionality of other SAP HANA studio perspectives (like the Information Modeler) is not covered in
this presentation.
© 2013 SAP AG. All rights reserved. 3 Public
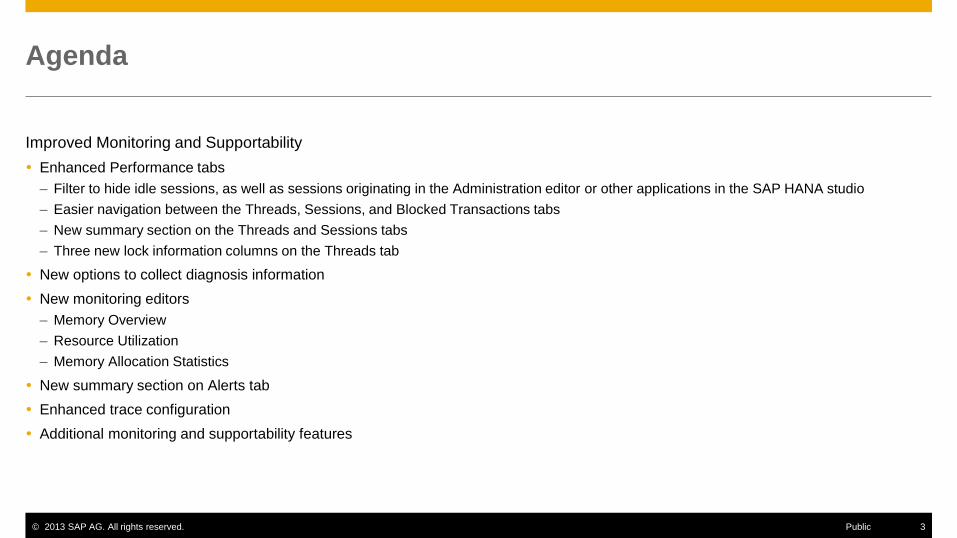
Agenda
Improved Monitoring and Supportability
Enhanced Performance tabs
– Filter to hide idle sessions, as well as sessions originating in the Administration editor or other applications in the SAP HANA studio
– Easier navigation between the Threads, Sessions, and Blocked Transactions tabs
– New summary section on the Threads and Sessions tabs
– Three new lock information columns on the Threads tab
New options to collect diagnosis information
New monitoring editors
– Memory Overview
– Resource Utilization
– Memory Allocation Statistics
New summary section on Alerts tab
Enhanced trace configuration
Additional monitoring and supportability features

© 2013 SAP AG. All rights reserved. 4 Public
Agenda
Additional Features
System replication configuration wizard enhancements
Statistics service
– New implementation design
– Additional lock statistics
SAP HANA system logoff and logon
Link to centrally-stored archive of SAP HANA systems

Improved Monitoring and
Supportability

© 2013 SAP AG. All rights reserved. 6 Public
Improved Monitoring and Supportability
Enhanced Performance tabs
Filter to hide idle sessions, as well as sessions originating in the Administration editor or other
applications in the SAP HANA studio
It is now possible to hide different session types from the Threads, Sessions, and Blocked Transactions tabs. Each option can
be selected from the drop-down menu Hide Sessions.
If an option is selected, a new SQL statement is executed to display only the filtered rows. This filter does not only operate at
the display level. When an option is selected, the database is queried again for the relevant sessions.

© 2013 SAP AG. All rights reserved. 7 Public
Improved Monitoring and Supportability
Enhanced Performance tabs
Easier navigation between the Threads, Sessions, and Blocked Transactions tabs
It is now possible to navigate between the Threads, Sessions, and Blocked Transactions tabs by using the connection ID. This
functionality is available from the context menu (Navigate To).
On the Threads tab, it is possible to navigate from/to callee/caller by using the thread ID.
On the Sessions tab, it is possible to navigate to the connection that is blocking the selected connection.
The application information (name and user) that is available on the Threads, Sessions and Blocked Transactions tabs can
also be used to open a pre-configured dialog for the SQL, performance, and expensive statement traces.

© 2013 SAP AG. All rights reserved. 8 Public
Improved Monitoring and Supportability
Enhanced Performance tabs
The Threads summary section shows how many
threads are active, and how many are active with type
SQLExecutor / JobWorker.
The Sessions summary section shows how many
sessions are active, how many users are connected,
and the user type.
New summary section on Threads and Sessions tabs
© 2013 SAP AG. All rights reserved. 9 Public
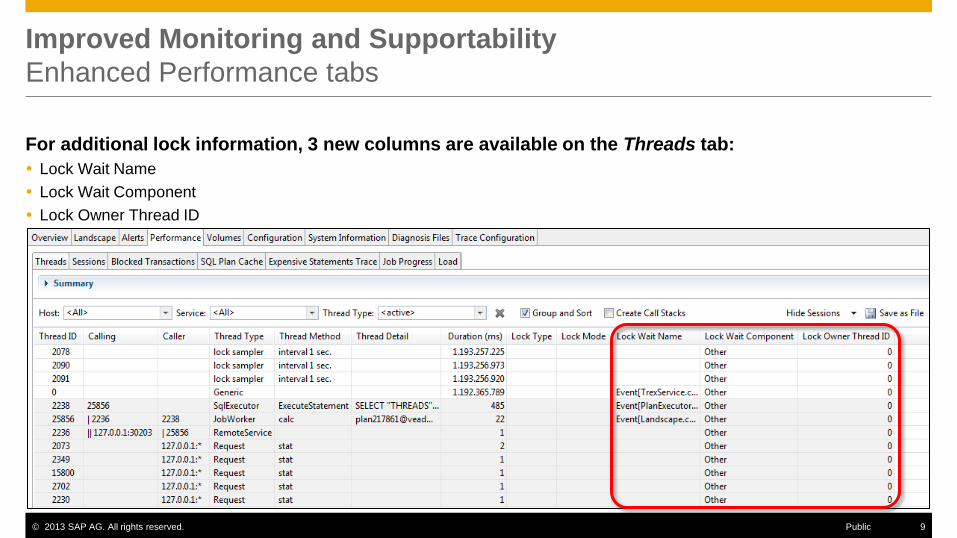
Improved Monitoring and Supportability
Enhanced Performance tabs
For additional lock information, 3 new columns are available on the Threads tab:
Lock Wait Name
Lock Wait Component
Lock Owner Thread ID

© 2013 SAP AG. All rights reserved. 10 Public
Improved Monitoring and Supportability
New options to collect diagnosis information
The SAP HANA studio supports new options to collect diagnosis information (fullSystemInfoDump.py)
Collect diagnosis information from the last N days.
Create a runtime environment dump file and collect it (rtedump generated and zipped).

© 2013 SAP AG. All rights reserved. 11 Public
Improved Monitoring and Supportability
New monitoring editors – Memory Overview
The new Memory
Overview editor provides
a detailed graphical
breakdown of the
following main categories
of memory usage:
Physical memory
SAP HANA database
Table data
Database
management
Other information
regarding the current size
of used resources can be
seen on the Overview tab
of the Administration
editor.

© 2013 SAP AG. All rights reserved. 12 Public
Improved Monitoring and Supportability
New monitoring editors – Resource Utilization
The new Resource
Utilization Statistics
editor enables you to
visualize and explore the
usage history of the
following key system
resources:
CPU
Memory
Disk
The editor can help to
analyze bottlenecks,
identify patterns, and
forecast requirements.
The editor can be
opened via the context-
menu of the specific SAP
HANA system.

© 2013 SAP AG. All rights reserved. 13 Public
Improved Monitoring and Supportability
New monitoring editors – Memory Allocation Statistics 1/2
The new Memory Allocation Statistics editor enables you to visualize and explore
the memory allocation of every service.
In the Administration editor, choose the Landscape > Services tab. Right-click the service whose
allocation history you want to investigate and choose Memory Allocation Statistics The following information
is displayed in screen
areas identified above: 1. The components of the
selected service listed in
descending order of current
used memory (default)
2. Current breakdown of SAP
HANA used memory
displayed as a pie chart
3. Allocators of the selected
component listed in
descending order of current
used inclusive memory
(default)
4. Current breakdown of
memory usage of the 10
highest consuming allocators
displayed as a pie chart
1 2
3 4
© 2013 SAP AG. All rights reserved. 14 Public
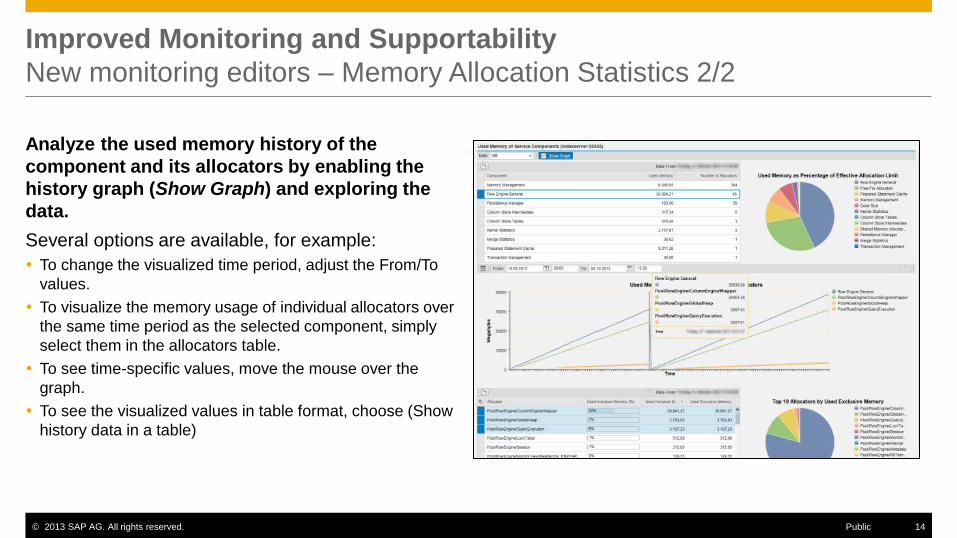
Improved Monitoring and Supportability
New monitoring editors – Memory Allocation Statistics 2/2
Analyze the used memory history of the
component and its allocators by enabling the
history graph (Show Graph) and exploring the
data.
Several options are available, for example:
To change the visualized time period, adjust the From/To
values.
To visualize the memory usage of individual allocators over
the same time period as the selected component, simply
select them in the allocators table.
To see time-specific values, move the mouse over the
graph.
To see the visualized values in table format, choose (Show
history data in a table)

© 2013 SAP AG. All rights reserved. 15 Public
Improved Monitoring and Supportability
New summary section on Alerts tab
The summary header on the Alerts tab shows the total number of current alerts by priority and the
corresponding list of alerts
Previous Alerts Tab New Alerts Tab

© 2013 SAP AG. All rights reserved. 16 Public
Improved Monitoring and Supportability
Enhanced trace configuration
In the Trace Configuration dialog for the Database, User-
Specific, and End-to End Traces, conflicts between different
configuration layers are indicated with an information icon
and mouse-over text.

© 2013 SAP AG. All rights reserved. 17 Public
Improved Monitoring and Supportability
Additional monitoring and supportability features
Sampling session monitor – accessed via system table M_SERVICE_THREAD_SAMPLES
Provides thread sampling data to allow historic workload analysis on several granularities like application, user, statement
Improved statistics server historization
Application information added to historized blocked transactions
New table M_SQL_CLIENT_NETWORK_IO captures client network I/O statistics
Elapsed time on client side including send, server execution and receive
Execution time on server side
Time when message was received on server side and start of execution
Size of messages received on server and client side
In-memory capturing of expensive statements
The ring buffer for M_EXPENSIVE_STATEMENTS is per default active and replaces the former trace files
Two new parameters were implemented in global.ini under the section expensive_statements

Additional Features

© 2013 SAP AG. All rights reserved. 19 Public
Improved Monitoring and Supportability
System replication configuration wizard enhancements
It is now possible to stop the original primary system after takeover, or to start the
secondary system after registration

© 2013 SAP AG. All rights reserved. 20 Public
Additional Features
Statistics Service – New implementation design
The new statistics service design leads to performance and flexibility improvements
The statistics server is the component of the SAP HANA database that provides internal monitoring functions.
It continuously collects information about system status, performance, and resource usage, and issues alerts
in the event of problems. As of SPS 07, it is possible to switch to a new mechanism whereby data collection
and alerting are implemented through the execution of SQLScript procedures. This has the following
advantages:
The statistics server component is no longer required. By replacing the statistics server with internal procedure calls, overall
system performance is improved with reduced disk usage, memory usage, and data transfer.
The statisticsserver.ini properties file is no longer required to contain all configuration information relating to data collection and
alerting. Instead this information is contained in new tables in the _SYS_STATISTICS schema. This increases the overall
flexibility with which data collection and alerting can be configured. For example, data collectors and checks can be scheduled
more flexibly, new collectors and checks can be added more easily, and data collectors and checks can be deactivated.
For more information about how to migrate to the new mechanism after an upgrade, see SAP Note 1917938

© 2013 SAP AG. All rights reserved. 21 Public
Additional Features
Statistics service – additional lock statistics
The statistics service now collects information about lock statistics into the following tables:
HOST_OBJECT_LOCK_STATISTICS
HOST_OBJECT_LOCKS
HOST_RECORD_LOCKS
The table HOST_BLOCKED_TRANSACTIONS has been enhanced to include connection and application information.

© 2013 SAP AG. All rights reserved. 22 Public
New user logoff and logon feature with configurable startup behavior
The user can logoff actively from an SAP HANA system via the context menu. Every connection (JDBC/HTTP) is closed after the
user executes the Log Off on a selected system (1). If no connection is established, the context menu provides the possibility to
logon to a system or delete it (2). The start-up behavior of the SAP HANA studio can be configured. Under Windows >
Preferences the user can decide to restore the logged-on/logged-off status of systems on startup (3).
Additional Features
SAP HANA system logoff and logon
1 2 3

© 2013 SAP AG. All rights reserved. 23 Public
New feature that allows users to connect efficiently to multiple SAP HANA systems
A centrally-stored archive of SAP HANA systems is an efficient way to deploy system information to all users of the SAP HANA
studio. It avoids users having to obtain the connection details of all systems individually and then having to add them all
individually.
One user can manage the list of all systems in a centrally-accessible archive (via File > Export > SAP HANA > Landscape)
Other users can then simply link to this archive (read-only mode)
1. In the context menu of the Systems view,
choose Add System Archive Link.
Additional Features
Link to centrally-stored archive of SAP HANA systems
2. Specify the link details:
a) Link name
b) Path to the system archive containing the
system information
c) Optional: A folder in the SAP HANA
Systems view
3. Choose Finish.
1 2
3
a) b)
c)

© 2013 SAP AG. All rights reserved. 24 Public
Disclaimer
This presentation outlines our general product direction and should not be relied on in making
a purchase decision. This presentation is not subject to your license agreement or any other
agreement with SAP.
SAP has no obligation to pursue any course of business outlined in this presentation or to
develop or release any functionality mentioned in this presentation. This presentation and
SAP’s strategy and possible future developments are subject to change and may be changed
by SAP at any time for any reason without notice.
This document is provided without a warranty of any kind, either express or implied, including
but not limited to, the implied warranties of merchantability, fitness for a particular purpose, or
non-infringement. SAP assumes no responsibility for errors or omissions in this document,
except if such damages were caused by SAP intentionally or grossly negligent.
Thank you
Contact information
Anke Riechers
SAP HANA Product Management
To get the best overview of what’s new in SAP HANA SPS 07, read this blog.

© 2013 SAP AG. All rights reserved. 26 Public
© 2013 SAP AG. All rights reserved.
No part of this publication may be reproduced or transmitted in any form or for any purpose without the express permission of SAP AG.
The information contained herein may be changed without prior notice.
Some software products marketed by SAP AG and its distributors contain proprietary software components of other software vendors.
National product specifications may vary.
These materials are provided by SAP AG and its affiliated companies ("SAP Group") for informational purposes only, without representation or warranty of any kind, and
SAP Group shall not be liable for errors or omissions with respect to the materials. The only warranties for SAP Group products and services are those that are set forth in
the express warranty statements accompanying such products and services, if any. Nothing herein should be construed as consti tuting an additional warranty.
SAP and other SAP products and services mentioned herein as well as their respective logos are trademarks or registered trademarks of SAP AG in Germany and other
countries.
Please see http://www.sap.com/corporate-en/legal/copyright/index.epx#trademark for additional trademark information and notices.

© 2013 SAP AG. All rights reserved. 27 Public
© 2013 SAP AG. Alle Rechte vorbehalten.
Weitergabe und Vervielfältigung dieser Publikation oder von Teilen daraus sind, zu welchem Zweck und in welcher Form auch immer, ohne die ausdrückliche schriftliche
Genehmigung durch SAP AG nicht gestattet. In dieser Publikation enthaltene Informationen können ohne vorherige Ankündigung geändert werden.
Einige der von der SAP AG und ihren Distributoren vermarkteten Softwareprodukte enthalten proprietäre Softwarekomponenten anderer Softwareanbieter.
Produkte können länderspezifische Unterschiede aufweisen.
Die vorliegenden Unterlagen werden von der SAP AG und ihren Konzernunternehmen („SAP-Konzern“) bereitgestellt und dienen ausschließlich zu Informationszwecken.
Der SAP-Konzern übernimmt keinerlei Haftung oder Gewährleistung für Fehler oder Unvollständigkeiten in dieser Publikation. Der SAP-Konzern steht lediglich für
Produkte und Dienstleistungen nach der Maßgabe ein, die in der Vereinbarung über die jeweiligen Produkte und Dienstleistungen ausdrücklich geregelt ist. Keine der
hierin enthaltenen Informationen ist als zusätzliche Garantie zu interpretieren.
SAP und andere in diesem Dokument erwähnte Produkte und Dienstleistungen von SAP sowie die dazugehörigen Logos sind Marken oder eingetragene Marken der SAP
AG in Deutschland und verschiedenen anderen Ländern weltweit. Weitere Hinweise und Informationen zum Markenrecht finden Sie unter http://www.sap.com/corporate-
en/legal/copyright/index.epx#trademark.