WHAT DO SUBJECTIVE ASSESSMENTS OF …WHAT DO SUBJECTIVE ASSESSMENTS OF FINANCIAL WELL-BEING REFLECT?...
28
WHAT DO SUBJECTIVE ASSESSMENTS OF FINANCIAL WELL-BEING REFLECT? Steven A. Sass, Anek Belbase, Thomas Cooperrider, and Jorge D. Ramos-Mercado CRR WP 2015-3 Released: March 2015 Center for Retirement Research at Boston College Hovey House 140 Commonwealth Avenue Chestnut Hill, MA 02467 Tel: 617-552-1762 Fax: 617-552-0191 http://crr.bc.edu Steven A. Sass is a research economist at the Center for Retirement Research at Boston College (CRR). Anek Belbase is research project manager at the CRR. Thomas Cooperrider is an associate at the Berkeley Research Group LLC. Jorge D. Ramos-Mercado is a research associate at the CRR. The research reported herein was pursuant to a grant from the FINRA Investor Education Foundation. The findings and conclusions expressed are solely those of the authors and do not represent the views of the FINRA Investor Education Foundation or Boston College. All errors are the authors’. © 2015, Steven A. Sass, Anek Belbase, Thomas Cooperrider, and Jorge D. Ramos-Mercado. All rights reserved. Short sections of text, not to exceed two paragraphs, may be quoted without explicit permission provided that full credit, including © notice, is given to the source.
Transcript of WHAT DO SUBJECTIVE ASSESSMENTS OF …WHAT DO SUBJECTIVE ASSESSMENTS OF FINANCIAL WELL-BEING REFLECT?...
WHAT DO SUBJECTIVE ASSESSMENTS OF FINANCIAL WELL-BEING REFLECT?
Steven A. Sass, Anek Belbase, Thomas Cooperrider, and Jorge D. Ramos-Mercado
CRR WP 2015-3 Released: March 2015
Center for Retirement Research at Boston College Hovey House
140 Commonwealth Avenue Chestnut Hill, MA 02467
Tel: 617-552-1762 Fax: 617-552-0191 http://crr.bc.edu
Steven A. Sass is a research economist at the Center for Retirement Research at Boston College (CRR). Anek Belbase is research project manager at the CRR. Thomas Cooperrider is an associate at the Berkeley Research Group LLC. Jorge D. Ramos-Mercado is a research associate at the CRR. The research reported herein was pursuant to a grant from the FINRA Investor Education Foundation. The findings and conclusions expressed are solely those of the authors and do not represent the views of the FINRA Investor Education Foundation or Boston College. All errors are the authors’. © 2015, Steven A. Sass, Anek Belbase, Thomas Cooperrider, and Jorge D. Ramos-Mercado. All rights reserved. Short sections of text, not to exceed two paragraphs, may be quoted without explicit permission provided that full credit, including © notice, is given to the source.

About the Center for Retirement Research The Center for Retirement Research at Boston College, part of a consortium that includes parallel centers at the University of Michigan and the National Bureau of Economic Research, was established in 1998 through a grant from the Social Security Administration. The Center’s mission is to produce first-class research and forge a strong link between the academic community and decision-makers in the public and private sectors around an issue of critical importance to the nation’s future. To achieve this mission, the Center sponsors a wide variety of research projects, transmits new findings to a broad audience, trains new scholars, and broadens access to valuable data sources.
Center for Retirement Research at Boston College Hovey House
140 Commonwealth Ave Chestnut Hill, MA 02467
Tel: 617-552-1762 Fax: 617-552-0191 http://crr.bc.edu
Affiliated Institutions: The Brookings Institution
Massachusetts Institute of Technology Syracuse University
Urban Institute

Abstract
Subjective financial assessments are used by social scientists as a measure of financial
well-being and by households as the basis for action. Financial well-being, however,
increasingly requires workers to build-up savings to meet hard-to-see future needs, specifically
retirement, their children’s education, and paying off student loans.
This paper analyzes data from the FINRA Investor Education Foundation’s 2012
Financial Capability Survey to test whether subjective financial assessments 1) primarily reflect
day-to-day, rather than distant, financial concerns; 2) increasingly reflect distant concerns if the
household’s day-to-day finances are in reasonably good shape; and 3) increasingly reflect distant
concerns if the worker is financially literate.
The paper found that:
• Subjective financial assessments primarily reflect day-to-day conditions.
• This remains the case even if the household’s day-to-day finances are in reasonably
good shape.
• Financial literacy enhances sensitivity to the lack of a retirement plan and having a
mortgage greater than the value of one’s house, but it has no noticeable effect on
sensitivity to life and medical insurance deficits, having an inactive retirement plan,
not saving for college, or student debt burdens.
The policy implications of the findings are:
• Subjective financial assessments have become a poor measure of financial well-
being.
• Workers by themselves cannot be expected to devote much effort to addressing
distant deficits.
• Initiatives to improve well-being must raise awareness – or compensate for the lack
of awareness – of hard-to-see distant future deficits.

1
Introduction
Peace of mind is one of the great benefits that comes from having one’s financial house
in order. Financial satisfaction is also often used as a measure of financial well-being. But bliss
could be the fruit of ignorance. If so, subjective financial assessments would be imperfect
measures of well-being and peace of mind hazardous to financial health.
Financial satisfaction is based on what one sees and values at a particular point in time.
Financial well-being, however, involves protection against hard-to-see risks and the build-up of
savings to meet future needs. So it would not be surprising if subjective assessments overlook
deficits in dealing with issues distant from day-to-day concerns. Households are increasingly
responsible for such issues, specifically paying off student loans and saving for retirement and
their children’s college education, as well as acquiring a home and paying off the mortgage
before they retire. To the extent that subjective assessments overlook deficits in these areas,
households could lack sufficient motivation to address these issues1 and the deficits are likely to
grow. Peace of mind then would diminish financial well-being.
This study examines the relationship between subjective financial self-assessments and
financial well-being by testing the following three hypotheses:
1. Day-to-day concerns, such as the ability to cover current expenses and debt payments,
have a significantly greater effect on subjective financial assessments than more distant
concerns, such as protection against risk and having enough savings to meet future needs.
2. Subjective financial assessments follow a pecking order, with distant issues having a
greater effect on subjective assessments once the household’s day-to-day finances are in a
reasonably good shape. To the extent that this is the case, motivation to address distant
deficits should rise as concern over day-to-day deficits declines.
3. Financial literacy significantly enhances the sensitivity of subjective financial
assessments to distant deficits. To the extent this is the case, initiatives that increase
financial literacy would increase a household’s motivation, as well as its ability, to
improve its financial well-being.
The discussion proceeds as follows. The first section reviews the literature on subjective
assessments as a measure of financial well-being. The second section describes the data and
methodology used to test the three hypotheses. The third section presents findings consistent
1 Isen (1987), Foote (2000).

2
with the first hypothesis, that subjective assessments largely reflect day-to-day financial
concerns. The fourth section presents findings that are inconsistent with the second hypothesis,
that distant issues have a significantly greater effect on subjective assessments once the
household’s day-to-day finances are in reasonably good shape. The fifth section presents
findings that are inconsistent with the third hypothesis, that financial literacy significantly
enhances the accuracy of subjective assessments, and especially the assessment of distant
financial issues. The final section concludes that financial satisfaction is a poor measure of
financial well-being and that initiatives to improve well-being must raise awareness – or
compensate for the lack of awareness – of hard-to-see distant financial deficits.
Subjective Assessments of Financial Well-being
Financial well-being is measured not by income and wealth, but by the happiness and life
satisfaction that income and wealth provide. Happiness and life satisfaction, however, are not
easily measured. Researchers have thus used financial satisfaction – an individual’s subjective
assessment of his or her financial condition – as a yardstick to assess well-being.2
An extensive body of research has shown that the relationship between an individual’s
financial condition and his or her happiness and life satisfaction is rather indirect. Increases in
national per capita income and wealth are associated with increases in self-assessed subjective
well-being. But the relationship is weak, and it weakens dramatically as per capita income and
wealth rise above relatively low levels. In prosperous economies, such as the United States,
overall levels of self-assessed happiness and life satisfaction have remained largely unchanged
over much of the last half century. At any point in time, however, an individual’s subjective
well-being is clearly related to the household’s financial condition: the rich generally report they
are happier and more satisfied with their lives than the poor. What seems to drive subjective
well-being in prosperous economies is not income and wealth, but income and wealth relative to
social reference groups, previous levels of income and wealth, and aspirations, which rise more
or less in line with increases in income and wealth.3
2 Another approach for assessing well-being is to identify household preferences from market behavior and uses these preferences to estimate the effect of actual or potential economic changes on happiness and life satisfaction. 3 Easterlin (1974, 1995, and 2004); MacDonald and Douthitt (1992); Hsieh (2001); Bowling and Windsor (2001), Blanchflower and Oswald (2004), Stutzer (2004), Van Praag (2004), Ferrer-i-Carbonell (2005); Luttmer (2005), Easterlin (2006), Johnson and Kreuger (2006), Seghieri, Tanturri, and DeSantis (2006), Vera-Toscano et al. (2006),

3
Financial satisfaction would nevertheless be a reasonable yardstick for assessing financial
well-being in prosperous economies if it reflected the household’s ability to maintain or improve
its income and wealth relative to its social reference groups and personal benchmarks.
Subjective financial assessments would also be a valuable motivator, with dissatisfaction an
incentive to improve the household’s sense of well-being.
An anomaly reported in Mugenda et al. (1993) and Xiao et al. (2013), however, raises
concerns about the use of subjective assessments as an indicator of financial well-being. These
studies found that financial literacy reduces satisfaction.4 The researchers suggested that
financially literate individuals do not have weaker finances, but are better equipped to see
deficits. This hypothesis is consistent with the notions that financial rationality is limited; that
subjective assessments can mask serious deficits; and that less literate households are overly
sanguine, and thus less likely to take action to improve their financial well-being. To the extent
this is the case, initiatives to improve well-being must correct, or otherwise accommodate,
inaccurate subjective assessments of the household’s financial condition.
This study contributes to the literature by testing the three hypotheses listed above for
working-age adults: 1) that subjective financial assessments are primarily associated with day-to-
day concerns; 2) that these assessments follow a pecking order, increasingly reflecting distant
concerns after day-to-day concerns are reasonably addressed; and 3) that financial literacy
significantly enhances the sensitivity of subjective assessments to distant concerns. The findings
address the use of subjective assessments as an indicator of financial well-being and as a
yardstick motivating households to improve their well-being. The findings also address the
design of initiatives to improve well-being by identifying: 1) issues that subjective assessments
reasonably reflect, both initially and as day-to-day concerns subside; 2) the ability of financial
literacy to improve the quality of subjective financial assessments, and thereby a household’s
motivation to improve its financial well-being; and 3) issues that require initiatives that correct or
otherwise accommodate inaccurate subjective assessments.
Clark, Frijters, and Shields (2008), Dolan, Peasgood, and White (2008), Joo and Grable (2008), Plagnol (2010a, 2010b), and Xiao, Chen, and Chen (2012). 4 Mugenda et al. (1990), Xiao, Chen, and Chen (2012).
4
Data and Methodology
Data. The study examines the relationship between the subjective financial assessments of
working-age adults and their household’s objective financial condition. It uses data collected in
the 2012 FINRA Investor Education Foundation State-by-State Financial Capability Survey, an
online survey of 25,509 American adults conducted from July to October 2012.5 The sample
used in this study excludes:
• 5,414 respondents who are under age 25, full-time students, or living with parents,
friends, or roommates, to exclude respondents who are not fully engaged in the labor
force or have not established an independent household.
• 6,648 of the remaining respondents who are retired or disabled or whose spouse is retired
or disabled, as their financial condition is difficult to assess from the data collected in the
Survey.
• 1,447 of the remaining respondents who say someone else in the household is more
knowledgeable about saving, investing, and debt, as the study is interested in the quality
of household assessments.
• 138 of the remaining respondents who indicated that they “don’t know” or “prefer not to
say” when asked how satisfied they are with their current financial condition.
• 1,284 of the remaining respondents who answered “don’t know” or “prefer not to say”
when asked about particular financial conditions.
This leaves a sample of 10,578 respondents. The dataset includes population weights, which
the study uses, to make this very large sample representative of the nation at large.
Subjective assessments of the household’s overall financial condition are provided by
responses to the question: “Overall, thinking of your assets, debts and savings, how satisfied are
you with your current personal financial condition? Please use a 10-point scale, where 1 means
‘Not At All Satisfied’ and 10 means ‘Extremely Satisfied.’ The Survey asked this question at the
beginning of the interview, before respondents were asked any questions that would lead them to
5 The Survey sampled approximately 500 respondents in each state plus the District of Columbia, with the sample in each state approximating Census distributions by age, gender, ethnicity, education, and income. FINRA Foundation (2012a and 2012b).

5
review their finances. Their responses can thus be taken as representative of subjective financial
assessments in the population at large.6 The distribution of responses is given in Figure 1.
Figure 1. Distribution of Subjective Financial Assessments Given on a Scale from 1 to 10 Households in the Labor Force, 2012*
* See text for description of the sample. Source: Authors’ calculations using data from FINRA Investor Education Foundation (2012a).
To assess relationships between this measure of financial satisfaction and the household’s
financial condition, the study uses the set of indicators listed in Table 1, which also gives their
incidence in the sample.
6 Different surveys ask different questions to assess financial satisfaction for different analytic reasons. This study analyzes the relationship between financial satisfaction and day-to-day as opposed to distant financial conditions. That the question in the FINRA Foundation Survey explicitly asks, “thinking of your assets, debts and savings,” prompts respondents to consider issues other than day-to-day concerns and their responses might give distant concerns somewhat greater weight; that the question focuses on current stocks of “assets, debts and savings,” on the other hand, might prompt respondents to make a present-minded, rather than forward-looking, assessment of their financial condition. All in all, the question seems well suited for this study.
15.5%
5.8%
9.4% 9.5% 10.1% 11.4%
15.1%
13.0%
5.3% 4.9%
0%
6%
12%
18%
1 2 3 4 5 6 7 8 9 10
1 = Not satisfied at all 10 = Extremely satisfied

6
Table 1. Household Financial Indicators Included in the Study Day-to-day concerns Incidence Self-assessed difficulty covering expenses Not difficult 43% Moderately difficult 42% Very difficult 15% Unemployment Neither the respondent nor a spouse or partner is unemployed 89% Unemployed: respondent and/or a spouse or partner is unemployed 11% Self-assessed current debt burden * Not too much debt 28% Moderate debt burden 37% Heavy debt burden 35% Ability to access $2,000 Could certainly or probably access $2,000 58% Could not likely access $2,000 42% Distant concerns Incidence Medical insurance Has medical insurance 81% No medical insurance 19% Life insurance Has life insurance 64% No life insurance 23% Life insurance not needed (no dependents or social security benefits deemed adequate) 13% Retirement* Active retirement plan 61% Inactive retirement plan 11% No retirement plan 28% Saving for college Saving for college 20% College graduate not saving 8% Non-graduate not saving 24% No need to save (no financially dependent children) 48% Housing Own free and clear 18% Own with a mortgage 37% Own, underwater 11% Rent 34% -cont’d-

7
Table 1. Household Financial Indicators Included in the Study (cont’d) Distant concerns Incidence Student loans No student loans 78% Concerned might not be able to repay 11% Not concerned about repaying 11% Notes: Self-Assessed Current Debt Burden: Based on responses to “How strongly do you agree or disagree with the statement ‘I have too much debt right now?” on a scale from 1 to 7, with a response of 3 to 5 classified as “Moderate debt burden.” Retirement: Respondents with “No retirement plan” have neither employer DB pension accruals nor 401(k)/IRA type retirement savings; respondents with an “Inactive retirement plan” have only 401(k)/IRA type savings and no one in the household is currently making regular contributions to such plans. Source: Authors’ calculations using data from FINRA Investor Education Foundation (2012a).
Previous research has shown that financial satisfaction varies by age, income, and various
personal characteristics. It can also be expected to vary with local labor market conditions. The
study thus controls for age, income, other personal characteristics, and local labor market
conditions listed in Table 2.
Table 2. Control Characteristics Included in the Study Incidence Age group 25-34 23% 35-44 26% 45-54 28% 55-retirement 24% Adjusted income quartile* 1st quartile (lowest) 25% 2nd quartile 25% 3rd quartile 25% 4th quartile (highest) 25% Sex Female 52% Male 48% Marital status Never married 21% Divorced, separated, or widower 15% Married 64% Ethnicity White 73% Not white 27% -cont’d-

8
Table 2. Control Characteristics Included in the Study (cont’d) Incidence Education College or more 35% Some college 35% High school or less 30% Aversion to investment risk* Willing to take risks 20% Moderately risk averse 50% Risk averse 30% Seen a financial advisor in the last 5 years Has seen a financial advisor 57% Has not seen a financial advisor 42% Financial literacy* Not financially literate 51% Financially literate 49% County unemployment rate Less than 6.2% 26% 6.2-8.0% (the U.S. rate for 2012) 50% Greater than 8.0% 24% Notes: Adjusted income quartile: Each age group is divided into adjusted household income quartiles using the OECD equivalence scale (OECD n.d.). Each quartile includes all respondents in each age-specific quartile: the lowest quartile includes all respondents in the lowest adjusted income quartile in each age group. Aversion to investment risk: Based on responses to “When thinking of your financial investments, how willing are you to take risks?” on a scale from 1 to 10, with a response of 4 to 7 classified as “Moderately risk averse.” Financial literacy: Based on number of correct answers to five standard financial literacy questions, with those answering four or five questions correctly coded as “Financially literate” and all others coded as “Not financially literate.” Source: Authors’ calculations using data from FINRA Investor Education Foundation (2012a). Methodology. The study does not attempt to identify causal relationships running from financial
conditions to subjective assessments. Instead, it attempts to identify statistically significant
associations either consistent with or conflicting with the above hypotheses. To identify
relationships between subjective assessments and the household’s financial condition, study
estimates the model:
𝑆𝑆𝑆 = 𝛽0 + 𝜷𝒅𝒅𝒙𝒅𝒅 + 𝜷𝒅𝒅𝒙𝒅𝒅 + 𝜷𝑪𝒙𝑪 + 𝜀 . (1)
with subjective financial assessments SFA dependent on 𝛽0, the baseline assessment of those
with no financial deficits or control characteristics associated with reductions in financial
satisfaction; on day-to-day and distant financial deficits 𝒙𝒅𝒅 and 𝒙𝒅𝒅 and control characteristics
associated with reduced assessments 𝒙𝒄; and on 𝜷𝒅𝒅, 𝜷𝒅𝒅, and 𝜷𝒄 reductions in financial

9
satisfaction associated with these deficits and characteristics. The estimated 𝜷𝒅𝒅 and 𝜷𝒅𝒅
coefficients then indicate the relationship between each day-to-day and distant deficit and the
respondents’ subjective financial assessments.
In this regression, the baseline “adequate” financial conditions and control characteristics
associated with greater satisfaction are the first conditions and characteristics listed for each item
in Tables 1 and 2, with the exception of 1) housing, where “own with a mortgage” is taken as the
baseline “adequate” condition; 2) age and income, where the baseline is set in the middle of the
age and income distribution – the 45 to 54 age group and the third income quartile; and 3) local
labor market conditions, which is entered as a variable without any baseline condition.7 The
model is estimated using Ordinary Least Squares (OLS) with robust standard errors to correct for
heteroskedasticity and population weights to correct for sampling bias.8
The first hypothesis asserts that day-to-day concerns have a significantly greater effect on
subjective financial assessments than more distant concerns. To test this hypothesis, the study
conducts an analysis of variance (ANOVA) to identify the extent to which financial satisfaction
is associated with day-to-day as opposed to distant conditions alone, and whether the difference
is statistically significant. The incidence of day-to-day and distant deficits is virtually the same.
Respondents, on average, have 1.82 day-to-day deficits and 1.80 distant deficits.9 So if the
ANOVA results show financial satisfaction is primarily associated with day-to-day concerns, this
would support the notion that financial satisfaction is significantly more sensitive to day-to-day
as opposed to distant financial conditions.
The second hypothesis asserts that subjective financial assessments follow a pecking
order, with financial satisfaction having a significantly stronger relationship with distant issues
as concern over day-to-day deficits subsides. To test this hypothesis, the study constructs a
proxy measure of an individual’s concern over day-to-day deficits. That measure uses the
estimated 𝜷𝒅𝒅 reductions in subjective financial assessments associated with dire day-to-day
deficits in the sample as a whole – the reductions associated with covering day-to-day expenses
7 See Mugenda, Hira, and Fanslow (1990) and Xiao, Chen, and Chen (2013) for studies that find financial literacy associated with reduced subjective financial assessments. For other characteristics see Hsieh (2001) and Joo and Grable (2004). 8 The other models in this study were also estimated with OLS, robust standard errors, and sample weights. 9 Day-to-day deficits are: 1) covering expenses is very or moderately difficult; 2) unemployment; 3) self-assessed current debt burdens are moderate or heavy; and 4) could not likely access $2,000. Distant deficits are: 1) no medical insurance; 2) no life insurance; 3) no retirement plan or an inactive retirement plan; 4) not saving for college; 5) a mortgage greater than the value of one’s house or renting; and 6) having student loans.
10
being “very difficult,” current debt burdens “heavy,” at least one member of the household is
unemployed, and if the respondent could not likely access $2,000 if need be. The proxy measure
is the sum of the 𝜷𝒅𝒅 reductions associated with each of the individual’s dire day-to-day deficits.
For example, if the respondent indicated that covering day-to-day expenses is “very difficult”
and their spouse is unemployed, the proxy measure of their concern over day-to-day deficits
would be the sum of the two reductions in financial satisfaction associated with these deficits for
the population as a whole. This measure is then standardized to vary from 0 to 1, with 1
representing a household with all four dire day-to-day deficits.10
To test whether subjective financial assessments follow a pecking order, the study then
estimates the following model:
𝑆𝑆𝑆 = 𝛽0𝑝 + 𝜷𝒅𝒅
𝒑 ∙ 𝒙𝒅𝒅 + 𝜷𝒅𝒅𝒑 ∙ 𝒙𝒅𝒅 + 𝝃𝒅𝒅
𝒑 ∙ 𝑠𝒙𝒅𝒅 + 𝜷𝑪𝒑𝒙𝑪 + 𝜀′′ (2)
In this model, 𝝃𝒅𝒅𝒑 ∙ 𝑠𝒙𝒅𝒅 is the vector of changes in the relationship between financial
satisfaction and distant deficits, 𝒙𝒅𝒅, while 𝑠, the standardized measure of concern over day-to-
day deficits, varies from 0 to 1.11 These changes are modeled as linear functions of s, so 𝝃𝒅𝒅𝒑 is a
vector of constants. The relationship between financial satisfaction and each distant deficit 𝑥𝑑𝑑𝑑
is modeled as the baseline reduction for that deficit, 𝛽𝑑𝑑𝑑𝑝 , when s is equal to 0, plus a constant
𝜉𝑑𝑑𝑑𝑝 times 𝑠, as 𝑠 varies from 0 to 1. To the extent that the estimated 𝝃𝒅𝒅
𝒑 coefficients are
statistically and economically significant, the results would be consistent with the notion that
subjective financial assessments become more sensitive to distant deficits as concern over day-
to-day deficits declines.
The final hypothesis asserts that financial literacy increases sensitivity to the household’s
financial condition, and especially to more distant conditions. To test this hypothesis, the study
estimates the following model:
𝑆𝑆𝑆 = 𝛽0𝑓 + 𝜷𝒅𝒅
𝒇 𝒙𝒅𝒅 + 𝝃𝒅𝒅𝒇 𝒙𝒅𝒅 + 𝜷𝒅𝒅
𝒇 𝒙𝒅𝒅 + 𝝃𝒅𝒅𝒇 𝒙𝒅𝒅 + 𝜷𝑪
𝒇𝒙𝑪 + 𝜀′′′. (3)
10 The study tested more complex models but could not estimate many coefficients due to colinearity. These tests also provided the same statistically significant estimates as this simple model. 11The coefficients carry the superscript “p,” because they differ from the coefficients in model (1).

11
In this model, 𝜷𝒅𝒅𝒇 and 𝜷𝒅𝒅
𝒇 are vectors of marginal changes in the relationship between
subjective assessments and day-to-day and distant deficits, 𝒙𝒅𝒅 and 𝒙𝒅𝒅, for financially non-
literate individuals; 𝝃𝒅𝒅𝒇 and 𝝃𝒅𝒅
𝒇 are vectors of marginal changes in these relationships for
financially literate individuals relative to non-literate individuals. The regression results would
be consistent with the hypothesis that financially literate individuals are more sensitive to
deficits, and especially distant deficits, to the extent that the 𝝃𝒅𝒅𝒇 coefficients, and especially the
𝝃𝒅𝒅𝒇 coefficients, are statistically and economically significant.
It is important to note that the reductions in subjective financial assessments identified in
the study are reductions relative to an “adequate” baseline state. The reductions include both 1)
reductions from an “initial” state among those with a deficit and 2) increases in subjective
assessments above that “initial” state among those who address a particular issue and raise the
“adequate” baseline constant. Thus the reduction associated with a lack of college saving
includes both the reduction in financial satisfaction among those who are not saving and the
increase in satisfaction among those who are. To the extent that the reductions identified in the
study are due to increases in financial satisfaction above an initial state, they overstate the
motivation the deficit generates to address a particular issue. Such overstatements are plausibly
greater for distant deficits, whose existence and impact are more difficult to see.
Two limitations on the accuracy of the results should also be noted. The first is due to
the fact that three indicators of the household’s financial condition are subjective – the
respondent’s subjective sense of difficulty in covering every-day expenses, having too much
current debt, and being able to repay student debt. This creates potential measurement error, as
respondents with the same objective level of financial difficulty could have different subjective
assessments. More troublesome, this reliance on subjective indicators could bias the results.
This would be the case if objectively similar respondents have different dispositions and those
with “gloomy” dispositions indicate greater difficulty with these issues and less satisfaction with
their finances; and those with “sunny” dispositions report less difficulty and greater satisfaction
with their finances. The regressions include a variable that reflects the respondent’s disposition
– the respondent’s aversion to investment risk – which should limit “dispositional” bias. But to
the extent that “dispositional” bias persists, the regression estimates would overstate the

12
relationship between financial satisfaction and these three issues, two of which are day-to-day
issues of central importance to this study.
The second limitation is due to the fact that the objective measures are imprecise. The
data do not allow an assessment of the adequacy of the household’s employment, medical and
life insurance coverage, accumulation of home equity, and college and retirement savings. The
regressions estimate differences between a lack of employment, insurance, and savings and
average employment, insurance, and savings. It cannot estimate the relationship between
financial satisfaction and differences in the adequacy of these financial conditions.
Correlates of Subjective Assessments
The regression results estimating equation (1) are presented in Table 3. They show day-
to-day deficits are associated with large reductions in subjective financial assessments and
distant deficits with much milder reductions.
Table 3. Correlates of Self-Assessed Financial Situation Coefficient Standard error Day-to-day concerns Self-assessed ability to cover expenses Very difficult to cover expenses -2.130 *** [0.089] Moderately difficult to cover expenses -1.178 *** [0.055] Employment Unemployed -0.525 *** [0.076] Self-assessed current debt burden Heavy debt burden -1.329 *** [0.067] Moderate debt burden -0.511 *** [0.055] Access $2,000 Could not likely access $2,000 -0.697 *** [0.061]
Distant concerns Insurance No medical insurance -0.368 *** [0.069] No life insurance -0.095 [0.056] Life insurance not needed 0.033 [0.097] Retirement No retirement plan 0.018 [0.064] Inactive retirement plan -0.282 *** [0.066] -cont’d-

13
Table 3. Correlates of Self-Assessed Financial Situation (cont’d) Distant concerns Coefficient Standard error Saving for college Graduate not saving -0.610 *** [0.082] Non-graduate not saving -0.654 *** [0.075] No need to save -0.309 *** [0.064] Housing Own free and clear 0.301 *** [0.061] Own, underwater -0.057 [0.074] Rent -0.427 *** [0.058] Student loans Concerned might not be able to repay -0.123 [0.076] Has loans, not concerned about repaying -0.224 *** [0.068] Control characteristics Male -0.032 [0.043] Marital status Never married -0.137 * [0.063] Divorced, separated, or widower -0.159 * [0.063] Non-white ethnicity 0.063 [0.053] Education Some college -0.245 *** [0.055] High school or less -0.109 [0.066] Aversion to investment risk Risk averse -1.576 *** [0.072] Moderately risk averse -0.854 *** [0.061] Has not seen a financial advisor -0.109 * [0.044] Financially literate -0.473 *** [0.046] County unemployment rate 0.004 [0.011] Age group Ages 25 to 34 0.617 *** [0.064] Ages 35 to 44 0.159 ** [0.057] Ages 55 or older 0.08 [0.060] Adjusted income quartile Lowest quartile -0.023 [0.081] Second quartile -0.084 [0.060] Highest quartile 0.391 *** [0.058] Constant 8.554 *** [0.128] N 10,578 R2 0.457 Note: * p<0.05; ** p<0.01; *** p<0.001 Source: Authors’ calculations using data from FINRA Investor Education Foundation (2012a).

14
As shown in Table 3, significant difficulty in covering daily expenses is associated with a
2.1-point reduction. Heavy current debt burdens are associated with a 1.3-point reduction.
Unemployment, in addition to making it more difficult to cover daily expenses and meet current
debt payments, reduces subjective assessments by an additional 0.5 points. And a lack of access
to $2,000 is associated with a 0.7-point reduction.12 (As financial satisfaction is measured on a
scale from 1 to 10, each 1-point reduction is equivalent to an 11 percentage point reduction in
subjective financial assessments.)
Among distant concerns, the only deficits associated with more than a half-point decline
are the 0.6- and 0.7-point reductions associated with a lack of college saving. These reductions,
however, could be more apparent than real. The 0.3-point reduction associated with “no need to
save,” for households with no financially dependent children, suggests that saving for college is
associated with a 0.3-point increase in satisfaction above an initial state, which raises the
baseline constant. For households with dependent children, not saving for college would thus be
associated with a much milder reduction in subjective financial assessments.
The only other distant deficits associated with any statistically significant reduction in
subjective assessments are renting (-0.4 points), a lack of medical insurance (-0.4), and having an
inactive retirement plan (–0.3). Relationships with other distant deficits – a lack of life
insurance, no retirement plan, home ownership with a mortgage greater than the value of one’s
house, concern about repaying student loans, and having student loans but not concerned about
repaying those loans – are all small and not statistically significant.
A surprising result is the relationship between subjective financial assessments and
retirement saving. Households with no retirement plan – with neither traditional defined benefit
pension accruals nor any 401(k)/IRA savings – are clearly in a more adverse condition than
households with an inactive plan – households with 401(k)/IRA savings, and perhaps defined
benefit pension accruals, but who currently do not “regularly contribute” to those plans. Having
an inactive plan is associated with a 0.3-point reduction in subjective assessments relative to
having an active plan. But having no plan has no apparent effect.
12 The very large reductions in subjective financial assessments associated with risk aversion suggest that dispositional factors could indeed have a large effect on subjective assessments, including assessments of difficulty in covering day-to-day expenses and the weight of current debt burdens. But the very large reductions in subjective assessments associated with risk aversion also suggest that the inclusion of this variable controls much of the bias that dispositional factors would otherwise introduce in estimates of the relationship between in subjective assessments and these two day-to-day deficits.

15
This result is consistent with the notion that a lack of salience, not just present-
mindedness, underlies the relatively weak relationship between subjective assessments and
distant financial concerns. Day-to-day deficits are not just “present,” they are also salient.
Households are continually reminded of difficulty in covering current expenses, making current
debt payments, wanting to work but lacking a job, and the fragility of their finances that lacking
reliable access to $2,000 entails. This is not the case with deficits in retirement planning and
other distant deficits. From a present-minded perspective, respondents with an inactive plan are
better off than respondents without a plan. But respondents with an inactive plan seem aware of
having a deficit. Those without a plan do not.
Turning to the control variables, the results find their relationship with financial
satisfaction is generally small and statistically insignificant. Two characteristics, however, have
economically and statistically significant relationships with subjective assessments: investment
risk aversion and financial literacy. Strong risk aversion is associated with a large 1.6-point
decline in financial satisfaction and moderate risk aversion with a 0.9-point decline. To the
extent investment risk aversion reflects the respondent’s financial “disposition,” this strong
association could reflect their “gloominess” or “sunniness.” The inclusion of this variable could
then control much of the bias that dispositional factors would otherwise introduce into estimates
of the relationship between financial satisfaction and the respondents’ subjective assessments of
their ability to cover day-to-day expenses and having too much debt.
Consistent with earlier research, the results also show individuals ages 25 to 34 and
individuals in the highest income quartile, all else equal, are significantly more satisfied with
their finances. Consistent with the Mugenda/Xiao findings, the results show financial literacy to
be associated with a 0.5-point decline in financial satisfaction.
Do Subjective Assessments Place More Weight on Day-to-Day Concerns?
To test whether this is the case, the study conducts an analysis of variance to identify the
extent to which financial satisfaction is associated with day-to-day, as opposed to distant,
conditions. The results show day-to-day conditions alone are associated with 11 percent of the
variance in financial satisfaction, as opposed to just 2 percent for distant conditions. A t-test
confirms that this difference is statistically significant at the 0.999 confidence level.

16
A complicating issue in assessing the relationship between distant concerns and financial
satisfaction is that attending to distant concerns is costly. It takes income the household could
use to meet their day-to-day needs – needs that the results indicate have an outsized effect on
financial satisfaction. The relatively modest reductions in subjective assessments associated with
distant deficits could be due, in part, to households with such deficits using their income to
address day-to-day needs, which increases financial satisfaction. To the extent that this is the
case, the results would underestimate the relationship between subjective assessments and distant
concerns. To the extent that this is the case, subjective assessments would also be expected to
follow a pecking order – to have a stronger relationship with distant issues as concern over day-
to-day deficits, and the gain in satisfaction that comes from addressing such deficits, declines.
Do Subjective Assessments Follow a Pecking Order?
The results are not consistent with the pecking order hypothesis – that individuals
become more sensitive to distant financial issues as concern over day-to-day deficits declines.
The results, presented in Table 4, show only one distant issue clearly has a stronger relationship
with subjective assessments as concern over day-to-day deficits changes: having a mortgage
greater than the value of one’s house. But the change is the opposite of what the pecking order
hypothesis predicts. As day-to-day deficits and concern over those deficits rise, households
become increasingly concerned about having a mortgage greater than the value of their house. It
could be the case that households with increasingly severe day-to-day financial deficits
increasingly fear losing their home. For such households, having a mortgage greater than the
value of their house would no longer be a “distant” deficit.

17
Table 4. Change in Relationship Between Subjective Financial Assessments and Distant Deficits as Proxy for Concern Over Dire Day-to-Day Deficits, s, Rises from 0 to 1
Distant concerns Correlates, s=0 Change in correlates as coefficient of s
Insurance No medical insurance -0.149 [0.154] -0.31 [0.209] No life insurance 0.065 [0.170] -0.194 [0.200] Life insurance not needed 0.149 [0.187] -0.212 [0.260] Retirement No retirement plan 0.294 [0.152] -0.379 [0.196] Inactive retirement plan -0.168 [0.206] -0.143 [0.241] Saving for college Graduate not saving -1.726 *** [0.303] 1.356 *** [0.341] Non-graduate not saving -1.380 *** [0.268] 1.263 *** [0.290] No need to save -1.605 *** [0.269] 1.149 *** [0.307] Housing Own free and clear 0.224 [0.237] 0.081 [0.259] Own, underwater 0.514 * [0.216] -0.811 ** [0.268] Rent -0.287 [0.176] -0.17 [0.205] Student loans Concerned might not be able to repay 0.101 [0.153] -0.389 [0.226] Has loans, not concerned about repaying 0.186 [0.263] -0.497 [0.299]
N 10,578
R2 0.460
Note: * p<0.05; ** p<0.01; *** p<0.001 Source: Authors’ calculations using data from FINRA Investor Education Foundation (2012a).
Saving for college could be one issue consistent with the pecking order hypothesis, but
the results are difficult to interpret.13 The study finds no other statistically significant changes in
the relationships between financial satisfaction and other distant deficits. As concern over day-
to-day deficits changes, subjective assessments have much the same relationship with medical
and life insurance deficits, having no retirement plan, having an inactive retirement plan, renting,
having student loans, and having student loans and also being concerned about repaying those
loans.
13 Among individuals with no dire day-to-day deficits, the results show a large 1.6-point reduction in subjective assessments for those with “no need to save.” This suggests that saving for college is associated with a similarly large increase in financial satisfaction above an “initial state” for respondents with dependent children who save, which raised the baseline constant. Saving for college would thus have a significantly stronger positive relationship with subjective financial assessments as concern over day-to-day deficits declines – a pecking order effect.

18
The study thus finds no support for the notion that subjective assessments become
significantly more sensitive to distant financial conditions as day-to-day deficits and the concern
they create declines.14 Thus households, by themselves, cannot be expected to address distant
concerns once their day-to-day finances are in reasonably good shape.
Does Financial Literacy Improve Subjective Assessments?
The results are also not consistent with the third hypothesis – that financial literacy
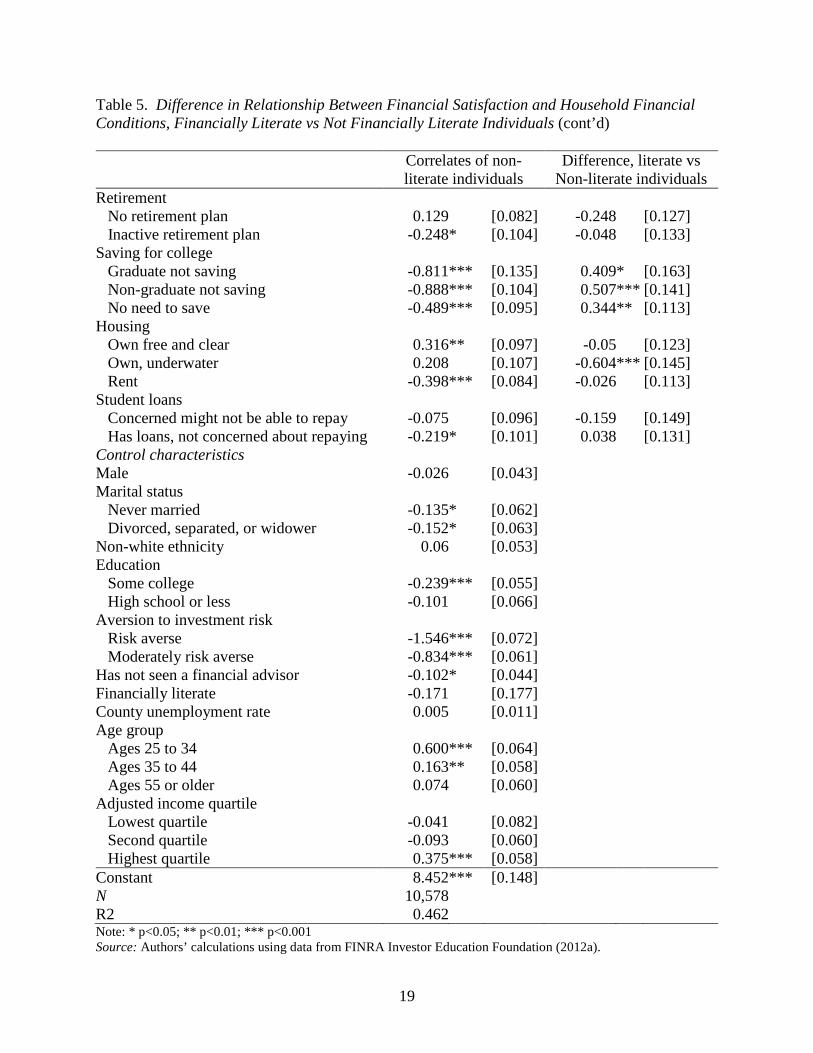
significantly enhances sensitivity to disant financial conditions. The results, presented in Table
5, find only two distant deficits associated with a greater reduction in the financial satisfaction
of financially literate individuals: having no retirement plan and having a mortgage greater than
the value of one’s house. Current debt burdens, a day-to-day deficit, are also associated with
greater reductions in the subjective assessments of financially literate respondents.
Table 5. Difference in Relationship Between Financial Satisfaction and Household Financial Conditions, Financially Literate vs Not Financially Literate Individuals
Correlates of non- literate individuals
Difference, literate vs Non-literate individuals
Day-to-day concerns Self-assessed ability to cover expenses
Very difficult to cover expenses -2.114 *** [0.119] -0.095 [0.174]
Moderately difficult to cover expenses -1.210 *** [0.081] 0.093 [0.108] Employment
Unemployed -0.567 *** [0.101] 0.125 [0.149] Self-assessed current debt burden
Heavy debt burden -1.009 *** [0.098] -0.657 *** [0.132] Moderate debt burden -0.291 *** [0.085] -0.410 *** [0.111] Access $2,000
Could not likely access $2,000 -0.764 *** [0.082] -0.192 [0.120] Distant concerns Insurance
No medical insurance -0.335 *** [0.087] -0.051 [0.140] No life insurance -0.189 * [0.084] 0.203 [0.111] Life insurance not needed 0.051 [0.114] -0.135 [0.193] -cont’d-
14 The study tested more complex models of dissatisfaction associated with day-to-day deficits that included moderate difficulty in covering day-to-day expenses and moderate debt burdens. The regressions, however, failed to estimate many coefficients due to colinearity; they also failed to identify any other statistically significant interactions.
19
Table 5. Difference in Relationship Between Financial Satisfaction and Household Financial Conditions, Financially Literate vs Not Financially Literate Individuals (cont’d)
Correlates of non- literate individuals
Difference, literate vs Non-literate individuals
Retirement
No retirement plan 0.129 [0.082] -0.248 [0.127] Inactive retirement plan -0.248 * [0.104] -0.048 [0.133] Saving for college
Graduate not saving -0.811 *** [0.135] 0.409 * [0.163] Non-graduate not saving -0.888 *** [0.104] 0.507 *** [0.141] No need to save -0.489 *** [0.095] 0.344 ** [0.113] Housing
Own free and clear 0.316 ** [0.097] -0.05 [0.123] Own, underwater 0.208 [0.107] -0.604 *** [0.145] Rent -0.398 *** [0.084] -0.026 [0.113] Student loans
Concerned might not be able to repay -0.075 [0.096] -0.159 [0.149] Has loans, not concerned about repaying -0.219 * [0.101] 0.038 [0.131] Control characteristics Male -0.026 [0.043]
Marital status
Never married -0.135 * [0.062]
Divorced, separated, or widower -0.152 * [0.063]
Non-white ethnicity 0.06 [0.053]
Education
Some college -0.239 *** [0.055]
High school or less -0.101 [0.066]
Aversion to investment risk
Risk averse -1.546 *** [0.072]
Moderately risk averse -0.834 *** [0.061]
Has not seen a financial advisor -0.102 * [0.044]
Financially literate -0.171 [0.177]
County unemployment rate 0.005 [0.011]
Age group Ages 25 to 34 0.600 *** [0.064]
Ages 35 to 44 0.163 ** [0.058]
Ages 55 or older 0.074 [0.060]
Adjusted income quartile Lowest quartile -0.041 [0.082]
Second quartile -0.093 [0.060]
Highest quartile 0.375 *** [0.058]
Constant 8.452 *** [0.148]
N 10,578
R2 0.462
Note: * p<0.05; ** p<0.01; *** p<0.001 Source: Authors’ calculations using data from FINRA Investor Education Foundation (2012a).

20
Financial literacy, on the other hand, is associated with a statistically significant 0.2 point
increase in financial satisfaction if the respondent lacks life insurance, an increase that offsets
the 0.2 point reduction among non-literate respondents. The only other statistically significant
change is a 0.3 point increase in satisfaction among college graduates not saving for their
children’s education. This increase could again be more apparent than real, as it is matched by a
similar increase among finacially literate respondents with “no need to save.” This suggests that
1) saving for college raises subjective assessments above the “initial state” much less for
financially literate than for non-literate graduates; and 2) not saving for college is associated with
similar reductions in satisfaction for financially literate and non-literate graduates.
The study finds no other statistically significant differences between financially literate
and non-literate individuals: the relationship between subjective financial assessments and the
ability to cover day-to-day expenses, unemployment, the ability to access $2,000, medical
insurance coverage, having an inactive retirement plan, owning one’s home free and clear,
renting, having student loans, or being concerned about repaying those loans is much the same
for financially literate and non-literate individuals. 15
These results are consistent with the Mugenda/Xiao hypothesis that financial literacy
reduces financial satisfaction because financially literate individuals are more sensitive to
deficits. Financial literacy is associated with greater awareness of issues emphasized in financial
education programs – current debt burdens, a day-to-day deficit; and two distant deficits: having
a mortgage greater than the value of one’s house and not having a retirement plan. But the study
finds no significant effect on issues not generally addressed in such programs, such as life and
medical insurance, saving for college, and paying down student debt.
Conclusions
Peace of mind is one of the great benefits of having one’s financial house in order. The
study’s findings, however, show that financial satisfaction is a poor indicator of financial well-
being and can actually impede the achievement of financial well-being.
15 Since older and higher-income individuals are more likely to be financially literate, the study tested for differences in the correlates by age and income. It did so using a model consisting of a system of linear equations with each age or income group estimated individually. It then tested whether the correlates of financial literacy differ by age or income using a nested F-test. The results showed no statistically significant differences in the correlates by age or income.

21
The results strongly support the first hypothesis. Even though respondents were
explicitly asked respondents “Overall, thinking of your assets, debts and savings, how satisfied
are you with your current personal financial condition?” their assessments were highly correlated
with day-to-day conditions and had a much more muted relationship with protection against risk
and “assets, debts, and savings” to meet future needs. Financial well-being is measured by the
happiness and life satisfaction that income and wealth provide – tomorrow as well as today.
Given this intensely present-minded focus of subjective assessments, satisfaction is a poor
measure of financial well-being. Nor can households by themselves be expected to devote much
effort to addressing distant deficits.
The findings provide essentially no support for the second hypothesis, that subjective
financial assessments follow a pecking order, with more distant issues having a greater effect on
financial assessments once day-to-day issues are in reasonably good shape. Households thus
cannot be expected to devote more effort to protecting themselves from risk or save to meet
future needs once their near-term concerns are addressed.
The findings provide very limited support for the third hypothesis, that financial literacy
enhances the sensitivity of subjective assessments to two distant issues. Financial literacy might
significantly enhance a household’s ability to improve its well-being. But it does not enhance
awareness of most distant deficits, and thus the motivation to address those deficits.
The findings support the notion that for households to improve their financial well-being,
the salience of issues distant from day-to-day concerns must be raised. Households are
increasingly responsible for such issues, specifically saving for retirement, accumulating home
equity, paying for their children’s college education, and paying off their own student loans. The
results show deficits in these areas associated at most with minor reductions in financial
satisfaction. The importance of salience is highlighted by the finding that having an inactive
retirement plan is associated with a reduction in satisfaction while not having plan – a more
adverse but less visible condition – is not.
The findings support the importance of initiatives that broadcast simple rules-of-thumb,
provide quick financial checkups, or otherwise raise the salience of financial challenges remote
from day-to-day concerns. Defaulting all workers into a retirement plan, as is currently under
way in the United Kingdom, should also increase retirement saving as it raises awareness of
retirement saving deficits and reduces the cost of those without an employer plan to act on that

22
awareness. More broadly, the results support the greater use of defaults or mandates, or the
transfer of responsibility from households to governments or employers, to reduce the nation’s
significantly increased reliance on individual household decision-making for basic financial
well-being.

23
References Bowling, Ann and Joy Windsor. 2001. “Towards the Good Life: A Population Survey of
Dimensions of Quality of Life.” Journal of Happiness Studies 2(1): 55-81. Blanchflower, David G. and Andrew J. Oswald. 2004. “Well-Being Over Time in Britain and the
USA.” Journal of Public Economics 88(7-8): 1359-1386. Clark, Andrew. E., Paul Frijters, and Michael A. Shields. 2008. “Relative Income, Happiness,
and Utility: An Explanation for the Easterlin Paradox and Other Puzzles.” Journal of Economic Literature 46(1): 95-144.
Dolan, Paul, Tessa Peasgood, and Mathew White. 2008. “Do We Really Know What Makes Us
Happy? A Review of the Economic Literature on the Factors Associated with Subjective Well-Being.” Journal of Economic Psychology 29: 94-122.
Easterlin, Richard A. 1974. “Does Economic Growth Improve the Human Lot? Some Empirical
Evidence.” In Nations and Households in Economic Growth: Essays in Honor of Moses Abramowitz, edited by Paul A. David and Melvin W. Reder, 89-125. New York, NY: Academic Press.
Easterlin, Richard A. 2006. “Life Cycle Happiness and Its Sources: Intersections of Psychology,
Economics, and Demography.” Journal of Economic Psychology 27(4): 463-482. Ferrer-i-Carbonell, Ada. 2005. “Income and Well Being: An Empirical Analysis of the
Comparison Income Effect.” Journal of Public Economics 89(5-6): 997-1019. FINRA Investor Education Foundation. 2012. Financial Capability in the United States.
Washington, DC: FINRA Investor Education Foundation. Available at: http://www.usfinancialcapability.org/downloads/NFCS_2012_Report_Natl_Findings.pdf
–––. 2012. 2012 National Financial Capability Study: State-By-State Survey Methodology.
Washington, DC: FINRA Investor Education Foundation. Available at: http://www.usfinancialcapability.org/downloads/NFCS_2012_State_by_State_Meth.pdf.
Foote, Stephen L. 2000. “Arousal.” In Encyclopedia of Psychology, edited by Alan E. Kazdin, 1:
237-240. New York, NY: Oxford University Press. Hsieh, Chang-Ming. 2001. “Correlates of Financial Satisfaction.” International Journal of Aging
and Human Development 52(2): 135-154. Isen, Alice M. 1987. “Positive Affect, Cognitive Processes, and Social Behaviour.” In Advances
in Experimental Social Psychology, edited by Leonard Berkowitz, 20: 203-53. New York, NY: Academic Press.
24
Johnson, Wendy and Robert F. Krueger. 2006. “How Money Buys Happiness: Genetic and Environmental Processes Linking Finances and Life Satisfaction.” Journal of Personality and Social Psychology 90(4): 680-691.
Joo, So-hyun and John E. Grable. 2004. “An Exploratory Framework of the Determinants of
Financial Satisfaction.” Journal of Family and Economic Issues 25(1): 25-50. Luttmer, Erzo F. P. 2005. “Neighbors as Negatives: Relative Earnings and Well-Being.”
Quarterly Journal of Economics 120(3): 963-1002. MacDonald, Maurice and Robin A. Douthitt. 1992. “Consumption Theories and Consumers’
Assessments of Subjective Well-Being.” Journal of Consumer Affairs 26: 243-261. Mugenda, Olive M., Tahira K. Hira, and Alyce M. Fanslow. 1990. “Assessing the Causal
Relationship Among Communication, Money Management Practices, Satisfaction with Financial Status, and Satisfaction with Quality of Life.” Lifestyles 11(4): 343-360.
OECD. n.d. “Adjusting Household Incomes: Equivalence Scales.” Available at:
http://www.oecd.org/eco/growth/OECD-Note-EquivalenceScales.pdf. Plagnol, Anke C. 2010a. “Subjective Well-Being Over the Life Course: Conceptualizations and
Evaluations.” Social Research 77(2): 749-768. –––. 2010b. “Financial Satisfaction Over the Life Course: The Influence of Assets and
Liabilities.” Journal of Economic Psychology 32(1): 45-64. Plagnol, Anke C and Robert A. Easterlin. 2008. “Aspirations, Attainments, and Satisfaction: Life
Cycle Differences Between American Women and Men.” Journal of Happiness Studies 9(4): 601-619.
Seghieri, Chiara, Maria Letizia Tanturri, and Gustavo DeSantis. 2006. “The Richer, the Happier?
An Empirical Investigation in Selected European Countries.” Social Indicators Research 79: 455-476.
Stutzer, Alois. 2004. “The Role of Income Aspirations in Individual Happiness.” Journal of
Economic Behavior and Organization 54(1): 89-109. Van Praag, Bernard M. S. 2004. “The Connexion Between Old and New Approaches to
Financial Satisfaction.” CESifo Working Papers No. 1212. Munich, Germany: Munich Society for the Promotion of Economic Research.
Vera-Toscano, Esperanza, Victoria Ateca-Amestoy, and Rafael Serrano-Del-Rosal. 2006.
“Building Financial Satisfaction.” Social Indicators Research 77: 211–243 Xiao, Jing Jian, Cheng Chen, and Fuzhong Chen. 2013. “Consumer Financial Capability and
Financial Satisfaction.” Social Indicators Research 118(1): 415-432.
25
RECENT WORKING PAPERS FROM THE CENTER FOR RETIREMENT RESEARCH AT BOSTON COLLEGE
The Impact of Leakages from 401(k)s and IRAs Alicia H. Munnell and Anthony Webb, February 2015 Recruiting and Retaining High-Quality State and Local Workers: Do Pensions Matter? Alicia H. Munnell, Jean-Pierre Aubry, and Geoffrey T. Sanzenbacher, January 2015 Do Tax Incentives Increase 401(k) Retirement Saving? Evidence from the Adoption of Catch-Up Contributions Matthew S. Rutledge, April Yanyuan Wu, and Francis M. Vitagliano, November 2014 Are Retirees Falling Short? Reconciling the Conflicting Evidence Alicia H. Munnell, Matthew S. Rutledge, and Anthony Webb, November 2014 Lifetime Job Demands, Work Capacity at Older Ages, and Social Security Benefit Claiming Decisions Lauren Hersch Nicholas, November 2014 Who Is Internationally Diversified? Evidence from 296 401(k) Plans Geert Bekaert, Kenton Hoyem, Wei-Yin Hu, and Enrichetta Ravina, November 2014
The Causes and Consequences of Financial Fraud Among Older Americans Keith Jacks Gamble, Patricia Boyle, Lei Yu, and David Bennett, November 2014
New Evidence on the Risk of Requiring Long-Term Care Leora Friedberg, Wenliang Hou, Wei Sun, Anthony Webb, and Zhenyu Li, November 2014
SSI at 62: Protecting the Vulnerable When Increasing Social Security’s Early Entitlement Age Norma B. Coe and April Yanyuan Wu, June 2014 Why Do SSI and SNAP Enrollments Rise in Good Economic Times and Bad? Matthew S. Rutledge and April Yanyuan Wu, June 2014 The Impact of Mandatory Coverage on State and Local Budgets Alicia H. Munnell, Jean-Pierre Aubry, and Anek Belbase, May 2014
Interest Rates and Economic Growth: Are They Related? Barry P. Bosworth, May 2014
All working papers are available on the Center for Retirement Research website
(http://crr.bc.edu) and can be requested by e-mail ([email protected]) or phone (617-552-1762).