SUBJECTIVE MEASURES IN HUMANITARIAN ANALYSIS · PDF fileSubjective measures in needs...
108
SUBJECTIVE MEASURES IN HUMANITARIAN ANALYSIS Aldo Benini A note for ACAPS January 2018
Transcript of SUBJECTIVE MEASURES IN HUMANITARIAN ANALYSIS · PDF fileSubjective measures in needs...
SUBJECTIVE MEASURES IN HUMANITARIAN ANALYSIS
Aldo Benini A note for ACAPS
January 2018


ACAPS Note, Subjective measures in humanitarian analysis, January 2018
Aldo Benini A note for ACAPS
Subjective measures in humanitarian analysis January 2018
ACAPS Note, Subjective measures in humanitarian analysis, January 2018
Suggested citation: Benini, Aldo: Subjective measures in humanitarian analysis [January 2018]. Geneva, Assessment Capacities Project - ACAPS. Contact information: ACAPS 23, Avenue de France CH-1202 Geneva Switzerland [email protected]

ACAPS Note, Subjective measures in humanitarian analysis, January 2018
1
Table of Contents
Acknowledgment ................................................................................................................................. 5
Acronyms and abbreviations ............................................................................................................ 4 Summary ............................................................................................................................................... 6
Purpose and motivation ................................................................................................................ 6 Foundations and examples ........................................................................................................... 7
A success story ....................................................................................................................... 10 Instruments for humanitarian assessments .......................................................................... 12
Scales ........................................................................................................................................ 12 Vignettes ................................................................................................................................... 15 Hypothetical questions........................................................................................................... 16
Outlook ........................................................................................................................................... 19 Introduction ....................................................................................................................................... 20
Purpose .......................................................................................................................................... 20 What are subjective measures? ................................................................................................ 20 Subjective measures in needs assessments ......................................................................... 22
Overlap with poverty and health measurement – at what cost? ................................... 23 [Sidebar:] Multidimensional deprivation with subjective data ......................................... 24
More on the nature of subjective measures ........................................................................... 32 Why subjective measures? .................................................................................................... 34 Arguments and fallacies ........................................................................................................ 35 Case study: The Food Insecurity Experience Scale (FIES) .............................................. 36 The reliability of subjective measures ................................................................................. 42
Instruments ....................................................................................................................................... 44 Scales ............................................................................................................................................. 44
Ladders (single-stimulus scales) .......................................................................................... 47 Multi-item scales ..................................................................................................................... 49 Case study: The Humanitarian Emergency Settings Perceived Needs Scale (HESPER)
.................................................................................................................................................... 53
ACAPS Note, Subjective measures in humanitarian analysis, January 2018
2
Vignettes ........................................................................................................................................ 56 Motivation ................................................................................................................................. 56 Case study: Objective and subjective welfare in Tajikistan ............................................. 56 The procedure .......................................................................................................................... 58 Analyzing vignette data .......................................................................................................... 61 [Sidebar:] Calculating the transformed scores in Excel .................................................... 63 For and against vignettes ...................................................................................................... 67 A modest approach................................................................................................................. 69
Hypothetical questions ............................................................................................................... 70 Motivation ................................................................................................................................. 70 Pros and cons .......................................................................................................................... 70 Terminology ............................................................................................................................. 71 What happens in the respondent’s mind ............................................................................ 72 [Sidebar:] The marginal propensity of food in IDP households in Borno, Nigeria ........ 73 From subjective hypotheticals to social norms................................................................. 77 Case study: Basic Necessities Surveys ............................................................................... 80 After all: are hypothetical questions appropriate? ............................................................. 87
Outlook ............................................................................................................................................... 88 Where we are, and what we miss ............................................................................................. 88
[Sidebar:] Subjective measures at the community level – An example ........................ 90 Ants and athletes ......................................................................................................................... 93
References ......................................................................................................................................... 94

ACAPS Note, Subjective measures in humanitarian analysis, January 2018
3
Tables and Figures Table 1: Deprivation in eight needs areas .................................................................................... 28 Table 2: Contributions by needs areas to overall deprivation .................................................. 29 Table 3: Deprivation indices, by region ......................................................................................... 30 Table 4: A severity ladder with seven steps ................................................................................. 47 Table 5: Correlation between subjective and objective welfare ranks ................................... 57 Table 6: Ordinal re-scaling, reflecting respondent's relative position vis-a-vis the vignettes ............................................................................................................................................................. 60 Table 7: From Cantril ladder position to relative position vis-a-vis the vignettes ................. 62 Table 8: Calculation of the transformed scale in Excel ............................................................. 64 Table 9: Proportions of men and women considering items essential .................................. 84 Table 10: Examples of non-traditional gender role attitudes, and change 2011-14 ............ 91 Figure 1: Ngram timelines of "subjectivity" and "objectivity", 1945-2008 .................................. 6 Figure 2: A subjective measurement tool - the Cantril ladder ..................................................... 9 Figure 3: The Food Insecurity Experience Scale ......................................................................... 11 Figure 4: The severity scale used in Ukraine in 2015 ................................................................. 13 Figure 5: The core concepts of Amartya Sen's capabilities approach ................................... 24 Figure 6: Deprivation profiles of three areas in Nigeria ............................................................. 25 Figure 7: Multidimensional deprivation score vs. total monthly expenses ............................ 31 Figure 8: Determinants and consequences of food insecurity at the individual level ......... 37 Figure 9: Food insecurity - Prevalence by economic development ranking .......................... 39 Figure 10: Correlation between priority and frequency of 27 HESPER Scale items ............ 55 Figure 11: Vignettes in the interview procedure ......................................................................... 59 Figure 12: Probability of self-assessing as rich or poor as a function of per-capita consumption ..................................................................................................................................... 67 Figure 13: Share of hypothetical extra income allocated to food ........................................... 75 Figure 14: Propensity for food in response to household expenditure .................................. 76 Figure 15: Households, by number of deprivations experienced, in the Benin sample ....... 83 Figure 16: Testing the validity of a deprivation scale ................................................................. 85

ACAPS Note, Subjective measures in humanitarian analysis, January 2018
4
Acronyms and abbreviations
ACAPS Assessment Capacities Project
BNS Basic Necessities Survey
DIF Differential item functioning
ELQ Economic Ladder Question
FAO UN Food and Agriculture Organization
FGT Foster–Greer–Thorbecke (family of poverty measures)
FIES Food Insecurity Experience Scale
GDP Gross domestic product
GIS Geographic Information System
HESPER Humanitarian Emergency Settings Perceived Needs Scale
IDP Internally displaced person
IPC Integrated Phase Classification
IRT Item Response Theory
LGA Local Government Area
NFI Non-food items
NGN Nigeria Naira
NGO Non-governmental organization
SPHERE The Sphere Project, which has produced the Humanitarian Charter and
Minimum Standards in Humanitarian Response Handbook
STATA A statistical application
WASH Water, Sanitation and Hygiene
WHO World Health Organization

ACAPS Note, Subjective measures in humanitarian analysis, January 2018
5
Acknowledgment
I thank Patrice Chataigner for his extensive review of an earlier draft of this note.
Aldo Benini, ACAPS Consultant
ACAPS Note, Subjective measures in humanitarian analysis, January 2018
6
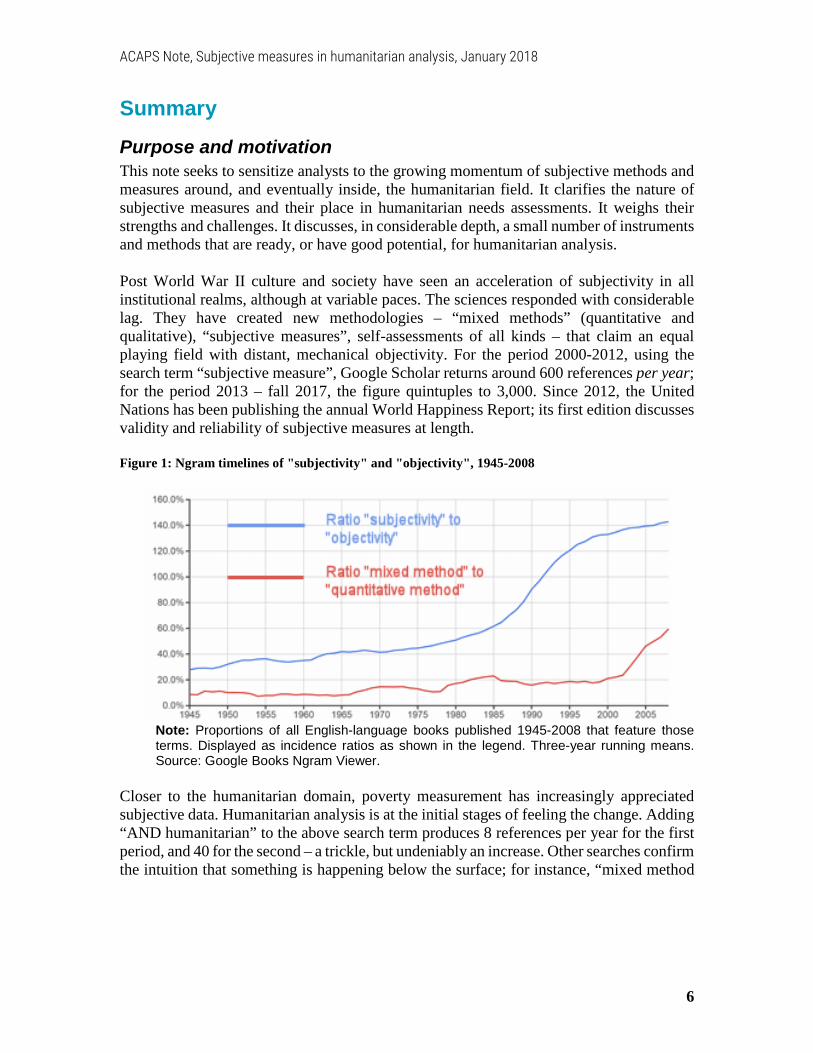
Summary Purpose and motivation This note seeks to sensitize analysts to the growing momentum of subjective methods and measures around, and eventually inside, the humanitarian field. It clarifies the nature of subjective measures and their place in humanitarian needs assessments. It weighs their strengths and challenges. It discusses, in considerable depth, a small number of instruments and methods that are ready, or have good potential, for humanitarian analysis. Post World War II culture and society have seen an acceleration of subjectivity in all institutional realms, although at variable paces. The sciences responded with considerable lag. They have created new methodologies – “mixed methods” (quantitative and qualitative), “subjective measures”, self-assessments of all kinds – that claim an equal playing field with distant, mechanical objectivity. For the period 2000-2012, using the search term “subjective measure”, Google Scholar returns around 600 references per year; for the period 2013 – fall 2017, the figure quintuples to 3,000. Since 2012, the United Nations has been publishing the annual World Happiness Report; its first edition discusses validity and reliability of subjective measures at length. Figure 1: Ngram timelines of "subjectivity" and "objectivity", 1945-2008
Note: Proportions of all English-language books published 1945-2008 that feature those terms. Displayed as incidence ratios as shown in the legend. Three-year running means. Source: Google Books Ngram Viewer.
Closer to the humanitarian domain, poverty measurement has increasingly appreciated subjective data. Humanitarian analysis is at the initial stages of feeling the change. Adding “AND humanitarian” to the above search term produces 8 references per year for the first period, and 40 for the second – a trickle, but undeniably an increase. Other searches confirm the intuition that something is happening below the surface; for instance, “mixed method

ACAPS Note, Subjective measures in humanitarian analysis, January 2018
7
AND humanitarian” returns 110 per year in the first, and 640 in the second period – a growth similar to that of “subjective measures”. Still in some quarters subjectivity remains suspect. Language matters. Some collaborations on subjective measures have preferred billing them as “experience-based measures”. Who doubts experience? It is good salesmanship, but we stay with “subjective” unless the official name of the measure contains “experience”.
What follows We proceed as follows: In the foundational part, we discuss the nature of, motivation for, and reservations against, subjective measures. We provide illustrations from poverty measurement and from food insecurity studies. In the second part, we present three tools – scales, vignettes and hypothetical questions – with generic pointers as well as with specific case studies. We conclude with recommendations and by noting instruments that we have not covered, but which are likely to grow more important in years to come.
Foundations and examples
What are subjective measures? Subjective information flows from private thoughts and feelings. Much of it is not immediately verifiable. The receiver of such communications may lack appropriate context; the risks of misinterpretation are high. Nevertheless, subjective information pervades everyday life; speakers and listeners alternate effortlessly between subjective and so-called objective information. Conversational norms give ample space to correct or specify. Only a small subset of subjective information imparts subjective measures, in the sense that they belong to a well-ordered set of alternatives or even have an in-built metric. Ratings and rankings rely on ordered sets, and quantitative estimates, however vague, obey metric axioms. Researchers, including during humanitarian assessments, actively elicit information that they can turn into measures. They do so chiefly by standardizing the format of conversations (aka questionnaire-based interviews) or by ex-post coding of less stringent ones (for instance, focus group discussions). It is with these results that we are concerned here – with subjective information that is sufficiently transformed and organized to supply data with consistent meanings. Such data are subjective measures. The term “subjective measure” is a misnomer if we assume that subjective measures are less reliable than so-called objective ones, in the sense that they would always carry larger errors. It is used here only because it holds a firm grip on certain schools of thought that are of interest to humanitarian analysts, particularly in poverty and deprivation assessment. There is no fundamental reason to assume lower quality per se. Every measurement involves an observer and entails institutions, effort and cost. This holds equally for subjective rankings of needs and for estimates of monetary values such as income and expenses. Real differences do exist; they are found chiefly in measurement levels (ordinal
ACAPS Note, Subjective measures in humanitarian analysis, January 2018
8
vs. metric), institutional power (money is metric) and in the length of research traditions (more time to calibrate measures to gold standards).
Why subjective measures? In fact, one of the motivations to use subjective measures is that, in certain circumstances, they may be more reliable than measures traditionally considered objective. Such circumstances are frequent, perhaps the rule rather than the exception, in humanitarian assessments. In turbulent environments, estimates of objective measures such as household consumption, income or assets are prone to significant error. Subjective proxies may be more trustworthy. A subjective measure may also be more valid. It can cover the scope of a broad concept like welfare or needs satisfaction while any of its objective counterparts may be restricted to a narrow dimension. Some methodologists have gone so far as to claim that good policy-making requires subjectivity. This seems extreme, but is certainly true of situations in which market transactions do not reveal true preferences. These have to be uncovered by other methods, including subjective ones. There are other reasons to promote subjective measures in humanitarian assessments. In shared cultures, needs are readily understood and communicated, mostly in families and in local firms and markets. In disasters and crises, needs are communicated about larger groups and over wider cultural distances. Assessments need to reach across them. Subjective measures for this purpose may not yet be well developed or confidently used. But they can be borrowed in part from other traditions. Health and poverty measurement have long worked with such instruments. The key concept of “deprivation” overlaps with “unmet need” – which is what humanitarian assessments measure. Several of the methods discussed in this note borrow from those disciplines.
Multidimensional deprivation Measures of multidimensional deprivation have become increasingly popular. In a sidebar, we sketch the evolution from a classic family of one-dimensional (income-based) poverty measures to the multi-dimensional ones that researchers at the Oxford Poverty and Human Development Initiative have been developing over the past ten years. We illustrate the so-called two-cutoff model with subjective data from a recent assessment in Nigeria. We combine shortfalls in five needs domains into three deprivation measures: head count, depth and severity and compute the relative contributions by each domain. What makes this method particularly attractive to humanitarian analysts is its ability to incorporate ordinal indicators, i.e., sectorwise rankings or ratings of unmet needs. Some statistical applications (e.g., STATA) have published procedures to calculate the measures. Because many analysts would depend on an Excel add-in (we have found none yet), we limit the exposition to the logic of the multi-dimensional model and to this one illustration.

ACAPS Note, Subjective measures in humanitarian analysis, January 2018
9
How do subjective measures work? To make this discussion more intuitive, we look at a tool that is widely used to measure subjective welfare or personal health. The “Cantril ladder”, named after psychologist A.H. Cantril (1906-69), is a visual aid to elicit ratings. Cantril invented it to measure personal satisfaction with life. Increasingly researchers have used it to gauge the position (the respondent’s own or his/her family’s) with regards to other concepts. A notable application is the measurement of socio-economic status vis-à-vis a reference group of interest. Concepts, reference groups, instructions and number of rungs vary with the research objectives; yet the idea of the most preferred state at the top, and of the least preferred at the bottom, remains. So does the expectation that the respondent is discerning enough to associate a particular rung with his/her subjectively evaluated situation. Figure 2: A subjective measurement tool - the Cantril ladder
Source: Sawatzky et al. (e.g., 2010), http://www.hqlo.com/content/8/1/17 . Slightly modified.
What does this tool suggest about the nature of subjective measures in general? A few characteristics are obvious; others have been discovered in experiments:
• The measure is open to all dimensions of the concept of interest. • The interpretation of the concept (what does “best possible life” mean?) is left to the
respondent. • The respondent does not share the rationale for selecting a particular option unless
questioned about it. • Respondents may select the same response (e.g., the same rung of the Cantril
ladder) while their objective circumstances differ. Conversely, respondents of similar circumstances may select different responses.
• Among respondents, standards of comparisons differ (comparing to one’s earlier condition, other people’s current condition, some normative standard, or to aspirations about the future); the enumerator / researcher may not know what they are, and which a given respondent activates.
ACAPS Note, Subjective measures in humanitarian analysis, January 2018
10
• The response is context-sensitive, depending on the expectations that the respondent formed as a result of the conversation up to this point (the high degree of context-dependency has shocked experimentalists).
• Ratings on scales and ladders produce ordinal data. Statistical options with such data are limited. Means and ratios are allowed only under strong assumptions (equidistance between all adjacent rungs, meaningful zero point).
Uncontrolled interpretation and context dependency have kept doubts alive whether subjective measures can be trusted. Economists have tried out a number of data collection and analytic strategies to strengthen reliability. For example, subjective poverty lines can be estimated by comparing the respondent’s self-assessed position on the Cantril ladder to several absolutely minimal incomes – “What level of income would you consider: very bad, bad, not good, not bad, good, very good?” Even if such models take into account the characteristics of the respondents’ households, they presuppose an environment with a degree of stability (for example, a housing market with known prices for typical units). By contrast, humanitarian assessments struggle in turbulent environments.
A success story Despite the well-founded methodological concerns, there have been success stories. A particularly remarkable one has played out in the humanitarian domain. The “Food Insecurity Experience Scale (FIES)” is a subjective measure developed out of the discontent with “objective” food insecurity and hunger measures. These used to be slow, expensive and hard to generalize. The development started, well before 1990, with ethnographic research into food-insecure households in the USA. What did such households actually experience as their conditions kept deteriorating? Insights into the micro-processes were subsequently translated into a simple measurement tool. This was tested, improved and validated over several years in a far-flung international research network. The key actors struck a partnership with the Gallup World Poll, which, in 2014, ran the scale, translated into 200 languages, as a module in its surveys in 146 countries. The Food Insecurity Experience Scale is an eight-question battery. Each question is conditioned on the same timeframe. The 12 months chosen for the World Poll would be too long for most humanitarian assessments, but there are no fundamental reasons why it cannot be shortened to a length appropriate to assessment concerns and crisis history.
ACAPS Note, Subjective measures in humanitarian analysis, January 2018
11
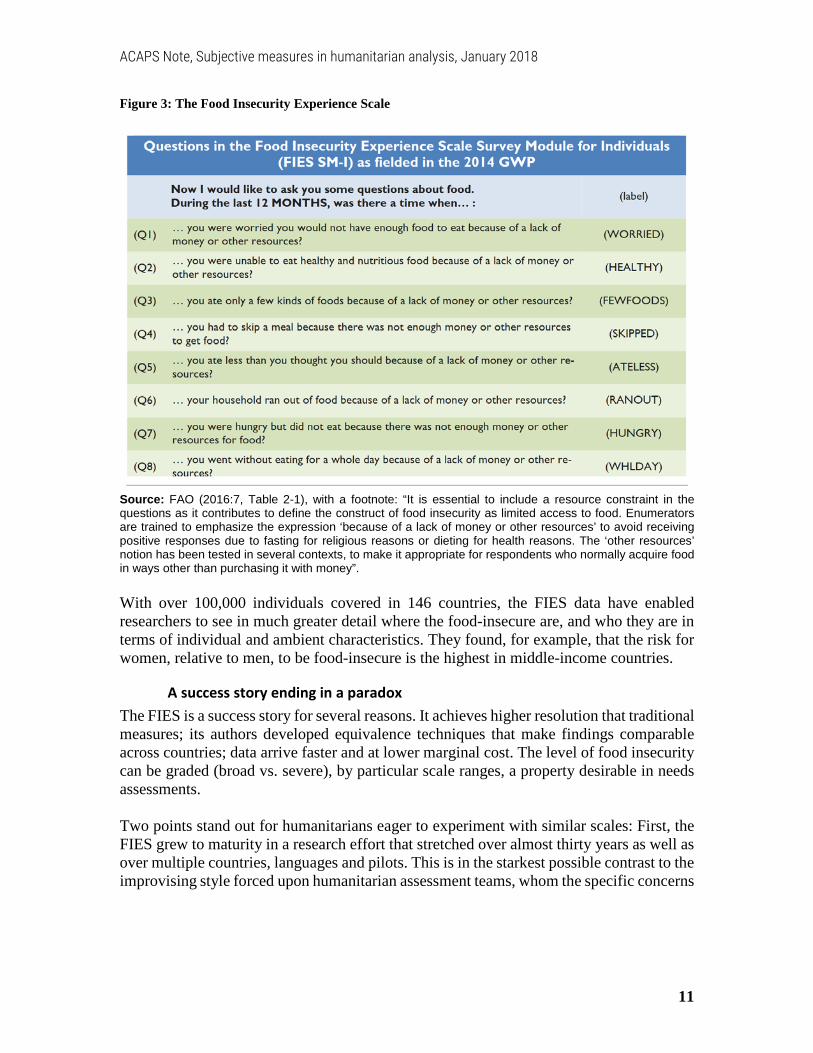
Figure 3: The Food Insecurity Experience Scale
Source: FAO (2016:7, Table 2-1), with a footnote: “It is essential to include a resource constraint in the questions as it contributes to define the construct of food insecurity as limited access to food. Enumerators are trained to emphasize the expression ‘because of a lack of money or other resources’ to avoid receiving positive responses due to fasting for religious reasons or dieting for health reasons. The ‘other resources’ notion has been tested in several contexts, to make it appropriate for respondents who normally acquire food in ways other than purchasing it with money”. With over 100,000 individuals covered in 146 countries, the FIES data have enabled researchers to see in much greater detail where the food-insecure are, and who they are in terms of individual and ambient characteristics. They found, for example, that the risk for women, relative to men, to be food-insecure is the highest in middle-income countries.
A success story ending in a paradox The FIES is a success story for several reasons. It achieves higher resolution that traditional measures; its authors developed equivalence techniques that make findings comparable across countries; data arrive faster and at lower marginal cost. The level of food insecurity can be graded (broad vs. severe), by particular scale ranges, a property desirable in needs assessments. Two points stand out for humanitarians eager to experiment with similar scales: First, the FIES grew to maturity in a research effort that stretched over almost thirty years as well as over multiple countries, languages and pilots. This is in the starkest possible contrast to the improvising style forced upon humanitarian assessment teams, whom the specific concerns
ACAPS Note, Subjective measures in humanitarian analysis, January 2018
12
of the crisis, short timeframes, and relative isolation leave with untested options. Second, even in a success story like FIES, eventually weaknesses are discovered, by researchers who find ways to compare subjective and objective measures. The FIES is only weakly correlated with objective measures like calorie consumption, dietary diversity, and anthropometric measures. Is the weakness to be blamed on poor validity – it does not really capture food insecurity – or on poor reliability – there is too much noise in the data – or on both? We generalize this point for the introduction on subjective measures with a paradox: They may be helpful, necessary and even unavoidable, but concerns about their reliability and validity will not go away.
Instruments for humanitarian assessments The note extensively discusses three types of instruments while omitting others. The three were selected because some variants of each have been tested and applied in multiple contexts. The main body devotes considerable space to their generic features and to one case study about each of them: Instrument Case study Scales The Humanitarian Emergency Settings Perceived Needs Scale
Vignettes Validation of anchoring vignettes with household survey data
Hypothetical questions Basic Necessities Surveys
Scales
General considerations “Scales” have a popular ring, not only for the social scientist, but nowadays also for the educated layperson. Yet, the term comprises two distinct meanings:
• Single-stimulus scales: In its first and simpler meaning, a scale is an ordinal measure that captures the response to one unified stimulus. Instruction and question may be somewhat complicated, but they make it clear that the respondent is to choose only one from a set of ordered options. The Cantril ladder shown above and the severity scale developed by ACAPS are good examples.

ACAPS Note, Subjective measures in humanitarian analysis, January 2018
13
Figure 4: The severity scale used in Ukraine in 2015
Source: Ukraine NGO Forum (2015, appendix, p.5).
• Multi-item scales: In its second, more technical meaning, a scale is a procedure
for, as well as the result of, mapping the response to several stimuli onto one dimension. The stimuli typically are standardized interview questions. On the data side, the object of a question is known as an “item”; the respondents or the social groups that they represent are the “subjects”. The scale produces a “score” – an interval or ratio-level summary measure - for every subject with complete item data. Depending on the procedure, the scale uses external weights for items (e.g., in weighted indices) or produces and uses item weights and subject scores internally and simultaneously (e.g., factor analysis).
Those two variants of scales do not completely cover the practice in humanitarian assessments, some of which mix qualitative and quantitative items that are selected, appraised and combined in a deliberative process. An excellent example is found in the “IPC Acute Food Insecurity Reference Table for Area Classification” (IPC Global Partners 2012:32) 1 . The Table guides assessments of areas at five levels (“phases”) of food insecurity, from minimal stress to outright famine. The criteria are spread over two pages (the area classification ties in with household classifications), with critical ranges in each of several dimensions for the five levels. Since the area being assessed may be in one phase by one criterion, and in different phases by others, the final determination is the result of expert judgment rather than of a set algorithm. In technical terms of scale construction, such mixed forms are borderline, but they have several benefits. They are robust to moderate data gaps and, as long as the cases are few, invite effective deliberation. The type of scale that is of major interest in this note is the multi-item scale that aggregates item values into subject scores algorithmically, i.e. by executing a preset formula. Generally, such scales can be distinguished by their degree of previous validation. Many analysts will be familiar with exercises in which a scale is developed from scratch, by 1 IPC here stands for “Integrated Phase Classification”.

ACAPS Note, Subjective measures in humanitarian analysis, January 2018
14
balancing the data requirements to measure the concept of interest (e.g., severity of disaster impact) with available information (indicators from recent assessments as well as from secondary datasets). The boundary with composite measures of all kinds is fluid; the resulting construct is rarely called a “scale”. It comes closest to common understandings of scales where, chiefly or wholly, ordinal measures (e.g., sectoral severity ratings) are thrown into the mix. In other cases, humanitarian assessments can rely on already validated scales. These are the fruits of previous research and testing, sometimes of long duration and originally far from humanitarian action. Mental health scales administered to disaster survivors exemplify this intellectual domain-crossing. The challenges are less daunting than in new scale developments and are limited primarily to intercultural adaptation and interviewer training. We present one such scale, the “Humanitarian Emergency Settings Perceived Needs Scale (HESPER)”.
The HESPER Scale The scale measures “perceived needs”, a subjective state, in humanitarian emergencies. It helps assess needs of affected populations through representative samples and does so in a valid, reliable and rapid manner. While focused on universal needs, it can be adapted to local circumstances. The scale provides an excellent illustration of a subjective measure. The scale consists of 26 dichotomous items. Each item singles out an area of need that, if unmet, can create a “serious problem”. A typical question reads: “Do you have a serious problem because you do not have enough water that is safe for drinking or cooking?” In addition, the respondent determines the three most serious among the problems that he/she affirmed. The analysis focuses on the prevalence of needs (measured as the percentages of respondents who rate them as serious) and the priorities (as the percentages of respondents who designated a given need as one of their three most serious problems). The major strength of the HESPER scale lies in measuring the relative importance of the various unmet needs. In other words, the interest is in the items, not the respondents’ scores. In fact, no attempt is made to express the “neediness” of the respondents by the number of items (“serious problems”) that they affirmed. There is much to recommend the HESPER Scale:
• It has many of the qualities expected of a strong scale, including speed, reliability and validity across language communities and types of humanitarian crises.
• Its development took several years of work by the same dedicated researcher, with assistance from multiple experts, with a solid theoretical foundation and extensive testing across diverse contexts.
• It renders population-level estimates of intensity and priority in a wide spectrum of unmet needs.
• The conceptual demands on trainers, interviewers, respondents and analysts are modest and easily managed. The data can be analyzed in a spreadsheet program.
ACAPS Note, Subjective measures in humanitarian analysis, January 2018
15
The Food Insecurity, Severity and HESPER Scales are exemplars from a growing, if barely known inventory of scales that have been designed, tested and used inside and outside the humanitarian sphere. Assessment designers who consider the need for some scale within their data collection tool should make a reasonable effort to find out what exists “out there”. Whether adapted from a well-regarded master or designed from scratch, scales need minimal testing in the field. The testing goes at least to the point that all options and items “work” in conversations, ideally also producing local evidence of validity and reliability.
Vignettes Vignettes are devices for improving the comparability of subjective measures across respondents and social groups. The response to subjective questions may, and often does, produce bias when interviewer and respondents understand the meaning of a question (or of some or all of the response categories) differently. Bias occurs also when these understandings differ across respondents, individually or by socio-economic, cultural or language group. Vignettes are nutshell descriptions of hypothetical situations, individuals, groups, or events. The interviewers present them before, or after the first reading of, the question whose meaning they are to make more precise and uniform among researchers, interviewers and respondents. When the vignettes help respondents to place their personal (or family or community) situation on a single-stimulus scale, they are known as “anchoring vignettes”.
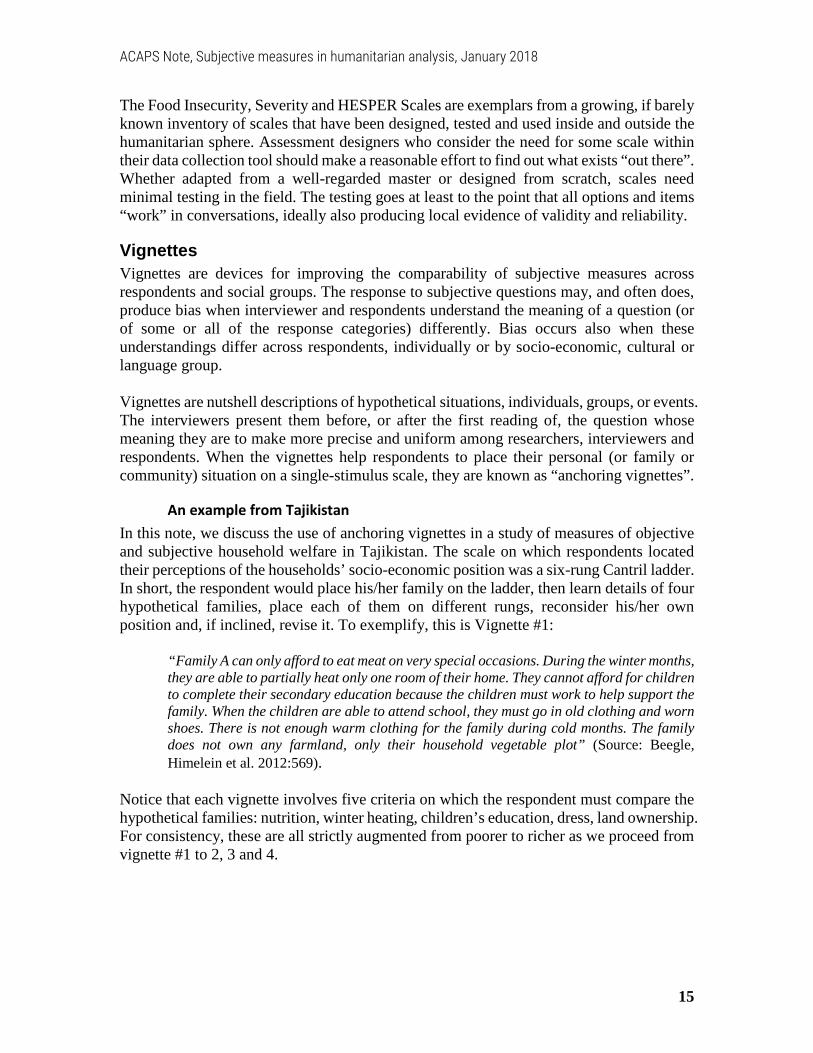
An example from Tajikistan In this note, we discuss the use of anchoring vignettes in a study of measures of objective and subjective household welfare in Tajikistan. The scale on which respondents located their perceptions of the households’ socio-economic position was a six-rung Cantril ladder. In short, the respondent would place his/her family on the ladder, then learn details of four hypothetical families, place each of them on different rungs, reconsider his/her own position and, if inclined, revise it. To exemplify, this is Vignette #1:
“Family A can only afford to eat meat on very special occasions. During the winter months, they are able to partially heat only one room of their home. They cannot afford for children to complete their secondary education because the children must work to help support the family. When the children are able to attend school, they must go in old clothing and worn shoes. There is not enough warm clothing for the family during cold months. The family does not own any farmland, only their household vegetable plot” (Source: Beegle, Himelein et al. 2012:569).
Notice that each vignette involves five criteria on which the respondent must compare the hypothetical families: nutrition, winter heating, children’s education, dress, land ownership. For consistency, these are all strictly augmented from poorer to richer as we proceed from vignette #1 to 2, 3 and 4.

ACAPS Note, Subjective measures in humanitarian analysis, January 2018
16
In the Tajikistan study, personal frames of reference were significant, but not a source of major bias. Thus, the vignettes were not indispensable for a valid subjective welfare measure. Yet other studies such as a nationally representative health survey in India found that questions were understood very differently across social groups and regions, and vignettes effectively narrowed down differences in meanings. The inventors of anchoring vignettes devised a clever recoding system in order to replace one’s absolute position on the Cantril ladder by the relative position vis-à-vis the vignette families. We demonstrate how analysts can emulate it in an Excel spreadsheet.
When and how to use them Thus, while anchoring vignettes are technically manageable, to use them or not is a tough question for assessment designers. The basic objection is that they take up time and questionnaire space in interviews. They demand additional effort in training and supervision as well as in data entry and analysis. But anchoring vignettes should be used if there is reason to fear that un-anchored subjective measures produce incomparable and misleading data. Looking at the vignettes of the Tajikistan study, our intuition is to recommend simpler versions – shorter texts with fewer comparison criteria, and no more than three vignettes in the set, and the respondent placing him/herself on the ladder only once, after placing the vignettes.
Hypothetical questions Hypothetical questions engage respondents in thought experiments. They appear chiefly as “What if?” questions, but can take other forms as well. Liminal experiences (“Have you ever almost been killed?”) and dispositional suppositions (“Is this building equipped with effective fire exits?”) are hypotheticals without if-clause.
When to use them Survey methodologists discourage hypothetical questions, except in very few situations. Such questions prompt the respondent to mentally update the context – the world implied by the if-clause. Logically, this happens before he/she retrieves the elements needed to answer the consequent, the “then what?”-question. In theory, respondents at this point can request that interviewers clarify the if-clause. They can signal the inability to formulate a meaningful response. But in standardized conversations it is more likely that some substantive response is given while the cognitive processing of the if-clause remains invisible. Methodologists make two broad exceptions that justify hypothetical questions. Both can be challenged. But they refer to situations that are frequent in humanitarian assessments, which is why we include hypothetical questions as conducive to subjective measures:
ACAPS Note, Subjective measures in humanitarian analysis, January 2018
17
• Diverse population: The question topic is about a situation that is vastly diverse across the population of interest. Hypothetical questions then “represent an effort to standardize a stimulus because actual experiences range so widely, and the investigator does not know what set of experiences the respondent is bringing to the question” (ibd., 23).
• Revealed preferences: Hypothetical questions “can also be used in an effort to tie attitudes to some realistic contingencies. For example, people can be asked to imagine cost/benefit trade-offs. Would they favor such and such governmental program if it meant that their income tax would go up?” (ibd.).
The diversity of backgrounds and experiences and the necessity to elicit preferences may make hypothetical questions unavoidable. Necessity does not reduce risk – the risk of invalid measures and unreliable measurements. It simply urges caution.
An example from Nigeria In order to help assessment designers exercise informed caution, the main part of this note presents a typology of hypothetical questions. It shares insights that linguists and cognitive scientists have gained about what happens in the respondent’s mind when faced with a hypothetical question. To make this discussion more clearly relevant, we illustrate it with one of several hypothetical questions asked in a recent needs assessment in Nigeria. They were directed at displaced persons in incipient famine conditions: “If you were to receive X amount of additional income, how much of it would you spend on food?” We study the distribution of proportions allocated to food by 1,057 household heads who answered the question (as well as others about allocations to other needs). While virtually all of them allocated some amount to food purchases, the proportions revealed a bimodal distribution. However, on average, all of the other needs received allocations far lower than food. Relatively better-off households should, in theory, have lower marginal propensities for food, but we found that the relationship with reported total monthly expenses, adjusted for household size, was weak. More importantly, there was clear evidence of non-linear behavior, with the mean proportion allocated to food dropping abruptly above a critical monthly expenditure threshold. Why is the relationship with total household expenditure weak when we expect the proportion of additional income allocated to food to increase sharply with greater poverty? Even people on the survival edge experience multiple needs, and some can be more pressing than the need for food. This compromises the validity of this hypothetical question as a predictor of overall deprivation. The weak relationship may be the result also of low reliability. The expenditure estimates have high errors, and the response to the hypothetical question is not robust to the vagaries of interviewing. Either way, the example for Nigeria highlights a paradox. Hypothetical questions can be helpful, even necessary. In the aggregate, the “additional income” question valuably confirmed food as the greatest need then and there. At the same time, the quality of the

ACAPS Note, Subjective measures in humanitarian analysis, January 2018
18
data is questionable. At the individual level, the expected relationship did not show. The real world is too complex to be adequately described through the lens of one hypothetical.
Splitting the hypothetical question In an attempt to reconcile necessity and quality, we propose separating hypothetical questions into two questions. First, the if-clause is replaced by a question in a different mode, such as a normative question. Second, the consequent is replaced with an unconditional question, possibly of a factual kind. To illustrate again with the need for food, purely for the linguistic difference: “If you were to receive X amount of additional income, how much of it would you spend on food?” would be replaced with: “How much does it cost to feed a family the size of yours adequately?” and “How much did you spend on food this past month?” The size-adjusted adequate expenditure estimates in the respondent sample supply a statistic (e.g., the median) that can be interpreted as a normative standard. The comparison between the standard and the (equally size-adjusted) actual expenses provides a shortfall measure. Notice that the “adequately” question is equally hypothetical; what has changed is the mode, from counterfactual to normative. References to social norms and reports of factual behaviors likely reduce subjectivity and improve reliability. Successful methods have proceeded like that, without bothering about the subtleties of language philosophy. One of them we present in some detail – the Basic Necessities Survey.
Basic Necessities Survey (BNS) The BNS measures poverty by collecting data on the presence vs. absence of items essential to a family’s well-being. It weights the items (see below) and computes a score based on the items that the household owns. It pursues a consensual definition of poverty drawn from the sample households themselves. The designers create a tentative list of basic necessities. During the household survey, respondents are asked three questions. The third is optional; it can be used to define a poverty line:
• “Which of these items do you think are basic necessities, things that everyone should be able to have and no one should have to go without?”
• “Which of these items does your household have?” • “Compared to other people in [the survey] area, do you think your household is poor
or not poor?” Items that more than half of the respondents think everyone should have are considered basic. The number of basic items that a household is lacking determine the depth of its poverty. In some versions, the missing items are weighted by the proportions of respondents who claim them as basic necessities. BNSs were pioneered in Britain and have since been conducted in several counties. They have been validated as a simple and straightforward method to combine subjective and

ACAPS Note, Subjective measures in humanitarian analysis, January 2018
19
objective data in a measure of deprivation or poverty. In the main body, we report findings of a detailed validation study in Benin. For the purposes of this note, the BNS demonstrates that hypothetical questions can work well when they are converted to other forms such that the if-clause becomes invisible.
Outlook The last section examines critically where we are on the road to subjective measures, what we are missing, and what may be beneficial next steps. We note the vast range of attitudes that researchers hold towards subjective measures, from deep suspicions about poor data quality to the promise of enlightened feedback from affected populations. We believe that humanitarian analysts should learn from both sides, practicing courage as well as caution. We also note that, not surprisingly, subjective measures have been applied mostly to situations of individuals and households whereas needs assessments in the early phases of the humanitarian response look at communities and social groups. It remains to be seen if subjective measures at levels above the household make sense and can be adequately formulated. Finally, all learning is selective. While humanitarians are latecomers to the world of subjective measures, this gives them the chance to leapfrog, to pick the best from the current menu, and even to experiment with novelty. At the same time, it is desirable that analysts command a common set of fundamentals. In theory, expertise and gold standard tests can be imported as and when needed; in practice, assessment teams often need to improvise and for that should be able to rely on formal methods and on substantive elements that are of intersectoral interest. For that reason, we have shoved to the waiting room some methods and techniques that are, in principle, powerful for the generation and analysis of subjective measures. A practical consideration is that spreadsheet templates must first become available, MS Excel still being the workhorse of most humanitarian analysts. But with the increasing popularity that they enjoy in neighboring disciplines, these candidates will return to knock at our doors.
ACAPS Note, Subjective measures in humanitarian analysis, January 2018
20
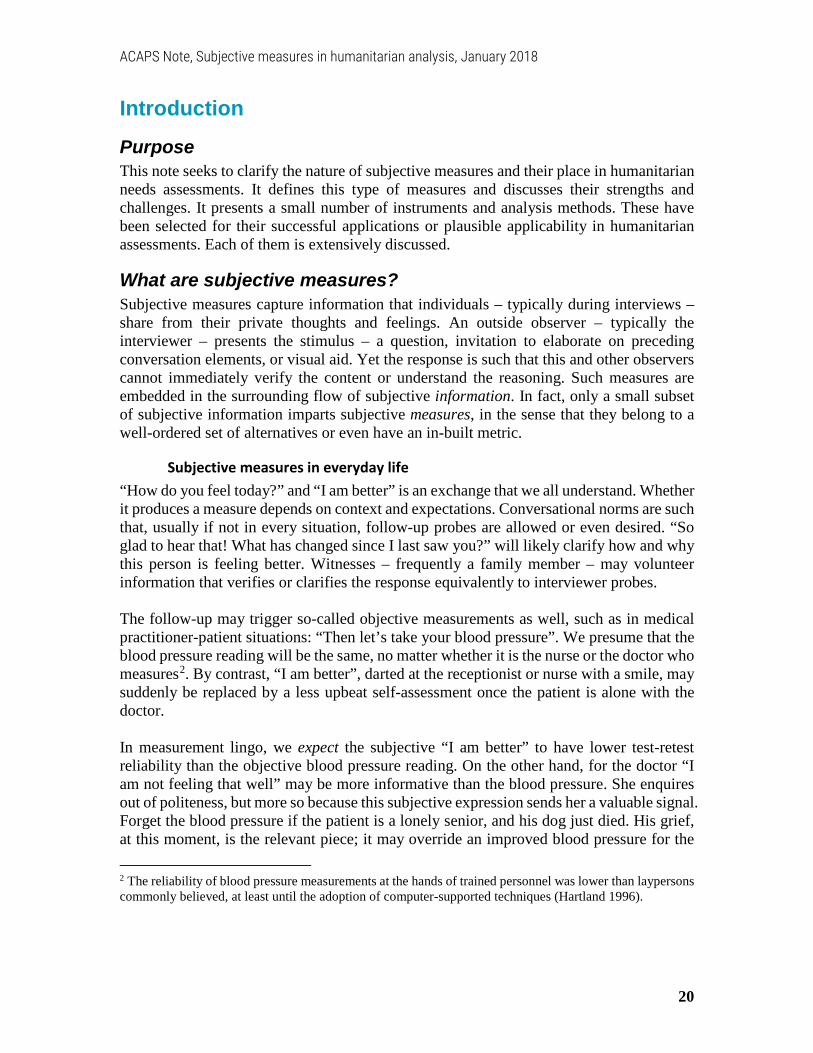
Introduction Purpose This note seeks to clarify the nature of subjective measures and their place in humanitarian needs assessments. It defines this type of measures and discusses their strengths and challenges. It presents a small number of instruments and analysis methods. These have been selected for their successful applications or plausible applicability in humanitarian assessments. Each of them is extensively discussed.
What are subjective measures? Subjective measures capture information that individuals – typically during interviews – share from their private thoughts and feelings. An outside observer – typically the interviewer – presents the stimulus – a question, invitation to elaborate on preceding conversation elements, or visual aid. Yet the response is such that this and other observers cannot immediately verify the content or understand the reasoning. Such measures are embedded in the surrounding flow of subjective information. In fact, only a small subset of subjective information imparts subjective measures, in the sense that they belong to a well-ordered set of alternatives or even have an in-built metric.
Subjective measures in everyday life “How do you feel today?” and “I am better” is an exchange that we all understand. Whether it produces a measure depends on context and expectations. Conversational norms are such that, usually if not in every situation, follow-up probes are allowed or even desired. “So glad to hear that! What has changed since I last saw you?” will likely clarify how and why this person is feeling better. Witnesses – frequently a family member – may volunteer information that verifies or clarifies the response equivalently to interviewer probes. The follow-up may trigger so-called objective measurements as well, such as in medical practitioner-patient situations: “Then let’s take your blood pressure”. We presume that the blood pressure reading will be the same, no matter whether it is the nurse or the doctor who measures2. By contrast, “I am better”, darted at the receptionist or nurse with a smile, may suddenly be replaced by a less upbeat self-assessment once the patient is alone with the doctor. In measurement lingo, we expect the subjective “I am better” to have lower test-retest reliability than the objective blood pressure reading. On the other hand, for the doctor “I am not feeling that well” may be more informative than the blood pressure. She enquires out of politeness, but more so because this subjective expression sends her a valuable signal. Forget the blood pressure if the patient is a lonely senior, and his dog just died. His grief, at this moment, is the relevant piece; it may override an improved blood pressure for the 2 The reliability of blood pressure measurements at the hands of trained personnel was lower than laypersons commonly believed, at least until the adoption of computer-supported techniques (Hartland 1996).
ACAPS Note, Subjective measures in humanitarian analysis, January 2018
21
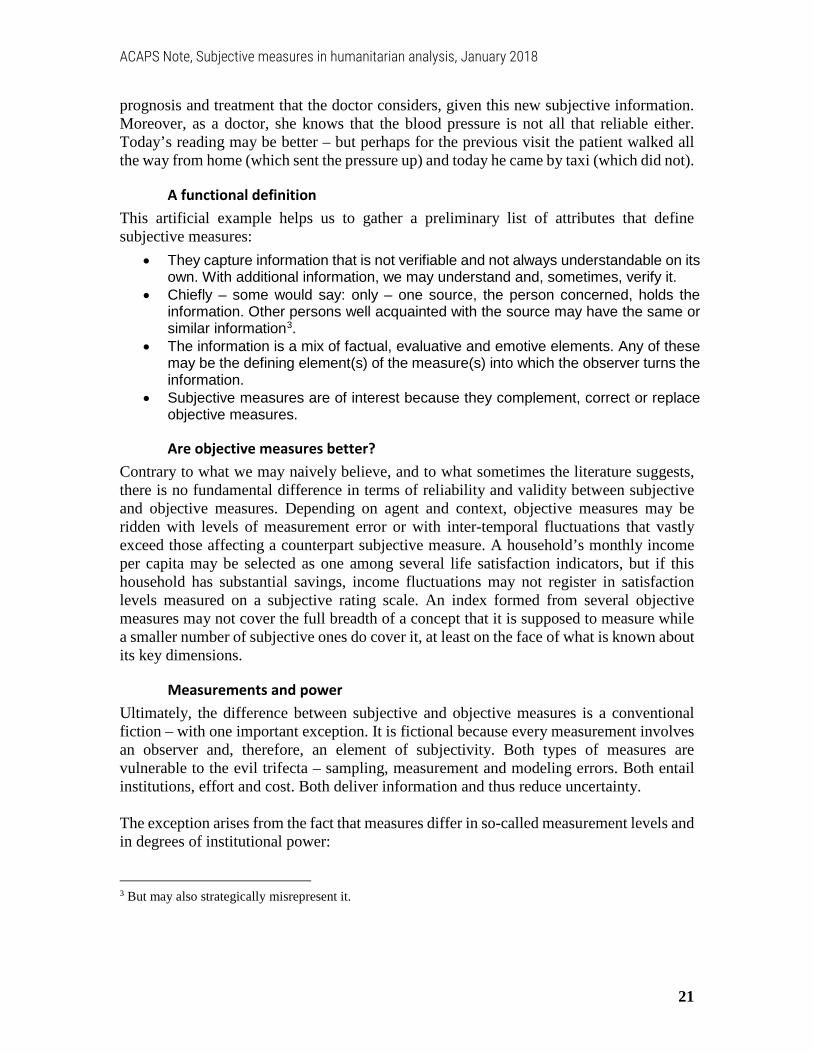
prognosis and treatment that the doctor considers, given this new subjective information. Moreover, as a doctor, she knows that the blood pressure is not all that reliable either. Today’s reading may be better – but perhaps for the previous visit the patient walked all the way from home (which sent the pressure up) and today he came by taxi (which did not).
A functional definition This artificial example helps us to gather a preliminary list of attributes that define subjective measures:
• They capture information that is not verifiable and not always understandable on its own. With additional information, we may understand and, sometimes, verify it.
• Chiefly – some would say: only – one source, the person concerned, holds the information. Other persons well acquainted with the source may have the same or similar information3.
• The information is a mix of factual, evaluative and emotive elements. Any of these may be the defining element(s) of the measure(s) into which the observer turns the information.
• Subjective measures are of interest because they complement, correct or replace objective measures.
Are objective measures better? Contrary to what we may naively believe, and to what sometimes the literature suggests, there is no fundamental difference in terms of reliability and validity between subjective and objective measures. Depending on agent and context, objective measures may be ridden with levels of measurement error or with inter-temporal fluctuations that vastly exceed those affecting a counterpart subjective measure. A household’s monthly income per capita may be selected as one among several life satisfaction indicators, but if this household has substantial savings, income fluctuations may not register in satisfaction levels measured on a subjective rating scale. An index formed from several objective measures may not cover the full breadth of a concept that it is supposed to measure while a smaller number of subjective ones do cover it, at least on the face of what is known about its key dimensions.
Measurements and power Ultimately, the difference between subjective and objective measures is a conventional fiction – with one important exception. It is fictional because every measurement involves an observer and, therefore, an element of subjectivity. Both types of measures are vulnerable to the evil trifecta – sampling, measurement and modeling errors. Both entail institutions, effort and cost. Both deliver information and thus reduce uncertainty. The exception arises from the fact that measures differ in so-called measurement levels and in degrees of institutional power: 3 But may also strategically misrepresent it.

ACAPS Note, Subjective measures in humanitarian analysis, January 2018
22
• Measures that are metric are likelier to be accepted as objective than non-metric measures. In particular, monetary measures are privileged by the double fortune that technically they are ratio-level, and socially they are widely understood beyond the economist profession.
• Measures that have emerged from long research traditions and have undergone multiple validations by a classic professional community are likelier to enjoy unquestioned acceptance than measures developed ad hoc or by occupational groups of lower or newer status. Subjective health measures are a case in point, backed by status and sheer research volume in the medical and allied (e.g. psychiatric) professions.
• Perhaps one should add, comparing the quasi-religious reverence for color maps to the distrust of statistical tables: Measures transported by a newer technology are more readily seen as objective. The usefulness and glamour of Geographical Information Systems (GIS) testify to it.
The differences between objective and subjective measures are thus relative. But there are harder and softer, crispier and fuzzier measures, just as there are some calibrated to gold standards and others that, for good reasons, have been improvised.
Subjective measures in needs assessments Needs, whether filled or not, are felt by individuals. They are also readily communicated; in shared cultures, norms and language define how we describe our own needs, how we understand others’ needs, and how we allocate attention and resources to mine and yours. The statement that “my bad tooth today is hurting much worse than yesterday” reflects my own sensation and, in that sense, is subjective. However, my family understands its meaning and, by observing whether I can still sleep, eat, work and enjoy my favorite TV show, etc. forms a composite judgment of the level of pain. This composite is closer to some objective measure than my single comparative statement, but obviously is captive to the emotions and knowledge of a very small group of people.
Openness to subjective measures The same close interpenetration of psychic and social systems applies on a humanitarian scale. Only that the groups are larger, and the cultural distance wider. More people are in need; communications about needs become more formal; more institutions above the family aggregate them. Some of these institutions exercise power, of beneficial kinds or not, over those in need, and some, such as assessment teams sent from far-away offices, belong to outside cultural groups. They have the means to arrange communications about needs. What they take away from them – for example, from a focus group discussion – may be distorted, from both sides, by interest, ignorance or poor translation. Nonetheless, these observers understand some universal language of need, together with the devices that translate between the needy individual and the caring environment. As such, they are constitutionally open to subjective measures of need.

ACAPS Note, Subjective measures in humanitarian analysis, January 2018
23
Sources of resistance .. Whether the humanitarian community actively elicits and uses such measures is a different matter. We believe, and may be wrong, that subjective measures in humanitarian needs assessments are neither well developed nor confidently used. The reasons are perceptual as well as institutional:
• The character of these measures is misunderstood. Subjective measures are presumed to be less valid, and the measurements less reliable, than so-called objective measures. “Subjective” is suspect; “objective” is desirable. Objective measures, therefore, seem preferable, even when admittedly in need of being complemented by subjective counterparts.
• The pressures of time and of immediate usefulness for response planners circumscribe the amount of testing and adjustment that needs assessments are afforded. This challenge affects the design and application of all types of measures, regardless of whether they are objective, subjective, or something else.
• Many familiar measures of the objective type rest on longer research traditions and are better calibrated than (many, though not all) subjective measures, some of which assessment teams may have to design “on the fly”. The principals may not give time for minimal, let alone adequate, testing. Improvisation is suspect.
.. and of support This situation is not static. In the last ten to twenty years – we are not aware of any exact seminal event -, the differences in appreciation and sophistication between objective and subjective measurement have softened. The cosmic background radiation that has punctured more and more holes into old boundaries emanates from two sources. At the societal level, persons and values are mounting resistance against the dominance of roles and programs, with the result that subjectivity and ego expression gain cultural weight. Second, in terms of disciplinary boundaries, both the behavioral revolution in economics and the growth of so-called mixed methods in the social sciences at large are creating greater space for dialogue and exploration; the growth of statistical and text-analytic resources makes that space more productive.
Overlap with poverty and health measurement – at what cost? There is an even more important source of encouragement for humanitarians to befriend subjective measures – poverty measurement. This has grown into a treasure house of tried and tested methods, incorporating both objective and subjective measures. Poor people are deprived of multiple “things”; deprivations, howsoever enumerated, come naturally as a bridging concept to “unmet needs”, which is what humanitarian assessments measure. Learning from the long tradition of poverty measurement thus seems to be a promising enterprise for the humanitarian needs assessment community. A similarly instructive partnership may be found in health measurement. This community has a longer tradition in subjective measurement, in the use of ordinal data and in well curated test inventories (see, e.g., McDowell 2006).

ACAPS Note, Subjective measures in humanitarian analysis, January 2018
24
Borrowing concepts as well as tools On offer are both philosophical concepts and practical tools. For example, in poverty measurement Amartya Sen’s capabilities approach, with the core concepts of capability (the freedom to be and to do) and functioning (the actual achievement), has gained wide currency. It has also incurred criticism of various sorts (Hoffmann and Metz 2017, Wells Undated, for many others). On the practical side, Sen’s involvement in the design of the Human Development Index (Anand and Sen 1994), led to the adoption of so-called lp-norms into the metrics of multidimensional poverty indices (Benini 2012:67-68), a technique potentially applicable to humanitarian impact measures. Figure 5: The core concepts of Amartya Sen's capabilities approach
Source: Wells, op.cit. However, these borrowings are not entirely free. They import part of the complexity that the poverty and health measurement fields have accumulated. Notably, when some of their philosophical models are written into needs assessments, the measurement of needs is compounded with additional dimensions. Familiar concepts like “severity” or “vulnerability” have to negotiate distinctions between (unobserved) dispositions and (observed) behaviors as understood in those other fields. There will be pressure to demonstrate validity with statistical methods in which few humanitarian analysts have been trained. Notably, analysts will need greater agility with models that combine measured indicators and latent variables.
[Sidebar:] Multidimensional deprivation with subjective data Needs assessments and poverty measurement overlap in the concept of deprivation. In this sense, a person is deprived when an essential need is not met. Since there are several essential needs, and levels of their fulfillment vary in the same individual, a multidimensional measure is desirable. It should supply an aggregate measure of deprivation across needs areas and for distinct groups of affected persons. It should also assess the contribution from each sector and each group to the aggregate score.

ACAPS Note, Subjective measures in humanitarian analysis, January 2018
25
In this sidebar, we demonstrate the use of such a multidimensional method with subjective data, with only a modest amount of technicalities. This radar plot gives a first, vague idea of what follows, using deprivation statistics from a needs assessment in Nigeria, to illustrate the methodology.
Figure 6: Deprivation profiles of three areas in Nigeria
Classic one-dimensional measures For a long time, a set of one-dimensional measures – known as Foster-Greer-Thorbecke (FGT) poverty measures – has been dominant in poverty research (Foster, Greer et al. 1984) (over 6,000 scientific papers cite this seminal article). FGT compares household income or expenditure, suitably adjusted for household size, to a poverty line. Its strength rests on meaningful definitions of three indices. The head count ratio – known as FGT0 - is the proportion of households below the poverty line (it is also known as the incidence of poverty). The depth of poverty – FGT1 – is the mean shortfall, normalized to the poverty line (also known as the poverty gap). The severity of poverty – FGT2 – is the normalized square of the shortfall (also known as the squared gap). Compared to FGT0, FGT1 and all the more so FGT2 give increasing weight to the poorest of the poor. The indices are versatile because they can be “additively decomposed” by social group, region or any other category set. This means that the index value for the total population is equal to the sum of the products of each subgroup’s index value and its population share.
Multi-dimensional approach Several extensions to multi-dimensional metrics have been pursued (Foster, Greer et al. 2010). The multidimensional poverty measures that Sabina Alkire and her colleagues at the Oxford Poverty and Human Development Initiative have been developing over the past ten years are increasingly popular (Alkire, Foster et al. 2015). We bring them to attention for several reasons.

ACAPS Note, Subjective measures in humanitarian analysis, January 2018
26
From the FGT family they inherit the additive decomposability, which is essential for needs assessments comparing groups on degrees of deprivation. They are viable also with dichotomous and ordinal data (albeit not for all indices). In other words, they work in situations where needs assessments depend on ratings or rankings. Recently, STATA published software to compute the Alkire-Foster indices, which removes a barrier from their rapid application to assessment data (Pacifico and Poege 2017). This methodology is no longer purely academic. Several national governments, including those of Mexico, Colombia and the Philippines, consult poverty reports that rely on it. The much talked-about “Gross National Happiness Index” of Bhutan is an adapted version (Wikipedia 2017a).
Subjective poverty lines Respondents can be asked to define poverty thresholds individually. When these subjective values are aggregated, by some method, to one common value, we have a “social subjective poverty line”. Methodologists have validated such lines for the unidimensional case, built on the so-called minimum income question: “What income level do you personally consider to be absolutely minimal? That is to say that with less you could not make ends meet” (Pradhan and Ravallion 2000). We extend this to several sectors, probed with the double question of “How much does your family spend on [X need, e.g. food] in a month?” and “What is the least amount that you would need to spend in order to meet that need adequately?” The relative shortfall is a measure of sectoral deprivation. The resulting data feed into the Alkire-Foster model.
The two-threshold approach The Alkire-Foster model4 applies cut-offs twice in order to determine deprivation status:
• In each dimension, a cut-off point is set, identical for all units of interest (e.g, in the educational dimension: six years of completed schooling for the average of the adult family members). A unit (individual, household) that falls below the threshold is considered deprived (e.g., a family with three adults with 3, 4 and 7 years completed).
• Multidimensional: The dimensions can be weighted, by importance, with weights summing to one. If not, each receives a weight equal to (1 / number of dimensions). A unit deprived in dimension X receives score points equal to the weight of X if deprived, or zero otherwise. The unit’s sum of points determines its overall deprivation status. To do this, a second cut-off is defined. If the point sum is above it, the unit is considered “overall deprived” or, in the original language of Alkire et al., “multidimensionally poor”.
In the head count ratio (the analog to FGT0), an adjustment is made to give greater weight to units deprived in more dimensions than needed to minimally pass the second cut-off. The adjusted head count ratio is obtained by multiplying the raw ratio by the average intensity of multidimensional poverty. The average intensity is the sum of all deprivation scores of the poor divided by the number of the poor (only the poor). The adjusted head count ratio is key to the Alkire-Foster approach because it involves the multidimensional intensity in the aggregation5.
4 For an excellent didactic introduction, graphically illustrated with a family in Ecuador, see Alkire and Robles (2017), available at http://www.ophi.org.uk/wp-content/uploads/B47_Global_MPI_2017.pdf . 5 Alkire, Foster, et al., op.cit., make the Adjusted Headcount Ratio the focus of their entire Chapter 5. They interpret it as “proportion of deprivations that poor people in a society experience, as a share of the deprivations that would be experienced if all persons were poor and deprived in all dimensions of poverty” (ibd., 184). In particular, this index works validly also with ordinal indicators.

ACAPS Note, Subjective measures in humanitarian analysis, January 2018
27
Furthermore, in analogy to FGT1 and FGT2, indices are formulated to measure the depth and severity of the overall deprivation. The complex calculations are the major obstacle to popularizing these measures in the Excel user community.
Data and data preparation Our data come from a basic needs assessment that Okular Analytics facilitated in and around IDP camps in Borno State, in the region affected by armed conflict in northeastern Nigeria, in June 2017 (Okular Analytics 2017). As part of the data collection, field teams interviewed the heads of 1,161 households using a standardized questionnaire. We use estimated monthly expenses in eight needs areas and the corresponding minimum amounts that the respondents considered necessary to meet the needs of their families. These needs areas are the dimensions in the Alkire-Foster model.
On 1,135 of the households, we have suitable data, which we prepare in three steps:
• For each household, we divide the estimated actuals and minima by the adult equivalents,for which we take the square root of the number of members (Solt 2016). This neutralizesthe effect of household size.
• For each needs area, we calculate a social deprivation cut-off, by taking the median ofthe size-adjusted minimum amounts (excluding zeros, which appear to function asmissings). This approximates a social norm of what is required.
• In the adjusted actual expenses, we treat – in this dataset! - zeros as missing and replacethem with the values of the social deprivation cut-offs, thus treating the households as notdeprived in the areas with zero actuals. This minimizes loss of observations. It may createsome bias, underestimating deprivation levels.
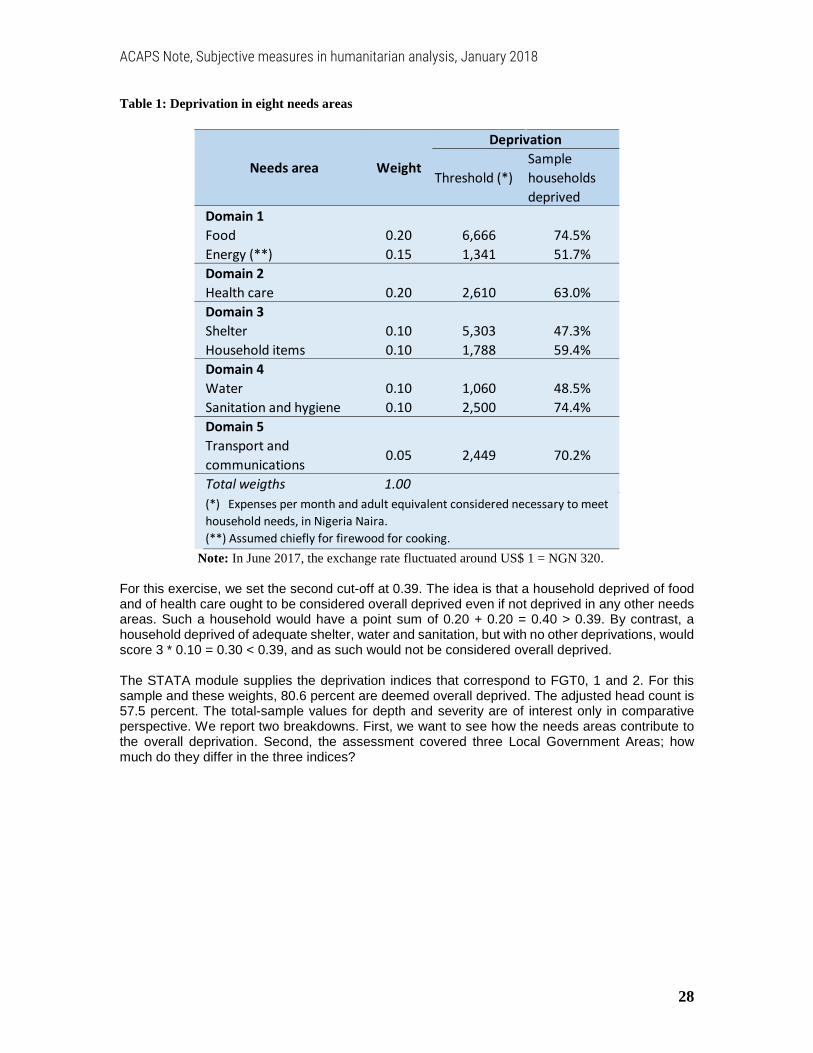
We assign different weights to the needs areas. These weights emphasize the differences that thirty-two community-level focus groups representing IDPs and residents made in rating the importance of the needs areas (the ratings were aggregated by Okular Analytics). This table lists the areas and their weights, the cut-off points and the proportions of households considered deprived in each area. Some needs areas are put in common “domains” (humanitarian sectors) while remaining analytically distinct.
ACAPS Note, Subjective measures in humanitarian analysis, January 2018
28
Table 1: Deprivation in eight needs areas
Note: In June 2017, the exchange rate fluctuated around US$ 1 = NGN 320.
For this exercise, we set the second cut-off at 0.39. The idea is that a household deprived of food and of health care ought to be considered overall deprived even if not deprived in any other needs areas. Such a household would have a point sum of 0.20 + 0.20 = 0.40 > 0.39. By contrast, a household deprived of adequate shelter, water and sanitation, but with no other deprivations, would score 3 * 0.10 = 0.30 < 0.39, and as such would not be considered overall deprived. The STATA module supplies the deprivation indices that correspond to FGT0, 1 and 2. For this sample and these weights, 80.6 percent are deemed overall deprived. The adjusted head count is 57.5 percent. The total-sample values for depth and severity are of interest only in comparative perspective. We report two breakdowns. First, we want to see how the needs areas contribute to the overall deprivation. Second, the assessment covered three Local Government Areas; how much do they differ in the three indices?
Threshold (*)Sample households deprived
Domain 1Food 0.20 6,666 74.5%Energy (**) 0.15 1,341 51.7%Domain 2Health care 0.20 2,610 63.0%Domain 3Shelter 0.10 5,303 47.3%Household items 0.10 1,788 59.4%Domain 4Water 0.10 1,060 48.5%Sanitation and hygiene 0.10 2,500 74.4%Domain 5Transport and communications
0.05 2,449 70.2%
Total weigths 1.00(*) Expenses per month and adult equivalent considered necessary to meet household needs, in Nigeria Naira.(**) Assumed chiefly for firewood for cooking.
Needs area Weight
Deprivation

ACAPS Note, Subjective measures in humanitarian analysis, January 2018
29
Sources of deprivation Table 2: Contributions by needs areas to overall deprivation
One notices right away that the contributions are similar to the weights. This hints at a potential weakness of the multisectoral deprivation approach in terms of actual and minimum required expenses. This distribution may arise when respondents estimate the required amounts by multiplying their actuals by similar factors across needs areas. Households balance their expenses, limited by total income, across needs areas; therefore respondents may feel that what they can afford falls short to similar degrees in most areas. Not surprisingly, the contributions from sanitation and hygiene are clearly higher than from potable water although both areas are equally weighted. Water is the more vital of the two; thus households tend to deprive themselves more of sanitation and hygiene.
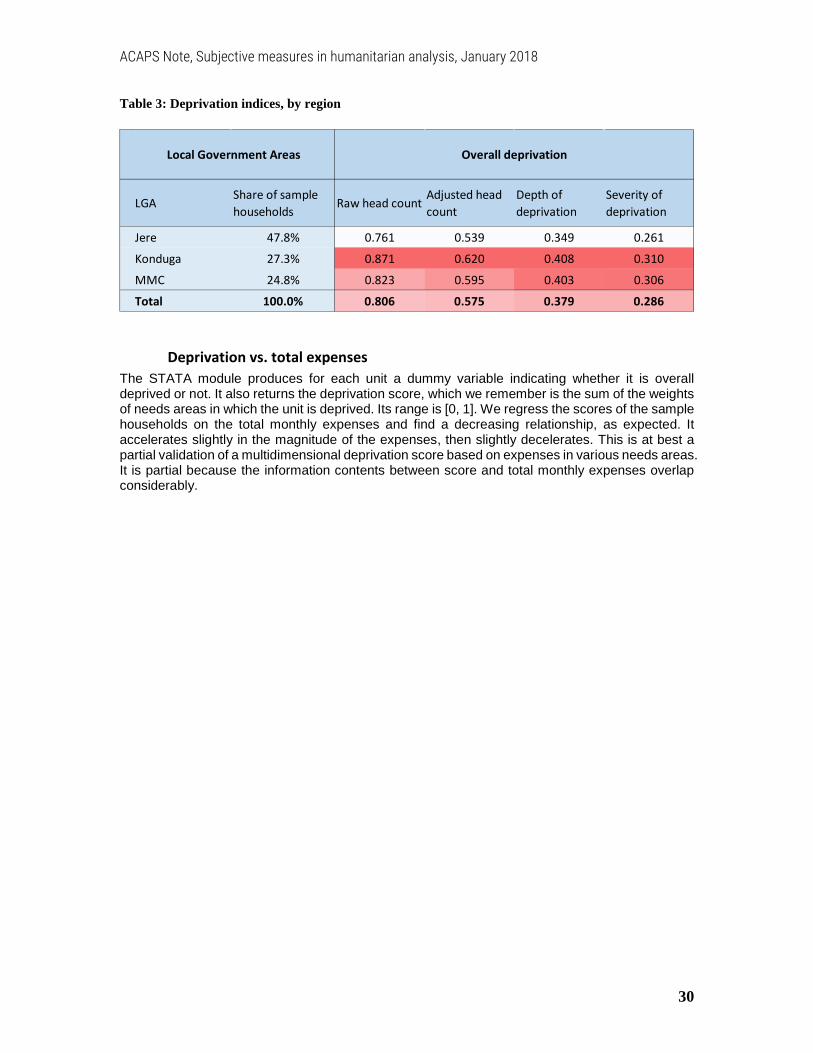
Detecting interesting differences – are they real? The regional differences are likely more genuine. On all deprivation indices, values in Jere LGA are lower than in Konduga and MMC. The absolute differences may appear minor. Yet in a small number of tests, they were significant. One is tempted to infer that people in Konduga and MMC face greater difficulties filling their essential needs than those in Jere. However, such tests assume random samples drawn from all households in the three LGAs, an assumption that is not plausible in this conflict region. The finding is only valid if prices of goods and services do not differ much between Jere and the other two LGAs.
Needs areaAdjusted head count
Depth of deprivation
Severity of deprivation
Domain 1Food 0.24 0.23 0.22Energy 0.13 0.12 0.12Domain 2Health care 0.21 0.22 0.23Domain 3Shelter 0.08 0.08 0.08Household items 0.10 0.10 0.10Domain 4Water 0.08 0.07 0.07Sanitation and hygiene 0.12 0.12 0.13Domain 5Transport and communications
0.05 0.06 0.06
Total contributions 1.00 1.00 1.00
ACAPS Note, Subjective measures in humanitarian analysis, January 2018
30
Table 3: Deprivation indices, by region
Deprivation vs. total expenses The STATA module produces for each unit a dummy variable indicating whether it is overall deprived or not. It also returns the deprivation score, which we remember is the sum of the weights of needs areas in which the unit is deprived. Its range is [0, 1]. We regress the scores of the sample households on the total monthly expenses and find a decreasing relationship, as expected. It accelerates slightly in the magnitude of the expenses, then slightly decelerates. This is at best a partial validation of a multidimensional deprivation score based on expenses in various needs areas. It is partial because the information contents between score and total monthly expenses overlap considerably.
LGAShare of sample households
Raw head countAdjusted headcount
Depth of deprivation
Severity of deprivation
Jere 47.8% 0.761 0.539 0.349 0.261
Konduga 27.3% 0.871 0.620 0.408 0.310
MMC 24.8% 0.823 0.595 0.403 0.306
Total 100.0% 0.806 0.575 0.379 0.286
Overall deprivationLocal Government Areas

ACAPS Note, Subjective measures in humanitarian analysis, January 2018
31
Figure 7: Multidimensional deprivation score vs. total monthly expenses
The great variability of the relationship is noteworthy. The total expenses account for only half of the variance in the deprivation scores. Even among households that are well-off by what they can buy in a month (log(expenses) = 5), the mean score is still around 0.20. One can be deprived despite a handsome income. This may be the case, for instance, of households in which high medical costs compress the ability to meet other needs.
Please handle with care Multidimensional deprivation analysis can describe such variability in the detail needed. This versatility may make it the friend or the enemy of the humanitarian analyst. The affinity to multisectoral assessments is attractive; the ability to incorporate binary and ordinal variables advances the scope of what the analyst can do validly with these data types. And, although our demonstration with expenditure data from Nigeria does not incorporate any non-monetary indicators, multidimensional deprivation analysis handles them on the same footing as monetary ones.
The downsides, too, must be noted. There are many bells and whistles. Users may find it difficult to understand the head count adjustment (which impacts also the depth and severity indices). As Alkire and Foster themselves underline (op.cit., 144),
“many key decisions are left to the user. These include the selection of the measure’s purpose, space, unit of analysis, dimensions, deprivation cut-offs (to determine when a person is deprived in a dimension), weights or values (to indicate the relative importance
ACAPS Note, Subjective measures in humanitarian analysis, January 2018
32
of the different deprivations), and poverty cut-off (to determine when a person has enough deprivations to be considered poor)”.
The assessment designers and the analyst must make many choices. Are these always well-informed? Even if so, it may be difficult to ensure comparability across assessments when choices differ substantially. As the World Bank economist Martin Ravallion quipped, back in 2010 when Alkire-Foster was in its infancy: “Your new composite index has arrived: Please handle with care”6.
More on the nature of subjective measures We return to the question “What are subjective measures?”, this time by way of example. We describe a measure that has been used widely and with good success, then discuss the rationale for subjective measures.
Scaling subjectivity on a ladder The so-called Cantril Ladder (Cantril 1965) asks interviewees to place themselves in an imaginary vertical dimension:
“Please imagine a ladder with steps numbered from zero at the bottom to 10 at the top. The top of the ladder represents the best possible life for you and the bottom of the ladder represents the worst possible life for you. On which step of the ladder would you say you personally feel you stand at this time?”
This version, quoted by Cojocaru and Diagne (2013:5, footnote 12), leaves it entirely to the respondent to imagine what might be best possible and worst possible personal situations. For this reason, it is considered a “self-anchoring scale”. This may be difficult for some interviewees; the ladder endpoints can therefore be exemplified with contextually appropriate social positions, such as “the king” on top, and “a beggar” at the bottom. In the "Economic Ladder Question (ELQ)" version (Ravallion 2012:7),
“Imagine six steps, where on the bottom, the first step, stand the poorest people, and on the highest step, the sixth, stand the rich (show a picture of the steps). On which step are you today?”
the endpoints are denoted with two commonly understood wealth-related attributes, “rich” and “poorest”.
Aspects of subjectivity We will return to the anchoring problem later. At this point, we only want to note:
6 http://voxeu.org/article/your-new-composite-index-has-arrived-please-handle-care .
ACAPS Note, Subjective measures in humanitarian analysis, January 2018
33
• Subjective: The Cantril ladder is a subjective measure. Even versions that interpret the endpoints (e.g., “king vs. beggar”) leave it to the respondents to map their personal or family situations to the ladder steps that are most appropriate in their own minds.
• Not self-explanatory: The respondent does not share the rationale for the self-placement on a particular step unless made to elaborate, such as in response to follow-up questions.
• Open to all welfare dimensions: By implication, the reasons why two respondents place themselves on the same step may be entirely different. For example, one may be motivated chiefly by comparing his wealth to that of other persons, another by her health career.
• Objective circumstances vary: For the same reason (the rationale is not observed), respondents who place themselves on the same step may differ, sometimes widely, on “objective” welfare measures such as wealth and income.
• Standards of comparison differ: A respondent may compare her current situation to what it used to be in the past. Another compares it to the equally current situation of other persons or to a social norm. A third respondent evaluates it in the light of her ambition to achieve certain goals in some point in the future.
• Context-sensitive: The respondent faces the ladder question in the context of a wider interview. Research has demonstrated that subjective measures are highly sensitive to context. For example, in the USA, the Gallup Healthways Well-Being survey used the Cantril ladder. In this randomized study, some versions asked respondents political questions before introducing the ladder; others did not. The former versions had “a very large downward effect on their assessment of their own lives .., comparable to that associated with becoming unemployed” (reported in National Research Council 2014:81-82)
• Measurement level: The Cantril ladder is an ordinal measure. The distances between rungs cannot be compared without some transformation to a higher measurement level, for which additional assumptions and possibly external information are needed.
• Visual: The ladder metaphor lends itself to visual representation. The interviewee looks at the outline of a ladder with X steps, equally spaced. He may simply point to a higher or lower step as the one capturing his felt situation best and leave the exact step number to the interviewer to read.
Not all subjective measures have every one of those characteristics. Some are in a grey zone between subjective and objective. A question like “In the past week, on how many days did your family rely on unusual foods in order to have a meal?”, part of a (fictitious) nutritional-stress inventory, asks for a count. As such, it is a ratio-level measure. The interpretation of “unusual” is entirely subjective. Family A reports that during three days they had to make do with nothing but catfish from the nearby creek; family B dug for mussels to tide themselves over for one hungry day. The mere number of days is hardly a valid measure of current food insecurity. Contrast that with a question that would be appropriate in Niger during lean seasons: “In the past week, did your family collect millet from termite mounds?” (a famine food listed
ACAPS Note, Subjective measures in humanitarian analysis, January 2018
34
in Muller and Almedom 2008:603). We are inclined to consider this an objective indicator, albeit one certainly in need to be complemented with several more specific indicators of acute food insecurity. However, as these authors detail statistically, the people of their study village lack “a cohesive definition of the ‘famine food’ cultural domain and .. incorporat[e ..] many ‘famine foods’ into the other categories” of foods (ibd., 602). We are back to subjectivity.
Why subjective measures? With all the suspicions about the validity and reliability of subjective data, why are such measures still being used?
Scope of meaning Chiefly because objective measures such as household income may not sufficiently cover the full range of the concept to which the ultimate question of interest points. If it is happiness, then persons of higher income find it easier to procure the goods and services that, typically, are associated with a happier life. But not all rich people are happy. No one model fully specifies the conditions of happiness; therefore, a broad subjective question such as “How happy are you at present with your life as a whole?” covers more than any specific set of objective happiness indicators does.
Objective measures may fall short The case for subjective measures is somewhat made stronger by unavailable or unreliable objective measures. In rapid assessments, welfare measures such as monthly household expenditure are hard to estimate reliably 7 . Income measurement poses even greater difficulty. “Typical values” for a period of several months may be meaningless because of fast changing circumstances. Even in more stable situations, such as those resulting from long-term displacement, such measures are complex. People sell and buy durable assets, by disposing, say, of jewelry or investing in small business equipment. Thus, from a consumption welfare viewpoint, changes in assets and liabilities would have to be monitored as well. The family may not have enough to eat this month because a heavy loan payment on the sewing machine falls due. A “households as corporate firms” approach to welfare measurement (Samphantharak and Townsend 2010) may be viable in economic development research, but rarely for rapid assessments. Instead, a modest approach to objective measurement may produce sufficiently reliable data and valid proxy measures for some partial, yet important welfare components of interest. Scales based on the presence of durable household items come to mind (Filmer
7 On the reliability of such estimates in well established household surveys in generally more placid environments, see Xu et al. (2009). Cope et al. (2012) provide a rare study of the reliability of expenditure estimates in a population of humanitarian interest, Iraqis displaced to Syria and Jordan. However, their focus is chiefly on the question whether expenditure estimates are a viable proxy of income estimates; the reliability of the former is not sufficiently answered by models relating them to health indicators.
ACAPS Note, Subjective measures in humanitarian analysis, January 2018
35
and Pritchett 2001, Filmer and Scott 2008). These less ambitious indices may then be complemented with subjective measures in order to produce a well-rounded welfare index.
Arguments and fallacies Arguments for subjective measures have been made by many. But not all of them stand in the flame of close inspection. Veenhoven (2001) exemplifies this mixed advocacy. She seeks to clarify the relationship between subjective and objective measures by distinguishing their positions on two dimensions.
• Substance: Measures are subjective or objective by virtue of their substance. “Objective indicators are concerned with things which exist independently of subjective awareness. For instance, someone can be ill in an objective sense because a tumor is spreading in the body, without that person knowing” (op.cit., 4). Subjective measures cover states of which the person concerned is aware.
• Assessment method: “Objective measurement is based on explicit criteria and performed by external observers. Illness can be measured objectively by the presence of antigens in the blood, and class membership by possession of means of production. Given these operational definitions, any impartial observer will come to the same conclusion. Yet, subjective measurement involves self-reports based on implicit criteria. The ignorant cancer patient who reports to feel in good health may have based that appraisal on many cues and will not be really able to say how he came to that appraisal” (ibd.).
It is not as simple as that However, those distinctions, while well-meaning, do not hold water. Measurement takes place in institutional contexts; in many of these, the self-aware and intentional participation of the persons subject to measurement is necessary. Thus, in hospital emergency rooms, it is not uncommon for multiple specialists to see a freshly admitted patient in short succession. Apart from looking at the objective vitals, these observers will invariably enquire about the level and location of pain “now” and “before you received the pain medication”. Although pain is a subjective sensation, conscious patients will likely repeat the description of their “pain before” in similar or even identical terms. To that extent, doctors and nurses will register this symptom consistently while they interpret it each in the perspective of a medical specialization or hospital hierarchy. This delicate interweaving of objectivity and subjectivity is more common than naïve assumptions about scientific methods admit. The weather forecasting industry, a paragon of objective measures, favors automated observation and numerical prediction. Yet it has found it necessary to embed human personnel locally “to push past the interpretive limitations of prediction models” (Daipha 2015:53). It exemplifies the kind of modern objectivity that “combines the ethos of a late twentieth-century scientist with the device orientation of an industrial engineer and the authorial ambition of an artist” (Daston and Galison 2007:414, quoted by Daipha, op.cit., 454).
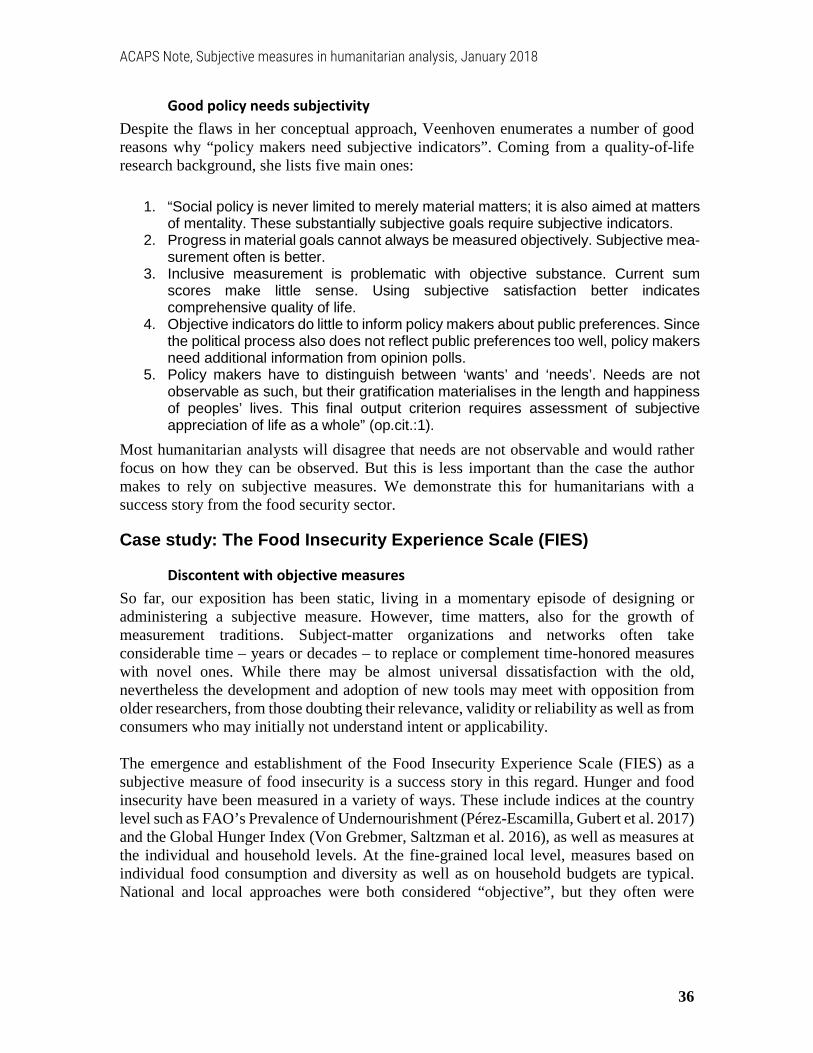
ACAPS Note, Subjective measures in humanitarian analysis, January 2018
36
Good policy needs subjectivity Despite the flaws in her conceptual approach, Veenhoven enumerates a number of good reasons why “policy makers need subjective indicators”. Coming from a quality-of-life research background, she lists five main ones:
1. “Social policy is never limited to merely material matters; it is also aimed at matters of mentality. These substantially subjective goals require subjective indicators.
2. Progress in material goals cannot always be measured objectively. Subjective mea- surement often is better.
3. Inclusive measurement is problematic with objective substance. Current sum scores make little sense. Using subjective satisfaction better indicates comprehensive quality of life.
4. Objective indicators do little to inform policy makers about public preferences. Since the political process also does not reflect public preferences too well, policy makers need additional information from opinion polls.
5. Policy makers have to distinguish between ‘wants’ and ‘needs’. Needs are not observable as such, but their gratification materialises in the length and happiness of peoples’ lives. This final output criterion requires assessment of subjective appreciation of life as a whole” (op.cit.:1).
Most humanitarian analysts will disagree that needs are not observable and would rather focus on how they can be observed. But this is less important than the case the author makes to rely on subjective measures. We demonstrate this for humanitarians with a success story from the food security sector.
Case study: The Food Insecurity Experience Scale (FIES)
Discontent with objective measures So far, our exposition has been static, living in a momentary episode of designing or administering a subjective measure. However, time matters, also for the growth of measurement traditions. Subject-matter organizations and networks often take considerable time – years or decades – to replace or complement time-honored measures with novel ones. While there may be almost universal dissatisfaction with the old, nevertheless the development and adoption of new tools may meet with opposition from older researchers, from those doubting their relevance, validity or reliability as well as from consumers who may initially not understand intent or applicability. The emergence and establishment of the Food Insecurity Experience Scale (FIES) as a subjective measure of food insecurity is a success story in this regard. Hunger and food insecurity have been measured in a variety of ways. These include indices at the country level such as FAO’s Prevalence of Undernourishment (Pérez-Escamilla, Gubert et al. 2017) and the Global Hunger Index (Von Grebmer, Saltzman et al. 2016), as well as measures at the individual and household levels. At the fine-grained local level, measures based on individual food consumption and diversity as well as on household budgets are typical. National and local approaches were both considered “objective”, but they often were
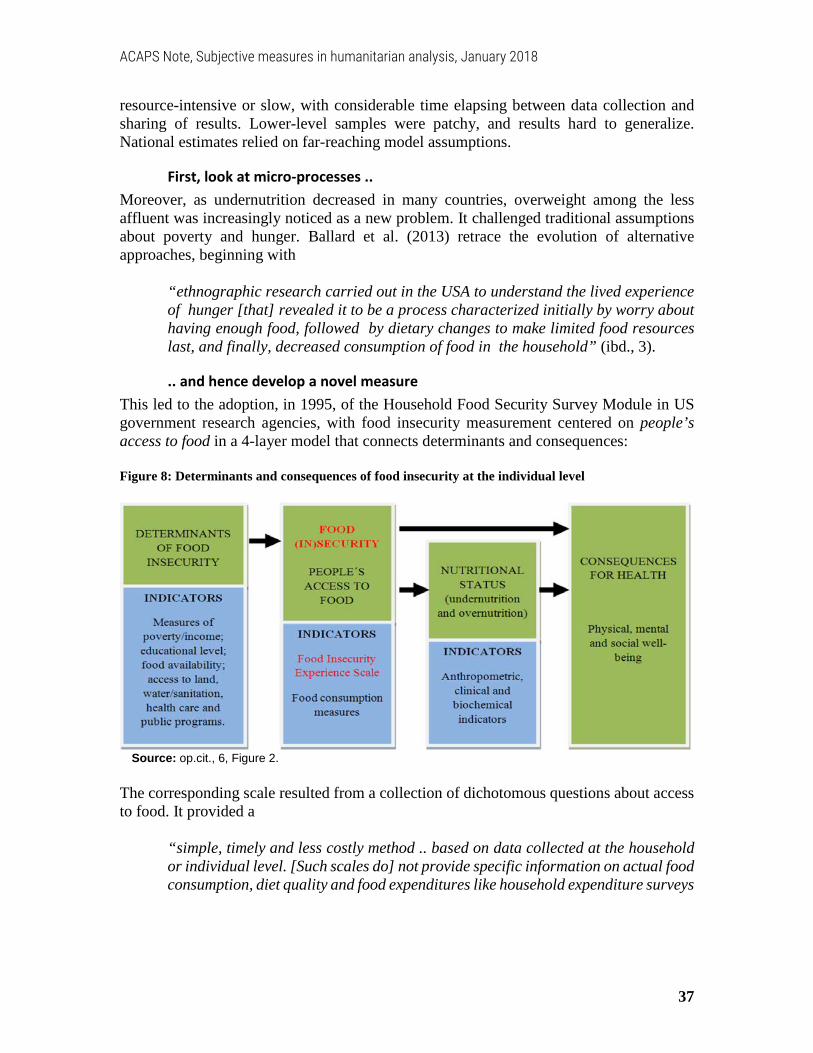
ACAPS Note, Subjective measures in humanitarian analysis, January 2018
37
resource-intensive or slow, with considerable time elapsing between data collection and sharing of results. Lower-level samples were patchy, and results hard to generalize. National estimates relied on far-reaching model assumptions.
First, look at micro-processes .. Moreover, as undernutrition decreased in many countries, overweight among the less affluent was increasingly noticed as a new problem. It challenged traditional assumptions about poverty and hunger. Ballard et al. (2013) retrace the evolution of alternative approaches, beginning with
“ethnographic research carried out in the USA to understand the lived experience of hunger [that] revealed it to be a process characterized initially by worry about having enough food, followed by dietary changes to make limited food resources last, and finally, decreased consumption of food in the household” (ibd., 3).
.. and hence develop a novel measure This led to the adoption, in 1995, of the Household Food Security Survey Module in US government research agencies, with food insecurity measurement centered on people’s access to food in a 4-layer model that connects determinants and consequences: Figure 8: Determinants and consequences of food insecurity at the individual level
Source: op.cit., 6, Figure 2.
The corresponding scale resulted from a collection of dichotomous questions about access to food. It provided a
“simple, timely and less costly method .. based on data collected at the household or individual level. [Such scales do] not provide specific information on actual food consumption, diet quality and food expenditures like household expenditure surveys

ACAPS Note, Subjective measures in humanitarian analysis, January 2018
38
and individual food intake surveys might do, but rather focus more broadly on reported food-related behaviors associated with the experience of food insecurity due to limited access to food. They should therefore not be seen as substitutes for but rather as complements to these other important measures” (ibd., 5).
A measure with global reach Increasingly this research drew international attention, with a major symposium held at FAO headquarters in 2002 and a stock-taking of research in a 2006 supplement to the Journal of Nutrition. This publication noted three major conceptual developments in food insecurity measurement:
1. “a shift from using measures of food availability and utilization to measuring ‘inadequate access’;
2. a shift from a focus on objective to subjective measures; and 3. a growing emphasis on fundamental measurement as opposed to reliance on distal,
proxy measures” (quoted in op.cit.: 7). In the first decade of the 2000s, considerable research was conducted also in Latin America and the Caribbean. Eventually, it was the FAO’s Voices of the Hungry project that took research efforts to a global scale. In 2013, the FAO conducted pilot studies into the Food Insecurity Experience Scale in Angola, Ethiopia, Malawi and Niger; in 2014 it finalized the instrument and translated it into 200 languages. Methods were found to make the scale comparable across languages, cultures and countries (Nord, Cafiero et al. 2016). This paved the way to graded measures of both the food-insecure (the broad measure) and the severely food-insecure.
Who are the food-insecure? In the same year, the application of the Food Insecurity Experience Scale Survey Module sky-rocketed in a partnership with the Gallup World Poll. Gallup collected so much data –over 100,000 individuals in 146 countries - that the question “Who are the World’s Food Insecure?” could be answered with much greater accuracy. The FAO Technical Report No. 1 in the series “Voices of the Hungry” provided countrywise prevalence estimates as well as an exceptionally thorough methodological account8. Regarding the determinants of food insecurity, Smith et al. (2017) were among the first to report detailed results. They analyzed common determinants in 134 countries:
“The five characteristics associated with the largest increase in the likelihood of experiencing food insecurity around the world are: having low levels of education,
8 With most detail given to scale formation and estimation under a statistical approach known the Item Response Theory (IRT, “Rasch model”) (Wikipedia 2013).

ACAPS Note, Subjective measures in humanitarian analysis, January 2018
39
weak social networks, less social capital, low household income, and being unemployed” (ibd., 402, with usable data on 123,732 individuals).
Smith’s team also investigated how the determinants of food insecurity differed across levels of economic development (based on country rankings by the World Bank). Descriptively, the proportions of broad and severe food insecurity are as follows: Figure 9: Food insecurity - Prevalence by economic development ranking
Source: op.cit., 405, Table 1.
As the economy grows, the causes change Some of the interesting findings along the economic development dimension include:
• Decreasing association with national economic development: For low-income countries, the largest effect on food insecurity is from GDP per capita. “A 10% increase in GDP per capita ($142 per capita on average) is associated with a 2.7 percentage point lower probability of experiencing food insecurity” (ibd., 408). But this effect is no longer statistically significant for lower middle- and upper-middle-income countries. This implies that, as countries get richer, further growth in GDP per capita is less and less closely associated with reductions in food insecurity9. From this we might further conclude (although the authors don’t say so) that programs that aid the remaining food-insecure need to be more specific and more closely targeted.
• Severe food insecurity has its own determinants: The five most powerful “come from the social capital, elementary education, social network, log household income, and separated, widowed, or divorced characteristics, respectively. For example, holding all other characteristics constant, a high level of social capital is associated with a 6.7 percentage point lower probability of experiencing severe food insecurity. Having only an elementary education is associated with a 6.3 percentage point higher probability of experiencing severe food insecurity, compared to having a college degree” (ibd., 408).
9 It should be pointed out that this argument is based on cross-sectional data.

ACAPS Note, Subjective measures in humanitarian analysis, January 2018
40
• The risk for women is highest in middle-income countries: “The associations between food insecurity and gender, the number of adults in the household, rural status, employment status, and GDP per capita all vary by development ranking. This reveals the need for country-specific development policies and that a blanket approach to development assistance may not be effective” (409). The effect of gender is particularly noteworthy. Women are more likely to be food-insecure to a statistically significant degree in middle-income countries. In low- and high-income countries, the effect of gender is absorbed by other covariates; in particular, persons who are single or have never married are at greater risk. As regards severe food insecurity, the direct effect of gender disappears in all country-income groups except high income; women in high-income countries are less likely to be severely food-insecure than men.
Individual diversity or measurement error? One notices, though, that the reported effects are relatively small, both for country-level (GDP p.c. increase) and individual-level examples (only primary education). To the statistical eye, it is remarkable that the error components for country and sub-country regions are similar in size, both in the global model and across economic development groups, and both for broad and severe food insecurity. The individual level variances are between two and four times larger. The authors bill this as a measure of the unobserved heterogeneity – in plain English: personal situations differ greatly even within the same local environments. We believe that this measure reflects also unstructured measurement errors; there is no way to tell these from objective personal differences.
Success factors The fact that the FIES scale produced this wealth of findings from the first year’s crop of global data testifies to its validity and reliability. For the purpose of this note, the following aspects of this success story deserve special note:
• The FIES scale takes measurement to higher resolution. The findings result from individual-level data.
• Profiling: Within countries, to the extent of the Gallup Poll coverage, we can know what kind of people are food-insecure, and where they are.
• Comparable: Between countries, scale equivalence techniques make data and findings comparable.
• Speed and cost: Results arrive faster; the marginal cost of a data point is lower than of data from scattered surveys.
• Metric: Although the questions underlying the scale are categorical, the scale is a quantitative measure.
• Graded population estimates: Levels of food insecurity (broad vs. severe) can be defined by particular scale ranges. Food insecurity can thus be graded, a property desirable in persons-in-need estimates.
ACAPS Note, Subjective measures in humanitarian analysis, January 2018
41
Time, language and partnerships This achievement cannot easily be transposed to the design and development of just any other measure with possible global ambitions. The Food Insecurity Experience Scale was born and raised in a favorable institutional environment:
• It is the fruit of unorthodox partnerships between two agricultural administrations, one of a national government (USA), the other a UN agency (FAO), between this UN agency and multiple Latin American and Caribbean food security researchers, as well as between the UN and a commercial survey firm (Gallup).
• The measure matured slowly. From the early ethnographic studies in the US, which began before 1990, to the first Gallup analysis in 2017, almost thirty years passed. No one would see in this evolution anything like an abrupt paradigm shift. The amount of care and circumspection that this speed permitted is unthinkable in the conditions in which some of the humanitarian assessment tools are improvised.
• Not only time, also language matters. The FIES literature scarcely refers to “subjective measures” – who appreciates subjectivity? -, but stresses the “experiential” or “experience-based” character of the scale – who can object to experience, particularly to that of the unfortunate who went through times of scarcity, hunger or starvation? The attribute “experience-based” is appropriate because the measure does not depend on response to hypothetical (scenarios) or attitudinal (e.g., preferences) questions.
Old questions linger Nevertheless, it is legitimate to raise the kinds of questions that subjective measures pose also regarding the FIES. De Weerdt et.al. (2016) discuss the challenges of “measuring hunger through surveys”:
“The second alternative is to use data on self-reported concerns and experiences of inability to access food in adequate quantities or of adequate quality. The Gallup World Poll has previously asked “Have there been times in the past 12 months when you did not have enough money to buy the food that you or your family needed?”(Headey 2013:8). The FAO’s Voices of the Hungry project is developing a food insecurity experience scale, which entails eight questions about conditions experienced in the last 12 months (all yes or no responses). These questions range from whether respondents have felt any anxiety about having enough food at any time during the previous 12 months to whether they felt hungry but did not eat because there was not enough money or other resources for food. Beginning in 2014, the food insecurity experience scale was included in the Gallup World Poll, and the FAO now also promotes national surveys to include the short module. Such brief questions are quicker and cheaper to collect than full [household consumption and expenditure] efforts. However, how well they correlate with other measures (like food consumption) is unclear. Migotto et al. (2007) analyze data from four countries and find that subjective perceptions of food consumption adequacy are, at best, weakly correlated with calorie consumption, dietary diversity, and

ACAPS Note, Subjective measures in humanitarian analysis, January 2018
42
anthropometric measures. Gunderson and Ribar (2011) investigate the correlation between food expenditures and two widely used self-reported food hardship indicators in the United States. They conclude that there are serious concerns about the external validity of the self-reported measures” (ibd., 734-5).
This motivates us to look again into the quality of subjective measures in a generic way. In the next section, we do this under the heading of “reliability”; certainly, a discussion of “external validity”, too, would be fruitful – do these measures indeed capture what they are intended to capture?
The reliability of subjective measures Martin Ravallion, formerly with the World Bank, has reflected on the use of subjective data, primarily in poverty measurement, for longer than ten years (Ravallion 2000, Beegle, Himelein et al. 2012, Ravallion 2012, Ravallion, Himelein et al. 2013). He is also a sceptic vis-à-vis composite measures that condense a variety of poverty indicators into one so-called multi-dimensional index. While this skepticism doubts the validity of such indices – what do they measure? -, his research into subjective measures is preoccupied chiefly with their reliability – are they consistent between raters and points in time? His concern is that “subjective data can offer a direct lens on welfare that is not available in standard objective data. But are subjective questions reliable, in the sense that one gets similar answers under similar circumstances?” (Ravallion 2012:15). There is reason to worry that the response often is unreliable. He cites a study on job satisfaction (Kristensen and Westergaard-Nielsen 2007) in which 20 percent of the respondent answered the same question differently within the same interview10. As the period between first and second time lengthens, the proportion of inconsistent respondents goes up. At the same time, Ravallion recognizes that “neither income nor consumption is a sufficient statistic for welfare” (op.cit., 2). Moreover, if income-based poverty lines are to be meaningful, they must be “adjusted for all relevant non-income dimensions of welfare” (p.5). Thus, subjective measures are a necessary complement. They can be obtained in two ways:
• Categorical: Respondents can choose from qualitative categories that are presented in the shape of the Cantril ladder or some kind of satisfaction-with-life questions that are understood as ordinal (or, we might add, in the reverse sense, levels of dissatisfaction or levels of deprivation).
10 This does not take into account that an interview is a learning process, for both sides. Repeating questions may improve the accuracy of the response, often accompanied by voluntary comments of the kind “Now that I have heard all the other questions, I understand this one better. The correct answer is ..”. However, excessive repetitions irritate respondents (Weijters, Geuens et al. 2009:4).
ACAPS Note, Subjective measures in humanitarian analysis, January 2018
43
• Metric: Questions about income can be tied to a qualitative satisfaction level. The interviewer asks: “Given your family needs, what income level is absolutely minimal?” or through multiple questions: “What level of income would you consider: very bad, bad, not good, not bad, good, very good?”, a form of elicitation started way back in the late 1960s (Van Praag 1968, Van Praag, Goedhart et al. 1980).
The next steps in using these data differ by data type; three approaches have been tried:
• Ordinal welfare data such as the steps on the Cantril ladder are regressed on income or consumption estimates. These estimates may be multi-dimensional (by income source or consumption area) rather than reduced to one variable.
• Beyond its dependence on income or consumption, subjective welfare can be tested for the influence of capabilities, observed through physical and social functionings. The data required to estimate such models come from detailed household surveys (Kingdon and Knight 2006, who used a sample from South Africa of over 8,000 households).
• Subjective poverty lines are computed by comparing absolutely minimal incomes (better: incomes considered very bad, bad, etc., as above) to the subjective welfare measure (Ferrer-i-Carbonell and Van Praag 2001, using data from a panel survey in Russia). In other words, two or more subjective measures are compared to each other.
Yet, even when analysts build and run such models, they cannot make the individual motivations for self-ratings and subjective poverty lines transparent. Households at different levels of deprivation may place themselves on the same rung of the Cantril ladder, and others in similar “objective” circumstances may place themselves on different rungs. The standards of comparison remain hidden. A respondent may compare his/her situation to his/her own previous situation, or the current situation of others, or even an orientation towards the future such as career aspirations of where one hopes to be ten years from now. The reliability of subjective measures is an abiding concern. The next chapter features some of the major types of measures, with references to reliability safeguards where such are readily available.
ACAPS Note, Subjective measures in humanitarian analysis, January 2018
44
Instruments This chapter discusses three types of instruments while omitting others. The three were selected because some variants of each have been extensively tested and applied in multiple contexts. We devote considerable space to their generic features and to one case study for each of them: Instrument Case study Scales The Humanitarian Emergency Settings Perceived Needs Scale
Vignettes Validation of anchoring vignettes with household survey data
Hypothetical questions
Basic Necessities Surveys
Other instruments that are equally deserving of study are omitted, either because they are presented in other ACAPS resources or because they demand a minimal treatment that exceeds this note. Books about the mechanics, validation and substantive analysis of scales in general – for “objective” or “subjective” measures – are plentiful. We, therefore, keep the discussion of generic aspects of scales short. Benini (2013:29-41) and Benini and Chataigner (2014) discuss measures of severity and priority in the context of needs assessments in Yemen, Syria and the Philippines11; some of these measures are related to scales. An introduction to Item Response Theory (IRT) (Wikipedia 2016, Wikipedia 2017b) would be desirable. IRT models have become almost the gold standard for scales based on dichotomous items and, in some flavors, also on ordinal ones. We refrain because of the underlying analytic complexity and because we have, as of this writing, not yet tested any suitable Excel add-ins12 that could make the procedures accessible to a wider public.
Scales
Principal and borderline types Scales are a popular – increasingly popular, it appears – tool of measurement, also in needs assessment. However, the term has two distinct meanings, and plausibly more than two when we look at borderline types that are billed or implicitly understood as scales.
11 Available at https://www.acaps.org/sites/acaps/files/resources/files/severity_and_priority-their_measurement_in_rapid_assessments_august_2013.pdf and https://www.acaps.org/sites/acaps/files/resources/files/composite_measures_of_local_disaster_impact-lessons_from_typhoon_yolanda_philippines_may_2014.pdf , with a demo workbook https://www.acaps.org/sites/acaps/files/resources/files/composite_measures_of_local_disaster_impact-philippines_demodatatset.xlsx . 12 For example, “eirt”, available at https://psychometricon.net/libirt/, handles several models. Version 2.0 was released in 2016, but the documentation (Germain, Valois et al. 2007) has not been updated.
ACAPS Note, Subjective measures in humanitarian analysis, January 2018
45
• In its first version, a “scale” is an ordinal measure that captures the response to one unified stimulus. It maps the choices that respondents make from among ordered alternatives to levels or steps. Statistically, these are recorded as integer numbers, usually starting with 0 or 1. The experimenter or interviewer sets out the alternatives in a single question, possibly together with an introduction before, comments after, and/or a visual aid.
The Cantril Ladder, noted above, is a good example. In fact, we would reduce confusion if everybody referred to this type as ladders. We consider single-stimulus also those instruments that use multiple, yet strictly logically dependent stimuli. The suite of questions “In the past week, was there ever a day when you went without a single meal?” and (if yes) “On how many days did that happen?” exemplifies this situation.
• The second version has spawned a larger literature, but not always much clarity. In this case, the scale is, abstractly, a function that maps the responses to several stimuli to one dimension, preferably metric. The value on this dimension is the scale score. The scale, in the instrumental view, is the set of operations that produce the required responses from each subject. These may be readings off scientific apparatus or, commonly in needs assessments, answers to standardized interview questions or judgments by experts and key informants. The object of a particular question or judgment is a scale item. The questions mostly call for binary, ordered or metric response, but polytomous (unordered categorical) forms are feasible as well provided there is a reasonable function to incorporate them. The administration of multiple items produces one score per subject.
Point systems in medical diagnostics that determine the severity of an affliction are widely used applications of the second scale type. They may be as simple as the count of symptoms observed, or the sum of levels (numbered ranges) in blood concentrations. The paragon of confusion is the Likert Scale (Wikipedia 2011b), or rather its popular use with the legerdemain presupposition that any set of ordered items with the same number of levels is fit to be treated as metric.
• The borderline types are, by definition, inexhaustible, but one type merits special note. It presents as a diagnostic table, with mixtures of quantitative and qualitative elements, some of which are measured while others are inferred or are the result of measurements made at a different (e.g., lower administrative) tier. In needs assessments with a focus on severity, the diagnoses are ordered levels of the same construct of interest. Typically, several quantitative measures are emphasized, with critical ranges at each construct level. The test may return values that place the subject at different levels; to avoid that, a final diagnosis is made in a deliberative process that considers also other information. This “other information” may not be formally scripted into the diagnostic table, yet the assessors agree that it is relevant in the local context.
An excellent example is found in the “IPC Acute Food Insecurity Reference Table for Area Classification” (IPC Global Partners 2012:32). The Table guides assessments of areas at five levels of food insecurity, from minimal stress to outright famine. It specifies critical ranges for two nutritional and two mortality indicators. These measures, plus proportions of households at certain food consumption and livelihood change levels, arrive as statistics
ACAPS Note, Subjective measures in humanitarian analysis, January 2018
46
from household surveys (ibd., 33). These statistics have qualitative admixtures (as in “More than 80% of households in the area are able to meet basic food needs without engaging in atypical strategies to access food and income, and livelihoods are sustainable”). They require complex interpretation (e.g., to what extent are livelihoods sustainable?). The ultimate assignment of a household or an area to one of the five insecurity levels is not the result of a mathematical function, but rather of a deliberative decision. In the IPC case, the inclusion is vertical (area – household). It goes almost without saying that horizontal collaborations are feasible and frequent, such as when sectoral diagnostics are fed into an intersectoral severity measure.
What is subjective about scales? Before discussing version one and two further, we must ask: What is subjective about these measures? If version one (ladders) appears to invite the expression of subjective beliefs, version two (multi-item scales) is intended to make measures more objective, particularly when the scales produce metric scores. Moreover, there is no requirement that the items should be particularly subjective in content or language. For example, rapid assessments of household wealth may ask about the presence of durable items from a list that ranges from the most basic (“Do you have a bed?”) to expensive amenities (“Do you have a car?”); in fact, this has been done in many contexts and is well researched (Filmer and Pritchett 2001, Filmer and Scott 2008). These items can, in theory, be physically ascertained. The subjectivity thus seems reduced to remnants of uncertain language: Does “bed” include matrasses on the bare floor, or only elevated ones? Does “have a car” include “own”, “rented”, “driving for somebody else, with some private use included”? Of course, multi-item scales can include, or entirely consist of, subjective statements, those which the observer and third persons cannot directly verify. Yet, scales are designed to infuse objectivity. Thus, in the case of ladders, subjects are asked to “anchor” some steps, including their own, to comparable reference points. Multi-item scale data are analyzed in order to produce weights for items and scores for subjects, using the entire dataset for the derivation of both. In the process, subjectivity is expected to cancel out.
Objective/subjective vs. global/local That is achieved to variable degrees. Sophisticated validity, reliability and calibration tests have been developed in order to evaluate scales for their ability to reflect constructs and measure concepts. As a result, subjectivity is less of a threatening issue provided such tests are seriously done. What should matter more is the ability to combine global and local knowledge. Global knowledge uses abstract concepts and generalized findings; local knowledge is embedded in empirical and everyday practical knowledge. Disconnects gape along language, social status and technological lines. For scales to harness both kinds, they would have to admit locally variable sets of items. The sets would partially overlap, yet significantly differ from group to group.
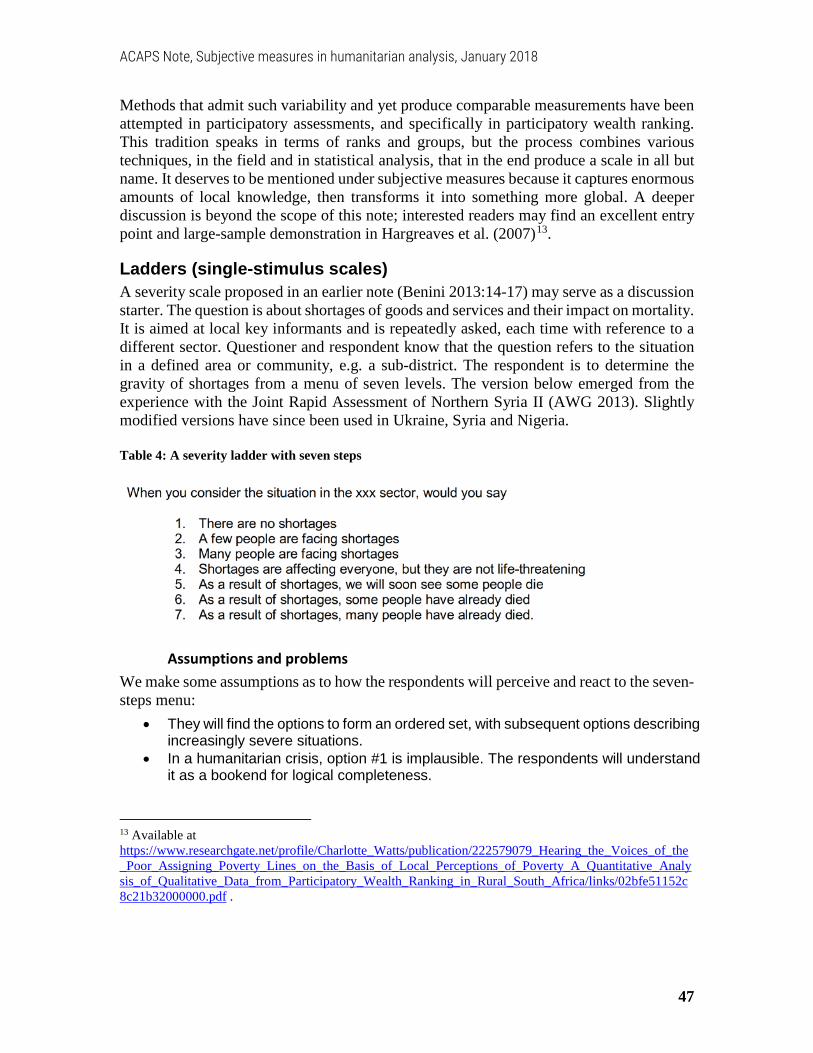
ACAPS Note, Subjective measures in humanitarian analysis, January 2018
47
Methods that admit such variability and yet produce comparable measurements have been attempted in participatory assessments, and specifically in participatory wealth ranking. This tradition speaks in terms of ranks and groups, but the process combines various techniques, in the field and in statistical analysis, that in the end produce a scale in all but name. It deserves to be mentioned under subjective measures because it captures enormous amounts of local knowledge, then transforms it into something more global. A deeper discussion is beyond the scope of this note; interested readers may find an excellent entry point and large-sample demonstration in Hargreaves et al. (2007)13.
Ladders (single-stimulus scales) A severity scale proposed in an earlier note (Benini 2013:14-17) may serve as a discussion starter. The question is about shortages of goods and services and their impact on mortality. It is aimed at local key informants and is repeatedly asked, each time with reference to a different sector. Questioner and respondent know that the question refers to the situation in a defined area or community, e.g. a sub-district. The respondent is to determine the gravity of shortages from a menu of seven levels. The version below emerged from the experience with the Joint Rapid Assessment of Northern Syria II (AWG 2013). Slightly modified versions have since been used in Ukraine, Syria and Nigeria. Table 4: A severity ladder with seven steps
Assumptions and problems We make some assumptions as to how the respondents will perceive and react to the seven-steps menu:
• They will find the options to form an ordered set, with subsequent options describing increasingly severe situations.
• In a humanitarian crisis, option #1 is implausible. The respondents will understand it as a bookend for logical completeness.
13 Available at https://www.researchgate.net/profile/Charlotte_Watts/publication/222579079_Hearing_the_Voices_of_the_Poor_Assigning_Poverty_Lines_on_the_Basis_of_Local_Perceptions_of_Poverty_A_Quantitative_Analysis_of_Qualitative_Data_from_Participatory_Wealth_Ranking_in_Rural_South_Africa/links/02bfe51152c8c21b32000000.pdf .
ACAPS Note, Subjective measures in humanitarian analysis, January 2018
48
• The respondents are able to process three key concepts (“shortages”, “not life-threatening”, “death”).
This severity scale illustrates some of the problems that can beset single-stimulus scales with verbal steps:
• In order to compare the situation in point (e.g., shortages in a given sector) to the steps, the respondent needs to activate varying sets of concepts. In steps #1 through 4, she is asked to judge the prevalence of affected people. In #4 through 7, the timing and extent of extra mortality become the key question. #4 connects the two.
• The wording of the steps uses verbal qualifiers. “None”, “some”, “many”, “everyone” are quantitative modifiers; “will soon” and “have already” are temporal.
• The psychological distances – not surprisingly for an ordinal measure – are unequal. In this example, steps #1 and 2 and steps #4 and 5 are plausibly the farthest apart. The distance between #3 and 4 is short.
• Some of the middle categories are likely to be overused. Here, short of actual or imminent deaths, many respondents may feel that step #4 is a safe bet – one doesn’t want to be seen arguing that the crisis is not affecting everyone.
Reasons for continued use With plenty of complications, why should we use a scale like that at all? There are several reasons to do so:
• The nature of the concept: “Severity”- the concept to measure -, like many other concepts that are difficult to operationalize, has both manifest and dispositional components. Empty store shelves, dry water taps and reported deaths are instances of the former. The known capacity of shortages to cause more damage the longer they last is part of the latter. In other words, respondents understand the order of the seven steps because of a shared understanding of causal mechanisms14.
• Repeated use: The scale is flexible to accommodate several causal mechanisms; in this instance, they are distinguished by humanitarian sectors. Initially, this is more of a problem than a solution. For, it is far from certain that the assessment designers – humanitarian experts or agency personnel – and the local key informants share the same definitions of sectors. They may diverge in their understanding particularly of composite designations such as “non-food items (NFI)” and “water, sanitation and hygiene (WASH)”. Still this problem should be manageable through interviewer training and prescribed introductions. Once sector definitions have been made clear, respondents will be able to understand the scale as the common measurement grid through which to gauge the effects of shortages in every sector.
14 A causal mechanism is a relationship between conditions and outcomes that is “portable and comparable across contexts” (Falleti and Lynch 2009:1145), such as across humanitarian sectors.
ACAPS Note, Subjective measures in humanitarian analysis, January 2018
49
• The best among the worst: Given the causal interest – i.e. asking about shortages as well as the deaths that they cause -, the scale with verbal descriptions of every step ensures some measure of common understanding across respondents. Alternative formulations are even more difficult or make it impossible to interview the same key informants about the same sectors:
o Describing only the end points of the ladder would require obtaining external reference points from every respondent who chooses an intermediate step. This may be impractical.
o Delegating the task to the sectors, with a mandate for each of them to develop its own severity scale, calls for entirely different organizational and conceptual arrangements15.
The above severity scale thus appears to offer a makeshift tool, given the purpose and in the absence of ready alternatives. This takes us back to the usual question: In what respect is it a subjective measure?
Measurement equivalence Almost every element in the language of the question is widely open to personal interpretation, certainly the key concepts and most of the modifiers. But does this have to be so at the group level? Or would the personal differences cancel out in the group averages? Do we obtain sufficient measurement equivalence (Kankaraš, Vermunt et al. 2011, Wikipedia 2017c)? In other words, if two communities objectively are in the same severe condition, will the relevant statistics of the key informant responses (e.g., for ordinal measures like this, the median in each community) be equal?
Translation bias Key to this issue is the question of translation bias. Particularly when the questionnaire is translated from the source language to printed or purely oral versions in different languages, meanings may differ substantially. Some of these differences may go undetected. Researchers place their trust in bi- or multilingual team members to signal, drop or revise problematic elements. But in a methodological test of a cultural measure translated in 14 languages, each controlled by fluent bilinguals, Carter et.al. (2012) found that the subjective reviewers did not flag enough of the problems. For written versions, one should insist on translations, retranslations and comparisons by independent experts. Else, when enumerators translate off the source-language questionnaire, the training must convey not only the language, but also the intent of the questions. For the key terms, a sheet with the appropriate translations to use in the interviews should be handed out.
Multi-item scales Most of the literature on scales discusses this broad type – scales formed of the response to multiple stimuli. Typically, the stimuli are interview questions; the object of a question is known as an item. The idea of the scale is to compute values of the same construct across 15 For an extended case study – severity judgments and persons-in-need estimates in Syria, by the WASH sector – see Benini (2016:34-37).

ACAPS Note, Subjective measures in humanitarian analysis, January 2018
50
subjects and contexts. The degree to which the choice of items, the number and presentation of levels in each item, and the aggregation function achieve that is known as construct validity.
How many constructs does the scale target? The relationship among concepts, constructs and items may be more complex than that. Occasionally, “multi-construct scales” or sets of items reflecting multiple constructs are designed and reported, but such studies vary in intent and method. Some designs may start with a number of concepts of interest, then seek to measure them through constructs. These in turn lead to the selection of items for each of them and the packaging of all into one data collection tool. Other designs may start from the conviction that an available set of items is related to several concepts of interest although in largely unknown ways. Statistical methods such as factor analysis – confirmatory in the first scenario, exploratory in the second – will then be applied in order to clarify the rapport between items and constructs. Exploratory methods may also lead to discoveries of new constructs and hence concepts, such when they reveal additional factors for which researchers find novel interpretations.
One-construct scales Multi-construct scales are not the focus of our discussion. Typically, a scale incorporates multiple items and produces values of one construct. Three characteristics follow:
• The construct expresses the parent concept quantitatively. There is an underlying continuum (as opposed to merely qualitative types, ordered or unordered).
• Each item contributes in some way to the resulting value on the continuum, known as the scale score.
• To obtain the score, the items are analyzed together.
Good items Regardless of the score mechanics, items to be used in interviews with laypersons follow some basic rules:
• The language must be compatible with the study population. • Each item should be short and simple. • It must make sense to respondents. • The response categories must be unambiguous. • The treatment of the response (incl. rules for missing response) as part of the scale
score must be clear and valid16. Items formulated for experts may use more complex domain language, provided the researcher is reasonably certain that all experts canvassed will understand terms identically. Items are ideally developed with many more candidates than will eventually go into the
16 Following in part Hunt and McEven (1980:238); their rule that “scoring must be relatively easy” is not appropriate for all kinds of scales, and certainly not for scales under Item Response Theory (De Ayala 2009). Clarity and validity, however, are legitimate requirements throughout.

ACAPS Note, Subjective measures in humanitarian analysis, January 2018
51
final scale. Consultation with experts, cognitive interviews with members of the target population (who explain how they understand each candidate question), focus groups, interviewer training, pre-tests and, for handsomely resourced projects, statistical analysis of pilot survey data will successively reduce the item pool. These steps are particularly important for the conceptual and technical aspects of subjective measures, about which initially there may be only weak clarity and consensus. This note cannot replace a textbook on scale development, but two more challenges to item scales need to be noted.
Halo and conformity effects First, scales with items all of which have the same response categories – such as from “strongly disagree” to “strongly agree” - may invite bias. They easily produce what is known as the “halo effect”. “Since items are frequently ordered in a single column on a page it is possible to rapidly rate all items on the basis of a global impression, paying little attention to the individual categories” (Streiner, Norman et al. 2015:54). The interviewer rattles down the items; and the respondent, assuming she can make herself heard at all, feels safer in quickly repeating the response given to the preceding item. Social conformity bias can take other forms. Under the watchful eye of byestanders, the responsent may answer most item questions with one of the extreme categories if that is the perceived expectation, or, if the signals from interviewers and third persons are ambiguous, find safety in the least committal central category. Since the interviewer teams operate without constant supervision, there is little that can be done about this. Preventively, designers can sensitize interviewers during training and pretest, redistribute the item questions to different sections of the questionnnaire (if it makes sense) or, more radically, change the type of question. This is sometimes done by moving from rating to ranking, in hopes that ranking forces respondents into clear and conscious choices. But not all constructs lend themselves to translation into coherent multiple ranking questions.
Measurement level of the items vs. of the scale Lastly, we must warn that the issue of measurement level never goes away completely. The ambition of the scale designers is to obtain a measure at interval or ratio scale level. The item scores are, in most scales, nominal or ordinal. The various persuasions as to whether they can or cannot be aggregated to a higher level measure have almost become articles of faith. The controversy has been keenest about the so-called Likert scale (Wikipedia 2011b). “Likert scales are bipolar .. . The descriptors most often tap agreement (Strongly agree to Strongly disagree), but it is possible to construct a Likert scale measuring almost any attribute, such as acceptance (Most agreeable–Least agreeable), similarity (Most like me–Least like me), or probability (Most likely–Least likely)” (Streiner et al., op.cit.:44). Thus

ACAPS Note, Subjective measures in humanitarian analysis, January 2018
52
each item forms an ordinal sub-scale; the controversy is about whether and how the items can be aggregated to a scale with interval property. Humanitarian analysts will not want to become embroiled; good advice is to limit oneself to Likert scales that have been validated elsewhere. Certain Item Response Theory models do offer valid transformations to interval-level scores (Wikipedia 2016), but robust scores may require relatively large samples and, conversely, modest numbers of items. Moreover, these methods belong in the hands of trained statisticians. Without that support, analysts will be safe if they respect the types of statistical operations that are legitimate at given measurement levels.
When designing multi-item scales Pragmatically, when assessment designers consider introducing a multi-item scale, they should ask themselves these questions:
• Have these items been used in previous research relevant to the current task? In other words, is there an already validated scale with interval properties that can be adopted with minor adjustments? Or at least one with reported distributions for items and overall scores?
• If there is no precedent, and the scale is being developed from scratch: o Is the variety of items sufficient to cover essential facets of the concepts? o Do all items speak to the same concept? o For each item: Is the equidistance assumption – e.g., the difference between
“not important at all” and “somewhat important” is the same as between “somewhat important” and “very important” with three response options – reasonable?
o If not, can the categories for each item be meaningfully transformed prior to aggregation? The transformation could be data-driven or manual and arbitrary except for a solid reason to modify the equidistance assmumption. For example, for a particular item, you could assign “not important at all” 0, “somewhat important” 1, “very important” 3 (Experts could be asked to propose such category weights, potentially different for each items).
• Will we be able to conduct a pretest with a sufficiently large sample in order to at least superficially ascertain that the items and the scale behave as expected? Will we have the support, time and logistics to adapt the questionnaire (and interviewer training)?
The last of the bullet points is the most important. All instruments need testing; test have value only if remedial action follows.
ACAPS Note, Subjective measures in humanitarian analysis, January 2018
53
Case study: The Humanitarian Emergency Settings Perceived Needs Scale (HESPER) The HESPER Scale was developed by Maya Semrau, King’s College London, in collaboration with the World Health Organization between 2008 and 2011 (WHO and King’s College London 2011, Semrau 2013). The scale measures perceived needs, a subjective state, in humanitarian emergencies. It helps assess needs of affected populations through representative samples and does so in a valid, reliable and rapid manner. While focused on universal needs, it can be adapted to local circumstances. The basic part of the scale consists of 26 dichotomous items. Each item singles out an area of need that, if unmet, can create a “serious problem”. For example, item # 1 is about drinking water; the interviewer enquires: “Do you have a serious problem because you do not have enough water that is safe for drinking or cooking?” Twenty-one of the items are about the personal situation of the respondent; five bring up problems in the community. Thus item #22 has the respondent formulate an opinion about law and justice: “Is there a serious problem in your community because of an inadequate system for law and justice, or because people do not know enough about their legal rights?” In addition, respondents may raise other serious problems that they do not find covered by the standard items: “Do you have any other serious problems that I have not yet asked you about?” After answering those questions, the respondent is read a list of the all serious problems that he/she selected and is asked to designate the three that are the most serious, second and third most serious. Thus, not counting the additional serious problems that respondents may raise, the scale generates 26 ratings and 3 rankings. The measures of interest are:
• The prevalence of a given need, as the percentage of respondents who rated it as serious
• The priority of a given need, as the percentage of respondents who designated the need as one of their three most serious problems
• The total number of serious problems in a respondent The first two have an intuitive policy relevance, particularly when they are broken down by sub-populations. The practical purpose of the third is not obvious. The instructions do call for statistics of this variable (WHO et al., op.cit., 29), but it is not used as the respondents’ individual scores on any substantive measure. Semrau developed the HESPER Scale on the basis of the Camberwell Assessment of Need Short Appraisal Schedule (CANSAS) (Slade, Thornicroft et al. 1999) and tested it extensively. She developed the items through a literature review and an expert survey. She pilot-tested the scale in Jordan, Gaza, Sudan and with refugees in the United Kingdom. She field-tested local-language versions in Jordan, Haiti and Nepal; these tests allowed her to assess the scale’s psychometric properties.

ACAPS Note, Subjective measures in humanitarian analysis, January 2018
54
The psychometric qualities of the scale are excellent. Some are of general interest and therefore noted here:
• Some sub-samples were re-interviewed after a week. The comparison of the response produced a statistic known as the “test-retest reliability”, with a very high 0.96 in Jordan and a satisfactory 0.77 in Nepal.
• In other sub-samples, a second enumerator sat in. He/she would silently take notes. Comparing the two sets of item reponse produced the “inter-rater reliability”, with values around 0.99 in all three field tests.
• Some respondents underwent a test using an additional instrument that had been validated in multiple other contexts. The correlations on selected items on both instruments were significant, establishing “concurrent validity”17.
The major strength of the HESPER scale lies in measuring the relative importance of the various unmet needs. In other words, the interest is in the items, not the respondents’ scores. In fact, no attempt is made to express the “neediness” of the respondents by the number of items (“serious problems”) that they affirmed. It is easy to see why – even if we forget the challenge of weighting the items and of finding an appropriate aggregation function. The probability for a respondent to affirm an item is influenced not only by her “objective” need, but also by general psychological dispositions such as anxiety, the baseline for “serious” or expectations to qualify for assistance. These person-level influences likely cancel out in as far as the the relative importance of items in the sample is concerned. But they invalidate the use of respondent-specific scores to measure overall neediness. Accordingly, there is no “HESPER score”. As noted, the HESPER Scale comes in two parts, with 27 rating questions (“Is XY need area a serious problem for you?”) and three ranking questions (“Among those serious problems, which is the first, second, third most important?”). The relationship between rating measures, such as those used to express severity, and ranking measures, used to force choices on priorities, is a recurrent analytic challenge in needs assessments. Following Roszkowski and Spreat (2012), Benini (2013:8-9, 36-41) tabulates the pros and cons of rating and ranking measures and simulates correlation strength expected under reasonable assumptions. One should “expect significant yet modest correlations between the (rated) severity and the (ranked) priority of a given need” (ibd., 8). The HESPER Scale field test data provide a welcome empirical illustration. We use data from a Jordan sample.
17 See WHO, op.cit., 18 and Semrau, op.cit., 210-214 for details.
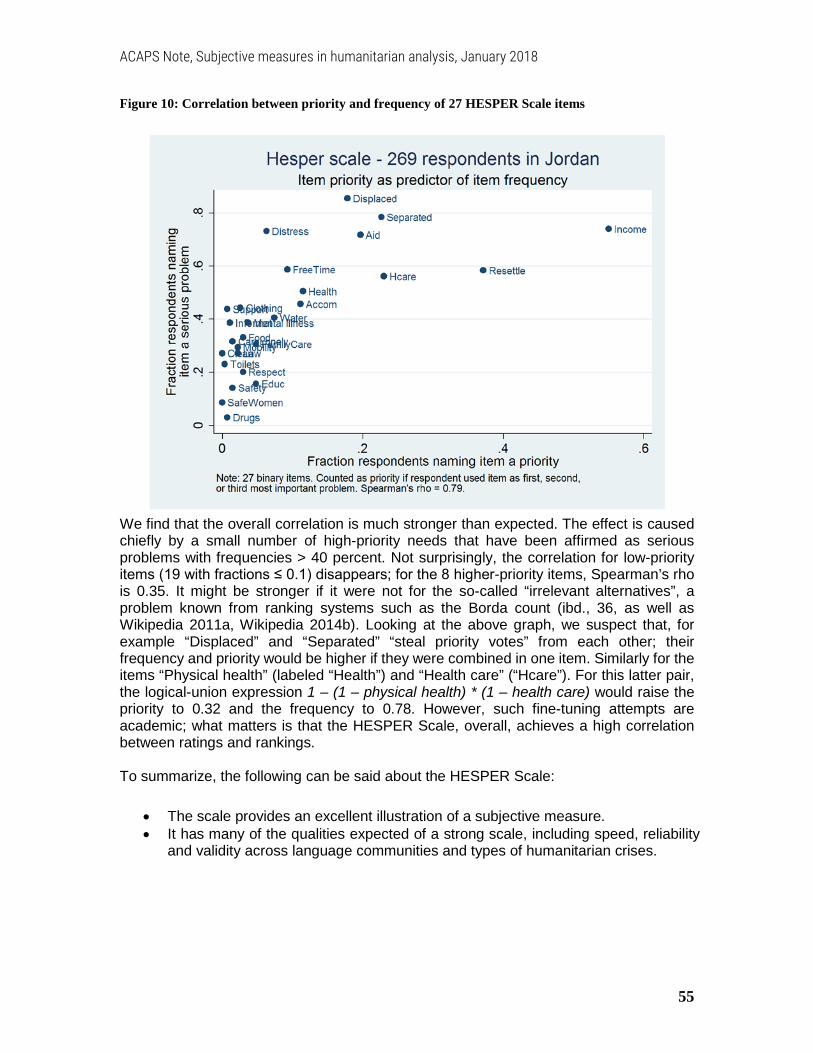
ACAPS Note, Subjective measures in humanitarian analysis, January 2018
55
Figure 10: Correlation between priority and frequency of 27 HESPER Scale items
We find that the overall correlation is much stronger than expected. The effect is caused chiefly by a small number of high-priority needs that have been affirmed as serious problems with frequencies > 40 percent. Not surprisingly, the correlation for low-priority items (19 with fractions ≤ 0.1) disappears; for the 8 higher-priority items, Spearman’s rho is 0.35. It might be stronger if it were not for the so-called “irrelevant alternatives”, a problem known from ranking systems such as the Borda count (ibd., 36, as well as Wikipedia 2011a, Wikipedia 2014b). Looking at the above graph, we suspect that, for example “Displaced” and “Separated” “steal priority votes” from each other; their frequency and priority would be higher if they were combined in one item. Similarly for the items “Physical health” (labeled “Health”) and “Health care” (“Hcare”). For this latter pair, the logical-union expression 1 – (1 – physical health) * (1 – health care) would raise the priority to 0.32 and the frequency to 0.78. However, such fine-tuning attempts are academic; what matters is that the HESPER Scale, overall, achieves a high correlation between ratings and rankings. To summarize, the following can be said about the HESPER Scale:
• The scale provides an excellent illustration of a subjective measure. • It has many of the qualities expected of a strong scale, including speed, reliability
and validity across language communities and types of humanitarian crises.

ACAPS Note, Subjective measures in humanitarian analysis, January 2018
56
• Its development took several years of work by the same dedicated researcher, with assistance from multiple experts, with a solid theoretical foundation and extensive testing across diverse contexts.
• It renders population-level estimates of intensity and priority in a wide spectrum of unmet needs. It does not produce actionable individual-level scores.
• The conceptual demands on trainers, interviewers, respondents and analysts are modest and manageable. The data can be analyzed with the means of a spreadsheet program.
Those advantages make the HESPER Scale a tried-and-tested, ready-to-go member of the assessment designer’s toolbox. The manual (WHO, op.cit.) is lucid and complete for self-starters. For students of subjective measures in general, it reminds us of the values of simplicity, careful testing and well-defined objectives. In particular, designers have to be clear whether their scale is to supply statistics about items (e.g., indicator weights, factor loadings) or measures on individual respondents (e.g., factor scores) or both.
Vignettes Vignettes are devices for improving the comparability of subjective measures across respondents and social groups. The full analytic apparatus is challenging. In this section, we demonstrate a modest approach at the reach of the Excel-using humanitarian analyst.
Motivation The response to subjective questions may, and often does, yield bias when interviewer and respondents understand the meanings of a question (or of some or all of the response categories) differently. Bias occurs also when these understandings differ across respondents, individually or by socio-economic, cultural or language group. Survey methodologists have long recognized the incomparability of individual answers as a problem, under various terms such as “differential item functioning” (DIF) in educational testing. In 2004, researchers at Harvard and the World Health Organization developed an interview device and a statistical analysis method known as “anchoring vignettes”, intended to improve comparability (King, Murray et al. 2004). Subsequently, King and associates developed specialized software for the unbiased estimation of vignette data (Wand, King et al. 2011, Wand and King 2016). Gary King’s Web site provides an inventory of vignette scales from a wide range of health and political science topics, as well as an extensive methodological FAQ18.
Case study: Objective and subjective welfare in Tajikistan We leave estimation techniques to the statistically minded readers and focus on the conceptual side in the context of subjective measures. To illustrate, we turn to an exemplary study that gauges a subjective measure by an objective one. Beegle et al. (Beegle, Himelein 18 https://gking.harvard.edu/vign

ACAPS Note, Subjective measures in humanitarian analysis, January 2018
57
et al. 2012) compared subjective economic welfare ranks to expenditure per capita in a sample of 4,771 households in Tadjikistan. The data are from the Tajikistan Living Standards Survey 2007. The respondents were asked to place their households’ position in terms of rich vs. poor on a six-step Cantril ladder (see above). These self-assessments were then contrasted to six ordered expenditure ranges, the objective measure. Table 5: Correlation between subjective and objective welfare ranks
Source: Beegle, et al., op.cit.: 560, Table 4: Comparison of pre-vignette subjective welfare with objective measure. The authors point out: “If the subjective measures are perfectly explained by the objective measure, all observations in the matrix would be along the [framed, AB] diagonal. Though the subjective measures are highly correlated with the objective measure, the matching is imperfect. Nearly half (43 percent) of those in the lowest objective classification place themselves on steps 3 or higher in the subjective measure” (ibd.). Similarly, the majority of the households at the highest two expenditure ranks placed themselves subjectively lower by two or more steps. Similar levels of discrepancy appear when we read the table in the other direction, looking at the objective rank for a given subjective rank. Both ways, this appears, in this population, to be chiefly a problem with the extreme categories. But this cannot always be taken for granted for all populations; it could affect all categories. In order to better control for the heterogeneous understandings of welfare ranks, Beegle et al. asked their respondents to work with the six-step Cantril ladder through three rounds. In the first, the respondents placed themselves on the ladder, indicating their family welfare rank. In the second, they were exposed to descriptions of four hypothetical families (the vignettes). They placed the families on a fresh ladder (i.e., without being influenced by their earlier self-assessment). In the third round, the respondents placed themselves on the same ladder, either on the same step with one of the hypothetical families, or on a step above, between or below not taken by any of the four.
Four vignettes The four hypothetical families were described as follows:
Subjective welfare rank
Expenditure per capita rank Total
1 poorest 2 3 4 5 6 richest1 poorest 84 120 108 26 3 0 3412 109 461 586 137 8 1 1,3023 130 582 1,184 345 29 5 2,2754 18 135 369 227 23 4 7765 0 3 25 36 3 0 676 richest 0 1 3 5 1 0 10Total 341 1,302 2,275 776 67 10 4,771

ACAPS Note, Subjective measures in humanitarian analysis, January 2018
58
Vignette 1: Family A can only afford to eat meat on very special occasions. During
the winter months, they are able to partially heat only one room of their home. They cannot afford for children to complete their secondary education because the children must work to help support the family. When the children are able to attend school, they must go in old clothing and worn shoes. There is not enough warm clothing for the family during cold months. The family does not own any farmland, only their household vegetable plot.
Vignette 2: Family B can afford to eat meat only once or twice a week. During winter months, they can heat several rooms, but not the entire house. They cannot afford for all their children to complete secondary education. Their clothing is sufficiently warm, but they own only simple garments. In addition to their household vegetable plot, they own a small plot of poor quality farmland that is distant from their home.
Vignette 3: Family C can afford to eat meat everyday. During the winter months, generally they are able to keep their home warm. They can afford for all their children to complete secondary education. They have sufficient clothing to keep warm in the winter. Their everyday clothing is simple, but they also have some fancy items for special occasions. In addition to their household vegetable plot, they have a larger plot of good quality farmland, not too distant from their home.
Vignette 4: Family D can afford to eat whichever foods they would like, including sweets and imported food. During the winter months, they have no problems with heating and are able to keep their entire house warm. They can afford for all of their children to complete their education, and then to continue at a local university. They are able to afford a variety of fancy traditional clothes and also imported brand clothing. The family owns property, including a good car. The family also has a large farm and acts as landlord to others in their area.
Source: op.cit., 569. Notice that all wealth indicators (nutrition, heating, children’s education, etc.) are strictly ascending from vignette #1 to #4, in order to avoid multi-dimensionality and confusion (op.cit., 559).
The procedure To depict the procedure visually, we created this schematic. It invents four respondents and their assessments over the three rounds. The usual definitions of the Cantril ladder apply, with the bottom rung reserved for the poorest, the top for the richest. A, B, C and D in the second and third round refer to the vignette families above.

ACAPS Note, Subjective measures in humanitarian analysis, January 2018
59
Figure 11: Vignettes in the interview procedure
Several observations stand out:
• Round 1 is unproblematic in the sense that every respondent decided to associate his/her family situation with some step of the ladder. The individual understanding of the steps remains hidden.
• In round 2, three of the four respondents placed the vignettes in the expected sequence, that is: A, B, C, D ascendingly. Respondent #4 misunderstood either the wealth difference between A and B or the concept of the ladder19.
19 In Beegle et al.’s sample, less than 2 percent of the respondents ordered the vignettes incorrectly. “The most common characteristic of respondents who perversely order the vignettes is a low level of education of the household head” (op.cit., 559). These cases were excluded from the analysis.
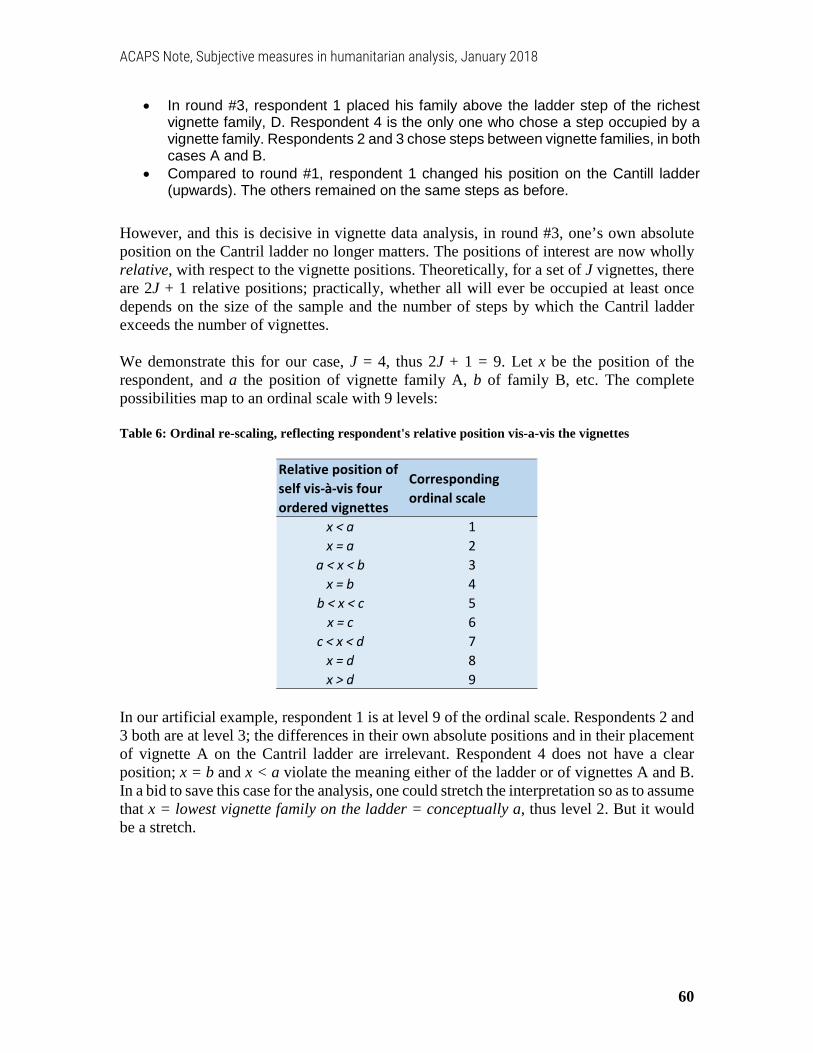
ACAPS Note, Subjective measures in humanitarian analysis, January 2018
60
• In round #3, respondent 1 placed his family above the ladder step of the richest vignette family, D. Respondent 4 is the only one who chose a step occupied by a vignette family. Respondents 2 and 3 chose steps between vignette families, in both cases A and B.
• Compared to round #1, respondent 1 changed his position on the Cantill ladder (upwards). The others remained on the same steps as before.
However, and this is decisive in vignette data analysis, in round #3, one’s own absolute position on the Cantril ladder no longer matters. The positions of interest are now wholly relative, with respect to the vignette positions. Theoretically, for a set of J vignettes, there are 2J + 1 relative positions; practically, whether all will ever be occupied at least once depends on the size of the sample and the number of steps by which the Cantril ladder exceeds the number of vignettes. We demonstrate this for our case, J = 4, thus 2J + 1 = 9. Let x be the position of the respondent, and a the position of vignette family A, b of family B, etc. The complete possibilities map to an ordinal scale with 9 levels: Table 6: Ordinal re-scaling, reflecting respondent's relative position vis-a-vis the vignettes
In our artificial example, respondent 1 is at level 9 of the ordinal scale. Respondents 2 and 3 both are at level 3; the differences in their own absolute positions and in their placement of vignette A on the Cantril ladder are irrelevant. Respondent 4 does not have a clear position; x = b and x < a violate the meaning either of the ladder or of vignettes A and B. In a bid to save this case for the analysis, one could stretch the interpretation so as to assume that x = lowest vignette family on the ladder = conceptually a, thus level 2. But it would be a stretch.
Relative position of self vis-à-vis four ordered vignettes
Corresponding ordinal scale
x < a 1x = a 2
a < x < b 3x = b 4
b < x < c 5x = c 6
c < x < d 7x = d 8x > d 9

ACAPS Note, Subjective measures in humanitarian analysis, January 2018
61
Analyzing vignette data The re-scaling of the respondent’s welfare rank, according to the relative position of the round #3 self-assessment vis-à-vis the vignettes, is the key operation in analyzing vignette-supported subjective measures (King, Murray et al. 2004, Wand, King et al. 2011, Beegle, Himelein et al. 2012, op.cit.: 564, Test 3).
Descriptive statistics The descriptive analysis will pursue different types of statistics for the three rounds. There will be J + 2 variables needed in the database to store the absolute positions on the Cantril ladder: two for the respondent (self-assessed positions in round #1 and #3) as well as J variables to hold the positions that the respondent assigned to the J vignettes. Once those data have been entered, some of the statistics will be trivial to calculate; others are trickier.
• There may be mild interest in comparing how the respondents changed their Cantril ladder positions between round #1 and #3, before and after hearing (or reading) the vignettes.
• Similarly, the variations of vignette placements in round #2 may give non-trivial indications of how much the respondents’ understandings of the distances on the underlying dimension (e.g., from poor to rich) differ.
Both investigations can be done with cross-tabulations (Pivot tables in Excel); for vignette placements, tabulating the Cantril ladder positions of adjacent vignettes may be meaningful, i.e. of A vs. B, B vs. C., etc.
• The re-scaling – the calculation of the respondents’ round #3 self-assessments relative to the vignettes - is the most difficult step. It is also the most important, ultimately supplying (supposedly) bias-free comparable self-assessments.
Remember, what we have at the outset of this calculation are, for each respondent, the Cantril ladder positions of the vignettes (they were created in round #2 and remain the same in round #3) as well as the round #3 self-assessment. We assume that the respondent placed the vignettes consistently, a < b < c < d (etc. if more than four vignettes). Suppose the variables are called Cantril_x for self-assessed position, and Cantril_A, Cantril_B, etc. for the vignettes. The table below holds the data on the four respondents plus several more examples.
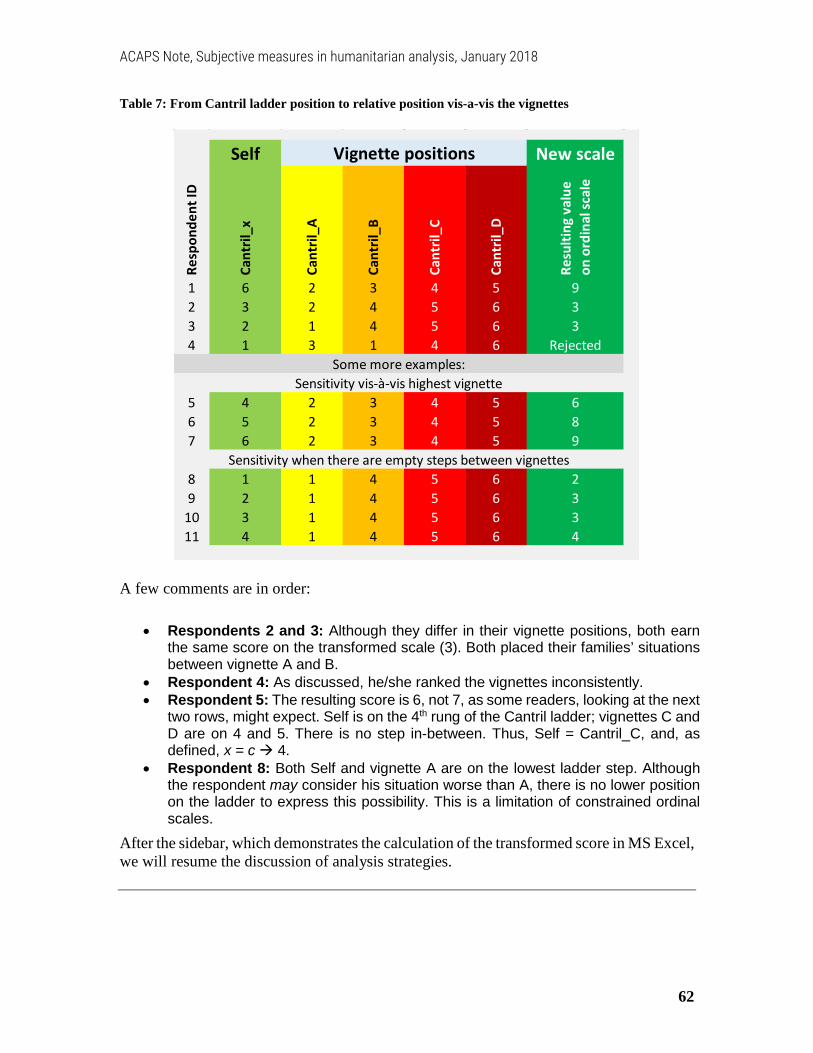
ACAPS Note, Subjective measures in humanitarian analysis, January 2018
62
Table 7: From Cantril ladder position to relative position vis-a-vis the vignettes
A few comments are in order:
• Respondents 2 and 3: Although they differ in their vignette positions, both earn the same score on the transformed scale (3). Both placed their families’ situations between vignette A and B.
• Respondent 4: As discussed, he/she ranked the vignettes inconsistently. • Respondent 5: The resulting score is 6, not 7, as some readers, looking at the next
two rows, might expect. Self is on the 4th rung of the Cantril ladder; vignettes C and D are on 4 and 5. There is no step in-between. Thus, Self = Cantril_C, and, as defined, x = c 4.
• Respondent 8: Both Self and vignette A are on the lowest ladder step. Although the respondent may consider his situation worse than A, there is no lower position on the ladder to express this possibility. This is a limitation of constrained ordinal scales.
After the sidebar, which demonstrates the calculation of the transformed score in MS Excel, we will resume the discussion of analysis strategies.
Self New scale
Resp
onde
nt ID
Cant
ril_x
Cant
ril_A
Cant
ril_B
Cant
ril_C
Cant
ril_D
Resu
lting
val
ue
on o
rdin
al sc
ale
1 6 2 3 4 5 92 3 2 4 5 6 33 2 1 4 5 6 34 1 3 1 4 6 Rejected
5 4 2 3 4 5 66 5 2 3 4 5 87 6 2 3 4 5 9
8 1 1 4 5 6 29 2 1 4 5 6 3
10 3 1 4 5 6 311 4 1 4 5 6 4
Some more examples:Sensitivity vis-à-vis highest vignette
Sensitivity when there are empty steps between vignettes
Vignette positions

ACAPS Note, Subjective measures in humanitarian analysis, January 2018
63
[Sidebar:] Calculating the transformed scores in Excel As shown above, we assume that the relevant data are held in variables called Cantril_x for the self-assessed positions in round #3, and Cantril_A, Cantril_B, etc. for the vignette positions. In order to calculate the scores on the transformed scale (the relative positions vis-à-vis the vignettes in Excel), analysts will need to take the following steps:
1. Insert a blank column to the left of Cantril_A. Insert a column to the right of every Cantril_A, _B, _C, etc. field. These blank columns hold, for J vignettes, J + 1 auxiliary variables. Name them CantrilAux_0, CantrilAux_1, etc., CantrilAux_J.
2. Calculate the auxiliary variables as follows:
CantrilAuxil_0 = 0 CantrilAuxil_1 = Cantril_A + 0.5 CantrilAuxil_2 = Cantril_B + 0.5 Etc. CantrilAuxil_J = Cantril_Last + 0.5 [in our example with four vignettes, this
gives: CantrilAuxil_4 = Cantril_D + 0.5]
As a result, in each row the values across the columns from Cantril_Auxil_0 to Cantril_Auxil_J form a strictly increasing sequence. Since ranks are expressed in integer numbers, it is obvious that the value of the shift (+0.5) is chosen for aesthetic reasons; any real number d, 0 < d < 1, would do the job, i.e. produce a number between adjacent integers.
3. In each row, within that sequence, the position of the value that is equal to the self-
assessed Cantril_x value or is the next lower value to it defines the transformed score. In Excel, this position is calculated with the function MATCH(lookup_value, lookup_array, [match_type]). If Cantril_x is in column 2 of your spreadsheet, and the sequences in columns 3 to 11, use the formula:
=MATCH(RC2,RC3:RC11,1)
as in the table below. Else adjust the references to the lookup value and lookup array. The match type is always 1 (see the Excel Help for this function).
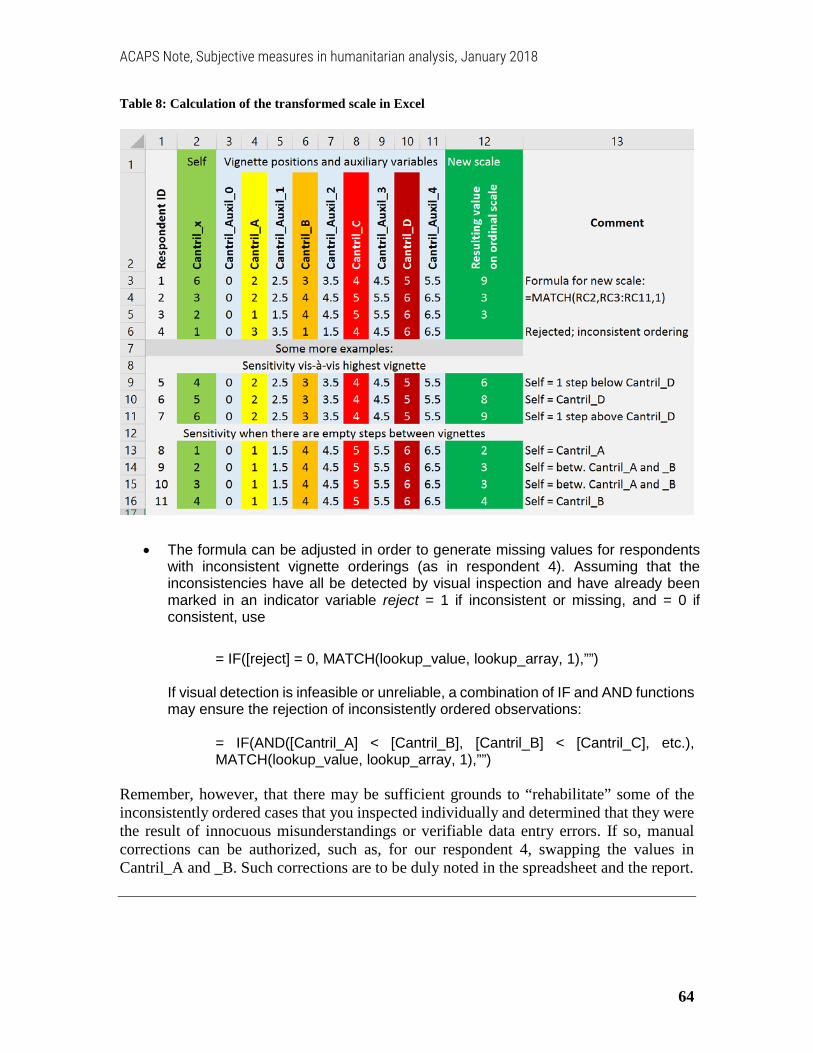
ACAPS Note, Subjective measures in humanitarian analysis, January 2018
64
Table 8: Calculation of the transformed scale in Excel
• The formula can be adjusted in order to generate missing values for respondents with inconsistent vignette orderings (as in respondent 4). Assuming that the inconsistencies have all be detected by visual inspection and have already been marked in an indicator variable reject = 1 if inconsistent or missing, and = 0 if consistent, use
= IF([reject] = 0, MATCH(lookup_value, lookup_array, 1),””)
If visual detection is infeasible or unreliable, a combination of IF and AND functions may ensure the rejection of inconsistently ordered observations:
= IF(AND([Cantril_A] < [Cantril_B], [Cantril_B] < [Cantril_C], etc.), MATCH(lookup_value, lookup_array, 1),””)
Remember, however, that there may be sufficient grounds to “rehabilitate” some of the inconsistently ordered cases that you inspected individually and determined that they were the result of innocuous misunderstandings or verifiable data entry errors. If so, manual corrections can be authorized, such as, for our respondent 4, swapping the values in Cantril_A and _B. Such corrections are to be duly noted in the spreadsheet and the report.
ACAPS Note, Subjective measures in humanitarian analysis, January 2018
65
Association with other variables The re-scaled subjective measure, such as the subjective welfare score, will then be tabulated. Rare values may be combined with adjacent ones in a new variable that denotes a broader category if this suits the analytic interest. Of greater interest is the association of the measure with other variables, particularly those that are considered its “objective” counterparts. Frequently, subjective welfare rankings are contrasted to the households’ monthly or yearly per-capita (or per adult equivalent) expenditures. The correlations often are not very strong. This is expected, and not only because of the inherent uncertainty and “coarse resolution” of the subjective measure and the error in the objective measure. The rationale for the subjective measure is that it expresses more than just one indicator; indeed, that it reflects a well-rounded understanding. If effective, this very rationale lets us expect modest, yet still significant correlations.
Analytical statistics Cross-tabulations between the re-scaled subjective measure and variables of interest are the departure point also for analytic statistics – probabilistic models that investigate such associations under the assumption that the sample is from a (potentially infinite) population, and all statistics therefore come with sampling variance. We touch briefly on them. Two analytic interests dominate with vignette data:
• First, one likes to understand how a multitude of factors jointly influence the subjective measure. Household expenditure per capita, family size, gender and education of the household head, geographic or administrative location, history or risks of disaster impacts are candidates. What are their effects on the reported self-assessments? The standard procedure, traditionally, would be the ordered probit model (Wikipedia 2017d), the interpretation of its coefficients and the estimates of the so-called cut-points between levels of the re-scaled measure. Most statistical software includes this procedure. The learning curve for the user familiar with the basic software is modest.
• Second, one would like to promote the subjective measure to a higher than ordinal level, ideally an unbounded and continuous interval level. This level, in combination with other measures, would open the door to more sophisticated analyses of poverty, deprivations, risks, etc. Obviously, such a measure has not been reported; it needs to be estimated jointly from the vignette positions, self-assessments and respondent characteristics. One possibility is to calculate the so-called “linear prediction” of the probability20 to self-assess in the lower levels of the rescaled measure (understood, e.g., as very poor or poor). Depending on the research interest, the probability of self-assessing at the top (e.g., rich or very rich) may be more relevant.
20 The linear prediction of a probability estimated in a regression model is the linear combination of predictors (independent variables) and the regression coefficients, including the intercept. It determines the predicted
ACAPS Note, Subjective measures in humanitarian analysis, January 2018
66
We will reproduce an illustration below that makes this second point a bit more intuitive. Here, the difficulty of the learning curve must be noted. For arcane technical reasons, the ordered probit model can lead to biased estimates. An improved estimator was proposed in 2004 (King, Murray et al. 2004) and translated into accessible software some years later (Wand, King et al. 2011, Wand and King 2016). However, the learning curve is steeper. Statistically interested analysts will want to evaluate the benefits (unbiased estimates) together with the costs (learning and testing effort)21. In part, that evaluation has been done for us by Beegle et al. (op.cit., 568):
“A frame-of-reference effect on subjective welfare is evident in our findings; people with different socioeconomic backgrounds use systematically different scales in responding to questions on their welfare. ... In particular, we find that poorer households tend to have narrower range in the thresholds used in identifying where they lie and where the vignettes lie on the subjective welfare ladder. ... However, our results do not suggest that this is an important source of bias in past efforts to model the objective determinants of subjective welfare.”
The graph below makes the same point.
probability of the outcome (e.g., self-assessment = very poor) via the probability distribution of the regression model, e.g. the cumulative standard normal distribution in a probit regression. 21 The model summary in King, Murray et al. (2004, op.cit.: 198, Figure 4), and its more extensive exposition in the text, available at https://dash.harvard.edu/bitstream/handle/1/3965182/King_EnhancingtheValidity.pdf , are a good starting point. Wand, King et al. wrote the “Anchors” software in the statistical application R; Stata programs that perform some of its functions are available (Rabe-Hesketh and Skrondal 2002, Jones, Rice et al. 2013).

ACAPS Note, Subjective measures in humanitarian analysis, January 2018
67
Figure 12: Probability of self-assessing as rich or poor as a function of per-capita consumption
In fact, in their Tadjikistan sample, the probability for households to report themselves as rich or poor was virtually unaffected by the rescaling of one’s position relative to the vignettes. Only half of the de-facto rich households would call themselves rich; almost one in five tried to pass as poor (why? perhaps – we speculate – because in the eyes of many respondents the reference-rich in that country were the few super-rich public figures). The self-assessments of the poor were more in line with the economic gradient, with over 80 percent of the lowest per-capita consumption households reporting as poor. Thence the proportion drops steadily across most of the observed consumption range. The curves are virtually identical with and without re-scaling.
For and against vignettes
A supportive study One might take these findings to suggest that vignettes are superfluous, a useless burden on the survey economy. However, this conclusion should not be drawn for all countries and all sectors. For a study strongly arguing in favor of vignettes, we look at the work of Dasgupta (2014) in India. From a large, nationally representative health survey, she demonstrated that the use of vignettes was helpful in reducing bias in self-reported health. This study is particularly compelling in that for each respondent objective indicators were taken (height, weight, grip strength, lung capacity, blood pressure, pulse rate); a series of

ACAPS Note, Subjective measures in humanitarian analysis, January 2018
68
performance tests were also administered. Vignette sets were designed in several health areas – mobility and affect, pain and personal relationships, sleep and energy, cognition and self-care. Each questionnaire would include one set only; thus each set was presented to a quarter of the sample. The effective sample size with complete health information was a stunning 10,873 individuals. The ultimate goal was to evaluate whether vignette-supported self-reported measures in the various health areas would be reasonably bias-free. If so, they would be suitable as quick measures in future surveys without necessitating expensive medical examination surveys. Dasgupta concludes:
“The current evidence indicates that self-reported measures of health cannot be directly compared across population sub-groups, because groups differ in how they use subjective response categories. The problem is further complicated as this systematic variation cannot be accounted for by just including the socio-economic characteristics in a typical regression framework. The challenge is to develop alternative strategies to account for the subjective variation in health perception in its various domains and to make possible greater comparability between distinct socio-economic groups. This analysis lends support to the use of vignettes data to use them to extract information on reporting behavior and identify the bias in [self-assessed health] data to improve comparability of existing household surveys in a developing country setting” (ibd., 27).
Vignettes or no vignettes – that is the question The two studies that we summarized in the preceding paragraphs – household poverty in Tadjikistan, personal health in India – come to opposite conclusions. Others confirm the benefits of vignettes, but point to the costs, both direct and indirect. Granberg-Rademacker (2009) evaluates vignettes as one of several methods to convert ordinal data to interval or ratio scales and finds that they have two practical downsides:
• “The first is that placing vignettes in surveys takes up space (on paper) and/or time (when questioning respondents vocally), both of which are scarce commodities for survey researchers. ..
• The other practical problem with [anchoring vignettes] is that there may frequently be instances where vignette responses are not available in secondary datasets collected by other researchers, institutions, or government agencies. So although [vignettes] have many possible advantages and applications in some fields of social science, these benefits may only be available on a limited basis until the use of vignettes becomes more mainstream across disciplines” (ibd., 81).
Grol-Prokopczyk et.al. (2015) are wary of vignettes for different reasons. They investigate their use in health surveys and find

ACAPS Note, Subjective measures in humanitarian analysis, January 2018
69
“substantial violations of vignette equivalence both cross-nationally and across socioeconomic groups. That is, members of different sociocultural groups appear to interpret vignettes as depicting fundamentally different levels of health. The evaluated anchoring vignettes do not fulfill their promise of providing interpersonally comparable measures of health” (ibd. 1703).
They advise researchers to attend
“closely to details of wording may be the key to improving the validity of future vignettes. Despite the great importance of vignettes that accurately capture the trait of interest and do so in as universally comprehensible a way as possible, vignette studies to date have almost without exception analyzed vignettes in the aggregate, without examining, comparing, or validating individual vignette texts. Research on anchoring vignettes is dominated by highly statistically oriented scholars. The method, however, represents an opportunity for quantitative researchers to collaborate with experts in translation and in local cultures to generate vignettes that achieve ‘semantic, conceptual, and technical equivalence’ across groups .. . .. cognitive interviewing of survey respondents, may help achieve this goal.”
A modest approach Can we find a middle ground among those positions, one that will work in humanitarian assessments? We advocate vignettes on these lines:
• If subjective measures produce incomparable data, they are useless or, worse, misleading.
• Therefore, if the inclusion of anchoring vignettes improves comparability, they should be used.
• The burden on data collection and analysis is lighter when: o The self-assessment question is asked only once, after the vignettes were
introduced (by the interviewer) and placed on the Cantril ladder (by the respondent)22.
o The scale remains at the ordinal level; an underlying interval-level measure is not estimated.
o The number of vignettes is kept small, at most three in a set, resulting in a re-scaled with 3 * 2 + 1 = 7 or fewer levels.
o The language of every vignette is simple and clear; the comparators between vignettes are few; they all increase consistently to avoid multi-dimensionality.
• The vignettes must undergo adequate testing, such as through translation-retranslation, focus groups and survey pre-tests.
22 In their paper “Improving Anchoring Vignettes”, Hopkins and King (2010) conclude that “researchers should move vignettes to before the self-assessments in order to prime and to correct responses”.

ACAPS Note, Subjective measures in humanitarian analysis, January 2018
70
The re-scaling at the ordinal level is perfectly at the reach of MS Excel users, as demonstrated. So are cross-tabulations with a small number of categorical (or suitably categorized) variables in order to descriptively explore the associations of the subjective measure with other measures of interest. The major obstacle is, as Granberg-Rademacker alluded, the lack of practice hitherto. The use of anchoring vignettes in humanitarian assessments will be a pioneering feat the first few times, but will become increasingly routinized if the pioneers demonstrate that their benefits exceed their costs.
Hypothetical questions
Motivation Hypothetical questions are questions that engage the respondent in a thought experiment23. Such questions generate data for subjective measures because they activate personal references for comparison and cause-effect models that may differ from respondent to respondent. The questions most commonly take the form of a “what-if”, such as in “If you had X amount of additional income, how much of it would you spend on food for your family?” Many other linguistic forms occur, and some obscure their hypothetical nature. “Have you ever been in a situation where you almost died?” is hypothetical despite the lack of an if-clause. To answer “yes”, the respondent must recall a situation in which an event Y did not occur, and must be convinced that, first, the probability of Y occurring at the time was high, and, second, that, had Y occurred, he/she would have died. The conviction is subjective even if both respondent and interviewer reasonably assume that other persons, given the information, would fully concur24. In this section, we enumerate pros and cons that survey researchers have adduced about hypothetical questions, clarify terminology and provide an illustration using “if you had X amount of additional income” responses from Nigeria. We describe a generic conversion strategy that gives hypothetical questions a different shape, making them less subjective. We exemplify it by the Basic Necessities Survey, a valid needs assessment method. Although Basic Necessities questionnaires do not use hypothetical questions, they appeal to a hypothetical situation where everyone should enjoy the same basic goods and services. They successfully use subjective measures while rendering their subjective character invisible and thus endowed with greater objectivity. We summarize a recent validation study in some detail in order to help readers who might want to experiment with the method.
Pros and cons We begin with the observation that survey methodologists view hypothetical questions with suspicion, without dismissing them entirely as devices for eliciting useful information. Converse and Presser, in their old, but still helpful “Handcrafting the standardized
23 Wikipedia has an excellent article on the various flavors of thought experiments (Wikipedia 2017e). 24 For an in-depth discussion of “X almost happened” propositions, see Kahneman and Varey (1990).

ACAPS Note, Subjective measures in humanitarian analysis, January 2018
71
questionnaire” (1986), warn that hypotheticals presuppose an ability to analyze the past or forecast the future beyond what we may realistically expect of respondents. At a minimum, they recommend, survey designers should append to hypotheticals “at least one question on actual experience” or “probe .. for the respondent’s frame of reference” (ibd., 23). Lenzer (2011) investigates the psycho-linguistics of various types of survey questions. Hypothetical questions “require .. respondents to build a mental representation of the hypothetical situation and hold it in memory while processing the rest of the question” (ibd. 14) . He finds, unsurprisingly, that hypothetical questions have longer response times. This implies a double cost. Not only will interviews take longer when there are many such questions. Also, validity and reliability of the response may disproportionately suffer when interviews take place under time pressure, and interviewers grow impatient and directive. On the plus side, Converse et al., op.cit., defend the use of hypothetical questions in two situations in which they would be difficult to replace by attitudinal or actual-behavior ones:
• Diverse population: The question topic is about a situation that is vastly diverse across the population of interest. Hypothetical questions then “represent an effort to standardize a stimulus because actual experiences range so widely, and the investigator does not know what set of experiences the respondent is bringing to the question” (ibd., 23).
• Revealed preferences: Hypothetical questions “can also be used in an effort to tie attitudes to some realistic contingencies. For example, people can be asked to imagine cost/benefit trade-offs. Would they favor such and such governmental program if it meant that their income tax would go up?” (ibd.).
Both uses can be challenged. Respondents may not be able to formulate an attitude or action that they would (possibly, probably, certainly) take unless they connect the hypothetical premise to actual experience. They may not understand, or may reject, the implied mechanism, such as the necessity of the particular trade-off (“if new program, then higher taxes”). If they negate the premise (as in “I do not believe that if the government introduces this program our taxes will go up”), either response (“favor”, “do not favor”) will be invalid. The researcher may not detect this, but invalid it is. Findings based on such data will be misleading.
Terminology At this point, a brief digression into terminology is in point. From a survey design viewpoint, we are wont to discuss this type of question as “hypothetical questions”. In decision theory and social psychology – disciplines on which survey methodologists draw -, they are often discussed under different headings. Psychologists speak of “conditional reasoning” when they investigate how persons process and answer hypothetical questions (Evans 2008). Closer to the concerns of this study, “conditional questions” can be distinguished by the degree of being hypothetical. From high-school grammar, we may remember the three main types:
ACAPS Note, Subjective measures in humanitarian analysis, January 2018
72
Indicative conditional “If you receive X amount of additional income, how much of it will you spend on food?”
Subjunctive conditional “If you were to receive X amount of additional income, how much of it would you spend on food?”
Counterfactual conditional “If you had received X amount of additional income, how much of it would you have spent on food?”
In the indicative case, the future is wide open; the probability, in our example, of additional income is not pre-judged by the question form. The subjunctive form does not preclude possibility; yet it communicates a lower probability. The counterfactual changes the temporal mode; it speaks about the past, about possible events and reactions that could have happened, but did not. It does not formally exclude future recurrence, but, depending on context, does not imply it with any but the slightest probability. These differences are not purely academic. Rather, we should say that subjective measures generated from conditional questions may get caught in the abyss that divides academic culture and everyday reasoning. In the first, subjunctive and counterfactual styles have grown more pervasive and sophisticated. Computer simulations and counterfactual statistical methods – in which actually observed cases are contrasted or even totally replaced with hypothetical ones (see, e.g., for many others: Morgan and Winship 2014) – crunch conditional relationships in thousands or millions of permutations. Yet even in professions that argue qualitatively, conditional reasoning has gained a stronger foothold. Thus, US Supreme Court justices have taken to challenging lawyers with hypothetical questions (Prettyman Jr 1984), a style alien to legal argument traditionally confined to fact, law and precedent.
What happens in the respondent’s mind These methodological evolutions in no way guarantee that survey respondents handle hypothetical questions as the designers presume. What happens when we are asked a hypothetical question? We interpret it
“in two steps. The first step consists of creating a temporary copy of the context and updating it with the antecedent [= the if-clause of the question]. The second step consists of interpreting the question relative to this temporary context” (Ippolito 2013:200).
To exemplify, suppose you are the head of a displaced family that is struggling with survival challenges. You hear “If you were to receive X amount of additional income, how much of it would you spend on food?” The word “income” activates a relevant context – a bundle of emotions, concepts, information and vocabulary relating to circumstances, needs

ACAPS Note, Subjective measures in humanitarian analysis, January 2018
73
and the capacity for “income” to fill needs. The terms “X amount of additional” and “if you were to receive” update the bundle with a possibilistic notion of enhanced capacity. Put differently, the question projects the possibility (“were to receive additional income”) of possibilities (the things that the “additional income” can buy) or, if you like, a compound disposition (Choi 2008). That was the first step. Assuming you have assimilated the question to this point, how will you deal with the consequent, the “how much of it would you spend on food?” For this part, we cannot assume a universal procedure. Under extreme rationality, you would review all the unmet needs of your family and the possible allocations of the added income such as to maximize improvements, including in food consumption. To do so, you would need to know prices of market goods and services, procurement costs and social externalities (e.g., losing goodwill of creditors if they see you buying food rather than paying them back). Realistically, you will not be able to do that. You are thinking about a question in “polar” mode (“spend on food” vs. everything else), not in “constituent” (“spend on which of your needs?”) or “alternative” mode (“how much on food and how much on medications?”) (Isaacs and Rawlins 2008). Thus, the focus is on food needs and on ways to meet them with the additional income. You will likely review only very few of the “everything else” needs and options. And only if some other need – e.g., to pay a doctor for urgent medical care – is nearly as urgent as, or more so than, the need for food, will you weigh specific alternative allocations, decide on the best and formulate it in your response. These considerations reinforce the doubts that survey methodologists entertain about hypothetical questions, particularly those of the subjunctive and counterfactual flavor. At the same time, as the “how much .. spend on food” example suggests, they may be useful and, in rapid assessments, even necessary. They let members of a diverse population “update” their personal contexts with the meanings that each of them attaches to the if-clause and hence develop the response from the updated context and from the alternatives that are relevant individually. This sidebar presents results from a recent assessment that used a battery of hypothetical questions. In the following section, we discuss and illustrate a strategy to avoid them.
[Sidebar:] The marginal propensity of food in IDP households in Borno, Nigeria In June 2017, humanitarian personnel coordinated by Okular Analytics conducted a basic needs assessment in and around IDP camps in Borno State, in the region affected by armed conflict in northeastern Nigeria (Okular Analytics 2017). As part of the data collection, field teams interviewed the heads of 1,161 households using a standardized questionnaire.

ACAPS Note, Subjective measures in humanitarian analysis, January 2018
74
Detailed findings are found in op.cit. Here our narrow focus is on a subjective measure, the marginal propensity for the households to buy food. We estimate it from the response to a hypothetical question:
“Let’s imagine you received N10,000 [Nigerian Naira, approx. US$ 30] this month, without any conditions or interest attached, how would you spend it across the following basic needs?”
immediately followed by the instruction:
“You can put all your money on one item or split the N10.000 across the basic needs. Total must be N10.000.”
The question is formally semi-closed, referring to 15 basic needs categories, plus “other”. Before the respondents were exposed to the question, they had been walked through the category set several times while answering five questions that elicited information against the same set. Examples of these questions are: “How far is the nearest place where you commonly access [basic need X]?” and “What would be the minimum required per month to cover the Basic Needs [meaning: basic need X] of all your family members without compromising your health, assets and dignity?” The first of the basic needs categories was “Food commodities (Staple and non-staple, etc.)”. Given the complex setup of familiarizing through the preceding questions and the challenge of allocating the hypothetical income to 16 potential uses, we must expect large category order effects (Schoenherr and Thomson 2008). Many respondents may have placed all of the N10.000 on food because they were no longer certain of the categories to follow. This is speculative; we do not know how the interviewers handled the question. Given the serious pre-famine conditions, the allocations to food may be fairly reliable. In other words, had food been placed further down in the list of needs, we suppose that the response would have been similar. We have data on the allocations of the extra N10,000 for 1,057 of the interviewed households. Indeed, as expected on objective (pre-famine) as well as psychological grounds (category order), the share given to food outranks the other needs by far. The mean of the food shares is N6,370, followed by health care (N789, both medications and services). All other needs receive even less on average. The number of needs to which the respondents allocated the extra income varied widely. A fifth of the respondents (227) would spend all of N10,000 towards one need (of the 227, 225 all towards food). A small group of 19 respondents hedged their bets, distributing the N10,000 over all 16 categories. Those are extremes. More instructive of how respondents elaborate on a difficult subjective question are statistics towards the center: two thirds allocated to four or more needs, and a fifth distributed over nine or more needs. That suggests that the category order effects were modest. The point of particular interest are the food shares. The histogram reveals a bi-modal distribution. Virtually every respondent allocated some of the N10,000 to food. Roughly a fifth would spend all on food; another fifth half of the extra (N5,000). The remainder huddle
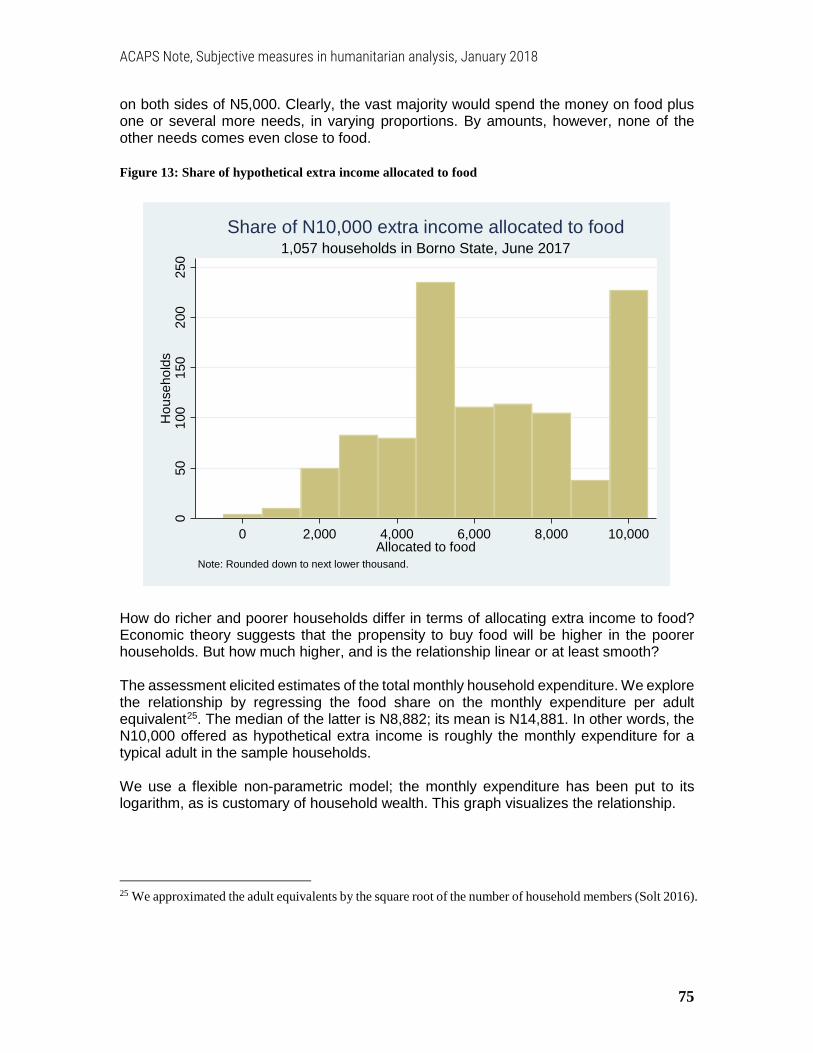
ACAPS Note, Subjective measures in humanitarian analysis, January 2018
75
on both sides of N5,000. Clearly, the vast majority would spend the money on food plus one or several more needs, in varying proportions. By amounts, however, none of the other needs comes even close to food. Figure 13: Share of hypothetical extra income allocated to food
How do richer and poorer households differ in terms of allocating extra income to food? Economic theory suggests that the propensity to buy food will be higher in the poorer households. But how much higher, and is the relationship linear or at least smooth? The assessment elicited estimates of the total monthly household expenditure. We explore the relationship by regressing the food share on the monthly expenditure per adult equivalent25. The median of the latter is N8,882; its mean is N14,881. In other words, the N10,000 offered as hypothetical extra income is roughly the monthly expenditure for a typical adult in the sample households. We use a flexible non-parametric model; the monthly expenditure has been put to its logarithm, as is customary of household wealth. This graph visualizes the relationship.
25 We approximated the adult equivalents by the square root of the number of household members (Solt 2016).
050
100
150
200
250
Hou
seho
lds
0 2,000 4,000 6,000 8,000 10,000Allocated to food
Note: Rounded down to next lower thousand.
1,057 households in Borno State, June 2017Share of N10,000 extra income allocated to food

ACAPS Note, Subjective measures in humanitarian analysis, January 2018
76
Figure 14: Propensity for food in response to household expenditure
Two findings leap to the eye:
• The relationship is weak. The propensity for food varies widely (as we have seen in the histogram) and does so over most of the observed expenditure range. Note that the confidence interval for the expected mean is reasonably narrow only for the range 3.0 < log10(expend) < 4.5.
• There are thresholds. There are significant differences along the poorer-richer axis. The change is not linear. The mean propensity is more or less constant up to N8,000 per month and adult equivalent. Those poorer household would typically spend around N7,000 out of the N10,000 extra income. Then the propensity drops abruptly, below N6,000. The drop continues on a gentler slope among households that can spend more than N16,000 per month and AE.
Neither finding is a surprise. The relationship is weak not least because the monthly total household expenditure, by the summary way it was elicited, carries high measurement error. The diversity of needs among households, too, modifies the propensities to use extra income for food. The thresholds in the relationship are in line with received wisdom that strength of perception is not proportionate to underlying stimuli. Applied to this needs
ACAPS Note, Subjective measures in humanitarian analysis, January 2018
77
assessment, the perceived need for food is high, relative to other needs, across a wide swathe of poverty, then drops suddenly as we look at richer households, although not by very much. Virtually all households want to have more or better food. Given the difficulty to accurately measure “objective” poverty – via household expenditure -, the subjective propensity for food is a welcome additional measure. How we can combine it with expenditure and possibly other measures in a valid index of deprivation or severity is a challenge that needs more work.
From subjective hypotheticals to social norms It should by now be evident that hypothetical questions in standardized questionnaire interviews are problematic. Yet, in certain situations, they are difficult to replace and thus necessary. They are problematic because they make the respondent perform a dual operation – updating the context with the meaning of the “if-clause”, then answering the question with information retrieved in that updated context. They are necessary where situations across respondents are so diverse that only a hypothetical question provides a meaningful common stimulus. The difficulties can be reduced by separating the if-clause and the question into different questions that lead respondents to supply two propositions. The subjectivity, too, can be reduced. As we shall see, in the new format, both the elicitation and the analysis contribute to greater objectivity.
Conversion strategy The conversion is not straightforward. To recognize the hypothetical character in the new shape of questions requires some explaining. There are four steps involved:
• Splitting the hypothetical question • Evaluating the equivalence of the new questions with the hypothetical • Reducing the subjectivity of the measure • Calculating the measure
To exemplify, we use again the question from the sidebar above: “Let’s imagine you received N10,000 extra income this month, without any conditions or interest attached, how would you spend it across the following basic needs?”
Splitting into two questions The if-clause itself is not a question. It denotes either a possibility (“if you get the N10,000 extra income” or “if you were to get ..”) or a proposition that is false (“if you had received an extra N10,000 ..”, but we know you didn’t). As a question on its own (“Did you / will
ACAPS Note, Subjective measures in humanitarian analysis, January 2018
78
you receive N10,000 extra income?”), it is meaningless, even disruptive to the interview. In order to function as a meaningful question on its own, the if-clause has to be
• converted from a polar (“Did you receive N10,000? – yes or no”) to a constituent form (“How much did you receive?” – [fill in amount]),
• connected to at least one more concept, of a normative or teleological nature that changes the factual mode to a different one.
Normative statements feature modal verbs like “ought to, ought not to, must, must not”, adjectives like “allowed, forbidden, adequate, required”, and their roots and derivatives, some of which denote standards (e.g., “less than the daily requirement”). Teleological statements relate means to ends or pose a hierarchy of objectives. “What income would enable you to feed your family adequately?” is of the normative kind; “In order to feed your family, how much do you need to earn?” is purpose-driven. In this example, the normative version seems preferable. In other situations, a teleological formulation conveys the normative intent better: “How much do you need to earn in order to send your children to university?”, where “university” signals a desirable level of education. Importantly, the additional concept – such as “adequacy” – is not directly observable by the interviewer. The second question, as a result of the split, is “What income do you actually make?”, or “How much did you earn last month?”, and similar. It is in the factual mode. It enables a comparison. The respondent made enough money to feed his/her family adequately, or not (normative case), or enough to meet the purpose of feeding them, or not (teleological).
Establishing equivalence between hypothetical and normative/teleological What do pairs of questions like “In order to feed your family, how much do you need to earn?” and “How much did you earn last month?” have to do with hypotheticals? The point is that the normative or teleological mode of the first question functions as the new if-clause:
• If “the family is to be fed adequately”, then the income “must be at least” [X amount], or
• If “I am to achieve [purpose], then I “must make at least” [X amount]. with obvious contrapositions such as “If I make less than [X amount], then I fail to achieve [purpose]”. At this point, adequacy and achievement are entirely subjective, left to the respondent’s personal standard. So, how can we say that
the single question: “If you earned an extra [amount] this month, how much of it would you spend on food?”
ACAPS Note, Subjective measures in humanitarian analysis, January 2018
79
and the question pair “To feed your family adequately, how much do you need to earn?”, “How much did you actually earn last month?”
are equivalent? The equivalence is in the eye of the researcher / assessment designer; it is pragmatic, not semantic26. The respondent typically gets to hear only one variant or, if exposed to both, answers them separately, without worrying about equivalence. For the researcher, they are equivalent if either can furnish a measure of the same construct, e.g., the degree to which the household’s need for food is being met. The equivalence is pragmatic, given by the research objective. It is not semantic; the meanings in the conversational context are not the same; they rest on different concepts (in our example: “exceptional extra income” vs. “required regular income”, besides other differences). It is up to the researcher to prove the equivalence.
Reducing subjectivity In a further step, the measure derived from the response to the split questions can be made more objective. First, the normative or teleological element is taken away from the individual respondent. It is replaced by
• A universal standard (e.g., a SPHERE standard) • Expert judgment about the particular group or area (e.g., the minimum expenditure
basket for refugee families in Lebanon) • A statistic of the subjective responses to the question (e.g., the median of the
minimum monthly food budget for a family of six in the interviewed households) We may call the third option a “data-driven standard”. The sample of households can be the one in the current survey / assessment, or from a previous data collection in an area or social group that the researcher considers sufficiently comparable for the purpose. The method used in the previous data collection may be different; it may have been a series of focus group discussions rather than interviews with individual households.
26 Johnson-Laird et al. (2002) discuss the logic, semantics and pragmatics of conditional statements in great detail. In particular, they recommend treating counterfactual conditionals, not as true or false, but as possibilities (pp.651-652). Suppose the respondent’s spouse is sick, and the family are badly in need of food. The possible responses “If I were to receive N10,000 extra income, I would spend .. 1. all on food, 2. all on medical care, 3. half on food, and half on medical care” are all the same in terms of “truth”. In other words, if the question were repeated during the interview and the second response differed from the first, this could not be taken to mean that the respondent was unreliable. Since the interviewer understands the “true situation” of the family at most very superficially, it is impossible for him/her to decide which response is “truer”. However, the thought experiment says something about the validity of the proportion allocated to food as a measure of food deprivation, or even of the degree of broad deprivation across needs. It is limited by the competition from other needs. At the same time, it has some face validity to the extent that it is reasonable to assume some modest correlation between true deprivation and hypothetical allocation to food.
ACAPS Note, Subjective measures in humanitarian analysis, January 2018
80
Second, the factual question – “How much did you earn last month?” or “How much did you spend on food last month?” – is unconditional. As such, we expect the response to be more reliable than that to any kind of conditional question.
Calculating the measure In the last step, the ultimate measure of interest – e.g., the degree to which a sample household falls short of the food expenditure basket – is the result of a comparison between the factual claim of the respondent and the normative or teleological element taken from outside. Some standardization may be necessary, such as for household size, for which adult equivalents are a recognized method (see, among many, e.g. Qizilbash 2002). Depending on the measurement level, the result may be counts of cases and sample proportions, or more informative intensity and severity measures. Thus, if the standard is completion of primary school, the proportion of school-age children completing in the sample is the statistic of interest. If the standard is age-appropriate completion, the measure gets more complicated, to reflect the efficiency of the education system. In food security, both minimum basket and actual provision are expressed in monetary terms. The shortfall allows for three measures of interest – the head count, the depth and the severity of food insecurity, in analogy to poverty measures (Foster, Greer et al. 1984). The case study below describes a method that uses both factual and normative questions. It has been applied in multiple contexts and enjoys good validity and reliability. We reproduce the outline of the method that one of its pioneers gave, discuss at some length a validation using data from West Africa, add critical comments, and reconsider the hypothetical nature of the measure.
Case study: Basic Necessities Surveys
What it is The Basic Necessities Survey (BNS) is a method to measure the deprivation level of a particular household, of a sample of households and, by inference, of a population. It belongs to a family of poverty measurements that Alkire et al. (2015:123) call “counting approaches”, because they “entail .. counting the number of dimensions in which people suffer deprivation”, as opposed to, for example, income-based approaches.
The method Rick Davies and William Smith developed the BNS method in Vietnam (Davies and Smith 1998, Davies 2007). The Monitoring and Evaluation NEWS Web site (MandE), managed by Davies, offers a detailed description, lists studies that used it and references methodological precursors as well as related methods 27 . We can therefore confine ourselves to a barebones exposition.
27 At http://mande.co.uk/special-issues/the-basic-necessities-survey/ .
ACAPS Note, Subjective measures in humanitarian analysis, January 2018
81
The BNS measures poverty by collecting data on the presence vs. absence of items essential to a family’s well-being. It weights the items (see below) and computes a score based on the items that the household owns. The BNS pursues a consensual definition of poverty drawn from the sample households themselves. At the planning stage, the designers create a list of easily identifiable “things, activities and services” that the population might consider basic necessities. The BNS defines “poverty as the lack of basic necessities. Basic necessities are those things that everyone should be able to have and no one should have to go without“ (MandE Web page). Since it is not known in advance which items people will rate as basic, the list should contain items from a range of presumed low to high necessity. During the household survey, respondents are asked three questions. The third is optional; it can be used to define a poverty line:
• “Which of these items do you think are basic necessities, things that everyone should be able to have and no one should have to go without?”
• “Which of these items does your household have?” • “Compared to other people in [the survey] area, do you think your household is poor
or not poor?” The item weights are calculated as follows:
• For every item, the proportion is taken of respondents who said it was a basic necessity.
• Items with proportions < 50% are excluded. • From the remaining items, the sum of proportions is taken as a scaling factor. • The weight for an item is its proportion divided by the scaling factor. The sum of
weights is 1 or 100%. The household’s BNS score is the sum of the weights of the items present. Its theoretical range is [0, 1] or 0 – 100%. In other words, the score is a measure of the necessities that the household owns, not of those that it lacks. The depth of poverty can be expressed as one minus the score. The sample mean of this value is the depth of poverty in the sample. A head count of poverty can be calculated if the respondents answer the third question, to self-assess their status as poor or non-poor. Which households are to be considered poor in the BNS perspective is determined by the cumulative distribution of the expression (1 – BNS score). Households with values equal to, or lower than, the inverse of the proportion of self-assessed poor are considered poor.
Validation A number of studies have examined the validity of the BNS score to measure poverty or deprivation at the household level. A key question has been whether different population groups – by age, gender, poverty level, location and family composition – agree on the

ACAPS Note, Subjective measures in humanitarian analysis, January 2018
82
same items as basic necessities. High levels of agreement were found in Britain and South Africa (for the latter country, Wright, Noble et al. 2007). In a recent large-sample study in Benin, West Africa, Nandy and Pomati (2015) tested the hypothesis known as “adaptive preferences”. It “posits that poor or deprived people may lower their expectations of what they might otherwise be entitled to (e.g. to receive an education, to gainful employment, to health care when sick and support in times of need), and these lower (or bounded) horizons effectively underplay what they think are the necessities of life in a given society” (ibd., 708-9). They found that, on the contrary, “deprived respondents were significantly more likely to consider each of the items in the deprivation index to be essential, compared to those not deprived” (710-11). This lends further support to the consensual poverty measurement approach.
The measure Nandi and Pomati went to great lengths to validate their consensual poverty measure28. Some differences need to be noted vis-à-vis the BNS method. The respondents of the Benin survey were asked which items in a list of 26 items/activities they considered essential (French: “indispensable”) for a decent standard of living. The item descriptions allowed for a greater degree of abstraction than physical possessions or services availed; some items state an ability and as such are dispositional notions. Examples include: “Eat three meals a day every day”, “Able to buy cleaning products”, “Able to heal when you are sick”, “The ability to send children to school”. Of the 26 items, a majority of respondents considered 22 to be essential. These were retained. In addition, for 16 of the 22, respondents indicated whether the needs for this item were “not at all satisfied”. If so, the respondent received an item score of 1, else of 0. The deprivation index value then was the simple sum of item scores, with a theoretical range [0, 16]. Differently from the BNS, the items were not weighted. Thus, for instance, “access to drinking water” (considered essential by 84 percent of the respondents; “not at all satisfied” were 26 percent) and “having meat or fish every day” (57 percent; 10 percent) make equal unit contributions to the deprivation index. The graph shows the observed distribution of the sample households by the number of deprivations experienced.
28 The article is freely available at https://link.springer.com/content/pdf/10.1007%2Fs11205-014-0819-z.pdf .

ACAPS Note, Subjective measures in humanitarian analysis, January 2018
83
Figure 15: Households, by number of deprivations experienced, in the Benin sample
Source: Nandy et al., op.cit., 705.
Validation standards Nandy et al. examined the pattern in the response to the “Is the item essential?” questions. Since these comparisons and tests may be helpful for readers building similar indices, we enumerate them and illustrate findings. The authors investigated three qualities of the index – consensus, validity and reliability.
Consensus If the measure is truly consensual, then the rankings of essential items should not differ significantly across social groups. The degree of consensus across age groups, gender, education level, migrant status, religion and ethnicity was visualized in heat maps of the proportions of respondents saying “essential”, by item and group29. No major differences were detected in the sample. A high level of consensus across groups may be assumed to exist in the study population. The table reproduces one of those comparisons. The differences between male and female respondents are minor for all items.
29 Excel users can do this by applying conditional formatting to Pivot tables.
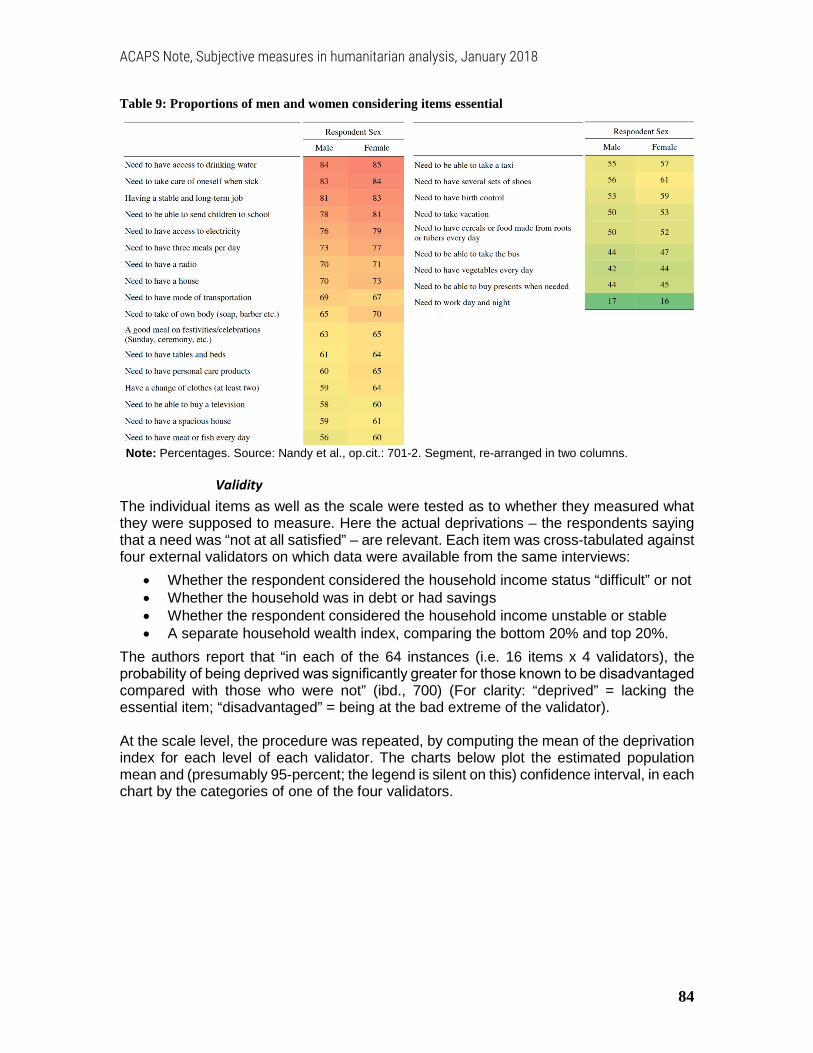
ACAPS Note, Subjective measures in humanitarian analysis, January 2018
84
Table 9: Proportions of men and women considering items essential
Note: Percentages. Source: Nandy et al., op.cit.: 701-2. Segment, re-arranged in two columns.
Validity The individual items as well as the scale were tested as to whether they measured what they were supposed to measure. Here the actual deprivations – the respondents saying that a need was “not at all satisfied” – are relevant. Each item was cross-tabulated against four external validators on which data were available from the same interviews:
• Whether the respondent considered the household income status “difficult” or not • Whether the household was in debt or had savings • Whether the respondent considered the household income unstable or stable • A separate household wealth index, comparing the bottom 20% and top 20%.
The authors report that “in each of the 64 instances (i.e. 16 items x 4 validators), the probability of being deprived was significantly greater for those known to be disadvantaged compared with those who were not” (ibd., 700) (For clarity: “deprived” = lacking the essential item; “disadvantaged” = being at the bad extreme of the validator). At the scale level, the procedure was repeated, by computing the mean of the deprivation index for each level of each validator. The charts below plot the estimated population mean and (presumably 95-percent; the legend is silent on this) confidence interval, in each chart by the categories of one of the four validators.
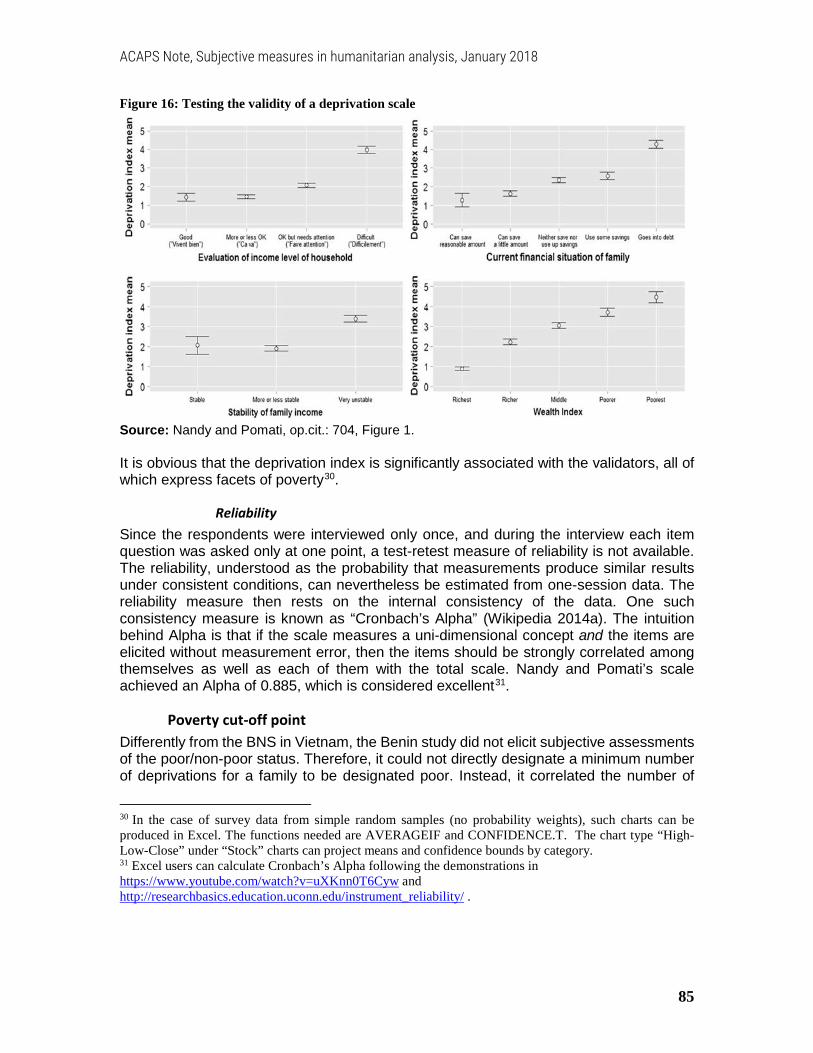
ACAPS Note, Subjective measures in humanitarian analysis, January 2018
85
Figure 16: Testing the validity of a deprivation scale
Source: Nandy and Pomati, op.cit.: 704, Figure 1. It is obvious that the deprivation index is significantly associated with the validators, all of which express facets of poverty30.
Reliability Since the respondents were interviewed only once, and during the interview each item question was asked only at one point, a test-retest measure of reliability is not available. The reliability, understood as the probability that measurements produce similar results under consistent conditions, can nevertheless be estimated from one-session data. The reliability measure then rests on the internal consistency of the data. One such consistency measure is known as “Cronbach’s Alpha” (Wikipedia 2014a). The intuition behind Alpha is that if the scale measures a uni-dimensional concept and the items are elicited without measurement error, then the items should be strongly correlated among themselves as well as each of them with the total scale. Nandy and Pomati’s scale achieved an Alpha of 0.885, which is considered excellent31.
Poverty cut-off point Differently from the BNS in Vietnam, the Benin study did not elicit subjective assessments of the poor/non-poor status. Therefore, it could not directly designate a minimum number of deprivations for a family to be designated poor. Instead, it correlated the number of
30 In the case of survey data from simple random samples (no probability weights), such charts can be produced in Excel. The functions needed are AVERAGEIF and CONFIDENCE.T. The chart type “High-Low-Close” under “Stock” charts can project means and confidence bounds by category. 31 Excel users can calculate Cronbach’s Alpha following the demonstrations in https://www.youtube.com/watch?v=uXKnn0T6Cyw and http://researchbasics.education.uconn.edu/instrument_reliability/ .
ACAPS Note, Subjective measures in humanitarian analysis, January 2018
86
deprivations with a household wealth index and set the minimum at four. The wealth of households with four deprivations was significantly lower than for those with only three; the wealth differences between those with four and those with five were minor. Households with at least four deprivations accounted for 31 percent of the sample. For details, the reader should consult op.cit.; here we simply underline that the determination of poverty thresholds in BNS and similar methods depends on an external relation – either with the self-assessed poverty status or with some objective indicator.
Methodological comments The BNS offers a simple and straightforward method to combine subjective and objective data in a measure of deprivation or poverty. All calculations can be done in spreadsheets. The consensual approach makes the method participatory to the extent that the ensemble of respondents largely determines the items that go into the scale (from a list that the survey designers presented). This gives it legitimacy for advocacy purposes, particularly in the right-based perspective – a point emphasized by its pioneers. Whether one wants to accept Davies’ claim that the BNS is “democratic in the way that it identifies what constitutes poverty and who is poor” (Web page) is a matter of philosophy. Yes, the basic necessities are selected by majority vote, but the voters are a sample of families, not the population – a different sample might vote for other items. Perceptions of basic necessities and which of them people actually have may be ascertained at the same time or in two different data collections. In the latter case, only those items that are agreed necessities are included in the second stage and therefore in the analysis; the UK 2012 Poverty and Social Exclusion Survey, for instance, did that (Aldridge, Kenway et al. 2012). In the former – the Vietnam BNS and the Benin study belong here -, both variables – subjective perception and actual possession – are filled for all items. The possession of items that are not considered necessities by a majority of respondents are excluded from the analysis. Generally, it is not a good idea to throw away information, and particularly not from a sample survey, in which an item excluded on account of some statistic may actually include the cut-off criterion within a reasonable confidence interval. This problem was noticed early on; Halleröd (1994) investigated it with data from Sweden and found high consistency between both variants – including or excluding items with less than fifty percent support. Thus, we may in good conscience neglect this problem and opt for the BNS solution. Fahmy et al. (2015) take aim at the concept of “basic necessity”. Their point seems to be that the BNS method is not enough to allow the researcher to appraise the full range of public understandings, and that the motives and rationales why people include an item in their list of necessities need to be probed more deeply. This calls for deliberative methods. If that were so, it would argue for the two-stage approach and for the use of focus groups at the first stage. The researchers would take detailed notes of reasons and, on the basis of all notes, make qualitative decisions to include or exclude items. The item weights, too, would have to be established by a different method, perhaps in card sort exercises in the same focus groups and by aggregation of the sorts over all groups.
ACAPS Note, Subjective measures in humanitarian analysis, January 2018
87
This version of the two-stage approach – first focus groups, then household survey – may pose logistical challenges. It will be productive only if the researchers at the end of the focus group part can go back to base camp, do their homework, adapt the household questionnaire and then only train the enumerators in its use.
BNS questions as hypotheticals This sidebar presents the BNS method as a clever elaboration of hypothetical questions in ways that make them simpler and clearer. It is unlikely that its pioneers and practitioners conceive of it in this way. In fact, the equivalence with hypotheticals is, at best, difficult and cumbersome. From the wording of the BNS questions, one is tempted to approximate the if-clause as “If you lived in a society in which everyone enjoyed the basic necessities”. But it would be hard to conduct an interview with multiple questions starting in, or presupposing, such a condition. And anyway, what would be the question, then? Trying “which of these items would your family have?” would not work because every item will already be present in at least some families, thus negating the hypothetical character. A more valid back-translation to hypotheticals might come in the shape of “If we agree that X is a basic necessity, what is the probability for family Y to have it?” This is not feasible in conversations with respondents. But it works for the deliberations of the researcher. First, agreement on necessities must be secured; the first of the BNS questions takes care of that. Then, the factual ownership is established, through the second question. And finally, in the analysis, probabilities can be estimated for families of given characteristics (e.g., female-headed households). Of interest are the probabilities to own items X1, X2, etc., and eventually, considering all agreed necessities and all observed possessions, to be of such and such deprivation type. The BNS achieves more than simplicity and clarity. By establishing normativity (“everyone should be able to have”), the questions about specific items operationalize a hidden concept of fairness and social justice. In other words, the if-clause refers to a latent variable that cannot be directly observed: “If you lived in a fair and just society”. This abstract approach opens poverty measurement and needs assessments to a much richer picture than overly concrete questions of the kind “If you had X-amount of extra income, how much would you spend on Y-item?” On top of that, the BNS mitigates the subjectivity of perceptions of possible fair and just societies by relying on opinions averaged across the sample. It represents a methodological advance in eliciting and evaluating subjective measures.
After all: are hypothetical questions appropriate? In everyday conversations, people handle conditionals and hypotheticals with great ease. Social methodologists, unfortunately, are led to discourage hypothetical questions, for the reasons enumerated in this chapter. Exceptions must be conceded, rarely and with a need for additional validation. Fortunately, human language is so flexible that hypotheticals can take many forms beyond the if-clause. As the Basic Necessities Survey method demonstrates, hypothetical questions can be so transformed that they become invisible.
ACAPS Note, Subjective measures in humanitarian analysis, January 2018
88
Invisibilization is a basic requirement of societal functioning; it happens whenever somebody, seeing or speaking, makes a distinction, but at the same time cannot distinguish the distinction from other distinctions (such as those understood by the respondent in the interview). As such, the invisibilization of hypothetical questions in survey research, including in needs assessment, is nothing particularly new or exciting. To be effective, however, any conversion strategies need careful deliberation and testing.
Outlook Where we are, and what we miss
A force of enlightenment? Researchers’ faith in subjective measures spans a wide range. On one extreme, we find those who cannot overcome their suspicion that the noise of subjectivity does nothing but cloud abysmally poor validity and reliability. These doubters like to debunk subjective measures by pointing to the low correlations with their objective counterparts, as we noted for the FIES measure. The other extreme invests subjective measures with ambitions that the reality of the testing, survey and assessment business may not ever fulfil. Such high hopes energized, among others, the pioneers of subjective health indicators in the 1980s:
“Allowing individuals to evaluate their own health status solves, to some extent, the problems posed by different professional definitions of health and illness and redresses the balance between lay and professional 'objectives'. It may also help to teach us something about why individuals get sick at all as opposed to what causes specific diseases. There is no question of subjective indicators replacing traditional measures of population health, but they may provide what [another researcher] calls 'enlightenment' - the kind of information which can rearrange our pattems of thinking about the structure of society and provide feedback about how people feel as opposed to how long they live, or which groups are most likely to suffer from which maladies” (Hunt and McEwen 1980:242-243).
“Enlightenment” is a big word. It is certainly on the minds of the World Happiness Reports, which rightly remind us that true progress cannot be fully gauged by GDP growth, but more so by what people feel about the quality of their own lives. Thus, what should be the level-headed philosophical attitude of humanitarian workers towards subjective measures?
ACAPS Note, Subjective measures in humanitarian analysis, January 2018
89
Courage and caution The basic premise of this note is that humanitarians should embrace subjective measures with a mixture of courage and caution. Courage because such measures are needed, and therefore we have to engage with them and with other communities from whom we can borrow skills and templates. Humanitarian intelligence needs subjective measures simply because the objective ones won’t do a full job – they are unavailable, expensive, late, less reliable, or all of the above. Caution flows from two insights. First, the reservations against subjective measures are serious. Often it is not clear what they really measure, and how well they do so. As we have seen, incomparable subjective ratings on the Cantril ladder were a major motivation for anchoring vignettes, essentially a cautionary device. Second, turbulent environments and short time horizons of needs assessments hamper good measures of all kinds. Designs often have to be improvised; testing is minimal. Nobody can spend even a fraction of the time that certain gold standard measures such as the FIES traversed from seminal idea to maturity. Despite all the caution that is needed, Hunt and McEwen do have a point. Work on and with subjective measures fosters intersectoral thinking outside the box. Since all sectors complain of time pressure, all should welcome measurements that save time. And without waxing lyrical about popular participation, subjective measures can reduce the social distance that separates experts, key informants and ordinary affected people. Focus groups can help sort through candidate items of a proposed deprivation scale – and much more. A number of practical consequences follow.
Subjective measures at the community level? Subjectivity is fundamentally a property of individuals even though its grammar, resources, scope and limits are conditioned by culture and society. It is not by accident that the persons on whom surveys and assessments collect subjective measures speak for themselves or for very small groups of persons closely connected to them, first and foremost their families. However, needs assessments usually find time and resources to assess the situation of individual families during later, more settled phases of the humanitarian response. In the early phases, assessments focus on communities. Leaders and key informants speak for them. Focus groups broaden voices, mixing personal contributions, yet streamlined into what they mean for the community. To consider measures derived from such sources “subjective” stretches the concept. Key informants who rate their communities on the ACAPS severity scale are supposed to reformat a piece of public knowledge, an evaluation

ACAPS Note, Subjective measures in humanitarian analysis, January 2018
90
that other informed residents would endorse when asked. They provide an objective measure, albeit an uncertain one32. Subjective measures elicited from persons that speak for communities, let alone larger groups, may exist, but we have not found them in the research for this note. This is an area for future development, of interest to humanitarian analysts and assessment designers.
[Sidebar:] Subjective measures at the community level – An example The District of Sunamganj in the northeastern part of Bangladesh is one of the poorest areas in the country. The water and sanitation NGO DASCOH has been operating infrastructure and social organization programs there for a number of years. DASCOH reaches almost a thousand villages and hamlets. The NGO is self-critical and open to evaluation. It is particularly concerned in alleviating the plight of women and has arranged for systematic feedback on the changes in the gendered division of labor. Between 2011 and 2014, DASCOH field organizers held yearly consultations in 988 settlements to measure attitudes towards women’s roles in family, community and organizations like NGOs and commune councils. The organizers were given a list of 29 items suitable to capture traditional vs. liberal attitudes. While input was sought from the men and women who participated in these meetings, the discussions were often chaotic and incomplete, putting a heavy burden on the organizer to interpret what the local consensus might be on this or that item. The data, therefore, qualify as subjective – ultimately the organizer’s personal evaluation of what he/she recalls as the speakers’ prevailing tendency. For these 988 villages and hamlets, the dataset is complete in each of four years. 26 of the 29 items were usable for the measurement of gender role attitude change. Benini, Karim et al. (2014) analyzed the data in an Item Response framework. They found initially rapid changes towards less traditional expectations, with a consolidation around slightly non-traditional ones in year 3 and 4. This table illustrates the changes by the descriptive statistics of six items, two at each of the three levels – household, village and above.
32 Other research disagrees. It emphasizes the subjectivity of key informants, the variability of their estimates, and their personal interests (e.g., Magis 2010).
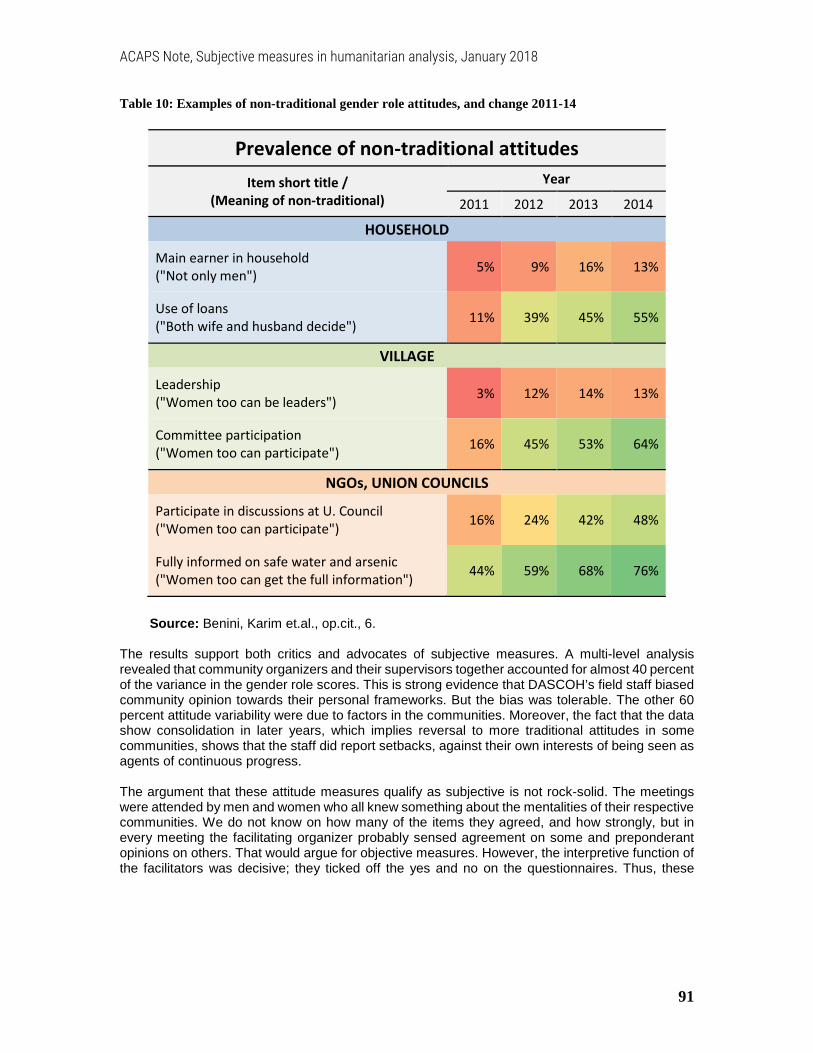
ACAPS Note, Subjective measures in humanitarian analysis, January 2018
91
Table 10: Examples of non-traditional gender role attitudes, and change 2011-14
Prevalence of non-traditional attitudes Item short title /
(Meaning of non-traditional) Year
2011 2012 2013 2014
HOUSEHOLD
Main earner in household ("Not only men") 5% 9% 16% 13%
Use of loans ("Both wife and husband decide") 11% 39% 45% 55%
VILLAGE
Leadership ("Women too can be leaders") 3% 12% 14% 13%
Committee participation ("Women too can participate") 16% 45% 53% 64%
NGOs, UNION COUNCILS
Participate in discussions at U. Council ("Women too can participate") 16% 24% 42% 48%
Fully informed on safe water and arsenic ("Women too can get the full information") 44% 59% 68% 76%
Source: Benini, Karim et.al., op.cit., 6.
The results support both critics and advocates of subjective measures. A multi-level analysis revealed that community organizers and their supervisors together accounted for almost 40 percent of the variance in the gender role scores. This is strong evidence that DASCOH’s field staff biased community opinion towards their personal frameworks. But the bias was tolerable. The other 60 percent attitude variability were due to factors in the communities. Moreover, the fact that the data show consolidation in later years, which implies reversal to more traditional attitudes in some communities, shows that the staff did report setbacks, against their own interests of being seen as agents of continuous progress. The argument that these attitude measures qualify as subjective is not rock-solid. The meetings were attended by men and women who all knew something about the mentalities of their respective communities. We do not know on how many of the items they agreed, and how strongly, but in every meeting the facilitating organizer probably sensed agreement on some and preponderant opinions on others. That would argue for objective measures. However, the interpretive function of the facilitators was decisive; they ticked off the yes and no on the questionnaires. Thus, these

ACAPS Note, Subjective measures in humanitarian analysis, January 2018
92
arrangements qualify as subjective measurements and at the same time as referring to communities, not individuals or households. DASCOH is a development NGO. With the mixture of poverty, recurring natural disasters (floods) and high insecurity for women (and in particular women and girls going out to fetch water or to relieve themselves), the “normal” in Sunamganj is not far from a situation of humanitarian interest. DASCOH’s self-monitoring may have lessons for others.
We learn selectively Compared to the poverty measurement and health indicator research communities, humanitarian analysts are latecomers to the world of subjective measures. This offers the chance to leapfrog earlier versions, to borrow from the true and tested, and even to experiment with novelty. Learning this way is more efficient. But it can lead us onto thin ice when we try instruments without sufficient skills or knowledge of precedent. The world of subjective measures has grown so large and so diverse that no professional community can possibly survey the full panorama of methods and applications. Learning must be selective, and some of the gaps can be filled with outside expertise and from inventories of validated scales and tests as and when needed. However, access to such resources has a cost in terms of time and money, and there will always be times when designers have to improvise instruments with little or no external support. Therefore, it is desirable that humanitarian analysts have access to a common stock of fundamentals. This concerns techniques of measurement and analysis as well as substantive matters that are common to most or all sectors. Severity measures are a prime example. Earlier we mentioned a family of poverty measures that became a classic standard for development researchers. Its statistical qualities such as additive decomposition are formal merits; the triple measures of “head count ratio”, “depth of poverty” and “severity of poverty” combine for powerful substantive descriptors. Ultimately, it will be in the interest of the humanitarian community to develop a family of subjective measures shared across needs assessments. It will make data and findings comparable.
Methods in the waiting room This note leaves out a number of methods and techniques that are desirable given the current state of subjective measures. The omissions were motivated chiefly by the fact that spreadsheet implementations for them are not available or are not sufficiently documented. MS Excel is the workhorse that most humanitarian analysts harness to their data analyses; statistical applications are less widely used. This excludes Item Response Analysis (IRT) and the Alkire-Foster model of multidimensional poverty measurement. Both are useful members of subjective measurement toolboxes. IRT is a statistical scale analysis technique that simultaneously evaluates the difficulty of each item and the
ACAPS Note, Subjective measures in humanitarian analysis, January 2018
93
positions of subjects on the underlying construct that the items express (Wikipedia 2013, Wikipedia 2016). It does away with the necessity to define normative standards as is the case, for example, in the Basic Necessity Surveys described in the previous chapter. It is, in other words, purely formal. Criteria for classifying subjects must come from outside. By contrast, the Alkire-Foster model has multiple normative elements, which makes it suitable for severity classifications that can incorporate standards from several sectors. It should not be too difficult to create an Excel template for the calculations, but some of the technical steps are difficult to explain and require consumers of results to have blind faith in obscure quantities like the “adjusted head count”. But the strong foundational basis and the common language that it offers for needs assessments and poverty measurement make it a prime choice for future inclusion in any humanitarian analysis syllabus.
Ants and athletes We conclude with a reflection on the body of knowledge of subjective measurement. Google Scholars returns 48,800 references to scientific documents that carry as least one instance of “subjective measure”33. The additional “needs assessment” whittles them down to 606. Adding a further “humanitarian” leaves a paltry 39. Humanitarians eager to explore this field may have conflicted feelings. “Am I joining an ant colony?” vs. “Am I climbing upon the shoulders of giants?” Both are likely to be disappointed – and encouraged. If you feel like an ant, know this: Assessment teams parachuted into some remote crisis area may resemble very lonely ants, scouting for food far from the central hill, without adult advice and supervision. Enjoy your temporary freedom and experiment to the best of your abilities! Those comfortable in the company of giants will find out that there is no Albert Einstein, no Max Weber and, for the statistically inclined, no Ronald Fisher towering over the rest of us. Rather, there is a crowd of good athletes coaching us in orienteering, triathlon or whichever sport makes for analogies with methodological apprenticeships. As happened to the evolution of disciplines in sports, the field of subjective measures has produced a number of methods and techniques, some of which are well known and thoroughly regulated, others marginal or amateurish. Find out in which you want to enroll, train and practice and in the process come to discern their differences and connections! This note is meant as a modest aid to both the ant scout and the junior athlete.
33 As of December 7, 2017. Note that using the plural “subjective measures” returns an estimated 150,000.

ACAPS Note, Subjective measures in humanitarian analysis, January 2018
94
References Aldridge, H., P. Kenway, T. MacInnes and A. Parekh (2012). Monitoring poverty and social exclusion 2012. York, UK, Joseph Rowntree Foundation. Alkire, S., J. Foster, S. Seth, J. M. Roche and M. E. Santos (2015). Multidimensional poverty measurement and analysis, Oxford University Press, USA. Alkire, S. and G. Robles (2017) "Global Multidimensional Poverty Index 2017 [OPHI MPI Briefing 47]." from http://www.ophi.org.uk/wp-content/uploads/B47_Global_MPI_2017.pdf. Anand, S. and A. Sen (1994). Human Development Index: methodology and measurement. Human Development Occasional Papers (1992-2007), Human Development Report Office (HDRO), United Nations Development Programme (UNDP). AWG (2013). Joint Rapid Assessment of Northern Syria II. Final Report [22 May 2013], Assessment Working Group for Northern Syria. Ballard, T. J., A. W. Kepple and C. Cafiero (2013). The food insecurity experience scale: developing a global standard for monitoring hunger worldwide. Technical Paper. , . (available at http://www.fao.org/economic/ess/ess-fs/voices/en/). . Rome, FAO. Beegle, K., K. Himelein and M. Ravallion (2012). "Frame-of-reference bias in subjective welfare." Journal of Economic Behavior & Organization 81(2): 556-570. Benini, A. (2012). Composite measures. Their use in rapid needs assessments. Conceptual background and technical guidance. Geneva, Assessment Capacity Project (ACAPS). Benini, A. (2013). Severity and priority - Their measurement in rapid needs assessments Geneva, Assessment Capacity Project (ACAPS). Benini, A. (2016). Severity measures in humanitarian needs assessments - Purpose, measurement, integration. Technical note [8 August 2016]. Geneva, Assessment Capacities Project (ACAPS). Benini, A. and P. Chataigner (2014). Composite measures of local disaster impact-Lessons from Typhoon Yolanda, Philippines. Geneva, Assessment Capacity Project (ACAPS). Benini, A., M. R. Karim, M. A. Ali and S. M. F. Basher (2014). "I myself went to see the Chairman!"- Change in gender role attitudes in a water and sanitation project in northern Bangladesh. An analysis of DASCOH's Gender Analytical Framework data, 2011 - 2014. Rashahi and Sunamganj, Bangladesh, DASCOH - Development Association for Self-reliance, Communication and Health.

ACAPS Note, Subjective measures in humanitarian analysis, January 2018
95
Cantril, H. (1965). The Pattern of Human Concern. New Brunswick, Rutgers University Press. Carter, N. T., L. M. Kotrba, D. L. Diab, B. C. Lin, S. Y. Pui, C. J. Lake, M. A. Gillespie, M. J. Zickar and A. Chao (2012). "A Comparison of a Subjective and Statistical Method for Establishing Score Comparability in an Organizational Culture Survey." Journal of Business and Psychology 27(4): 451-466. Choi, S. (2008). "The incompleteness of dispositional predicates." Synthese 163(2): 157-174. Cojocaru, A. and M. F. Diagne (2013). How reliable and consistent are subjective measures of welfare in Europe and Central Asia? Evidence from the second life in transition survey [Policy Research Working Paper No. 6359]. Washington DC, The World Bank. Converse, J. M. and S. Presser (1986). Survey questions: Handcrafting the standardized questionnaire, Sage. Cope, J. R., S. Doocy, S. Frattaroli and J. McGready (2012). "Household expenditures as a measure of socioeconomic status among Iraqis displaced in Jordan and Syria." World health & population 14(1): 19-30. Daipha, P. (2015). Masters of Uncertainty: Weather Forecasters and the Quest for Ground Truth, University of Chicago Press. Dasgupta, A. (2014) "Systematic Measurement Error in Self-Reported Health: Is anchoring vignettes the way out? [MPRA Paper No. 58722]." from https://mpra.ub.uni-muenchen.de/58722/1/MPRA_paper_58722.pdf. Daston, L. and P. Galison (2007). Objectivity. Brooklyn NY, Zone Books. Davies, R. (2007). The 2006 Basic Necessities Survey (BNS) in Can Loc District, Ha Tinh Province, Vietnam. A report by the Pro Poor Centre {Draft for comment 26 January 2007]. Hanoi, Pro Poor Centre and ActionAid Vietnam. Davies, R. and W. Smith (1998). The Basic Necessities Survey - The experience of ActionAid Vietnam. Hanoi, ActionAid Vietnam. De Ayala, R. J. (2009). The theory and practice of item response theory. New York, Guilford Press. De Weerdt, J., K. Beegle, J. Friedman and J. Gibson (2016). "The Challenge of Measuring Hunger through Survey." Economic Development and Cultural Change 64(4): 727-758.

ACAPS Note, Subjective measures in humanitarian analysis, January 2018
96
Evans, J. S. B. T. (2008). "Dual-Processing Accounts of Reasoning, Judgment, and Social Cognition." Annual Review of Psychology 59(1): 255-278. Fahmy, E., E. Sutton and S. Pemberton (2015). "Are We All Agreed? Consensual Methods and the ‘Necessities of Life’ in the UK Today." Journal of Social Policy 44(3): 591-610. Falleti, T. G. and J. F. Lynch (2009). "Context and Causal Mechanisms in Political Analysis." Comparative Political Studies 42(9): 1143-1166. FAO (2016). Methods for estimating comparable rates of food insecurity experienced by adults throughout the world [Revised version] [Authors: Carlo Cafiero, Mark Nord, Sara Viviani, Mauro Eduardo Del Grossi, Terri Ballard, Anne Kepple, Meghan Miller, Chiamaka Nwosu]. Rome, United Nations Food and Agriculture Organization (FAO). Ferrer-i-Carbonell, A. and B. M. S. Van Praag (2001). "Poverty in Russia." Journal of Happiness Studies 2(2): 147-172. Filmer, D. and L. Pritchett (2001). "Estimating wealth effects without expenditure data – or tears: an application to educational enrollment in states of India." Demography 38: 115-132. Filmer, D. and K. Scott (2008). Assessing Asset Indices [Policy Research Working Paper no. 4605]. Washington DC, World Bank. Foster, J., J. Greer and E. Thorbecke (1984). "A Class of Decomposable Poverty Measures." Econometrica 52: 761-765. Foster, J., J. Greer and E. Thorbecke (2010). "The Foster–Greer–Thorbecke (FGT) poverty measures: 25 years later." The Journal of Economic Inequality 8(4): 491-524. Germain, S., P. Valois and B. Abdous (2007). eirt - Item Response Theory Assistant for Excel. Granberg-Rademacker, J. S. (2009). "An Algorithm for Converting Ordinal Scale Measurement Data to Interval/Ratio Scale." Educational and Psychological Measurement 70(1): 74-90. Grol-Prokopczyk, H., E. Verdes-Tennant, M. McEniry and M. Ispány (2015). "Promises and Pitfalls of Anchoring Vignettes in Health Survey Research." Demography 52(5): 1703-1728.

ACAPS Note, Subjective measures in humanitarian analysis, January 2018
97
Gundersen, C. and D. Ribar (2011). "FOOD INSECURITY AND INSUFFICIENCY AT LOW LEVELS OF FOOD EXPENDITURES." Review of Income and Wealth 57(4): 704-726. Hallerod, B. (1994). A new approach to the direct consensual measurement of poverty, Sprc, University of New South Wales. Hargreaves, J. R., L. A. Morison, J. S. S. Gear, M. B. Makhubele, J. D. H. Porter, J. Busza, C. Watts, J. C. Kim and P. M. Pronyk (2007). "“Hearing the Voices of the Poor”: Assigning Poverty Lines on the Basis of Local Perceptions of Poverty. A Quantitative Analysis of Qualitative Data from Participatory Wealth Ranking in Rural South Africa." World Development 35(2): 212-229. Hartland, J. (1996). "Automating Blood Pressure Measurements: The Division of Labour and the Transformation of Method." Social Studies of Science 26(1): 71-94. Headey, D. D. (2013). "The impact of the global food crisis on self-assessed food security." The World Bank Economic Review 27(1): 1-27. Hoffmann, N. and T. Metz (2017). "What Can the Capabilities Approach Learn from an Ubuntu Ethic? A Relational Approach to Development Theory." World Development 97: 153-164. Hopkins, D. J. and G. King (2010). "Improving anchoring vignettes: Designing surveys to correct interpersonal incomparability." Public Opinion Quarterly 74(2): 201-222. Hunt, S. M. and J. McEwen (1980). "The development of a subjective health indicator." Sociology of health & illness 2(3): 231-246. IPC Global Partners (2012). Integrated Food Security Phase Classification Technical Manual. Version 2.0. Evidence and Standards for Better Food Security Decision. Rome, FAO. Ippolito, M. (2013). "Counterfactuals and conditional questions under discussion." Semantics and Linguistic Theory 23: 194-211. Isaacs, J. and K. Rawlins (2008). "Conditional Questions." Journal of Semantics 25(3): 269-319. Johnson-Laird, P. N. and R. M. Byrne (2002). "Conditionals: a theory of meaning, pragmatics, and inference." Psychological review 109(4): 646-678. Jones, A. M., N. Rice, T. Bago D’Uva and S. Balia (2013). Applied Health Economics.
ACAPS Note, Subjective measures in humanitarian analysis, January 2018
98
Kahneman, D. and C. A. Varey (1990). "Propensities and counterfactuals: The loser that almost won." Journal of Personality and Social Psychology 59(6): 1101. Kankaraš, M., J. K. Vermunt and G. Moors (2011). "Measurement Equivalence of Ordinal Items: A Comparison of Factor Analytic, Item Response Theory, and Latent Class Approaches." Sociological Methods & Research 40(2): 279-310. King, G., C. J. L. Murray, J. A. Salomon and A. Tandon (2004). "Enhancing the validity and cross-cultural comparability of measurement in survey research." American Political Science Review 98(1): 191-207. Kingdon, G. G. and J. Knight (2006). "Subjective well-being poverty vs. Income poverty and capabilities poverty?" The Journal of Development Studies 42(7): 1199-1224. Kristensen, N. and N. Westergaard-Nielsen (2007). "Reliability of job satisfaction measures." Journal of Happiness Studies 8(2): 273-292. Lenzner, T. (2011). A psycholinguistic look at survey question design and response quality, Universität Mannheim. Magis, K. (2010). "Community Resilience: An Indicator of Social Sustainability." Society & Natural Resources 23(5): 401-416. McDowell, I. (2006). Measuring Health. A Guide to Rating Scales and Questionnaires. New York, Oxford Univerity Press Migotto, M., B. Davis, C. Carletto and K. Beegle (2007). Measuring Food Security Using Respondents’ Perception of Food Consumption Adequacy. Food Security: Indicators, Measurement, and the Impact of Trade Openness. B. Guha-Khasnobis, S. S. Archaya and B. Davis. Oxford, Oxford University Press. Morgan, S. L. and C. Winship (2014). Counterfactuals and causal inference, Cambridge University Press. Muller, J. and A. M. Almedom (2008). "What is “Famine Food”? Distinguishing Between Traditional Vegetables and Special Foods for Times of Hunger/Scarcity (Boumba, Niger)." Human Ecology 36(4): 599-607. Nandy, S. and M. Pomati (2015). "Applying the Consensual Method of Estimating Poverty in a Low Income African Setting." Social Indicators Research 124(3): 693-726. National Research Council (2014). Subjective well-being: Measuring happiness, suffering, and other dimensions of experience. Washington DC, National Academies Press.
ACAPS Note, Subjective measures in humanitarian analysis, January 2018
99
Nord, M., C. Cafiero and S. Viviani (2016). Methods for estimating comparable prevalence rates of food insecurity experienced by adults in 147 countries and areas. Journal of Physics: Conference Series, IOP Publishing. Okular Analytics (2017). Basic Needs & Response Analysis Framework Report. Pilot Assessment In and Around Informal IDPs Settlements in Borno State, Nigeria [June 2017]. Maiduguri and Geneva, Okular Analytics, with the participation and support from Save the Children UK, WFP and Plan International. Pacifico, D. and F. Poege (2017). "Estimating measures of multidimensional poverty in Stata." The STATA Journal 17(3): 687-703. Pérez-Escamilla, R., M. B. Gubert, B. Rogers and A. Hromi-Fiedler (2017). "Food security measurement and governance: Assessment of the usefulness of diverse food insecurity indicators for policy makers." Global Food Security 14(Supplement C): 96-104. Pradhan, M. and M. Ravallion (2000). "Measuring Poverty Using Qualitative Perceptions of Consumption Adequacy." The Review of Economics and Statistics 82(3): 462-471. Prettyman Jr, E. B. (1984). "The Supreme Court's use of hypothetical questions at oral argument." Catholic University Law Review 33(3): 555-591. Qizilbash, M. (2002). "A note on the measurement of poverty and vulnerability in the South African context." Journal of International Development 14(6): 757-772. Rabe-Hesketh, S. and A. Skrondal (2002). Estimating CHOPIT models in GLLAMM: political efficacy example from King et al.(2002). London and Oslo, Institute of Psychiatry, King's College and Division of Epidemiology, Norwegian Institute of Public Health. Ravallion, M. (2000). Identifying Welfare Effects from Subjective Questions. Policy Research Working Paper #2301. M. Lokshin. Washington DC, The World Bank: 37 pp. Ravallion, M. (2012). Poor, or Just Feeling Poor? On Using Subjective Data in Measuring Poverty [Policy Research working paper # 5968]. Washington DC, The World Bank. Ravallion, M., K. Himelein and K. Beegle (2013). Can Subjective Questions on Economic Welfare Be Trusted? Evidence for Three Developing Countries [Policy Research Working Paper 6726]. Washington DC, The World Bank. Roszkowski, M. J. and S. Spreat (2012). "You Name It: Comparing Holistic and Analytical Rating Methods of Eliciting Preferences in Naming an Online Program Using Ranks as a Concurrent Validity Criterion." International Journal of Technology and Educational Marketing (IJTEM) 2(1): 59-79.

ACAPS Note, Subjective measures in humanitarian analysis, January 2018
100
Samphantharak, K. and R. M. Townsend (2010). Households as corporate firms: an analysis of household finance using integrated household surveys and corporate financial accounting, Cambridge University Press. Sawatzky, R., P. A. Ratner, J. L. Johnson, J. A. Kopec and B. D. Zumbo (2010). "Self-reported physical and mental health status and quality of life in adolescents: a latent variable mediation model." Health and Quality of Life Outcomes 8(1): 17. Schoenherr, J. and R. Thomson (2008). Category Properties and the Category-Order Effect. Proceedings of the 30th Annual Meeting of the Cognitive Science Society. Semrau, M. (2013). Perceived Needs and Symptoms of Common Mental Disorder – Development and Use of the Humanitarian Emergency Settings Perceived Needs (HESPER) Scale Ph.D. thesis, King’s College London. Slade, M., G. Thornicroft, L. Loftus, M. Phelan and T. Wykes (1999). CAN: Camberwell assessment of need - A Comprehensive Needs Assessment Tool for People with Severe Mental Illness. London, Gaskell. Smith, M. D., M. P. Rabbitt and A. Coleman- Jensen (2017). "Who are the World’s Food Insecure? New Evidence from the Food and Agriculture Organization’s Food Insecurity Experience Scale." World Development 93: 402-412. Solt, F. (2016). "The Standardized World Income Inequality Database." Social Science Quarterly 97(5): 1267-1281. Streiner, D. L., G. R. Norman and J. Cairney (2015). Health measurement scales: a practical guide to their development and use, Oxford University Press, USA. Ukraine NGO Forum (2015). Ukraine Multi‐Sector Needs Assessment (MSNA) report [30 March 2015] Save the Children, Danish Refugee Council, HelpAge International, Norwegian Refugee Council, People in Need - with the collaboration of OCHA and with technical support by ACAPS. Van Praag, B., T. Goedhart and A. Kapteyn (1980). "The Poverty Line--A Pilot Survey in Europe." The Review of Economics and Statistics 62(3): 461-465. Van Praag, B. M. (1968). Individual welfare functions and consumer behavior: A theory of rational irrationality, North-Holland Pub. Co. Veenhoven, R. (2001) "Why social policy needs subjective indicators [WZB Discussion Paper, No. FS III 01-404]." from http://hdl.handle.net/10419/50182.

ACAPS Note, Subjective measures in humanitarian analysis, January 2018
101
Von Grebmer, K., A. Saltzman, E. Birol, D. Wiesman, N. Prasai, S. Yin, Y. Yohannes, P. Menon, J. Thompson and A. Sonntag (2016). 2016 Global Hunger Index: The challenge of hidden hunger. IFPRI books. Washington, DC/Dublin/Bonn, International Food Policy Research Institute, Concern Worldwide, Welthungerhilfe, and the United Nations. Wand, J. and G. King (2016). "Anchoring Vignetttes in R: A (different kind of) Vignette." Wand, J., G. King and O. Lau (2011). "Anchors: Software for anchoring vignette data." Journal of Statistical Software. Forthcoming, URL http://www. jstatsoft. org. Weijters, B., M. Geuens and N. Schillewaert (2009). "The proximity effect: The role of inter-item distance on reverse-item bias." International Journal of Research in Marketing 26(1): 2-12. Wells, T. (Undated). "Sen’s Capability Approach." Internet Encyclopedia of Philosophy (IEP) from http://www.iep.utm.edu/sen-cap/. WHO and King’s College London (2011). The Humanitarian Emergency Settings Perceived Needs Scale (HESPER): Manual with Scale. Geneva, World Health Organization. Wikipedia. (2011a). "Borda count." Retrieved 28 March 2011, from http://en.wikipedia.org/wiki/Borda_count. Wikipedia. (2011b). "Likert scale." Retrieved 28 October 2011, from http://en.wikipedia.org/wiki/Likert_scale. Wikipedia. (2013). "Rasch model." Retrieved 7 August 2013, from http://en.wikipedia.org/wiki/Rasch_scale. Wikipedia. (2014a). "Cronbach's alpha." Retrieved 12 June 2014, from https://en.wikipedia.org/wiki/Cronbach%27s_alpha. Wikipedia. (2014b). "Independence of irrelevant alternatives." Retrieved 25 April 2015, from http://en.wikipedia.org/wiki/Independence_of_irrelevant_alternatives. Wikipedia. (2016). "Polytomous Rasch model." Retrieved 24 May 2016, from https://en.wikipedia.org/wiki/Polytomous_Rasch_model. Wikipedia. (2017a). "Gross National Happiness." Retrieved 15 November 2017, from https://en.wikipedia.org/wiki/Gross_National_Happiness. Wikipedia. (2017b). "Item response theory." Retrieved 20 November 2017, from https://en.wikipedia.org/wiki/Item_response_theory.

ACAPS Note, Subjective measures in humanitarian analysis, January 2018
102
Wikipedia. (2017c). "Measurement invariance." Retrieved 23 September 2017, from https://en.wikipedia.org/wiki/Measurement_invariance. Wikipedia. (2017d). "Ordinal regression." Retrieved 6 October 2017, from https://en.wikipedia.org/wiki/Ordinal_regression. Wikipedia. (2017e). "Thought experiment." Retrieved 18 October 2017, from https://en.wikipedia.org/wiki/Thought_experiment. World Bank (2012). Liberia Poverty Note : Tracking the Dimensions of Poverty. Washington, DC, The World Bank. Wright, G., M. Noble and W. Magasela (2007). Towards a democratic definition of poverty: socially perceived necessities in South Africa. Cape Town, HSRC Press. Xu, K., F. Ravndal, D. B. Evans and G. Carrin (2009). "Assessing the reliability of household expenditure data: Results of the World Health Survey." Health Policy 91(3): 297-305.

ACAPS Note, Subjective measures in humanitarian analysis, January 2018
Subjetive measeures in humanitarian analysis
January 20178