
A Comparative Study of Wine Auction Prices-Mouton Rothschild Premier Cru Classé

Journal of Wine Economics,Volume 1, Number 1, Spring 2006, Pages 42–56
© The American Association of Wine Economists, 2006
What Determines Wine Prices: Objective vs. Sensory Characteristics*
Sébastien Lecocqa and Michael Visserb
Abstract
The hedonic technique is applied to wines. In the price equation we include objective characteris-tics appearing on the label, as well as sensory characteristics and a grade assigned by expert tasters.We have three almost identically structured data sets (two on Bordeaux wines, and one on Bur-gundy wines). The results are used to make comparisons between two of the most important wineregions in France, and comparisons over time (the two Bordeaux data sets are sampled at differentpoints in time). (JEL Classification: D49.)
Another puzzle is the lack of correlation between price and pleasure. Perhaps it is not so surpris-ing that a first-rate example of a little known wine can seem much more memorable than some-thing more famous selling at ten times the price; part of the thrill is the excitement of discovery andthe feeling of having beaten the system. What is more extraordinary is the wild price variation atthe very top end. Demand bubbles up mysteriously, apparently fuelled by fashion and rumour asmuch as by intrinsic quality.—Jancis Robinson, Confessions of a Wine Lover, Penguin Books,1997.
I. Introduction
There are many types and kinds of wines.1 Walking through an arbitrary supermarket, oneis impressed by the high number of different wines on the shelves. Whereas the number ofdifferent brands of say beer or whiskey that are on sale does usually not exceed ten or fif-teen, shoppers typically have the choice between hundreds or sometimes even thousands ofdifferent wines. The wines originate not only from the traditional wine countries such asFrance, Italy, and Spain, but also from new world countries such as Argentina, Australia,
*This paper was written while the first author was visiting the Department of Economics at University CollegeLondon. We would like to thank O. Ashenfelter, F. Etilé, V. Ginsburgh and an anonymous referee for their com-ments and suggestions.aInstitut National de la Recherche Agronomique (INRA), 65 boulevard de Brandebourg, 94205 Ivry Cedex,France. Email: [email protected], 48 boulevard Jourdan, 75014 Paris, France. Email: [email protected] writing this introduction, the wine survey that appeared in The Economist (1999) was very helpful.
JWE01-05.fm Page 42 Monday, April 24, 2006 10:45 AM

Sébastien Lecocq & Michael Visser 43
Chile, New Zealand, and the USA. These wine countries produce bottles that can cost just$2 (the simple and plain table wines) but also several hundreds of dollars (for the mostprestigious wines such as Bordeaux's Haut-Brion, Lafite-Rothschild, Latour, Margaux, andMouton-Rothschild; Romanée Conti from Burgundy; Grange, Australia's most famouswine; California's Opus One; Vega Sicilia from Spain; Brunello di Montalcino Riservafrom Italy, etc.), young wines that are ready to drink as well as wines that improve evenafter decades of keeping, wines that are made of different combinations and proportions ofgrape varieties, and wines that originate from various sorts of soils.
Given the huge variability in both the types of wines and their prices, it is of interest tounderstand how wine prices and wine characteristics are related: What are the preciseeffects of the features mentioned on the label of the bottle, such as vintage, name, or rank-ing? What are the consequences of weather conditions during the growing season? In whatway do natural endowments (type of soil, exposure of the vineyards) and technology (themanner in which grapes are picked, pressing and racking techniques, type of barrels inwhich the wine ferments, etc.) influence wine prices?
Also of interest is how the price of a bottle relates to its quality. Perhaps because thenotion of quality is in itself somewhat vague and imprecise, the price-quality debate hasalways been animated and controversial, with opponents firmly defending their points ofview. Some claim that price differences reflect quality differences very accurately, arguingthat consumers cannot be fooled all the time and that market forces adjust prices to levelsin accordance with quality levels. While this is perhaps true for the select group of topwines that are actively traded in auctions throughout the world (in which wine expertsintervene, so that indeed prices are likely to adapt more or less continuously to fluctuationsin quality), we feel that this argument is less convincing for the majority of wines that areless known: the sheer range and variety of products, the relative absence of information onthese wines (unlike for the very top wines, wine tasting sessions are rarely organized forthe less known ones), makes it likely that in this case prices are more rigid and less stronglycorrelated with quality.
At the other extreme, there are those who claim that there is basically hardly anyprice-quality relationship. While we do not completely adhere to this either, there is anec-dotal evidence that suggests that there is indeed something of a price puzzle. For instance,Ernest Gallo, the patriarch of the family-owned E&J Gallo Winery in California (the larg-est winemaker in the world), recalls how, in the early stages of his career, he once soldwine in New York. He offered a buyer two glasses of the same red wine, the buyer drankthe two glasses and asked for the prices of the "two" wines. Upon hearing that the first winecost 5 cents per bottle, and the second 10 cents, the buyer declared he wanted the 10 centsbottle. The message behind this anecdote is confirmed by many wine auctioneers who havenoticed that in the auction room higher wine prices act as a stimulant rather than as a deter-rent, thereby reflecting that for bidders, part of the pleasure is apparently to know that awine is famous and very expensive.
JWE01-05.fm Page 43 Monday, April 24, 2006 10:45 AM

44 What Determines Wine Prices: Objective vs. Sensory Characteristics
Other evidence that suggests that the price-quality relationship is far from perfect comesfrom the results of wine-tasting sessions. One famous wine-tasting session was organizedin San Francisco, in 1995. On the initiative of G. Getty, an American billionaire and loverof Bordeaux wine, ten of the most talented wine tasters were reunited to taste blindly asample of Bordeaux wines. The sample contained all the Médoc wines that were classifiedin 1855. In 1855, sixty one Médocs were ranked in five categories, and wine experts wereasked to establish a new classification (from one to sixty one). Although the reshuffling didnot turn out to be dramatic (for instance, the four first-category wines are still in the top fif-teen), the 1855 and 1995 rankings were certainly not identical (for instance, onefifth-growth wine can be found among the top ten). Given the prices that these wines fetchat today's auctions are pretty well ordered the same way as the 1855 ordering (Di Vittorioand Ginsburgh, 1996), and interpreting the 1995 ranking as a quality ranking, the San Fran-cisco tasting reflects a disparity between quality and price. This type of result is also foundin tasting-sessions in which non-experts evaluate the wines. When non-experts blind-tastecheap and expensive wines they typically tend to prefer the cheaper ones.2
Many papers look at the determinants of prices, reporting estimation results of so-calledhedonic price functions where wine prices are regressed on a set of characteristics in orderto determine which characteristics have a significant effect. In what is probably the earliestarticle on the subject, Oczkowski (1994) applies the method to Australian table wine andincludes in the set of characteristics attributes that are objective and easily observable forthe consumer (vintage, vineyard region, grape variety), and also the grades that are pub-lished in a popular Australian wine guide. Grades are measured on a five-point scale, andintroducing dummy variables for the five levels, Oczkowski shows that, as expected, wineprices increase with the rating level. Ashenfelter, Ashmore, and Lalonde (1995) (for Bor-deaux wines) and Byron and Ashenfelter (1995) (for Australian wines) consider as charac-teristics vintage and weather conditions that prevailed during the growing season, andshow that these variables alone explain more than 80% of the price variation in their sam-ples. Ginsburgh, Monzak, and Monzak (1994) apply the hedonic price method to a sampleof Médoc wines. Their fascinating data set allows them to disentangle the price effects ofweather, reputation (as measured by the 1855 classification), natural endowments (soil,exposure of the vineyards or grapes), and all sorts of production factors. They show thattechnology and weather conditions explain two thirds of the price variation, and once thereputation variable is added the proportion of explained variance increases to almost 85%.They also show that more recent classifications (such as Parker's classification) do not leadto a better fit of the hedonic price equation than the 1855 classification. Di Vittorio andGinsburgh (1996) regress auction prices of Haut-Médoc wines on the vintage and the nameof the château. The estimated hedonic function allows them to calculate, for each châteauand vintage, a price index, and these price indices are compared with several classifications(Parker; Tastet and Lawton; Wine Spectator).
2Unlike blind-taste evaluations of whiskies, where usually the more expensive brands are the preferred ones (seeThe Economist, 1999).
JWE01-05.fm Page 44 Monday, April 24, 2006 10:45 AM

Sébastien Lecocq & Michael Visser 45
Gergaud (1998) applies the hedonic technique to Champagne wines. He finds that theprice of Champagne varies significantly with producer characteristics and the appellationof the wine. His estimations also suggest that neither the sensory variables nor the gradeassigned by wine connoisseurs matter in the price determination of Champagne. Lima(1999) examines the prices of Californian wines and uses medals won in nine tasting eventsin 1995 as indices of quality. Regressing prices on dummy variables for the four possiblemedals (double gold, gold, silver, and bronze), he finds that the San Francisco Fair is thebest predictor for California's wine prices. Schamel and Anderson (2001) estimate hedonicprice functions for premium wine from Australia and New Zealand, including as indepen-dent variables the ratings compiled in Halliday's wine guide and an Australian wine maga-zine called Winestate, regional dummies and the grape varieties of the wines. Exploitingthe time-series aspect of their data (the observations cover the period from 1992 to 2000),the authors study how the effects of these variables evolve over time. Their results showthat the effect of the ratings remains fairly constant over time. The relative implicit pricesof grape varieties do vary, and price differences between regions tend to increase in the latenineties.
Jones and Storchmann (2001) use wine auction prices for twenty one prestigious Bor-deaux wines to assess the respective effects of the vintage, the grape composition (acid andsugar levels), and expert-assessed quality (as measured by Parker-points). The authors dis-tinguish Merlot-dominated and Cabernet Sauvignon-dominated wines. The effect of theParker-point rating is stronger for the latter ones. In addition, the price of Merlot-domi-nated wines increases more rapidly with age.
Finally, Oczkowski (2001) estimates a hedonic equation for Australian wines and con-siders the effects of some objective characteristics (red wine or not, old vintage or not), aquality index (a score assigned to the wine based on the International Show Judging Sys-tem that allocates 50 percent of the score for palate, 35 percent for nose and 15 percent forcolor), and a reputation index (a score reflecting the long-term quality over numerous vin-tages).3 He argues that the quality and reputation variables are measured with error. Cor-recting for measurement errors, he finds that reputation has a significant impact but that theeffect of quality is insignificant.
The present paper contributes to this literature. We report estimation results of hedonicprice equations based on three data sets. The first one (Bordeaux I) is a sample of Bordeauxwines and formed the basis of the paper by Combris, Lecocq and Visser (1997); the secondone (Burgundy) is a sample of Burgundy wines and was exploited in Combris, Lecocq andVisser (2000); the third and most recent data set is another sample of Bordeaux wines (Bor-deaux II) and was analyzed in Lecocq and Visser (2001). The three data sets were gener-ated in almost exactly the same way, and all three contain the same set of variables. Theresults can thus easily be used to make comparisons between two of the most important
3See also Landon and Smith (1997, 1998) who estimate similar equations for Bordeaux wines using short-termlagged quality scores as a measure of reputation.
JWE01-05.fm Page 45 Monday, April 24, 2006 10:45 AM

46 What Determines Wine Prices: Objective vs. Sensory Characteristics
wine regions in France (Bordeaux and Burgundy), and to make comparisons over time (theBordeaux I sample is drawn in 1992, and the Bordeaux II sample in 2000).
For each wine in the three samples we observe the price and the following objectivecharacteristics: name, color, ranking, appellation, and vintage. The wines in the three sam-ples were blind-tasted by expert tasters who were required to record their olfactory (aro-matic intensity, finesse of aromas, etc.) and gustatory findings (firmness of attack,suppleness, presence of fine tannins, etc.). These variables will be referred to as sensorycharacteristics. The experts were also requested to assign a grade between 0 and 20 to eachwine, a measure that we will interpret as a measure of quality.
As in the studies described above, our objective is to determine which variables signif-icantly affect the price of Bordeaux and Burgundy wines. At this point it is important tonote that our measure of quality differs in several important ways from the quality indicesused in the previous literature. First, the wines were evaluated via blind-tasting sessions.Unlike the grades compiled in wine guides or magazines, the wine experts assigned theirgrades without being influenced by the name of the wine, its price or its ranking. Second,since the wines were purchased before the tasting sessions, the grades were unknown whenthe wine prices were established.4 Therefore, it is our feeling that our measure of qualityreflects in a better way the pure intrinsic effect of quality on prices, and not an effect thatis biased by reputation or publicity factors.
The paper proceeds as follows. The next section presents the data, section 3 gives theempirical results, and section 4 concludes.
II. The Data
This section describes the essential ingredients of our three data sets. For more detailswe refer to the papers by Combris, Lecocq and Visser (1997, 2000), and Lecocq and Visser(2001).
The data sets come from three very similar experimental studies conducted by the Insti-tut National de la Consommation (INC), and published in 60 Millions de Consommateurs(December 1992 for the Bordeaux I sample, November 1993 for the Burgundy sample, andOctober/November 2001 for the Bordeaux II sample). The samples were randomlyselected. The INC agents bought all the wines anonymously directly from the producers.This circumvents a bias that is present in wine tasting events organized by (even famous)
4In the previous literature, there is generally a time lag between the moment the grades are attributed and themoment the wine prices are established. For instance in Jones and Storchmann (2001), the wine prices are theprices fetched at auctions in 1996/1997, whereas the quality index is the Parker-rating of these wines publishedin 1994/1995. The reported estimated effect of the Parker-rating therefore reflects not only a direct quality effect(Parker's opinion on the wine), but also an indirect publicity effect, which is not necessarily related to quality butwhich measures instead how Parker-points modify consumers' purchase behavior and wine producers' pricestrategy.
JWE01-05.fm Page 46 Monday, April 24, 2006 10:45 AM

Sébastien Lecocq & Michael Visser 47
guides, where wine producers select specially prepared samples for the contest. Wineswere tasted and evaluated by independent wine experts. This avoids the lack of objectivityof some wine guides often sponsored by wine producers where the editor, possibly assistedby a team of colleagues, evaluates the wines.
In the Bordeaux I sample, 519 wines were evaluated; in the Burgundy sample, 613wines and in the Bordeaux II sample, 255 wines. In each case the wines were evaluated bya jury of 4 or 5 experts. After tasting a wine, each jury member was asked to write downhis personal technical comments concerned with olfactory findings (aromatic intensity,finesse and complexity of aromas), gustatory findings (firmness of attack, suppleness, flat-ness, fat, harmony of components, finish, etc.) as well as some general remarks about alco-hol level, need for keeping, etc. A synthesis of these comments is published by 60 Millionsde Consommateurs, which leads to the sensory wine characteristics that we use. Eachmember also assigned a grade between 0 and 20 to the wines he tasted. 60 Millions de Con-sommateurs only publishes the average of these grades. This average grade will be referredto as the jury grade and constitutes our measure of wine quality. There is also informationabout the name, color, ranking,5 vintage, and (in the case of Bordeaux) appellation. Theseare objective wine characteristics. Finally, the data record the prices at which the bottleswere purchased.
The list of variables and some descriptive statistics are given in Appendix 1.
III. Empirical Results
In the hedonic price equations, the dependent variable is the logarithm of the price of abottle of wine, the explanatory variables are the jury grade (i.e. the average of the individ-ual grades) and the objective and sensory variables defined above. Table 1 presents Ordi-nary Least Squares (OLS) estimates. To facilitate the comparison of the differentvariable-effects, the reported estimates are the “β-coefficients.”6 The overall fit of thehedonic price equations is relatively good since the corrected s range from 0.606 to0.634. Given the large number of explanatory variables and the absence of theory as towhich variable should be kept, we use a stepwise procedure to select the variables that aresignificant at the 5% level. The final set of selected variables is the same whether we use abackward procedure or a forward procedure.
R2
5In the case of the two Bordeaux samples the three possible levels are cru and grand cru classé, cru bourgeois, orcru non classé; in the case of the Burgundy sample the four possible levels are AOC grand cru, AOC premier cru,AOC communale, or AOC régionale.6β-coefficients can be interpreted as regression coefficients that would have been obtained had the regressorsbeen standardized (zero mean and unit variance). Their magnitude can thus be used to measure the relative con-tribution of each regressor (see Goldberger, 1964, pp. 197-198).
JWE01-05.fm Page 47 Monday, April 24, 2006 10:45 AM

48 What Determines Wine Prices: Objective vs. Sensory Characteristics
Nine variables are selected in the two Bordeaux equations and six in the Burgundyequation. It is remarkable that among the nine selected variables in the hedonic price equa-tion for the Bordeaux I (and Bordeaux II, resp.) sample, only one (or two, resp.) belongs tothe set of sensory variables. In the Burgundy equation, two out of six are sensory variables,but their effect is considerably smaller than the effect of the objective variables.7 This sug-gests that the price of Bordeaux and Burgundy is essentially determined by objective char-acteristics (ranking, vintage and appellation) that are easily identifiable by all consumers.A possible explanation for this result could be that sensory characteristics are only avail-able through tasting, learning and the reading of guides. For consumers it may then be lessexpensive to make purchase decisions primarily on the basis of the information displayedon the label, which causes most of the sensory variables to be insignificant.
The jury grade has a positive and significant impact on prices. Yet this impact is consid-erably smaller than the impact of any objective variable. As the jury grade seems a priori a
Table 1Hedonic Price Equations
Bordeaux I Bordeaux II Burgundy
Jury grade 0.081 (0.007) 0.090 (0.018) 0.110 (0.010)Sensory variables
Firmness of attack -0.108 (0.098)Well concentrated 0.055 (0.063)Needs keeping 0.097 (0.041) 0.169 (0.056) 0.070 (0.030)
Objective variablesRanking 0.309 (0.030) 0.232 (0.045) 0.650 (0.017)Vintages
1989 0.580 (0.074)1990 0.413 (0.077) 0.258 (0.043)1991 0.195 (0.040)1996 0.646 (0.099)1997 0.451 (0.119)1998 0.388 (0.118)
Bordeaux groupsBordeaux -0.326 (0.052) -0.366 (0.091)Côtes -0.203 (0.050) -0.280 (0.083)St-Emilion Pom. Fr. 0.138 (0.042)Blancs doux 0.128 (0.073)
Constant 1.799 (0.228) 1.694 (0.452) 1.771 (0.167)0.634 0.633 0.606
Notes: Reported estimates are β-coefficients; standard errors in parentheses; since we are running stepwise regressions, the only coefficientsgiven in the table are those which are significantly different from zero.
R2
7Given that jury grades are highly correlated with sensory characteristics, one might wonder whether the presenceof the former prevent the latter to enter the hedonic price equations. To verify this possibility, we performed thesame estimations excluding grades from the set of explanatory variables. The fat variable for the Bordeaux IIsample and the excessive acidity and fat variables for the Burgundy sample were the only sensory characteristicsto become significant.
JWE01-05.fm Page 48 Monday, April 24, 2006 10:45 AM

Sébastien Lecocq & Michael Visser 49
reasonable measure of quality, one might have expected this variable to have a moreimportant influence on prices. There are at least two types of explanations for the smallcorrelation between price and average tasting grade.
In the first explanation it is argued that the jury members essentially agree on the qualityof the wine but make evaluation errors in determining the precise quality level. The jurygrade is then the sum of the intrinsic quality level plus the average of expert-specific eval-uation errors. In this setup the jury grade is, therefore, a measure of quality which is con-taminated by measurement errors. More formally, let i = 1,…, N be the index of wines, j =1,…, J the index of expert tasters and gij the grade assigned to wine i by expert j. Theexpert-specific grade gij can be decomposed as gij = qi + εij, where qi is a component com-mon to all tasters representing the quality level of wine i and an error term εij with zeromean reflecting the judgment error made by jury member j. The true relationship betweenprice pi and quality qi is assumed to be
pi = α + Xiβ + γqi + νi
with νi independent of Xi and qi. In the data we do not observe qi but only the average ofgrades (the jury grade)
The estimated hedonic price equation is therefore
(1)
where Since ui is correlated with , OLS of equation (1) leadsto biased estimates. Using the fact that individual grades are observed in Bordeaux II,8 wecan, however, determine the magnitude of the bias affecting the estimate of γ in our threesamples.9 This is shown in the appendix for the case β = 0 and Ji= J.
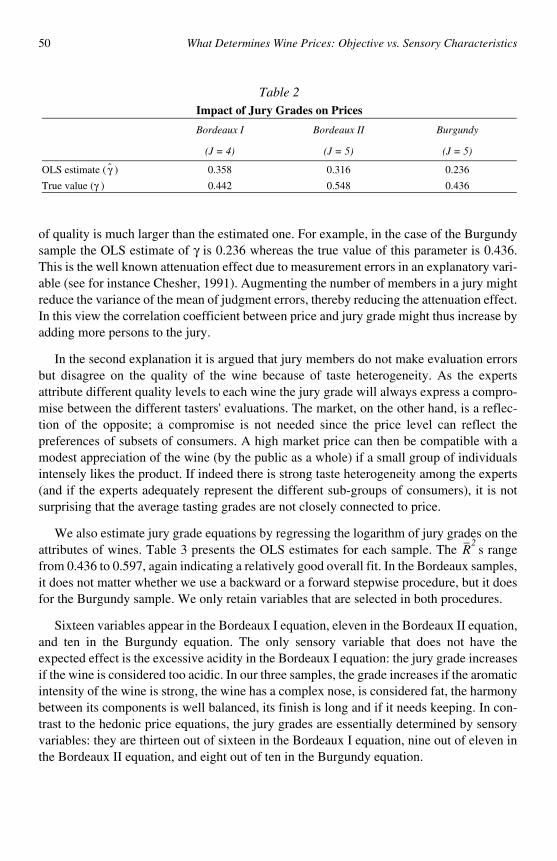
Table 2 reports the estimate of γ before correction for measurement errors (OLS ofequation 1) and its true value (i.e. the true impact of quality on price). The results show thatthe bias is important when the average grade is used as a proxy for quality: the true impact
pi α Xiβ γgi ui+ + +=
gi
8Unlike the Bordeaux I and Burgundy data sets, in which only the average grades are available, the Bordeaux IIdata set also records the expert-specific grades. These were directly obtained by us from INC.9The idea is to estimate the variance of εij on the Bordeaux II sample and to use it to assess the bias in all threesamples, assuming that the dispersion of judgment errors does not differ across samples.
JWE01-05.fm Page 49 Monday, April 24, 2006 10:45 AM
50 What Determines Wine Prices: Objective vs. Sensory Characteristics
of quality is much larger than the estimated one. For example, in the case of the Burgundysample the OLS estimate of γ is 0.236 whereas the true value of this parameter is 0.436.This is the well known attenuation effect due to measurement errors in an explanatory vari-able (see for instance Chesher, 1991). Augmenting the number of members in a jury mightreduce the variance of the mean of judgment errors, thereby reducing the attenuation effect.In this view the correlation coefficient between price and jury grade might thus increase byadding more persons to the jury.
In the second explanation it is argued that jury members do not make evaluation errorsbut disagree on the quality of the wine because of taste heterogeneity. As the expertsattribute different quality levels to each wine the jury grade will always express a compro-mise between the different tasters' evaluations. The market, on the other hand, is a reflec-tion of the opposite; a compromise is not needed since the price level can reflect thepreferences of subsets of consumers. A high market price can then be compatible with amodest appreciation of the wine (by the public as a whole) if a small group of individualsintensely likes the product. If indeed there is strong taste heterogeneity among the experts(and if the experts adequately represent the different sub-groups of consumers), it is notsurprising that the average tasting grades are not closely connected to price.
We also estimate jury grade equations by regressing the logarithm of jury grades on theattributes of wines. Table 3 presents the OLS estimates for each sample. The s rangefrom 0.436 to 0.597, again indicating a relatively good overall fit. In the Bordeaux samples,it does not matter whether we use a backward or a forward stepwise procedure, but it doesfor the Burgundy sample. We only retain variables that are selected in both procedures.
Sixteen variables appear in the Bordeaux I equation, eleven in the Bordeaux II equation,and ten in the Burgundy equation. The only sensory variable that does not have theexpected effect is the excessive acidity in the Bordeaux I equation: the jury grade increasesif the wine is considered too acidic. In our three samples, the grade increases if the aromaticintensity of the wine is strong, the wine has a complex nose, is considered fat, the harmonybetween its components is well balanced, its finish is long and if it needs keeping. In con-trast to the hedonic price equations, the jury grades are essentially determined by sensoryvariables: they are thirteen out of sixteen in the Bordeaux I equation, nine out of eleven inthe Bordeaux II equation, and eight out of ten in the Burgundy equation.
Table 2Impact of Jury Grades on Prices
Bordeaux I Bordeaux II Burgundy
(J = 4) (J = 5) (J = 5)
OLS estimate ( ) 0.358 0.316 0.236
True value (γ ) 0.442 0.548 0.436
γ̂
R2
JWE01-05.fm Page 50 Monday, April 24, 2006 10:45 AM

Sébastien Lecocq & Michael Visser 51
But the most interesting result is that ranking has a considerable impact on jury gradesfor Burgundy, whereas it is statistically not significant for Bordeaux wines. This result isnot really surprising. In Bordeaux (and particularly in the Médoc region), the classificationis old (1855) and the established hierarchy of châteaux does not reflect that the size andshape of vineyards have changed over time. The Burgundy classification, based on thecadastral survey, seems to be less rigid than its Bordeaux counterpart since approval tastingsessions are held each year and serve as the basis for authorizing (or not) a wine to be soldunder its appellation class. If a wine loses class membership in a particular year it may beauthorized to join a lower appellation class.
Table 3Jury Grade Equations
Bordeaux I Bordeaux II Burgundy
Sensory variablesAromatic intensity 0.176 (0.006) 0.109 (0.004) 0.329 (0.007)Finesse of aromas 0.115 (0.019) 0.105 (0.013)Complexity 0.133 (0.018) 0.183 (0.012) 0.094 (0.011)Firmness of attack 0.073 (0.018)Excessive acidity 0.081 (0.021)Suppleness 0.096 (0.016)Flatness -0.170 (0.032) -0.063 (0.034)Fat 0.126 (0.016) 0.142 (0.012) 0.071 (0.011)Well concentrated 0.100 (0.021)Harmony 0.290 (0.011) 0.319 (0.009) 0.349 (0.007)Fine tannins 0.065 (0.018) 0.106 (0.018)Finish 0.303 (0.015) 0.430 (0.007) 0.138 (0.003)Traces of staleness -0.086 (0.015)Touch of reduction -0.060 (0.038)Needs keeping 0.210 (0.018) 0.207 (0.011) 0.186 (0.009)
Objective variablesRanking 0.117 (0.005)White -0.107 (0.020)Vintages
1990 0.080 (0.017)1991 -0.182 (0.008)
Bordeaux groupsCôtes -0.147 (0.016)St-Emilion Pom. Fr. 0.144 (0.018) 0.164 (0.010)
Constant 1.284 (0.099) 2.202 (0.060) 2.301 (0.051)0.597 0.594 0.436
Notes: Reported estimates are β-coefficients; standard errors in parentheses; since we are running stepwise regressions, the only coefficients given inthe table are those which are significantly different from zero.
R2
JWE01-05.fm Page 51 Monday, April 24, 2006 10:45 AM

52 What Determines Wine Prices: Objective vs. Sensory Characteristics
IV. Conclusion
In this paper we apply the hedonic technique to wines. In the price equation we includeobjective characteristics appearing on the label, as well as sensory characteristics and qual-ity, as measured by expert tasters. We use three almost identically structured data sets (twoon Bordeaux wines, and one on Burgundy wines), which enable us to make comparisonsbetween two of the most important French wine regions and comparisons over time (thetwo Bordeaux data sets are sampled at different points in time).
Our results indicate that characteristics that are directly revealed to the consumer uponinspection of the bottle and its label (ranking, vintage and appellation) explain the majorpart of price differences. Sensory variables do not appear to play an important role. Out ofsome fifteen sensory characteristics, only two or three have a significant impact in thehedonic price equation.
Wine prices are also hardly affected by the grades assigned by professional wine tasters.Although jury grades have a significant effect, their impact on prices is very small com-pared to the impact of ranking and vintage. This is surprising given that the jury gradeseems a reasonable measure of quality. A possible explanation for this result is that the jurygrade is an imperfect measure of quality due to measurement errors in the expert-specificgrades. Our most recent data set (Bordeaux II) allows to correct for these measurementerrors (see section 3), and our results suggest that the true effect of quality is much largerthan previously thought.
We also find that the jury grade, unlike the price, is primarily determined by sensorycharacteristics: only one fifth of the variables that have a significant influence on the jurygrade equations are objective variables. Furthermore, ranking has no significant effect inthe Bordeaux equations, but does significantly affect grades for Burgundy wines, a resultthat can be explained by the different classification systems used in the two wine-growingregions.
It would be interesting to check whether the findings reported in this paper are typicalfor Bordeaux and Burgundy wines, or whether they also hold for other regions and coun-tries. In a comment on the Combris, Lecocq and Visser (1997) paper, Brown (1999) uses asample of premium California wines to estimate a hedonic price equation and a jury gradeequation. Unlike the results of our hedonic price equations, many sensory characteristics ofCalifornia wines (six out of thirteen) do have a significant impact on prices. The results forthis jury grade equation are, however, more in line with ours in that the appreciation ofwine experts is essentially determined by sensory variables.
References
Ashenfelter, O., Ashmore, D., and Lalonde, R. (1995). Bordeaux wine vintage quality and theweather. Chance, 8, 7-14.
JWE01-05.fm Page 52 Monday, April 24, 2006 10:45 AM

Sébastien Lecocq & Michael Visser 53
Brown, D.M. (1999). Estimation of a hedonic price equation for Bordeaux wine: Does quality mat-ter? A comment. Mimeo, Georgetown University.
Byron, R.P. and Ashenfelter, O. (1995). Predicting the quality of an unborn grange. EconomicRecord, 71, 40-53.
Chesher, A.D. (1991). The effect of measurement errors. Biometrika, 78, 451-462.Combris, P., Lecocq, S., and Visser, M. (1997). Estimation of a hedonic price equation for Bordeaux
wine: does quality matter? Economic Journal, 107, 390-402.Combris, P., Lecocq, S., and Visser, M. (2000). Estimation of a hedonic price equation for Burgundy
wine. Applied Economics, 32, 961-967.Di Vittorio, A. and Ginsburgh, V. (1996). Des enchères comme révélateurs du classement des vins.
Journal de la Société Statistique de Paris, 137, 19-49.Gergaud, O. (1998). Estimation d'une fonction de prix hédonistiques pour le vin de Champagne.
Economie et Prévision, 136, 93-105.Ginsburgh, V., Monzak, M., and Monzak, A. (1994). Red wines of Medoc: what is wine tasting
worth? Verona: Vineyard Data Quantification Society.Goldberger, A. (1964). Econometric Theory. New York: Wiley & Sons.Jones, G.V. and Storchmann, K. H. (2001). Wine market prices and investment under uncertainty: an
econometric model for Bordeaux crus classés. Agricultural Economics, 26, 115-133.Landon, S. and Smith, C.E. (1997). The use of quality and reputation indicators by consumers: the
case of Bordeaux wine. Journal of Consumer Policy, 20, 289-323.Landon, S. and Smith, C.E. (1998). Quality expectations, reputation and price. Southern Economic
Journal, 64, 628-647.Lecocq, S. and Visser, M. (2001). Is the average of expert tasters' grades a good price predictor?
Mimeo, INRA-CORELA.Lima, T. (1999). Price and quality in the California wine industry: an empirical investigation. Mimeo,
California State University.Maddala, G.S. (1977). Econometrics. Economics Handbook Series. New York: McGraw-Hill.Oczkowski, E. (1994). A hedonic price function for Australian premium wine. Australian Journal of
Agricultural Economics, 38, 93-110.Oczkowski, E. (2001). Hedonic wine price functions and measurement error. Economic Record, 77,
374-382.Schamel, G. and Anderson, K. (2001). Wine quality and varietal, regional and winery reputations:
hedonic prices for Australia and New Zealand. CIES Discussion Paper 0103, Adelaide Univer-sity.
The Economist (1999). The globe in a glass, wine survey, December 1999, 97-115.
JWE01-05.fm Page 53 Monday, April 24, 2006 10:45 AM

54 What Determines Wine Prices: Objective vs. Sensory Characteristics
Appendix 1
Descriptive StatisticsVariables Modalities Bordeaux I Bordeaux II Burgundy
Price Continuous 52.78 (31.05) 69.10 (43.75) 55.82 (32.69)Jury grade Continuous 11.21 (2.41) 12.93 (1.37) 12.59 (1.44)Sensory characteristics
Olfactory examinationAromatic intensity Strong 45.08 43.69 56.68
Classic 32.64 33.98 32.35Discrete 22.28 22.33 13.97
Finesse of aromas Yes/No 15.61 13.73 15.01Complexity Yes/No 23.70 16.08 15.33
Gustatory examinationFirmness of attack Yes/No 19.85 5.49 3.43Excessive acidity Yes/No 13.87 2.35 6.36Suppleness Yes/No 28.90 18.04 9.30Flatness Yes/No 8.29 1.96 1.31Fat Plump 17.34 10.59 7.50
Medium 79.19 84.70 87.28Lean 3.47 4.71 5.22
Well concentrated Yes/No 19.08 6.67 4.08Harmony Perfect 18.69 0.00 15.17
Balanced 50.29 49.41 61.99Unbalanced 31.02 50.59 22.84
Fine tannins Yes/No 19.08 6.67 3.59Finish Long 34.20 51.46 57.35
Medium 50.78 13.59 25.00Short 15.02 34.95 17.65
General remarksAlcohol excess Yes/No 15.41 13.33 6.69Traces of staleness Yes/No 10.60 9.41 7.50Touch of reduction Yes/No 3.47 0.00 0.65Needs keeping Yes/No 29.87 23.14 28.87
Objective characteristicsRanking
Bordeaux Cru classé 6.74 5.10Cru bourgeois 9.25 12.55Cru non classé 84.01 82.35
Burgundy AOC grand cru 1.80AOC premier cru 23.00AOC communale 40.29AOC régionale 34.91
Red wine Yes/No 82.08 81.57 60.85White wine Yes/No 17.92 18.43 39.15
JWE01-05.fm Page 54 Monday, April 24, 2006 10:45 AM

Sébastien Lecocq & Michael Visser 55
Appendix 2
Let and . Since in the Bordeaux II sample we observe all
the expert-specific grades gij, the variance can be estimated by
, (A1)
where N is the number of observations in Bordeaux II.
Consider the case β = 0 and suppose that Ji= J for all i. The probability limit of the OLSestimate is (the calculation is similar as in Maddala, 1977, p. 293)
.
Descriptive Statistics (cont.)Variables Modalities Bordeaux I Bordeaux II Burgundy
Vintages1989 Yes/No 61.661990 Yes/No 33.33 30.831991 Yes/No 5.01 55.951992 Yes/No 13.211996 Yes/No 59.611997 Yes/No 8.631998 Yes/No 25.881999 Yes/No 5.88
Bordeaux groupsBordeaux Yes/No 15.99 16.47Côtes Yes/No 15.22 9.02Médoc and Graves Yes/No 20.81 29.02St-Emilion Pomerol Fronsac Yes/No 30.06 27.06Blancs secs Yes/No 12.91 11.37Blancs doux Yes/No 5.01 7.06
Number of observations 519 255 613
Note: The three last columns contain the mean and standard deviation (in parentheses) for continuous variables, and the share of observations for eachmodality for discrete variables.
σε2 Var εij( )= σq
2 Var qi( )=
σε2
γ̂
JWE01-05.fm Page 55 Monday, April 24, 2006 10:45 AM

56 What Determines Wine Prices: Objective vs. Sensory Characteristics
So the true value γ is approximately equal to
. (A2)
Under the assumption that is identical in our three samples, the true value of γ can be
determined for each of them using (A2), (A1) and the fact that .
σε2
JWE01-05.fm Page 56 Monday, April 24, 2006 10:45 AM


![Untitled-1 []crafted from Spain's flagship red wine grape Tempranillo. The grapes for this wine are all grown On the winery's estate. Then the wine is aged for 1 year in oak. all prices](https://static.fdocuments.net/doc/165x107/5fe7cb7d9992bc7340053253/untitled-1-crafted-from-spains-flagship-red-wine-grape-tempranillo-the-grapes.jpg)


![Chapter 17 Pricing Objectives and Policies. Pricing Strategy Determines 1] How flexible prices will be 2] At what level prices will be set over the Product.](https://static.fdocuments.net/doc/165x107/56649f595503460f94c7eab7/chapter-17-pricing-objectives-and-policies-pricing-strategy-determines-1.jpg)