Wine ScoreCard 2016–17 - Department of Primary ...€¦ · lower volumes of wine grapes, on...
13
Wine ScoreCard 2016–17 PRIMARY INDUSTRIES AND REGIONS SOUTH AUSTRALIA
Transcript of Wine ScoreCard 2016–17 - Department of Primary ...€¦ · lower volumes of wine grapes, on...

Wine ScoreCard 2016–17PRIMARY INDUSTRIES AND REGIONS SOUTH AUSTRALIA

WINE SCORECARD 2016-172
Wine ScoreCard 2016–17 © Government of South Australia 2017
DISCLAIMER
PIRSA and its employees do not warrant or make any representation regarding the use, or results of the use, of the information contained herein as regards to its correctness, accuracy, reliability and currency or otherwise. PIRSA and its employees expressly disclaim all liability or responsibility to any person using the information or advice.
ALL ENQUIRIES
Steve Welfare
Primary Industries and Regions SA (PIRSA) Level 15, 25 Grenfell StreetGPO Box 1671, Adelaide SA 5001T +61 8 8429 0450E [email protected]

WINE SCORECARD 2016-17 3
Contents1. Wine ScoreCard 2016-17 Results 4
1.1. Gross Wine Revenue (GWR) – grew to $2.35 billion 5
1.2. Grape production farmgate value – $658 million 5
1.3. Wine processing value – $2.3 billion 8
1.4. Overseas trade – key destinations for South Australian wine exports 9
2. SUMMARY AND OUTLOOK 10
3. GLOSSARY OF TERMS 11

WINE SCORECARD 2016-174
To track the advances in the South Australian food and wine industries, Primary Industries and Regions South Australia (PIRSA) has developed a series of industry ScoreCards, which provide detailed value chain measures of annual performance. This report outlines the 2016–17 performance for South Australia’s wine industry.
1.WINE SCORECARD 2016–17 RESULTSIn 2016–17 South Australian Gross Wine Revenue (GWR) reflects the growth occurring within the wine industry.
Key indicators of the South Australian Wine ScoreCard for 2016–17 include:
• Gross Wine Revenue grew to $2.35 billion, an increase of $240 million in 2016–17.
• Volume of grapes produced increased (6%), with a 13% rise in farmgate value to $658 million.
• South Australian winemakers produced 612 million litres worth $2.3 billion.
• Overseas exports increased by 38 million litres to 510 million litres, with the value increasing by $140 million (11%) to $1.47 billion1.
Gross Wine Revenue (GWR) in 2015–16 has continued in 2016–17. The South Australian GWR grew $240 million or (11%) over the year. Table 1 shows the values occurred along the value chain, while Table 2 demonstrates volumes of grapes produced and wine exported.
Table 1: South Australian Wine ScoreCard – value chain – change over the year to 2016–17, value $ million
1. Farm gate value
of grape production
2. Wholesale value of wine
made
3. Overseas
exports
4. Interstate sales
and change in stocks
5. Retail and hospitality
consumption
Gross wine revenue
(sum of 3 to 5)
2016–17 658 2 300 1 475 221 661 2 357
Change over year
77 401 140 10 90 240
% Change over year
13% 21% 11% 5% 16% 11%
Note: Numbers have been rounded and discrepancies may occur between sums of the component number and totals.
Table 2: South Australian Wine ScoreCard change over the year to 2016–17, volume
Grape production(tonnes)
Wine making (million litres)
Overseas exports (million litres)
Interstate trade & change in stocks
(million litres)
2016–17 863 789 612 510 59
Change over year 45 889 32 38 -5
% change over year 6% 6% 8% -8%
Note: Numbers have been rounded and discrepancies may occur between sums of the component number and totals.
1 Export and import values are based on ABS Trade data (unpublished) using detailed 8 digit Australian Harmonised Export Commodity Code data. Note: slight differences in values
between the ABS wine export data and other sources may be possible from time to time.
WINE SCORECARD 2016-17 5
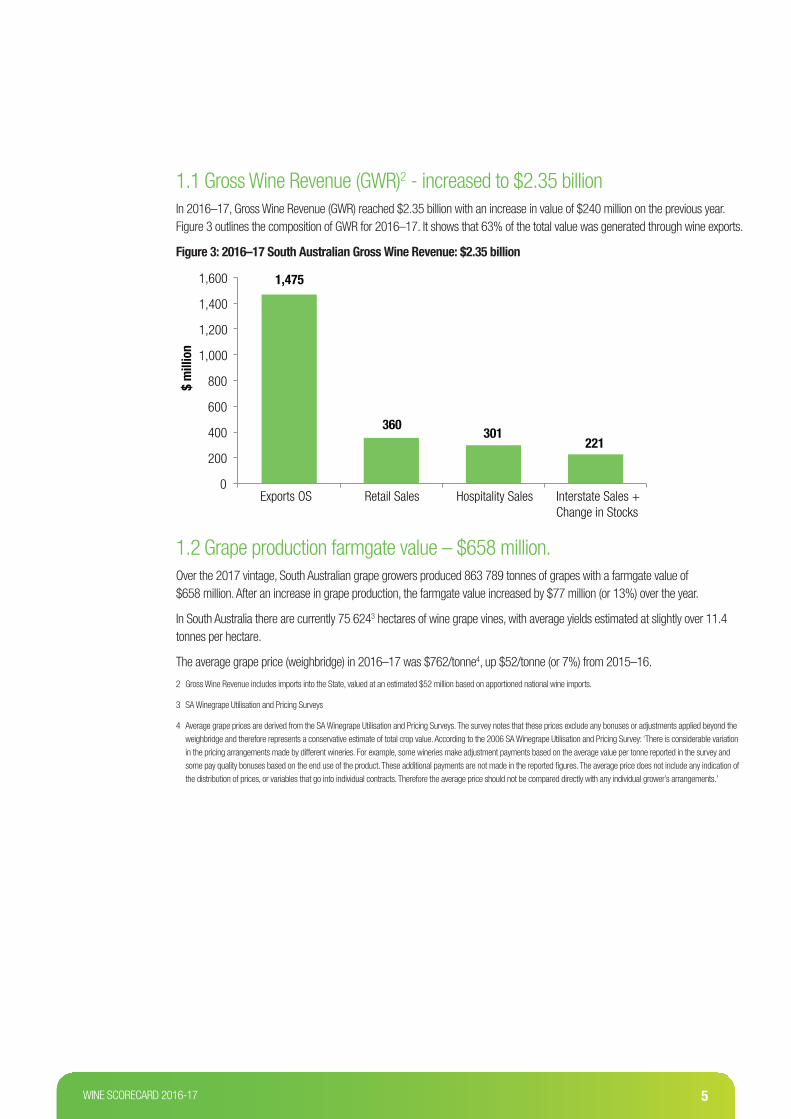
1.1 Gross Wine Revenue (GWR)2 - increased to $2.35 billion In 2016–17, Gross Wine Revenue (GWR) reached $2.35 billion with an increase in value of $240 million on the previous year. Figure 3 outlines the composition of GWR for 2016–17. It shows that 63% of the total value was generated through wine exports.
Figure 3: 2016–17 South Australian Gross Wine Revenue: $2.35 billion
0
200
400
600
800
1,000
1,200
1,400
1,600
Exports OS Retail Sales Hospitality Sales Interstate Sales + Change in Stocks
$ m
illio
n
1,475
360301
221
1.2 Grape production farmgate value – $658 million.Over the 2017 vintage, South Australian grape growers produced 863 789 tonnes of grapes with a farmgate value of $658 million. After an increase in grape production, the farmgate value increased by $77 million (or 13%) over the year.
In South Australia there are currently 75 6243 hectares of wine grape vines, with average yields estimated at slightly over 11.4 tonnes per hectare.
The average grape price (weighbridge) in 2016–17 was $762/tonne4, up $52/tonne (or 7%) from 2015–16.
2 Gross Wine Revenue includes imports into the State, valued at an estimated $52 million based on apportioned national wine imports.
3 SA Winegrape Utilisation and Pricing Surveys
4 Average grape prices are derived from the SA Winegrape Utilisation and Pricing Surveys. The survey notes that these prices exclude any bonuses or adjustments applied beyond the
weighbridge and therefore represents a conservative estimate of total crop value. According to the 2006 SA Winegrape Utilisation and Pricing Survey: ‘There is considerable variation
in the pricing arrangements made by different wineries. For example, some wineries make adjustment payments based on the average value per tonne reported in the survey and
some pay quality bonuses based on the end use of the product. These additional payments are not made in the reported figures. The average price does not include any indication of
the distribution of prices, or variables that go into individual contracts. Therefore the average price should not be compared directly with any individual grower’s arrangements.’

WINE SCORECARD 2016-176
Figure 4 shows there has been a steady increase in the farmgate value and volume of grapes in recent years.
Figure 4: Volume and value of South Australian grape production, 2001–02 to 2016–17
- 100 200 300 400 500 600 700 800 900
1,000 20
01-0
2
2002
-03
2003
-04
2004
-05
2005
-06
2006
-07
2007
-08
2008
-09
2009
-10
2010
-11
2011
-12
2012
-13
2013
-14
2014
-15
2015
-16
2016
-17
Volume '000 tonnes Value $ million
Figure 5 below highlights the change in average South Australian grape prices from 2001–02 to 2016–2017. While still below the price of a decade ago, the average price in 2016–17 exceeds the lows experienced five or six years ago. It should be noted that Figure 5 only reflects the average price and not some of the premiums that are being achieved in some regions.
Figure 5: (farmgate), $/tonne, 2001–02 to 2016–17 (nominal)
400
500
600
700
800
900
1,000
1,100
1,200
2001
-02
2002
-03
2003
-04
2004
-05
2005
-06
2006
-07
2007
-08
2008
-09
2009
-10
2010
-11
2011
-12
2012
-13
2013
-14
2014
-15
2015
-16
2016
-17
$/To
nne

WINE SCORECARD 2016-17 7
South Australia’s wine grape production is divided between six Geographical Indicator (GI) zones. Figure 6 shows both the volumes and values of production across the state, with most production volume associated with the Lower Murray region at 54% of the total volume of wine grapes. However, values are more evenly distributed across the six zones ranging from the Lower Murray with 25% to the Barossa with 26% of the total production value respectively. This reflects that while the Barossa produces lower volumes of wine grapes, on average producers receive higher prices for these grapes.
Figure 6: South Australian wine grape production by region, 2016–17 – Volumes and Values
-
50
100
150
200
250
300
350
400
450
500
Lower Murray
Fleurieu Limestone Coast
Barossa Mount Lofty Ranges
Other
Volume Value
Volu
me
('000
s to
nnes
) Va
lue
($ m
illio
n)

WINE SCORECARD 2016-178
1.3 Wine processing value – $2.3 billionIn 2016–17, the wholesale value of wine produced in South Australia increased by $401 million (21%) to $2.3 billion.5
Figure 7 highlights the trend in the wholesale value for wine produced in South Australia and what portion of this value was bulk and bottled wine. Over the past three years the value for wine produced in South Australia has continued to increase, indicating the current vibrancy of the wine industry. The wholesale value of bottled wine has increased by $802 million since 2013–14 to reach $2.1 billion in 2016–17.
Figure 7: South Australia’s total processed wine value, 2001–02 to 2016–17
-
500
1,000
1,500
2,000
2,500
3,000
2001
-02
2002
-03
2003
-04
2004
-05
2005
-06
2006
-07
2007
-08
2008
-09
2009
-10
2010
-11
2011
-12
2012
-13
2013
-14
2014
-15
2015
-16
2016
-17
$ m
illio
n
145
2166
435
1925
403
2219
408
1948
260
1483
268
2260
242
1771
230
1317
202
1176
215
1237
257
1441
237.
7913
58
205
1387
237
1661
140
2161
208
2313
Bottled Bulk

WINE SCORECARD 2016-17 9
1.4 Overseas trade – key destinations for South Australian wine exportsFigure 8 depicts the leading destinations of wine exported from South Australia during 2016–17. South Australia exported wine to 111 countries, down from 116 countries in 2015–16. China (including Hong Kong), the United Kingdom (UK), the United States of America (USA), Canada and New Zealand are the key export destinations for South Australian wine, comprising more than three quarters (76%) of the total South Australian wine export value.
Figure 8: Top ten overseas destinations for South Australian wine exports, 2016–17
0100200300400500600
Chin
a &
Hong
Kon
g
Unite
d Ki
ngdo
m
Unite
d St
ates
Cana
da
New
Zea
land
Neth
erla
nds
Sing
apor
e
Mal
aysi
a
Germ
any
Japa
n
$ m
illio
n
South Australia’s value of wine exports increased by $140 million (11%) to $1.47 billion. Wine exports, comprising 13% of total South Australian merchandise trade, remain a significant contributor to achieving the South Australia’s Strategic Plan (SASP) Target No. 37 to increase the value of South Australia’s export income to $25 billion by 2020.
The value of wine exports to China and Hong Kong increased by $130 million or 36%, and exports to the United States of America increased by 3%. The value of wine exports to the United Kingdom market declined by 11% and exports to the Canadian market declined by 7%.
In 2016–17, around 6.9 million litres of wine worth $52 million was imported into South Australia6 from overseas. This represents a 10% increase in the volume of imports over the year and a 1% increase in the value of overseas wine imports.
5 ABS Trade Data, unpublished. Imports are derived using national wine imports (volumes and values) apportioned on a population share basis.

WINE SCORECARD 2016-1710
2. SUMMARY AND OUTLOOKThe total reported crush of South Australian wine grapes in 2017 grew by 6% and the South Australian Gross Wine Revenue increased by $240 million from the previous year. The fourth consecutive rise in the average purchase price of wine grapes is a positive development for South Australia’s wine grape growers and a sign that supply and demand for wine grapes is now in balance.
Wine exports enjoyed strong growth in 2016–17, with the value of wine exports to China and Hong Kong increasing by 36% to be South Australia’s highest valued wine export market, while the value of exports to Japan grew by 11%. These two markets have continued to grow since the signing of Free Trade Agreements and are likely to continue to grow as tariffs come down. Other emerging export markets for South Australian wine such as Malaysia, South Korea and Taiwan have seen excellent positive growth at premium price points.
Adelaide’s appointment to the Great Wine Capitals Global Network in June 2016 is an acknowledgement of our excellence in grape and wine production, commitment to research and development, education and wine tourism services, and the way in which the wine industry is inextricably linked to the state’s character, success and vision.
The South Australian Wine Industry Development Scheme (SAWIDS) is supporting ongoing growth in the state’s wine sector and cementing South Australia’s reputation as a producer of premium wine. The scheme also ensures that the benefits of our membership of the Great Wine Capital Global Network will flow across the state – promoting our regions on the international stage.
WINE SCORECARD 2016-17 11
3. GLOSSARY OF TERMSFarmgate
This measures the value of a commodity at the local level of production, which is known as farmgate. Farmgate value is calculated by multiplying the volume of production by the price received. This represents the value of production to the farmer or fisher person.
Differentiated and finished food value
This measures food which have been value added as well as foods which have been processed at their highest level of processing in South Australia. Finished foods may be minimally or highly processed and the value is represented by their wholesale price into the retail or export markets.
Wine value (measured in wholesale prices)
This measures the value of wines that are processed at their highest level of processing in South Australia. The value is represented by their wholesale price into the retail or export markets.
Wine retail sales
Wine retail sales measures the value of wine sales made through all retail stores including supermarkets and grocery stores, hotels and liquor retailing.
Wine service sales
Wine service sales measures the value of sales of wines through restaurants, hotels, and tourism operations within South Australia. The calculation estimates the percentage of total sales that occur through these outlets. Prices used in this calculation are usually higher than those used at the retail level.
Free on Board (FOB)
Free on Board (FOB) is the price of a commodity or product received by a supplier, including all costs incurred in getting the commodity or product to the port of departure, at which point the buyer takes responsibility of the costs.
Gross revenue
An aggregate measure of revenue that includes international and interstate wine exports and the value of wine retail and service sales contributing to the South Australian economy. It is calculated by taking the sum of overseas export value (commodity and processed), interstate trade value (commodity and processed), wine retail sales and wine service sales. Gross revenue can be used in reference to wine, or food and wine combined.

WINE SCORECARD 2016-1712
Interstate sales – commodity and finished food
This represents the difference in the value of goods exported interstate from those imported from interstate. A positive value represents net interstate exports – for example exports exceed imports. A negative value represents net interstate imports – for instance, imports exceed exports.
Overseas commodity exports
This measures the value of overseas exports of agricultural commodities sold overseas by South Australian firms, calculated by using free on board prices. Commodity exports are products that have a minimal change from their natural form – for example, live animals or bulk grain.
Overseas imports – commodity or finished food
This measures the value of either agriculture commodities or wine that is purchased from overseas. Import volumes and values are quantified at their South Australian landed value (at the port of shipment).
Overseas wine exports
This measures the value of overseas exports of wine products sold overseas by South Australian firms, calculated by using free on board prices. Wine exports are commodities that have had further value added from the point of production.
Primary activity
Primary activity refers to primary production activity, which refers to the various activities within the agriculture, food manufacturing sectors i.e. poultry farming or dairy cattle farming.
South Australia’s Strategic Plan (SASP)
South Australia’s Strategic Plan (SASP) guides individuals, community organisations, governments and businesses to secure the wellbeing of all South Australians. South Australia’s Strategic Plan contains the state’s visions and goals and its 100 measurable targets reflect our priorities. SASP identifies priorities for South Australia.
Value chain measures
Value chain measures include all measures or indicators that are used along the value chain from the farmgate through the chain to the final point of sale.

WINE SCORECARD 2016-17 13
Wine ScoreCard 2016–17 © Government of South Australia 2017
Primary Industries and Regions South Australia Level 14, Grenfell Centre 25 Grenfell Street Adelaide 5000 South Australia T: +61 8 8226 0900 www.pir.sa.gov.au