Westport Public Schools - CMS...
70
Westport Public Schools Enrollment Projections & Elementary Capacity Analysis June 12, 2017
Transcript of Westport Public Schools - CMS...

Westport Public SchoolsEnrollment Projections & Elementary Capacity Analysis
June 12, 2017

Contents• Demographic & Population Profile
• Housing Trends
• Student Enrollment Trends & Projections
• Elementary & Middle School Trends & Projections
• Capacity Analysis
2

Population
• Westport’s current population is estimated at 27,343 per the 2015 American Community Survey (ACS)
• This estimate is 3.6% above Westport’s last Decennial Census population count of 26,391, indicating growth of 952 persons since 2010
3
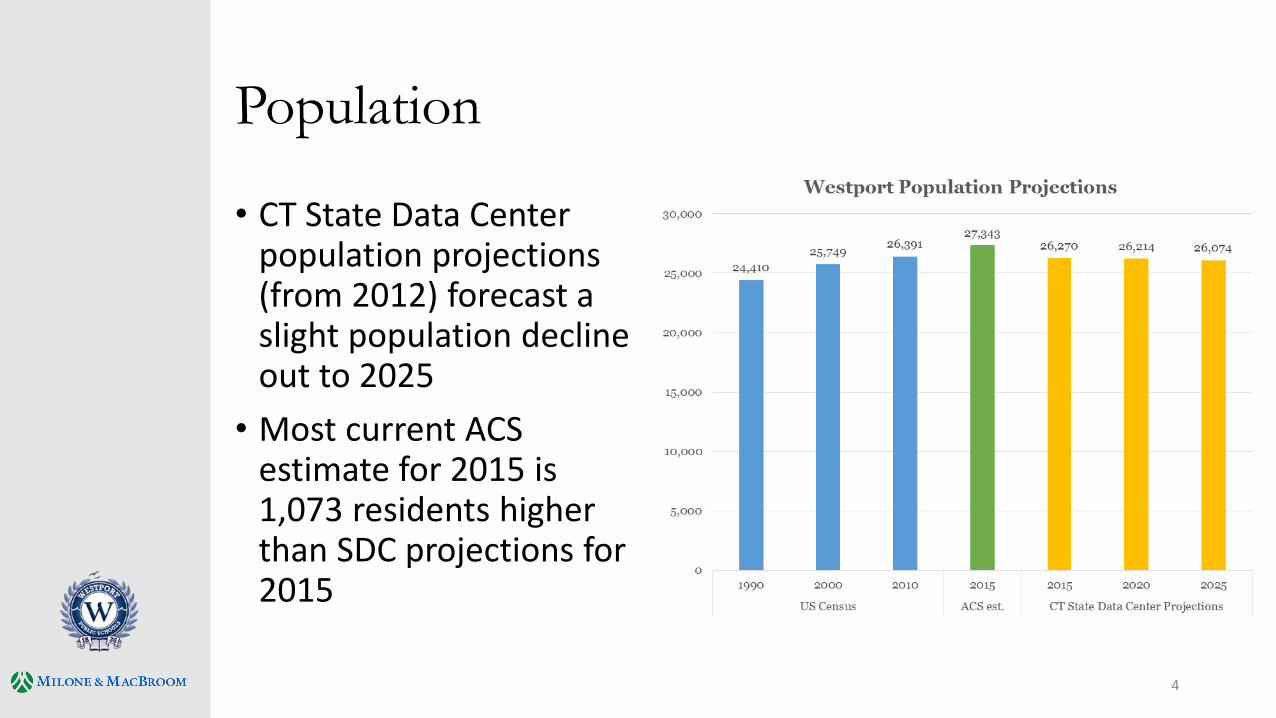
Population
• CT State Data Center population projections (from 2012) forecast a slight population decline out to 2025
• Most current ACS estimate for 2015 is 1,073 residents higher than SDC projections for 2015
4

Population
• Population is most densely concentrated in: • The Compo Point area south of
I-95
• The Long Lots area between Long Lots Road and I-95
• The eastern shore of the Saugatuck River between Route 15 and I-95
5

Population
• Broadly, the northeast section of Westport (Long Lots and Coleytown districts) has the largest number of total households.
6

Population
• However, this area is experiencing a slight loss in households over time
• The area west of the Saugatuck River and north of Rte 1, and the southeast section of Westport are experiencing the greatest rate of growth over time
7

Population
• This trend is shown as well in different demographic subgroups
• While the northeast section has experienced a 2.2% decline in total households, the population of school-aged children has declined 7.9% in the same area
8

Population
• Northeast area (east of Saugatuck River and north of Rt. 1) has also seen a decline of 4% in women of child-bearing age (18 to 44)• Town-wide, this population has
grown 4% from 2010 but remains down 23% from 2000
9

Demographics
• Declines in school-age children and younger families vs. a growing older population can be seen in Westport’s population structure
• Westport’s median age has risen from 41.4 in 2000 to 44.6 in 2010 and further increased to 45.1 per ACS 2015 estimates
10

Demographics
• Growth in homeowners over 65 years of age in Kings Highway, Greens Farms, and southern Saugatuck neighborhoods a leading indicator of potential housing turnover towards younger homebuyers with children
11

Demographics
• Total number of households has been roughly stable since 2000
• Greatest change is an increase of householders aged 65+ living alone
• Average family size up slightly from 2000
HOUSEHOLDS BY TYPE 2000 2010 2015 est.
% Change
2000-2010
% Change
2010-2015
Total households 9,586 9,573 9,740 -0.1% 1.7%
Family households (families) 7,166 7,233 7,380 0.9% 2.0%
With own children under 18 years 3,684 3,941 3,868 7.0% -1.9%
Nonfamily households 2,420 2,340 2,360 -3.3% 0.9%
Householder living alone 1,994 1,990 1,938 -0.2% -2.6%
Householder 65 years and over 848 989 1,062 16.6% 7.3%
Average household size 2.7 2.7 2.8 2.6% 1.8%
Average family size 3.1 3.2 3.2 3.2% 0.6%
12

Unemployment Trends
• Westport rates of unemployment have consistently remained well below both CT and NYC metro area averages
13

Journey to Work
• Census aggregation of job locations shows 53% of residents commuting locally or to NYC, Norwalk, or Stamford
• Local economy tied to NYC metro and Lower Fairfield County
14

Journey to Work
• Availability of commuter rail provides Westport residents with strong access to Manhattan and other shoreline employment centers
15

Births
• Births in Westport have been declining, reflecting a CT and national trend
• Large influence of the aging Baby Boom generation, and a trend toward later family formation and fewer children per family
• 2015 and 2016 births are preliminary totals and may be adjusted by DPH based on out-of-state data
16

Births
• Over the past ten years, Kings Highway and Saugatuck have experienced larger shares (23-24%) of townwide births, while Coleytown has had the smallest share (15%)
• King’s Highway experienced marked birth decline from 2014 to 2015
17

Scenario High Medium Low
Local Unemployment 3.2% - 3.7% 3.5% - 3.7% 3.9% - 4.5%
Home Sales 386 - 450 376 - 400 350 - 366
Births 179 - 220 175 - 192 163 - 172
Birth Projections
• Births typically correlate well with measures of local/regional unemployment and housing market activity from the recent past
• Developed multiple regression model to predict future births based on current and lagged sales and local unemployment rate for high, medium, and low-growth scenarios
• Good model fit (R2 = 0.983) and significance (F < 0.001)
18
Regression Equation:
BirthsY = (UEY * 8.42) + (UEY-2 * -17.79) + (SalesY *
0.49) + (SalesY-2 * 0.08)

Birth Projections
19
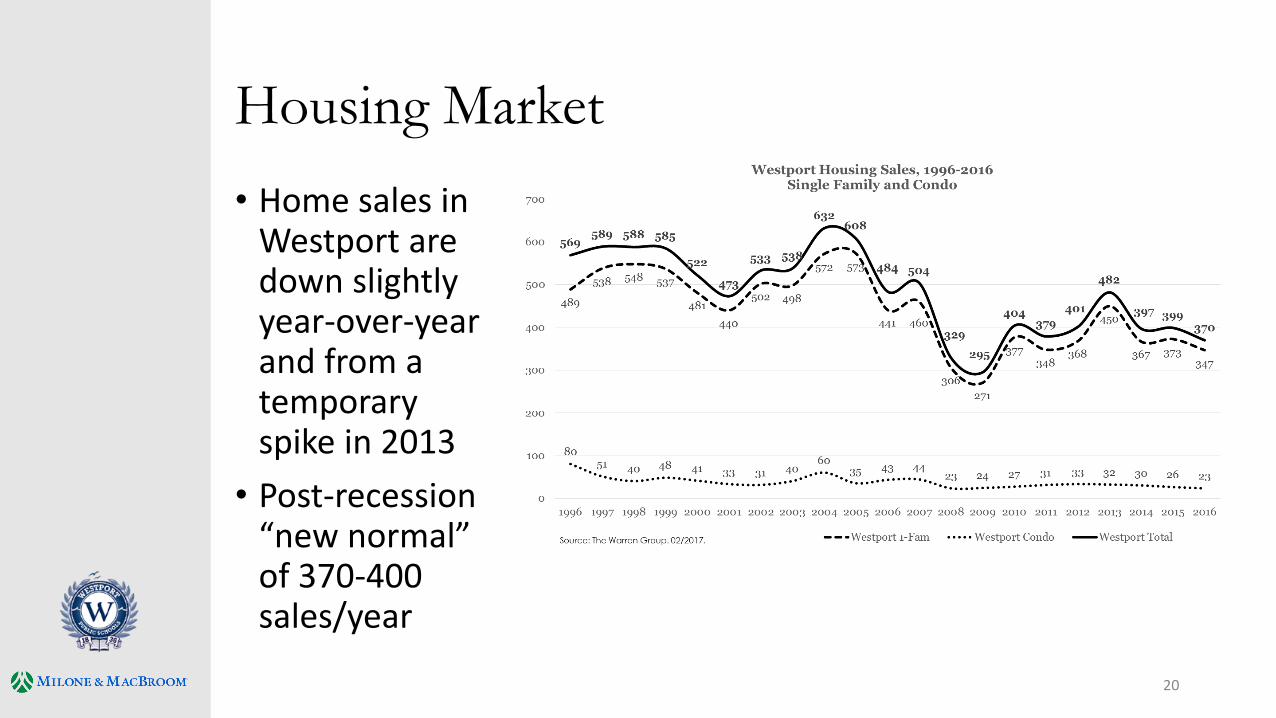
Housing Market
• Home sales in Westport are down slightly year-over-year and from a temporary spike in 2013
• Post-recession “new normal” of 370-400 sales/year
20

Housing Market
• Median sales prices have been steady since 2013 at $1.1 -$1.2M
• 2016 also had 53 sales in the $2-3M group
• Higher-end homes typically take longer to sell (3+ years for a $3M home)
21

Housing Market
• Discussion with local Board of Realtors representative (Cheryl Scott-Daniels) noted substantial uncertainty in the market driven by political climate and corporate relocations –challenging to forecast market in 2017 and beyond
• Buyers heavily weighted towards families with young children• Higher price points: NYC-driven (Brooklyn in particular)
• Lower price points: in-state moves
• Greater challenges in moving large, high-maintenance properties vs. stronger market for high-amenity locations (views, walkable, near train station and highway) and new construction
22

Housing Market
• Real estate market observations (Realtor Judy Szablak)• 2016 experienced a slower market than in recent years
• Promising prognosis for Q2 2017
• Large inventory of high-end homes ($3-5M and up) with long average times on the market
• Current POCD outreach efforts have brought attention to perceived out-of-scale rebuilding of existing homes as an issue to be monitored/addressed
23

Housing Trends
• 2014 was a peak year for new construction• 163 housing permits
• 99 demolitions
• 64 new units on net
• Teardown/rebuilds predominate in a largely built-out community: in 9 of the past 12 years, Westport has had near-zero or negative net growth in housing stock
24

Teardown Activity
• Greatest teardown/ new build activity in Greens Farms, Long Lots
• Primarily replacement of more modest 1940s-1970s homes with new homes 5-6 bedroom and larger
• 276 current PK-12 students matched to demolition + single family permits issued since 2012
25

Teardown Activity
• At the elementary and middle school levels, a larger share of students are generated by teardown activity in the Long Lots, Greens Farms, and Saugatuck areas
• Of the 276 students tied to recent teardowns in 2016-17, only 22% (60 students) are new to the district
26
2012 2013 2014 2015 2016
New to District 9 17 17 12 5 60
All Students 54 110 74 30 8 276
% New to Dist. 17% 15% 23% 40% 63% 22%
Students Attributable to Teardowns: New vs. In-Town Moves
(2016-17 School Year)
Student Type
Year Built
Total

Teardown Activity
• Teardown and new build activity that generates students is most tightly clustered east of Downtown Westport and along Route 1 and north into Long Lots neighborhoods
27

Housing Market
• In 2016, Greens Farm and Long Lots school districts had the largest share of home sales
• Share of sales in Kings Highway and Coleytown school districts have fallen, and sales in Saugatuck have risen
28Note: by-district home sales totals differ slightly from town-wide totals due to differences in reporting methodology.

Housing Market & Student Migration
• Matching of known home sales to students entering the system (unique ID not present in prior year) yields an estimate of students generated from housing turnover
• 92 students entered in 2016-17 matched to a sale in the prior year, most at the elementary level
• Over the past four years, an average of 104 students can be tied to prior-year sales
29

Student Migration
• Not all student migration is attributable to home sales—also affected by rentals, movement in/out of non-WPS schools, family moves without home sales, etc.
• Comparing in- and out-migration shows consistent net positive effect at elementary and middle grades
30
Y ears 1-5 6-8 9-12
In-Migration 169 7 2 7 0
Out-Migration 110 65 7 7
Net Im pact 59 7 -7
In-Migration 156 7 4 7 0
Out-Migration 103 61 67
Net Im pact 53 13 3
In-Migration 17 1 61 86
Out-Migration 102 52 7 4
Net Im pact 69 9 12
In-Migration 188 84 7 9
Out-Migration 104 7 1 99
Net Im pact 84 13 -20
Average Net Impact: 66 11 -3
Net Year-to-Year Districtwide Migration
Grade Grouping
2015-16 to
2016-17
2014-15 to
2015-16
2013-14 to
2014-15
2012-13 to
2013-14

Internal Migration
• At the elementary and middle school level, an average of 27 existing students moved between Westport schools each year over the past four years
31
School
Student
Moves Out
Student
Moves In Net Change
Greens Farms 16 28 12
Kings Highway 25 14 -11
Long Lots 15 27 12
Coleytown Elem. 14 19 5
Saugatuck 28 10 -18
Bedford 4 6 2
Coleytown Middle 6 4 -2
Elementary and Middle Grade Internal Student Moves,
2013-14 to 2016-17
Middle
Elementary
• Pattern of more movement out of Saugatuck and Kings Highway, and into Greens Farms and Long Lots
• Limited movement at the middle school level

Current & Historic Enrollments
• Westport’s overall enrollment rose from ~5,000 students (K-12) in the early 2000s to a steady 5,700 (±50) during the post-Recession era
• The past few years have seen a downward trend driven primarily by declining K-5 enrollment
32

Current & Historic Enrollments
• K-5 enrollment declined slightly in early 2000s, held steady at ~2,550 students through 2010-11, and has fallen by over 240 students in the six following years
33

Current & Historic Enrollments
• Declines in elementary enrollment have been concentrated in Coleytown, Green’s Farms, and Long Lots attendance zones
• Saugatuck remained high through post-Recession period, but dipped sharply in 2016-17
• King’s Highway dipped post-Recession but has rebounded and held steady in the past few years
34

Current & Historic Enrollments
• 6-8 enrollment experienced strong growth in the early and mid-2000s and early 2010s, with small downward adjustments in the post-Recession period and 2015-16
35

Current & Historic Enrollments
• Enrollment growth in the early 2000s was more pronounced at Bedford than Coleytown
• The impact of smaller entering K cohorts has not yet reached Westport’s middle schools
36

Current & Historic Enrollments
• Westport has experienced sustained and robust growth in high school enrollment from 2001-02 to 2012-13
• Staples has held steady for the last four years in the ~1,850 student range
37

Current & Historic Enrollments
• Examination of historic record shows declining size of entering cohorts beginning in 2011-12 (from average of 390 down to 350)
• Positive migration in elementary grades followed by net neutral migration through middle and high school grade levels
School
Year
Birth
YearBirths K 1 2 3 4 5 6 7 8 9 10 11 12 PK
2001-02 1996 357 418 447 433 467 422 433 396 394 342 354 329 273 270 29
2002-03 1997 326 388 442 442 430 464 415 421 404 397 350 346 319 268 40
2003-04 1998 309 369 412 439 446 422 464 416 413 395 404 337 344 314 49
2004-05 1999 314 375 396 430 435 445 412 465 403 410 387 400 327 344 51
2005-06 2000 335 414 400 410 438 438 452 427 480 412 420 389 392 321 55
2006-07 2001 281 379 443 415 435 434 439 461 419 490 406 426 384 380 59
2007-08 2002 296 370 418 460 424 443 438 448 464 430 487 413 433 388 56
2008-09 2003 301 408 412 430 465 433 435 449 445 471 437 484 411 429 56
2009-10 2004 259 377 430 405 442 464 421 448 444 445 466 435 474 410 56
2010-11 2005 261 392 402 441 421 462 446 436 445 443 463 467 433 469 52
2011-12 2006 228 355 400 421 442 430 473 461 436 456 464 461 471 428 39
2012-13 2007 191 364 387 421 431 451 438 479 462 439 477 468 468 466 46
2013-14 2008 219 365 387 398 435 450 461 446 484 461 442 475 463 454 41
2014-15 2009 168 343 390 408 412 449 439 467 445 489 472 441 478 463 54
2015-16 2010 192 346 346 405 419 423 455 439 468 456 492 476 437 477 50
2016-17 2011 176 327 372 361 421 413 428 450 451 469 464 492 467 430 54
State Department of Education - CeDar Enrollment Reports for 2001-02 to 2011-12; Westport Public Schools 2012-13 through 2016-17.
Westport Public School Enrollment History
Pre-Kindergarten to 12th Grade
38

Projection Methodology
The cohort survival methodology relies on observed data from the recent past in order to project the near future
Persistency Ratios calculated from historic enrollment data to determine growth or loss in a class as it progresses through school system
Persistency Ratios account for the various external factors affecting enrollments: housing characteristics, residential development, economic conditions, student transfers in and out of system, and student mobility
Changes in population, housing stock and tenure, and economic conditions help explain persistency ratios
Recent instability in economic climate adds variability to enrollments, births, and residential mobility
39

Year Birth-K K-1 1-2 2-3 3-4 4-5 5-6 6-7 7-8 8-9 9-10 10-11 11-12Elem.
Migration
2002-03 1.1902 1.0574 0.9888 0.9931 0.9936 0.9834 0.9723 1.0202 1.0076 1.0234 0.9774 0.9696 0.9817 0.3%
2003-04 1.1942 1.0619 0.9932 1.0090 0.9814 1.0000 1.0024 0.9810 0.9777 1.0176 0.9629 0.9942 0.9843 0.8%
2004-05 1.1943 1.0732 1.0437 0.9909 0.9978 0.9763 1.0022 0.9688 0.9927 0.9797 0.9901 0.9703 1.0000 1.4%
2005-06 1.2358 1.0667 1.0354 1.0186 1.0069 1.0157 1.0364 1.0323 1.0223 1.0244 1.0052 0.9800 0.9817 2.7%
2006-07 1.3488 1.0700 1.0375 1.0610 0.9909 1.0023 1.0199 0.9813 1.0208 0.9854 1.0143 0.9871 0.9694 3.1%
2007-08 1.2500 1.1029 1.0384 1.0217 1.0184 1.0092 1.0205 1.0065 1.0263 0.9939 1.0172 1.0164 1.0104 3.7%
2008-09 1.3555 1.1135 1.0287 1.0109 1.0212 0.9819 1.0251 0.9933 1.0151 1.0163 0.9938 0.9952 0.9908 2.8%
2009-10 1.4556 1.0539 0.9830 1.0279 0.9978 0.9723 1.0299 0.9889 1.0000 0.9894 0.9954 0.9793 0.9976 0.7%
2010-11 1.5019 1.0663 1.0256 1.0395 1.0452 0.9612 1.0356 0.9933 0.9977 1.0404 1.0021 0.9954 0.9895 2.5%
2011-12 1.5570 1.0204 1.0473 1.0023 1.0214 1.0238 1.0336 1.0000 1.0247 1.0474 0.9957 1.0086 0.9885 2.3%
2012-13 1.9058 1.0901 1.0525 1.0238 1.0204 1.0186 1.0127 1.0022 1.0069 1.0461 1.0086 1.0152 0.9894 3.9%
2013-14 1.6667 1.0632 1.0284 1.0333 1.0441 1.0222 1.0183 1.0104 0.9978 1.0068 0.9958 0.9893 0.9701 3.7%
2014-15 2.0417 1.0685 1.0543 1.0352 1.0322 0.9756 1.0130 0.9978 1.0103 1.0239 0.9977 1.0063 1.0000 3.1%2015-16 1.8021 1.0087 1.0385 1.0270 1.0267 1.0134 1.0000 1.0021 1.0247 1.0061 1.0085 0.9909 0.9979 2.3%
2016-17 1.8580 1.0751 1.0434 1.0395 0.9857 1.0118 0.9890 1.0273 1.0021 1.0175 1.0000 0.9811 0.9840 2.9%
Long Term Average 1.5038 1.0661 1.0292 1.0222 1.0122 0.9978 1.0141 1.0004 1.0085 1.0146 0.9977 0.9919 0.9890
Last 5-Yr Average 1.8548 1.0611 1.0434 1.0317 1.0218 1.0083 1.0066 1.0080 1.0084 1.0201 1.0021 0.9966 0.9883
Last 3-Yr Average 1.9006 1.0508 1.0454 1.0339 1.0149 1.0002 1.0007 1.0091 1.0124 1.0158 1.0021 0.9928 0.9940
3-Yr Weighted Avg 1.8699 1.0519 1.0435 1.0346 1.0071 1.0063 0.9967 1.0140 1.0110 1.0148 1.0024 0.9886 0.9913Last 2-Yr Average 1.8300 1.0419 1.0409 1.0332 1.0062 1.0126 0.9945 1.0147 1.0134 1.0118 1.0042 0.9860 0.9909
Kindergarten through 12th Grade Persistency Ratios by School Year
2002-2003 to 2013-14
Source: Calculated by MMI from State Department of Education, Public School Information System (2001-2012), Westport Public Schools (2012-13
to 2016-17) enrollments, and CT Department of Public Health (CT DPH) Birth Data. This study was approved by the DPH HIC. Certain data used in
this study were obtained from DPH. MMI assumes full responsibility for analyses and interpretation of this data.
Persistency Ratios
40

Persistency Ratios
41
• The Birth-K persistency ratio is key in predicting the size of future entering cohorts
• As with many lower Fairfield County communities, Westport has seen a rising Birth-K ratio since the onset of the Great Recession
• Westport’s Birth-K has exhibited greater year-to-year fluctuations over the last five years than in previous decade

Persistency Ratios
42
• As in many Fairfield County towns, a portion of kindergarten students enter the system at 6 years of age rather than 5
• Over the past five years, approx. 19% of entering kindergarteners are a year older than their peers

Year Birth-K K-1 1-2 2-3 3-4 4-5 5-6 6-7 7-8 8-9 9-10 10-11 11-12Elem.
Migration
2002-03 1.1902 1.0574 0.9888 0.9931 0.9936 0.9834 0.9723 1.0202 1.0076 1.0234 0.9774 0.9696 0.9817 0.3%
2003-04 1.1942 1.0619 0.9932 1.0090 0.9814 1.0000 1.0024 0.9810 0.9777 1.0176 0.9629 0.9942 0.9843 0.8%
2004-05 1.1943 1.0732 1.0437 0.9909 0.9978 0.9763 1.0022 0.9688 0.9927 0.9797 0.9901 0.9703 1.0000 1.4%
2005-06 1.2358 1.0667 1.0354 1.0186 1.0069 1.0157 1.0364 1.0323 1.0223 1.0244 1.0052 0.9800 0.9817 2.7%
2006-07 1.3488 1.0700 1.0375 1.0610 0.9909 1.0023 1.0199 0.9813 1.0208 0.9854 1.0143 0.9871 0.9694 3.1%
2007-08 1.2500 1.1029 1.0384 1.0217 1.0184 1.0092 1.0205 1.0065 1.0263 0.9939 1.0172 1.0164 1.0104 3.7%
2008-09 1.3555 1.1135 1.0287 1.0109 1.0212 0.9819 1.0251 0.9933 1.0151 1.0163 0.9938 0.9952 0.9908 2.8%
2009-10 1.4556 1.0539 0.9830 1.0279 0.9978 0.9723 1.0299 0.9889 1.0000 0.9894 0.9954 0.9793 0.9976 0.7%
2010-11 1.5019 1.0663 1.0256 1.0395 1.0452 0.9612 1.0356 0.9933 0.9977 1.0404 1.0021 0.9954 0.9895 2.5%
2011-12 1.5570 1.0204 1.0473 1.0023 1.0214 1.0238 1.0336 1.0000 1.0247 1.0474 0.9957 1.0086 0.9885 2.3%
2012-13 1.9058 1.0901 1.0525 1.0238 1.0204 1.0186 1.0127 1.0022 1.0069 1.0461 1.0086 1.0152 0.9894 3.9%
2013-14 1.6667 1.0632 1.0284 1.0333 1.0441 1.0222 1.0183 1.0104 0.9978 1.0068 0.9958 0.9893 0.9701 3.7%
2014-15 2.0417 1.0685 1.0543 1.0352 1.0322 0.9756 1.0130 0.9978 1.0103 1.0239 0.9977 1.0063 1.0000 3.1%2015-16 1.8021 1.0087 1.0385 1.0270 1.0267 1.0134 1.0000 1.0021 1.0247 1.0061 1.0085 0.9909 0.9979 2.3%
2016-17 1.8580 1.0751 1.0434 1.0395 0.9857 1.0118 0.9890 1.0273 1.0021 1.0175 1.0000 0.9811 0.9840 2.9%
Long Term Average 1.5038 1.0661 1.0292 1.0222 1.0122 0.9978 1.0141 1.0004 1.0085 1.0146 0.9977 0.9919 0.9890
Last 5-Yr Average 1.8548 1.0611 1.0434 1.0317 1.0218 1.0083 1.0066 1.0080 1.0084 1.0201 1.0021 0.9966 0.9883
Last 3-Yr Average 1.9006 1.0508 1.0454 1.0339 1.0149 1.0002 1.0007 1.0091 1.0124 1.0158 1.0021 0.9928 0.9940
3-Yr Weighted Avg 1.8699 1.0519 1.0435 1.0346 1.0071 1.0063 0.9967 1.0140 1.0110 1.0148 1.0024 0.9886 0.9913Last 2-Yr Average 1.8300 1.0419 1.0409 1.0332 1.0062 1.0126 0.9945 1.0147 1.0134 1.0118 1.0042 0.9860 0.9909
Kindergarten through 12th Grade Persistency Ratios by School Year
2002-2003 to 2013-14
Source: Calculated by MMI from State Department of Education, Public School Information System (2001-2012), Westport Public Schools (2012-13
to 2016-17) enrollments, and CT Department of Public Health (CT DPH) Birth Data. This study was approved by the DPH HIC. Certain data used in
this study were obtained from DPH. MMI assumes full responsibility for analyses and interpretation of this data.
Persistency Ratios
43

44
Districtwide Projections

45
Districtwide Projections
• Medium scenario depicts most probable scenario for future enrollments in Westport schools

46
Districtwide Projections
• Medium scenario depicts a decline in enrollment through the projection horizon
• K-12 student population down 4.6% by 2021-22 and 7.7% by 2026-27

47
Elementary Projections

5-Year Average Town Births-K Birth-K K-1 1-2 2-3 3-4 4-5
Coleytown 0.283 1.877 1.074 1.055 1.032 1.056 0.992
Green's Farms 0.298 1.885 1.114 1.045 1.028 1.068 1.007
King's Highway 0.384 1.786 1.042 1.065 1.052 0.999 0.993
Long Lots 0.406 2.183 1.072 1.038 1.040 1.024 1.033
Saugatuck 0.400 1.729 1.021 1.028 1.012 0.984 1.008
Elementary School Average Persistency Ratios
48
Elementary school persistency ratios
In-migration has a larger proportional impact at Coleytown, Green’s Farms, and Long Lots than King’s Highway and Saugatuck Shrinking incoming kindergarten cohorts magnify the apparent
effect of later arrivals
Persistency Ratios

49
Elementary School Projections

50
Middle School Projections

51
Middle School Projections 5-Yr 5-6 6-7 7-8
Bedford 1.00231 1.01128 1.01493
Coleytown 1.01435 1.00309 0.99802
Middle School Average Persistency Ratios

52
Projection Takeaways Districtwide
• All projection scenarios see an overall decline through the majority of the projection horizon, with projected declines in K-12 enrollment over the next five years between -2.7% and -6.1%
• The medium projection scenario reflects our estimate of the most likely trajectory of future enrollments based on historic persistency ratios and likely economic and housing market conditions
• The medium and high enrollment scenarios depict a moderating or recovery trend in the last three years of the projections as projected future births begin to trend up; however, projections are most reliable for the immediate future and should be used with caution in the five-to-ten year horizon

53
Projection Takeaways School Specific
• Elementary projections scenario depicts rising enrollment at King’s Highway and Green’s Farms and declines at other three buildings in the near future• King’s Highway enrollment expected to grow based on birth ‘bubble’ in
past few years
• Green’s Farms seeing more gradual growth based on greater in-migration
• Middle school projections show declines at both schools, but steeper decrease in enrollment expected at Bedford based on known cohorts currently progressing through elementary schools which will begin matriculating to the middle grades in 2019-20

54
Elementary Facilities Capacity & Utilization

Capacity: Process Overview
• Catalog data and calculate capacity:o Analyze current space
capacity based on reported classroom use
11/14/2016 55

Capacity: Process Overview
• Data collection from WPS Elementary Building Leadership in
the form of floor plans and corresponding room utilization
information
• Categorized Rooms into Academic, Core, Shared, Special Ed.
and Related Services Spaces
• Academic Spaces drive capacity of each building
11/14/2016 56

Capacity: Assumptions & Clarifications
• Represent a functional capacity for each school reflecting the current program in each building
• School utilization based on an operating efficiency of 90% - leaves headroom for enrollment bubbles
• Spaces excluded from capacity calculations:
o Cores & Shared spaces (e.g. Gym, Cafeteria, Library, Art, Music, Computer Labs), SPED, OT/PT, speech, psych, etc…
• Class Size Policy Guidelines (students per class)
o K-2nd 22
o 3rd -5th 25
11/14/2016 57

Elementary School -Capacity
11/14/2016 58

Elementary School -Utilization
11/14/2016 59
Note: Projected enrollments typically have greatest accuracy in the first 5 years (highlighted in grey)
Elementary Projections
School201
6 -
17201
7 -
18201
8 -
19201
9 -
20202
0 -
21202
1 -
22202
2 -
23202
3 -
24202
4 -
25202
5 -
26202
6 -
27
Coleytown* 377 385 376 370 370 362 362 348 350 350 354
Green's Farms 422 415 412 410 423 435 431 438 434 423 425
King's Highway 495 486 504 531 513 508 508 510 507 492 510
Long Lots 545 542 536 524 529 508 511 503 501 501 512
Saugatuck 483 484 461 447 440 444 449 439 447 454 462
Total 2,322 2,312 2,289 2,282 2,275 2,257 2,261 2,238 2,239 2,220 2,263
K-5 Capacity 2,462 2,462 2,462 2,462 2,462 2,462 2,462 2,462 2,462 2,462 2,462
Seat Surplus/Deficit +140 +150 +173 +180 +187 +205 +201 +224 +223 +242 +199
(*) Numbers shown exclude complex of small PreK classrooms at Coleytown
Elementary Utilization
School201
6 -
17201
7 -
18201
8 -
19201
9 -
20202
0 -
21202
1 -
22202
2 -
23202
3 -
24202
4 -
25202
5 -
26202
6 -
27
Coleytown* 93.5% 95.5% 93.3% 91.8% 91.8% 89.8% 89.8% 86.4% 86.8% 86.8% 87.8%
Green's Farms 94.2% 92.6% 92.0% 91.5% 94.4% 97.1% 96.2% 97.8% 96.9% 94.4% 94.9%
King's Highway 97.4% 95.7% 99.2% 104.5% 101.0% 100.0% 100.0% 100.4% 99.8% 96.9% 100.4%
Long Lots 91.6% 91.1% 90.1% 88.1% 88.9% 85.4% 85.9% 84.5% 84.2% 84.2% 86.1%
Saugatuck 95.1% 95.3% 90.7% 88.0% 86.6% 87.4% 88.4% 86.4% 88.0% 89.4% 90.9%
Total 94.3% 93.9% 93.0% 92.7% 92.4% 91.7% 91.8% 90.9% 90.9% 90.2% 91.9%
(*) Numbers shown exclude complex of small PreK classrooms at Coleytown

Elementary School –Potential Flex Rooms
11/14/2016 60
• Administrators and building leadership identified rooms at each school that could be used as K-5th instructional classrooms if enrollment pressures warranted
• Potential exists for 11 additional classrooms or 248 seats across elementary schools
School
Flex
Classrooms
Add. Flex
Capacity
Capacity w/
Flex
Utilization w/
Flex Space
Coleytown* 377 4 90 493 76.5%
Green's Farms 422 2 45 493 85.6%
King's Highway 495 1 23 531 93.3%
Long Lots 545 2 45 640 85.2%
Saugatuck 483 2 45 553 87.3%
Total K-5 2,322 11 248 2,710 85.7%
Elementary School Capacity (K-5th) with Flex Rooms
2016-17
Enrollment
Functional Capacity Including Flex Rooms

Elementary School –Utilization w/ Flex
11/14/2016 61Note: Projected enrollments typically have greatest accuracy in the first 5 years (highlighted in grey)
Elementary Projections
School201
6 -
17201
7 -
18201
8 -
19201
9 -
20202
0 -
21202
1 -
22202
2 -
23202
3 -
24202
4 -
25202
5 -
26202
6 -
27
Coleytown* 377 385 376 370 370 362 362 348 350 350 354
Green's Farms 422 415 412 410 423 435 431 438 434 423 425
King's Highway 495 486 504 531 513 508 508 510 507 492 510
Long Lots 545 542 536 524 529 508 511 503 501 501 512
Saugatuck 483 484 461 447 440 444 449 439 447 454 462
Total 2,322 2,312 2,289 2,282 2,275 2,257 2,261 2,238 2,239 2,220 2,263
K-5 Capacity 2,462 2,462 2,462 2,462 2,462 2,462 2,462 2,462 2,462 2,462 2,462
Seat Surplus/Deficit +140 +150 +173 +180 +187 +205 +201 +224 +223 +242 +199
(*) Numbers shown exclude complex of small PreK classrooms at Coleytown
• The additional K-5th instructional space gained provides some relief to King’s Highway, however,
utilization is still projected to reach 100% in 2019-20.
Elementary Utilization
School201
6 -
17201
7 -
18201
8 -
19201
9 -
20202
0 -
21202
1 -
22202
2 -
23202
3 -
24202
4 -
25202
5 -
26202
6 -
27
Coleytown* 76.5% 78.1% 76.3% 75.1% 75.1% 73.4% 73.4% 70.6% 71.0% 71.0% 71.8%
Green's Farms 85.6% 84.2% 83.6% 83.2% 85.8% 88.2% 87.4% 88.8% 88.0% 85.8% 86.2%
King's Highway 93.2% 91.5% 94.9% 100.0% 96.6% 95.7% 95.7% 96.0% 95.5% 92.7% 96.0%
Long Lots 85.2% 84.7% 83.8% 81.9% 82.7% 79.4% 79.8% 78.6% 78.3% 78.3% 80.0%
Saugatuck 87.3% 87.5% 83.4% 80.8% 79.6% 80.3% 81.2% 79.4% 80.8% 82.1% 83.5%
Total 85.7% 85.3% 84.5% 84.2% 83.9% 83.3% 83.4% 82.6% 82.6% 81.9% 83.5%
(*) Numbers shown exclude complex of small PreK classrooms at Coleytown

Elem. Utilization: Takeaways
11/14/2016 62
• Elementary School Enrollment projected to be stable for next decade (2,220 to 2,312)
• Current Elementary System Utilization is 94.3%
• Ranges from 91.6 % at Long Lots to 97.4% at King’s Highway.
• Overall, all elementary schools are utilized very efficiently
• Enrollment Pressure at King’s Highway projected to persist for the next 5 years and beyond
• Projected to exceed functional capacity in 2019-20 at 104.5%
• WPS should explore strategies to provide capacity relief at King’s Highway.
• Leveraging the Flex rooms provides some near term relief, however, utilization is still projected to reach maximum capacity in 2019-20
• Coleytown, Long Lots and Saugatuck projected to have a utilization from the high 80s to mid 90s for the next 5 years
• Green’s Farm bears watching, utilization projected to reach 97% in 2021-22 and persist throughout projection horizon
PK-12 K-12 K-5 6-8 9-12-2.7% -2.7% 0.7% -8.9% -2.5%-2.2% -2.2% 6.2% -7.8% -8.7%
PK-12 K-12 K-5 6-8 9-12
5 Yr Change -2.7% -2.7% 0.8% -8.9% -2.5%
10 Yr Change -2.2% -2.2% 6.3% -7.9% -8.7%
63
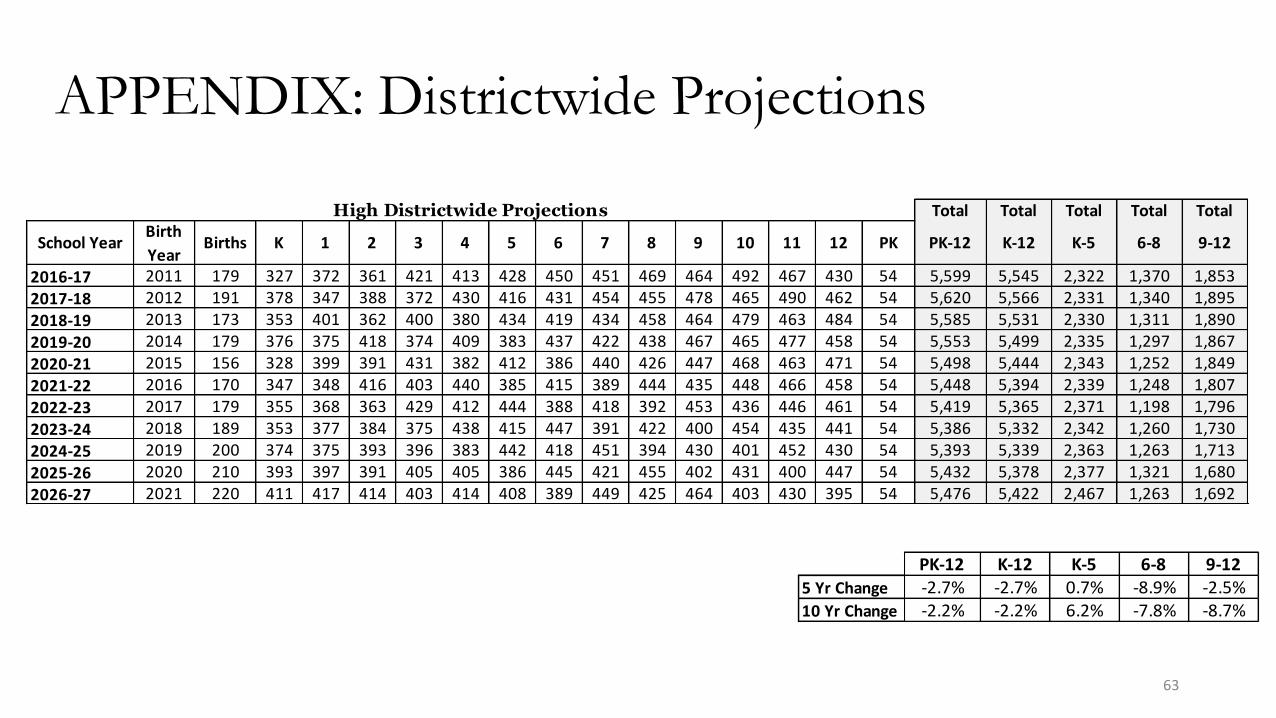
APPENDIX: Districtwide Projections
Total Total Total Total Total
School YearBirth
YearBirths K 1 2 3 4 5 6 7 8 9 10 11 12 PK PK-12 K-12 K-5 6-8 9-12
2016-17 2011 179 327 372 361 421 413 428 450 451 469 464 492 467 430 54 5,599 5,545 2,322 1,370 1,853
2017-18 2012 191 378 347 388 372 430 416 431 454 455 478 465 490 462 54 5,620 5,566 2,331 1,340 1,895
2018-19 2013 173 353 401 362 400 380 434 419 434 458 464 479 463 484 54 5,585 5,531 2,330 1,311 1,890
2019-20 2014 179 376 375 418 374 409 383 437 422 438 467 465 477 458 54 5,553 5,499 2,335 1,297 1,867
2020-21 2015 156 328 399 391 431 382 412 386 440 426 447 468 463 471 54 5,498 5,444 2,343 1,252 1,849
2021-22 2016 170 347 348 416 403 440 385 415 389 444 435 448 466 458 54 5,448 5,394 2,339 1,248 1,807
2022-23 2017 179 355 368 363 429 412 444 388 418 392 453 436 446 461 54 5,419 5,365 2,371 1,198 1,796
2023-24 2018 189 353 377 384 375 438 415 447 391 422 400 454 435 441 54 5,386 5,332 2,342 1,260 1,730
2024-25 2019 200 374 375 393 396 383 442 418 451 394 430 401 452 430 54 5,393 5,339 2,363 1,263 1,713
2025-26 2020 210 393 397 391 405 405 386 445 421 455 402 431 400 447 54 5,432 5,378 2,377 1,321 1,680
2026-27 2021 220 411 417 414 403 414 408 389 449 425 464 403 430 395 54 5,476 5,422 2,467 1,263 1,692
High Districtwide Projections

Total Total Total Total Total
School YearBirth
YearBirths K 1 2 3 4 5 6 7 8 9 10 11 12 PK PK-12 K-12 K-5 6-8 9-12
2016-17 2011 179 327 372 361 421 413 428 450 451 469 464 492 467 430 54 5,599 5,545 2,322 1,370 1,853
2017-18 2012 191 357 345 387 373 430 415 430 454 455 475 464 488 461 54 5,588 5,534 2,307 1,339 1,888
2018-19 2013 173 343 376 359 400 381 432 417 434 458 461 475 460 482 54 5,532 5,478 2,291 1,309 1,878
2019-20 2014 179 365 361 391 371 409 383 434 421 438 464 461 471 454 54 5,477 5,423 2,280 1,293 1,850
2020-21 2015 156 318 385 376 404 379 411 385 438 425 444 464 457 465 54 5,405 5,351 2,273 1,248 1,830
2021-22 2016 170 337 335 401 389 413 381 413 389 442 431 444 460 452 54 5,341 5,287 2,256 1,244 1,787
2022-23 2017 175 327 355 349 415 398 415 383 417 392 448 431 440 454 54 5,278 5,224 2,259 1,192 1,773
2023-24 2018 180 337 345 370 361 424 400 417 387 421 397 448 428 435 54 5,224 5,170 2,237 1,225 1,708
2024-25 2019 184 344 355 359 383 369 426 402 421 390 427 397 444 423 54 5,194 5,140 2,236 1,213 1,691
2025-26 2020 188 352 363 370 371 392 371 428 406 425 395 427 394 439 54 5,187 5,133 2,219 1,259 1,655
2026-27 2021 192 359 371 378 383 379 394 373 432 410 431 395 424 389 54 5,172 5,118 2,264 1,215 1,639
Medium Districtwide Projections
64
APPENDIX: Districtwide Projections
PK-12 K-12 K-5 6-8 9-12
5 Yr Change -4.5% -4.6% -2.8% -9.1% -3.5%
10 Yr Change -7.6% -7.7% -2.6% -11.4% -11.4%
PK-12 K-12 K-5 6-8 9-12-4.6% -4.7% -2.8% -9.2% -3.6%-7.6% -7.7% -2.5% -11.3% -11.5%

Total Total Total Total Total
School YearBirth
YearBirths K 1 2 3 4 5 6 7 8 9 10 11 12 PK PK-12 K-12 K-5 6-8 9-12
2016-17 2011 179 327 372 361 421 413 428 450 451 469 464 492 467 430 54 5,599 5,545 2,322 1,370 1,853
2017-18 2012 191 351 344 389 373 427 413 428 454 457 476 465 488 464 54 5,583 5,529 2,297 1,339 1,893
2018-19 2013 173 323 369 360 402 379 427 413 432 460 464 477 462 485 54 5,507 5,453 2,260 1,305 1,888
2019-20 2014 179 355 339 386 372 408 379 427 417 437 467 465 474 459 54 5,439 5,385 2,239 1,281 1,865
2020-21 2015 156 309 373 354 399 378 408 379 431 422 444 468 462 471 54 5,352 5,298 2,221 1,232 1,845
2021-22 2016 170 318 325 390 366 405 378 408 382 436 429 445 465 459 54 5,260 5,206 2,182 1,226 1,798
2022-23 2017 167 312 334 340 403 371 405 378 412 387 443 430 442 462 54 5,173 5,119 2,165 1,177 1,777
2023-24 2018 169 316 328 349 352 409 371 405 381 417 393 444 427 439 54 5,085 5,031 2,125 1,203 1,703
2024-25 2019 165 309 332 343 361 357 409 371 409 386 424 394 441 424 54 5,014 4,960 2,111 1,166 1,683
2025-26 2020 162 303 325 347 355 366 357 409 374 414 392 425 391 438 54 4,950 4,896 2,053 1,197 1,646
2026-27 2021 158 295 318 340 359 360 366 357 413 379 421 393 422 389 54 4,866 4,812 2,038 1,149 1,625
Low Districtwide Projections
65
APPENDIX: Districtwide Projections
PK-12 K-12 K-5 6-8 9-12
5 Yr Change -6.0% -6.1% -6.1% -10.4% -3.0%
10 Yr Change -13.1% -13.2% -12.2% -16.0% -12.4%
PK-12 K-12 K-5 6-8 9-12
-6.1% -6.1% -6.0% -10.5% -3.0%
-13.1% -13.2% -12.2% -16.1% -12.3%

School K 1 2 3 4 5 K-5thColeytown 53 55 70 57 73 62 370Green's Farms 70 72 62 74 65 67 410
King's Highway 93 84 82 87 92 93 531
Long Lots 79 84 91 82 108 80 524
Saugatuck 70 66 87 70 71 83 447
TOTAL 365 361 392 370 409 385 2,282
School K 1 2 3 4 5 K-5thColeytown 51 57 58 72 60 72 370Green's Farms 62 77 75 65 79 65 423
King's Highway 64 96 89 86 87 91 513
Long Lots 69 84 87 94 84 111 529
Saugatuck 71 72 68 88 69 72 440
TOTAL 317 386 377 405 379 411 2,275
Westport Public Schools
Elementary School Enrollment Projections 2020-21
Westport Public Schools
Elementary School Enrollment Projections 2019-20
School K 1 2 3 4 5 K-5thColeytown 62 53 67 59 74 70 385Green's Farms 54 70 60 63 87 81 415King's Highway 74 79 87 94 78 74 486Long Lots 83 77 101 75 106 100 542Saugatuck 84 68 71 83 87 91 484
TOTAL 357 347 386 374 432 416 2,312
School K 1 2 3 4 5 K-5th
Coleytown 51 67 55 69 62 72 376
Green's Farms 65 60 72 61 67 87 412
King's Highway 82 77 83 92 94 76 504
Long Lots 79 88 79 105 77 108 536Saugatuck 66 85 69 72 82 87 461
TOTAL 343 377 358 399 382 430 2,289
Westport Public Schools
Elementary School Enrollment Projections 2018-19
Westport Public Schools
Elementary School Enrollment Projections 2017-18
66
APPENDIX: Individual Elementary ProjectionsMedium Projection Scenario

School K 1 2 3 4 5 K-5th
Coleytown 51 53 58 59 65 62 348
Green's Farms 60 65 70 74 87 82 438
King's Highway 77 77 83 74 107 92 510
Long Lots 76 78 83 79 92 95 503
Saugatuck 74 72 76 75 73 69 439
TOTAL 338 345 370 361 424 400 2,238
School K 1 2 3 4 5 K-5th
Coleytown 53 55 55 60 63 64 350
Green's Farms 61 67 68 72 78 88 434
King's Highway 78 79 82 88 74 106 507
Long Lots 77 80 81 87 81 95 501
Saugatuck 75 74 74 77 74 73 447
TOTAL 344 355 360 384 370 426 2,239
Westport Public Schools
Elementary School Enrollment Projections 2024-25
Westport Public Schools
Elementary School Enrollment Projections 2023-24
School K 1 2 3 4 5 K-5th
Coleytown 52 54 60 60 76 60 362
Green's Farms 60 69 80 77 69 80 435
King's Highway 76 66 102 93 86 85 508
Long Lots 76 74 86 90 96 86 508
Saugatuck 73 72 73 69 87 70 444
TOTAL 337 335 401 389 414 381 2,257
School K 1 2 3 4 5 K-5th
Coleytown 50 55 57 62 63 75 362
Green's Farms 58 67 72 82 82 70 431
King's Highway 74 79 70 107 93 85 508
Long Lots 73 81 76 90 92 99 511
Saugatuck 71 74 74 74 68 88 449
TOTAL 326 356 349 415 398 417 2,261
Westport Public Schools
Elementary School Enrollment Projections 2022-23
Westport Public Schools
Elementary School Enrollment Projections 2021-22
67
APPENDIX: Individual Elementary ProjectionsMedium Projection Scenario

School K 1 2 3 4 5 K-5th
Coleytown 53 57 58 57 63 62 350
Green's Farms 62 67 70 69 77 78 423
King's Highway 80 81 84 86 88 73 492
Long Lots 80 82 83 83 89 84 501
Saugatuck 77 77 76 74 76 74 454
TOTAL 352 364 371 369 393 371 2,220
School K 1 2 3 4 5 K-5th
Coleytown 55 57 59 60 60 63 354
Green's Farms 64 69 70 72 73 77 425
King's Highway 81 83 86 88 86 86 510
Long Lots 80 84 85 86 85 92 512
Saugatuck 78 78 79 77 73 77 462
TOTAL 358 371 379 383 377 395 2,263
Westport Public Schools
Elementary School Enrollment Projections 2026-27
Westport Public Schools
Elementary School Enrollment Projections 2025-26
68
APPENDIX: Individual Elementary ProjectionsMedium Projection Scenario

School 6 7 8 6-8th
Bedford 232 262 280 774Coleytown 153 176 145 474
TOTAL 385 438 425 1,248
School 6 7 8 6-8th
Bedford 255 235 266 755
Coleytown 158 154 176 488
TOTAL 413 389 442 1,243
School 6 7 8 6-8th
Bedford 235 259 238 732Coleytown 148 158 154 460
TOTAL 383 417 392 1,192
Westport Public Schools
Middle School Enrollment 2020-21
Westport Public Schools
Middle School Enrollment 2021-22
Westport Public Schools
Middle School Enrollment 2022-23
School 6 7 8 6-8th
Bedford 269 288 287 844
Coleytown 161 166 168 495
TOTAL 430 454 455 1,339
School 6 7 8 6-8th
Bedford 273 273 292 838Coleytown 144 161 166 471
TOTAL 417 434 458 1,309
School 6 7 8 6-8th
Bedford 258 276 277 811
Coleytown 176 145 161 482
TOTAL 434 421 438 1,293
Westport Public Schools
Middle School Enrollment 2017-18
Westport Public Schools
Middle School Enrollment 2018-19
Westport Public Schools
Middle School Enrollment 2019-20
69
APPENDIX: Individual Middle ProjectionsMedium Projection Scenario

School 6 7 8 6-8th
Bedford 271 244 263 778
Coleytown 157 162 162 481
TOTAL 428 406 425 1,259
School 6 7 8 6-8th
Bedford 231 275 248 754
Coleytown 142 157 162 461
TOTAL 373 432 410 1,215
Westport Public Schools
Middle School Enrollment 2026-27
Westport Public Schools
Middle School Enrollment 2025-26
School 6 7 8 6-8th
Bedford 256 238 263 757Coleytown 161 149 158 468
TOTAL 417 387 421 1,225
School 6 7 8 6-8th
Bedford 241 258 241 740
Coleytown 161 162 149 472
TOTAL 402 420 390 1,212
Westport Public Schools
Middle School Enrollment 2023-24
Westport Public Schools
Middle School Enrollment 2024-25
70
APPENDIX: Individual Middle ProjectionsMedium Projection Scenario