Welspun India Ltdwelspun.com/userfiles/file/presentation/WIL Q3 FY14... · · 2014-02-25One of...
24
Welspun India Ltd World’s Leading Home Textile Company Welspun Group | Textiles February 2014 1
Transcript of Welspun India Ltdwelspun.com/userfiles/file/presentation/WIL Q3 FY14... · · 2014-02-25One of...

Welspun Group | Textiles
Welspun India Ltd World’s Leading Home Textile Company
Welspun Group | Textiles
February 2014
1

Welspun Group | Textiles
Company Overview One of the largest global home textile players -Revenue of US$ 670 mn in FY13
Incorporated in 1985; range of products include bed and bath- towels, robes, sheets,
comforters and rugs
Ranked 1st among Home Textile Suppliers in the US (Source: Home Textile Today (HTT) -Top 15 Supplier Giants, Jan 28th 2013)
Rank # 1: Bath Towels*
Rank # 2: Bed Sheets, Pillow cases & TOB*
Rank # 4: Rugs*
Key Global Retailers as clients:
US: Wal Mart, Target, JC Penny
Europe: IKEA, Rewe, JYSK
UK: Christy, Mark & Spencer, House of Fraser
Export driven business, product innovation and technological excellence
Patented products (pending) – 2 ; Trademarks – 7
Innovative products contribute ~30% of sales
Shareholding Pattern, as December 31, 2013
Summary Market Statistics
Consolidated Financial Summary – Continuing business
All figures re-grouped to show the consolidation of WIL and WGBL
2
* Based on HTT ranking published in Jan 2012.
24,471
29,329
36,473
33,105
0
5,000
10,000
15,000
20,000
25,000
30,000
35,000
40,000
FY11 FY12 FY13 9M FY14
Revenue in INR Million
3,994
5,960 6,438
7,760
0
1,000
2,000
3,000
4,000
5,000
6,000
7,000
8,000
9,000
FY11 FY12 FY13 9M FY14
EBITDA in INR Million
Promoters69%
Banks, MF, & Institutions
17%
Non-Institutional Public14%
As on Jan 30, 2014
Price per share - INR 87.5
No: of Shares Outstanding (Mn) 100
Market Capitalization (INR mn) 8,752
Enterprise value (INR mn) 33,175
P/E (x) on TTM basis 2.31
EV/EBITDA (x) on TTM basis 3.64
Welspun Group | Textiles
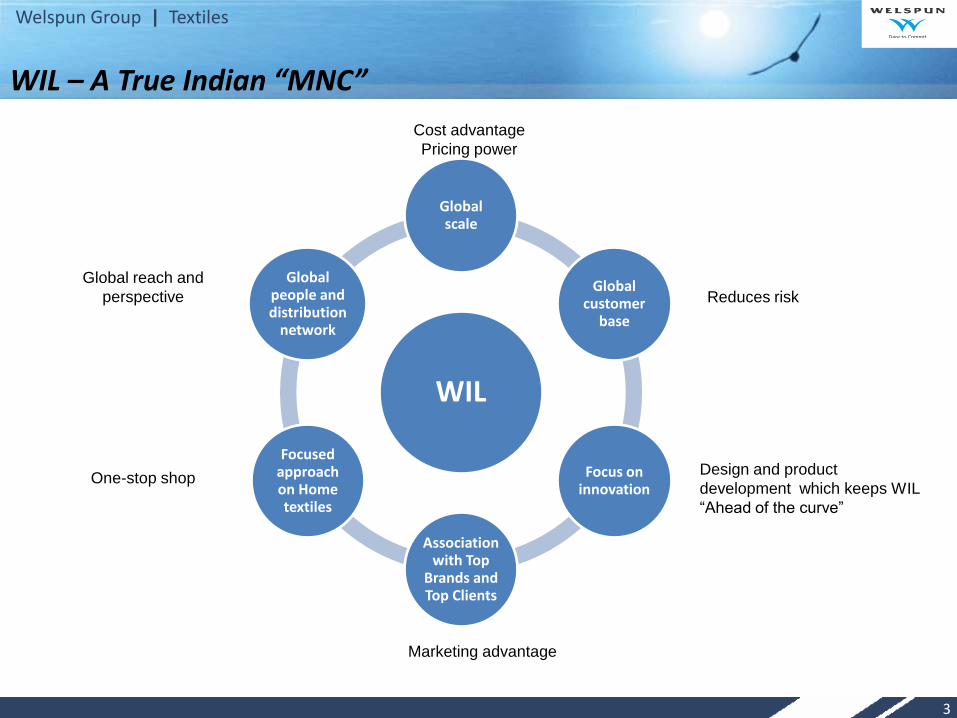
WIL
Global scale
Global customer
base
Focus on innovation
Association with Top
Brands and Top Clients
Focused approach on Home textiles
Global people and distribution
network
Reduces risk
Cost advantage
Pricing power
Global reach and
perspective
One-stop shop Design and product
development which keeps WIL
“Ahead of the curve”
Marketing advantage
WIL – A True Indian “MNC”
3

Welspun Group | Textiles
WIL – Strong positive Outlook
Strong
sustainable
growth and
profitability
Industry factors
• India’s Location advantage
• Surplus cotton
• Cheap labour and favourable demographics
• High-growth domestic market
• De-risking from China, Pakistan & Bangladesh
• Proposed FTA with Europe
• Favourable government policies
WIL specific factors
• Strategic re-organisation to consolidate all textile operations under one listed entity
• Completed exit from loss making subsidiaries; Continuing business has always been robust
• Increasing contribution from innovation: now at ~30% of sales
• Increasing backward integration: now at ~35%; expected to rise to 70-75% by June 2014
4

Welspun Group | Textiles
Strong Textile Industry Fundamentals – Global and India
Increase in textiles and clothing global trade from US$ 355 bn in 2000 to
US$ 706 bn in 2011
Expected to reach US$ 1 trillion by 2020, CAGR of 5% pa.
Post dismantling of quota regime, global capacities had increased
dramatically. But with closure of some of these capacities in the last few
years, supply demand balance is being restored
Emerging markets in Asia and Middle East expected to drive strong
demand growth while established markets (North America, Western
Europe) continue to show traction
Global Textile: Supply-demand balance improving
Estimated size of US$ 89 bn in 2011 (domestic + exports), projected to
reach US$ 223 bn by 2021, CAGR of ~10%
Second largest producer of cotton, textiles & garments and only major
textile exporting country with a net cotton surplus
12% of India’s exports and 4% of India’s GDP attained through Textile
industry
Third largest exporter of textiles and clothing , with a share of ~4%
US and EU account for about two-third of India’s textile exports
Indian Textile : Well placed for strong growth
Projected Indian Textile Industry – Domestic + Exports (US$ bn) Global Textile Market on a Significant Uptrend
P= Projections; Source: Technopak June 2012,Otexa
355
529586 612
510
602
800
1,000
0
200
400
600
800
1,000
1,200
Textile
Apparel
Total
US$ billion
5
3150
8258
93
141
89
143
0
50
100
150
200
250
300
2011 2016(P) 2021(P)
Domestic Export
223

Welspun Group | Textiles
Home Textile Landscape
2011 Global Home Textiles Market: US$ 78 billion
US and Europe account for ~ 70% of market size
US home textile market: US$26 bn
6
3.7
5.5
8.2
0
2
4
6
8
10
2011 2016(P) 2021(P)
Total Domestic Home Textile Market
Projected Indian Home Textile Market (US$ Billion)
Source: Technopak
US home textile industry: US$ 26bn
Bedding54%
Bath25%
Window14%
Kitchen and dining
7%
Global Home Textiles Indian Home Textiles
India’s share in global home textile trade at 8% with 2/3rd of exports going to US and EU
Indian domestic home textile market currently at ~US$ 4bn
Projected to exceed US$ 8 bn by 2021 with an expected CAGR of ~8%
Source: NPD
Welspun Group | Textiles
India – Competitive position has improved
India’s competitiveness against key competitor countries has significantly improved in the last 10 years (2002-12) resulting in higher market share
This is on account of a variety of factors including
Technology up-gradation with new investment in spinning and weaving
Factor costs, particularly power and wages, have become relatively competitive against key competitors, especially China
Manufacturing costs in spinning, weaving and processing have become competitive vis-à-vis competing countries
Holistic enabling environment in India which the textile industry has been able to leverage and grow, even compared to countries with lower factor costs
7

Welspun Group | Textiles
Country Production Consumption Exports Imports
China 7,620 7,838 16 4,354
India 5,770 4,899 1,568 327
Pakistan 2,025 2,395 98 479
USA 3,770 751 2,896 1
Brazil 1,263 893 936 16
World 26,399 23,379 10,115 10,100
Cotton - Only Major Textile Producer with a Cotton Surplus
India is a net exporter of cotton, while China and Pakistan are net importers
This has led to lower costs and better cotton availability in India
Source: USDA.
India – “Net Exporter” of cotton, unlike China and Pakistan
(Thousands of MT)
8

Welspun Group | Textiles
Labour cost - Competitiveness has improved
India’s wage cost competitiveness relative to other textile producing countries has significantly improved
Source: Texprocil Gherzi report
9

Welspun Group | Textiles
Power cost - Competitiveness has improved
India’s power cost competitiveness relative to other textile producing countries has also significantly improved
Source: Texprocil Gherzi report
10

Welspun Group | Textiles
India’s market share gain most prominent in home textiles, especially in the US market India, Pakistan and China account for more than 85% of the total exports to USA in home textiles Of these three, India’s share has been steadily increasing while the other two have maintained or lost share
These factors have led to market share gains
11
Source: Otexa
30% 31%
35%36% 36%
23%27%
25%26% 26%
22% 23%24%
22% 23%24%
20%
16% 15% 16%
2009 2010 2011 2012 2013
Towels (Cotton)
India China Pakistan ROW
27%
33%
38%
45% 47%
29% 30%
24%22%
24%26%
21% 22%
18% 17%18%16% 16% 15%
13%
2009 2010 2011 2012 2013
Sheets (Cotton)
India China Pakistan ROW

Welspun Group | Textiles
India – Robust growth expected to continue
Customers continuing to de-risk from China, Pakistan and Bangladesh
With China's rising per capita income and transition to a developed country, domestic consumption has increased. This has impacted China's ability to export
Currency appreciation of yuan coupled with rising labour and power costs leading to higher costs making China less competitive
Pakistan’s geopolitical situation and power shortages prompting clients to look for other sources
Bangladesh facing scrutiny over workers’ safety
Huge potential opportunity in Europe
Proposed India - EU FTA, which is in the final stages of discussion, to remove 5-10% of import duties on Indian textiles. This will make India more competitive and lead to market share gains in the region
Significant growth opportunity in the Indian market
Increasing retail penetration in the Indian market – Share of Textiles and Clothing Retail ~ 40% of organized retailing in India; Organized Retailing expected to increase from ~5% in 2005 to ~24% by 2020
Higher disposable income & Favourable demographic profile in the Indian market - Rising per capita income leading to an increase in consumption of Textiles. The % of earning population (15-60 years) in the total population is rising
FDI in retail to boost textile consumption
Favourable government policies
Interest and capital subsidies for new capex from central and various state governments
TUFS scheme of central government providing 4-5% of interest rebate on loans for new capex
Gujarat state government providing 5-7% of interest rebate on new capex loans in addition to TUFS rebate
12

Welspun Group | Textiles
WIL - Global Manufacturing Scale & Integrated Facilities
Spinning Weaving Processing Cut & Sew Packing & Logistics
India Locational advantage
Cotton
Yarn
Vertically Integrated Facilities Across The Manufacturing Chain with Current Integration at 35% in spinning and weaving; capex planned to increase it to ~70-75%
Captive yarn generation Power generation - thermal all captive
• FY13 Capacity: 43,800 MT/Year
• Location: Anjar/Vapi
• Cap. Utilization : 90% Terry Towels
• FY13 Capacity: 52 million Mtr/Year
• Location: Anjar
• Cap. Utilization: 96% Bed Linen Products
• FY13 Capacity: 10,151 MT/Year
• Location: Vapi
• Cap. Utilization: 59% Bath Rugs
13

Welspun Group | Textiles
Bed Bath & Beyond Macy’s Wal Mart J C Penney Target Kohl’s K Mart- Sears Sam’s Club CostCo Burlington Coat Factory Ross Stores Bon Ton Belk, Inc. Anna’s Linen
Marquee Retailing Giants as Valued Customers
Ikea Carrefour JYSK El Corte Ingles Vincenzo Zucchi S.p.A Bassetti Auchan Rewe Tom Tailor Descamps Casino
Christy Tesco Marks & Spencer Debenhams House of Frazer John Lewis Sainsbury ASDA T J Hughes T K Maxx Fenwicks
• Spaces- Home & Beyond
14

Welspun Group | Textiles
15
Bed Technologies
• Flexifit (exclusive licensee)
• Eversmooth
• Cotton Touch
• Smart Bedskirt
• Perfect Sheet
• Hygro Comfort
• Bleach safe
Bath Technologies
• Hygro cotton
• Quick Dry
• Bleach safe
• Eucalyptus
• Silk
• Bamboo
• Aerospun
• Spot Stop
Sleep Solutions
• Earth Pillow
• Sneeze eezzz
• Hygrofil
• My Favorite Pillow
Rugs
• Bleach safe
• Eucalyptus
• Drylon
• Hygro
• Quick Dry
• Aerofil
• Hygro cotton
Innovative products, mainly in Towels and Sheets, accounted for more than 30% of turnover in FY 13
Innovative Products as Significant Contributor

Welspun Group | Textiles
Pricing power on account of long-term relationship with clients Welspun has developed strong relationships with clients over the years, which gives it better
pricing power
Most clients on an index-based pricing Price varies up or down with changes in major input costs
This reduces volatility in margins
16
60
80
100
120
140
160
180Index (Jan 10 = 100)
Contact price – Sample contract with one of our clients for a particular product

Welspun Group | Textiles
17
Financial Snapshot – In Indian Rupees
Balance Sheet Extract – With merger impact
Profitability Extract – Continuing business
Key Ratios
(All figures except ratios in Rs. Million)
** NCA do not include Cash & Cash Equivalents
* Annualized ROE = PAT/Net worth ROCE (post tax) = EBIT (1-Tax rate)/(Net worth + Long-term + Short-term debt- Cash)
*On account of the change in depreciation policy from straight line method to reducing balance
method, the Company has taken an additional one–time depreciation of Rs. 4,631 million (for the
period up to June 30, 2013) in Q2 FY14. The 9M FY14 figures are normalized by removing this
one-off effect.
Particulars FY11 FY12 FY13 9M FY14
Net Worth 7,461 7,428 9,902 9,347
Short Term Loans 6,847 7,313 9,166 10,588
Long Term Loans 13,255 12,309 11,079 16,304
Gross Debt 20,102 19,621 20,244 26,891
Cash, Cash Eqnts & Inv. 2,590 3,041 2,798 2,469
Net Debt 17,512 16,580 17,446 24,422
Net Fixed Assets (incl CWIP) 17,979 17,995 18,615 23,923
Net Current Assets** 9,033 6,290 8,221 8,808
Solvency ratios FY11 FY12 FY13 9M FY14*
Fixed assets/Long term debt 1.44 1.47 1.68 1.47
Gross debt/Equity 2.69 2.64 2.04 2.88
Net debt/Equity 2.35 2.23 1.76 2.61
Net Long Term Debt / Equity 1.43 1.25 0.84 1.48
Long term debt/Equity 1.67 1.65 1.12 1.74
Net debt/Op. EBITDA 4.84 3.01 2.93 2.61
Operational ratios FY11 FY12 FY13 9M FY14*
Asset turnover 0.83 1.02 1.13 1.16
Inventory days 98 83 82 72
Debtor days 28 28 28 38
Payable days 66 59 50 52
Cash conversion cycle 60 52 60 58
Return ratios FY11 FY12 FY13 9M FY14*
ROE 12.7% 26.7% 22.7% 45.1%
ROCE (post-tax) 6.9% 12.2% 11.4% 16.1%
Particulars FY11 FY12 FY13 9M FY14*
Sales revenue 24,471 29,329 36,473 33,105
Operating EBITDA 3,615 5,566 5,946 7,007
Operating EBITDA Margin 14.8% 19.0% 16.3% 21.2%
EBITDA 3,994 5,960 6,438 7,760
EBITDA Margin 16.3% 20.3% 17.7% 23.4%
PBT 1,463 2,811 3,013 4,647
PAT 951 1,986 2,248 3,160
PAT Margin 3.9% 6.8% 6.2% 9.5%
Cash PAT 2,642 3,603 4,178 4,746

Welspun Group | Textiles
Quarterly Trend of Key Financial Figures
18
6,000
7,500
9,000
10,500
12,000
13,500
Q1 - 13 Q2 - 13 Q3 - 13 Q4 - 13 Q1 - 14 Q2 - 14 Q3 - 14
Rs
in M
iilio
n
Revenues
500
1,000
1,500
2,000
2,500
3,000
Q1 - 13 Q2 - 13 Q3 - 13 Q4 - 13 Q1 - 14 Q2 - 14 Q3 - 14
Rs
in M
iilio
n
EBIDTA
200
400
600
800
1,000
1,200
1,400
Q1 - 13 Q2 - 13 Q3 - 13 Q4 - 13 Q1 - 14 Q2 - 14 Q3 - 14
Rs
in M
iilio
n
PAT After Minority
500
700
900
1,100
1,300
1,500
1,700
1,900
Q1 - 13 Q2 - 13 Q3 - 13 Q4 - 13 Q1 - 14 Q2 - 14 Q3 - 14
Rs
in M
iilio
n
Cash PAT

Welspun Group | Textiles
Capex plans Total capex plan of Rs. 24 billion
Committed capex of Rs. 14 billion
Phase-1 – Capex of Rs. 11 billion in FY14 is close to completion
Focussed on backward integration and debottlenecking
1,70,000 spindles and 140 looms to be set up
Benefits to accrue from Q2 FY15
Phase- 2 – Potential maximum Capex of Rs. 13 billion over FY15 and FY16
Only INR 3 billion committed: To be used for modernisation of Vapi plant
Remaining to be focussed on calibrated finished product capacity expansion
Attempts to reduce uncommitted capex through ancillarisation by promoting textile parks
As a result of the expansion, capacities expected to increase as under
19
Product Capacities FY14 FY15 FY16
Towels (MT) 45,000 50,000 60,000
Sheets (‘000 metres) 55,000 60,000 72,000
Rugs incl Carpets(MT) 12,000 15,000 20,000

Welspun Group | Textiles
CSR and Environmental Leadership
Empowerment & Health
Education Environment
Tie-ups with Non Governmental Organizations / Developmental
Agencies/ Institutions
Welspun Programs Facilitating Government Initiatives
CSR Initiatives
Implementation Mediums
CORE FOCUS
OUTREACH
When Industry Cares…. The Community Smiles
20
Welspun Group | Textiles
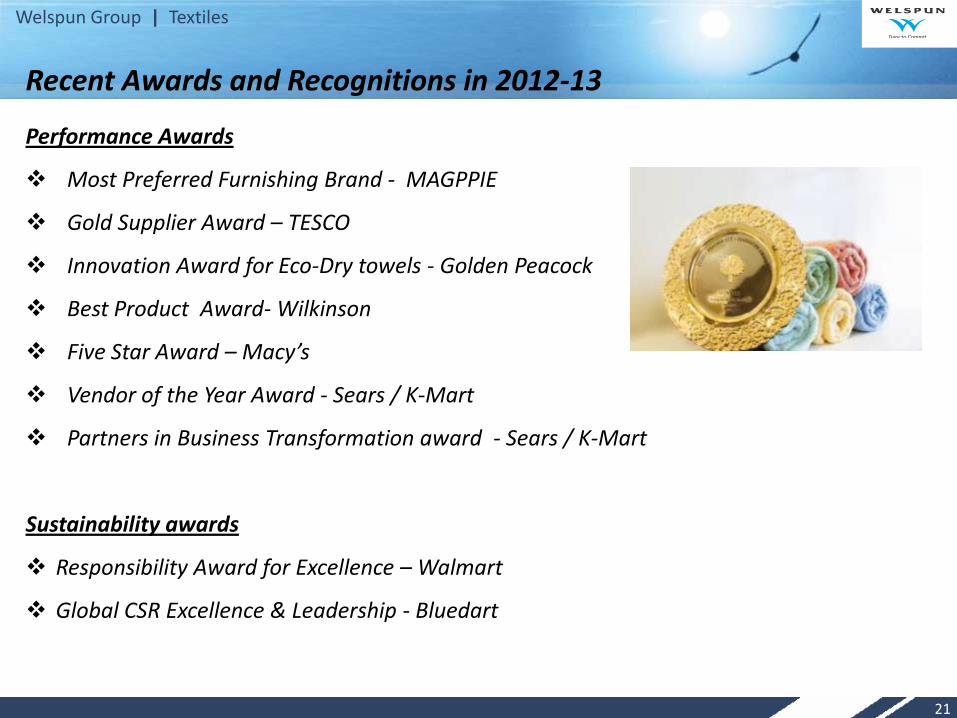
Performance Awards
Most Preferred Furnishing Brand - MAGPPIE
Gold Supplier Award – TESCO
Innovation Award for Eco-Dry towels - Golden Peacock
Best Product Award- Wilkinson
Five Star Award – Macy’s
Vendor of the Year Award - Sears / K-Mart
Partners in Business Transformation award - Sears / K-Mart
Sustainability awards
Responsibility Award for Excellence – Walmart
Global CSR Excellence & Leadership - Bluedart
Recent Awards and Recognitions in 2012-13
21
Welspun Group | Textiles
Way Ahead
Focus on stringent cost controls, foray into new markets and consolidation and
streamlining of operations to maximize ROIC
Continued emphasis on innovation
Strong focus on the high growth domestic market through
Shop-in-shop in large retail stores which entail no capex and low risk
Wholesale distributors
Institutional clients such as hotels
E-commerce
Increase presence in new markets like Canada, South Africa, Japan, Korea and Australia
Capex to be focused more on backward integration and modernization in India
Efforts to reduce capex through ancilliarisation
WIL well placed with high end global scale capacity, skilled workforce, product knowledge expertise and coordinated marketing approach to capitalize on growth opportunities
22

Welspun Group | Textiles
Key risks
Tariff or Non-tariff Trade barriers imposed by key importing countries
Removal of export incentives by the Indian government
People risks – Managing Industrial Relations
23
Welspun Group | Textiles
Thank You
For further details, please contact:
Harish Venkateswaran
General Manager - Group Finance and Strategy
Email: [email protected]
Akhil Jindal
Director – Group Finance and Strategy
Email: [email protected]
Company Website: www.welspunindia.com
24