repository.um.edu.myrepository.um.edu.my/94873/1/spot welding.pdf · Abstract Resistance spot...
14
1 23 The International Journal of Advanced Manufacturing Technology ISSN 0268-3768 Int J Adv Manuf Technol DOI 10.1007/s00170-014-6158-z Material characterizations of mild steels, stainless steels, and both steel mixed joints under resistance spot welding (2-mm sheets) Nachimani Charde, Farazila Yusof & Rajprasad Rajkumar
Transcript of repository.um.edu.myrepository.um.edu.my/94873/1/spot welding.pdf · Abstract Resistance spot...
1 23
The International Journal ofAdvanced Manufacturing Technology ISSN 0268-3768 Int J Adv Manuf TechnolDOI 10.1007/s00170-014-6158-z
Material characterizations of mild steels,stainless steels, and both steel mixed jointsunder resistance spot welding (2-mmsheets)
Nachimani Charde, Farazila Yusof &Rajprasad Rajkumar
1 23
Your article is protected by copyright and
all rights are held exclusively by Springer-
Verlag London. This e-offprint is for personal
use only and shall not be self-archived
in electronic repositories. If you wish to
self-archive your article, please use the
accepted manuscript version for posting on
your own website. You may further deposit
the accepted manuscript version in any
repository, provided it is only made publicly
available 12 months after official publication
or later and provided acknowledgement is
given to the original source of publication
and a link is inserted to the published article
on Springer's website. The link must be
accompanied by the following text: "The final
publication is available at link.springer.com”.
ORIGINAL ARTICLE
Material characterizations of mild steels, stainless steels, and bothsteel mixed joints under resistance spot welding (2-mm sheets)
Nachimani Charde & Farazila Yusof &Rajprasad Rajkumar
Received: 13 March 2014 /Accepted: 7 July 2014# Springer-Verlag London 2014
Abstract Resistance spot welding is an essential weldingmechanism for joining two or more metal sheets together inautomotive industries. The mechanical assemblies are easilyjoined at discrete spots using high current flow through thearea of concentration. It is easily achieved by compressing thebase metals together to a certain pressure using copper elec-trode caps and allow the high current to flow through theconcerned areas. The heat generation due to the current flowcauses the metal sheets to be fused and consequently formbonds between base metals. The molten areas of base metalsundergo solidification process by itself when the current flowis utterly stopped. Basically, the weld growth in any joint isdetermined by its process-controlling parameters, particularlythe welding current, weld time, electrode force, and electrodetip. In these experiments, the welding current and weld timevariations were carried out to characterize the weld growth forthree types of joints mainly for stainless steel, mild steel, andboth steel mixed joint. A pneumatically driven 75-kVA spotwelder was used to accomplish the entire welding processes,and the welded samples were later subjected to tensile, hard-ness, and metallurgical tests to relate the diameter growth,loading force during tensile test, failure crack initiation,post-failure crack propagation direction, macro and micro-structural changes, and also the hardness changes due to
solidification process. Assessing the experimental results of2-mm thickness of materials revealed that the welded areas’characteristics have been varied from its original states toenriched states, in terms of shearing strength and hardnessdistribution as well as the microstructural orientation.
Keyword Stainless steelwelding .Mild steelwelding . Joinedmaterials . Dissimilar joints
1 Introduction
A common metal-joining technique that used to join two ormore metal sheets together through fusion is called as spotwelding. It is accomplished by allowing high current to flowthrough metal sheets at discrete spots. The welding currentand weld time lead the root penetration between metals whilethe electrode pressing force and electrode tips hold the spotsfirmly in a welding process [1]. This process basically usestwo copper electrodes to compress the sheets together andsupplies huge amount of current (typically kA) through thecontact area of electrodes. The flow of welding current againstthe series of resistances (electrodes to sheets’ resistances, bulkresistances, and sheets to sheets’ resistances) establish resis-tive path for high current flow. These huge amounts of currentflow cause heat generation and gradually melt the fayingsurfaces of base metals as the time goes during the weldingprocess [2, 3]. The highest resistive areas will initially bemelted, and the melt itself grows or expands in all directionequally for similar base metals. As for the dissimilar weldjoints, there will be heat imbalance occurrences in the weldgeometry resulting in different weld diameters [4]. Once thecurrent flow is fully stopped, the fused area will then besolidified. The diameter growth of solidified areas betweenmild steel and stainless steel varies from each other as mildsteels offer its critical diameter growth as 3t0.5 whereas the
N. Charde (*) : F. YusofDepartment of Engineering Design and Manufacture, Faculty ofEngineering, University of Malaya, 50603 Kuala Lumpur, Malaysiae-mail: [email protected]
F. Yusofe-mail: [email protected]
R. RajkumarDepartment of Mechanical, Material and ManufacturingEngineering, The University of Nottingham UK, Malaysia Campus,JalanBroga, 43500 Semenyih, Selangor Darul Ehsan, Malaysiae-mail: [email protected]
Int J Adv Manuf TechnolDOI 10.1007/s00170-014-6158-z
Author's personal copy
stainless steels offer its critical diameter growth as 4t0.5; let ‘t’be the thickness of base metals in millimeter [5, 6]. The fusedand solidified areas of base metals are called as weld nuggetsfrom here on and it consists of four major zones. They arecategorized as fusion zone (FZ) or weld nugget, heat-affectedzone (HAZ), heat-extended zones (HEZ), and base metals(BM). Some researchers combine the heat-affected and heat-extended zones as one region, but I treat it separately so as tocompare with SORPAS simulation results. The proper weldjoints or bonds between sheets are usually formed by thefusion zones at which the microstructural alterations fullyhappened during solidification. The heat-affected zones doexist due to the thermal conduction around the fusion zonesand also altered the microstructures partially. However, theheat-extended zone does exist because of the materials’ ther-mal conductivity rates. This region is still categorized underthe heat-affected zones because of the partial or sometimeminimal microstructural changes. These regions are certainlyseen in mild steel as compared to stainless steel in addition tothe dissimilar weld joint. The other part of the entire basemetals remained unchanged. The weld nugget growths arebasically determined by the controlling parameters, primarilythe welding current, welding time, electrode pressing force,and electrode tip diameter [7]. These are the four commonparameters that enable a weld growth as it influences soundwelds to prolong the stiffness of any metal joints. In thisexperiment, the current and weld time were varied while
electrode force and tips remained unchanged to characterizethe weld growth for 2-mm base metals of stainless steel andmild steel sheets as 2-mm thickness is very rare in size that isused in spot-welding research. As such, this paper will lead tonew understanding of higher-thickness materials in RSW.
2 Experimental
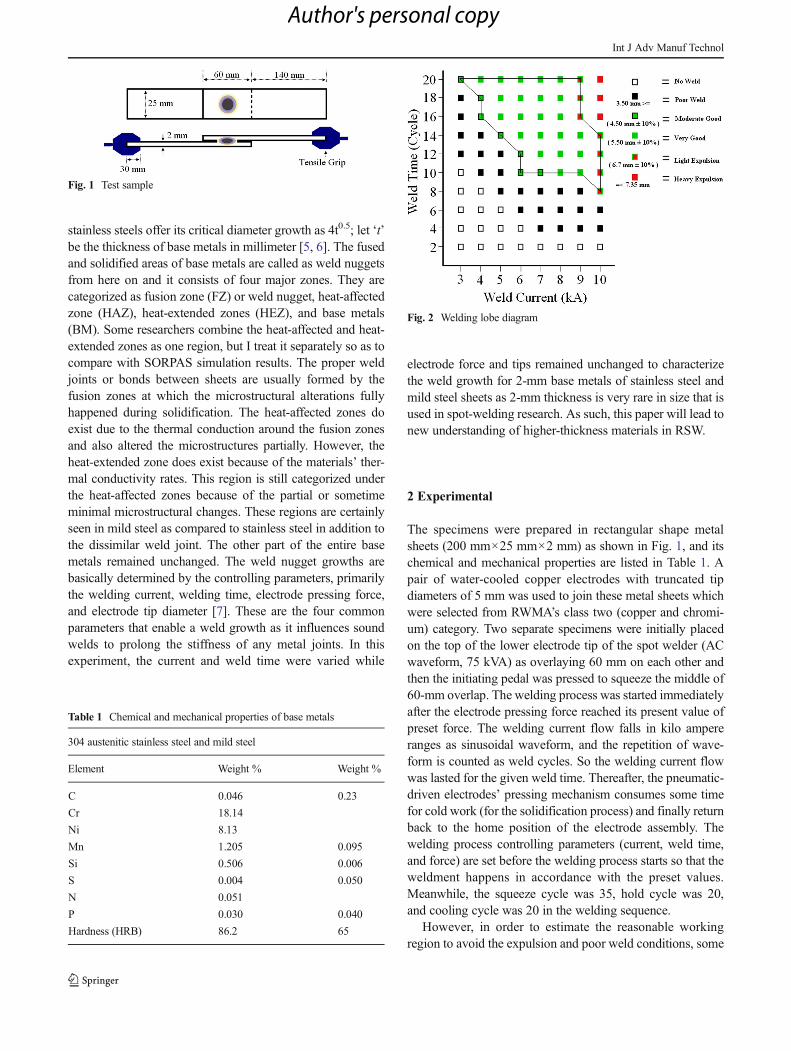
The specimens were prepared in rectangular shape metalsheets (200 mm×25 mm×2 mm) as shown in Fig. 1, and itschemical and mechanical properties are listed in Table 1. Apair of water-cooled copper electrodes with truncated tipdiameters of 5 mm was used to join these metal sheets whichwere selected from RWMA’s class two (copper and chromi-um) category. Two separate specimens were initially placedon the top of the lower electrode tip of the spot welder (ACwaveform, 75 kVA) as overlaying 60 mm on each other andthen the initiating pedal was pressed to squeeze the middle of60-mm overlap. The welding process was started immediatelyafter the electrode pressing force reached its present value ofpreset force. The welding current flow falls in kilo ampereranges as sinusoidal waveform, and the repetition of wave-form is counted as weld cycles. So the welding current flowwas lasted for the given weld time. Thereafter, the pneumatic-driven electrodes’ pressing mechanism consumes some timefor cold work (for the solidification process) and finally returnback to the home position of the electrode assembly. Thewelding process controlling parameters (current, weld time,and force) are set before the welding process starts so that theweldment happens in accordance with the preset values.Meanwhile, the squeeze cycle was 35, hold cycle was 20,and cooling cycle was 20 in the welding sequence.
However, in order to estimate the reasonable workingregion to avoid the expulsion and poor weld conditions, some
Fig. 1 Test sample
Table 1 Chemical and mechanical properties of base metals
304 austenitic stainless steel and mild steel
Element Weight % Weight %
C 0.046 0.23
Cr 18.14
Ni 8.13
Mn 1.205 0.095
Si 0.506 0.006
S 0.004 0.050
N 0.051
P 0.030 0.040
Hardness (HRB) 86.2 65
Fig. 2 Welding lobe diagram
Int J Adv Manuf Technol
Author's personal copy
welding processes were conducted prior to final experiments.By done so, the good working region was predicted, and theresult is shown in Fig. 2.
Figure 2 shows the welding lobe curve for 2-mm samplesheets with constant force (3 kN) and unchanged circle elec-trode tips (5 mm of diameter). The electrode force and elec-trode tip were selected based on the manufacturers’ manual.Thus, according to Fig. 2, the weld lobe boundary indicatedby continuous black color lines delineates all acceptablewelding regions. The colored symbols represent the qualityof welds that produced, and conditions that did not produceany weld are indicated by white boxes. The green-coloredboxes with black borders represent moderate to good welds;the fully green boxes represent very good welds; the red-colored boxes bordered in green represent welds for whichlight expulsion occurred; the red boxes represent heavy ex-pulsion; and the black boxes represent poor weld joints. Aweld schedule was initially developed based on the weldinglobe to avoid expulsion and poor welding conditions becausethe scope of this paper is to investigate the weld growth ingood working regions. So the process parameters that of thewelding current and welding time are equally spaced betweentheir regions. Assumption follows the welding lobe contourand therefore three levels of welding current (7, 8, 9 kA) and
welding time (10, 15, 20 cycle) were established. Based onthis simple prediction, nine weld schedules were finalized aslisted in Table 2. During the welding process, seven pairs ofbase metals were developed for each weld schedule. Five outof seven were used for tensile test, and the correspondingaverage value was considered for that particular weld sched-ule. One pair of specimen was used for hardness test, and thefinal one pair of specimen was used for metallurgical test.
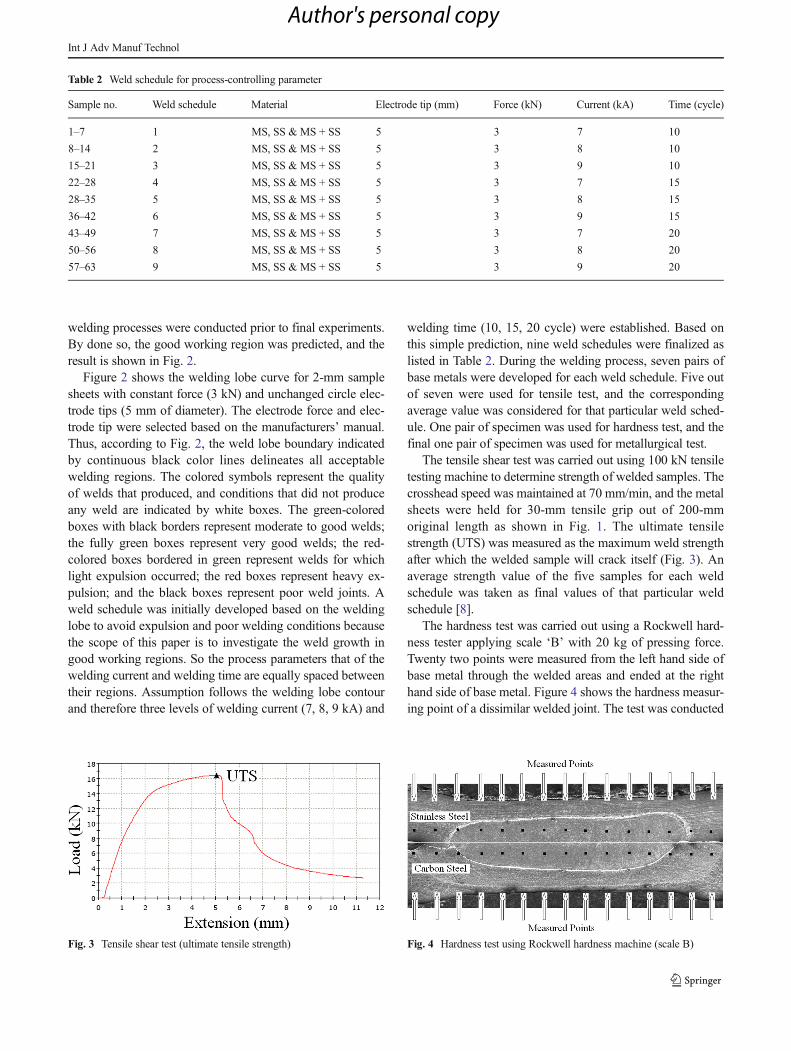
The tensile shear test was carried out using 100 kN tensiletesting machine to determine strength of welded samples. Thecrosshead speed was maintained at 70 mm/min, and the metalsheets were held for 30-mm tensile grip out of 200-mmoriginal length as shown in Fig. 1. The ultimate tensilestrength (UTS) was measured as the maximum weld strengthafter which the welded sample will crack itself (Fig. 3). Anaverage strength value of the five samples for each weldschedule was taken as final values of that particular weldschedule [8].
The hardness test was carried out using a Rockwell hard-ness tester applying scale ‘B’ with 20 kg of pressing force.Twenty two points were measured from the left hand side ofbase metal through the welded areas and ended at the righthand side of base metal. Figure 4 shows the hardness measur-ing point of a dissimilar welded joint. The test was conducted
Table 2 Weld schedule for process-controlling parameter
Sample no. Weld schedule Material Electrode tip (mm) Force (kN) Current (kA) Time (cycle)
1–7 1 MS, SS & MS + SS 5 3 7 10
8–14 2 MS, SS & MS + SS 5 3 8 10
15–21 3 MS, SS & MS + SS 5 3 9 10
22–28 4 MS, SS & MS + SS 5 3 7 15
28–35 5 MS, SS & MS + SS 5 3 8 15
36–42 6 MS, SS & MS + SS 5 3 9 15
43–49 7 MS, SS & MS + SS 5 3 7 20
50–56 8 MS, SS & MS + SS 5 3 8 20
57–63 9 MS, SS & MS + SS 5 3 9 20
Fig. 3 Tensile shear test (ultimate tensile strength) Fig. 4 Hardness test using Rockwell hardness machine (scale B)
Int J Adv Manuf Technol
Author's personal copy
for both sides of welded joint. However, for the mild steel andstainless steels, only one side of measurement was taken intoconsideration though both sides were measured.
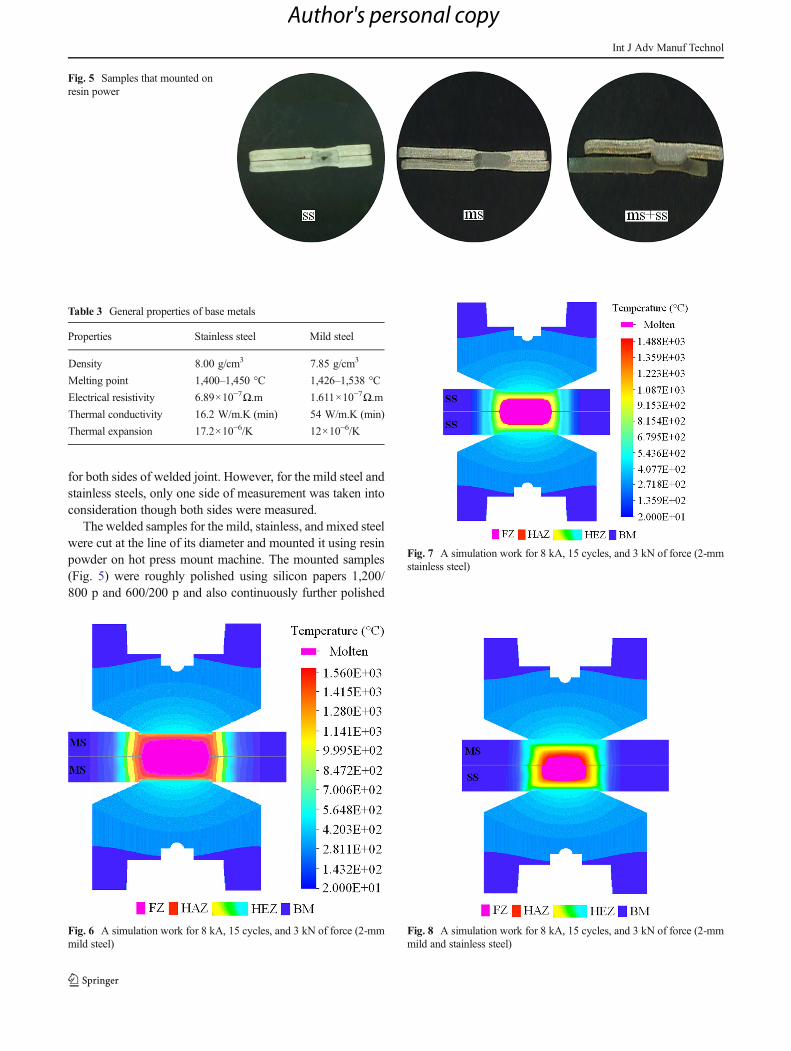
The welded samples for the mild, stainless, and mixed steelwere cut at the line of its diameter and mounted it using resinpowder on hot press mount machine. The mounted samples(Fig. 5) were roughly polished using silicon papers 1,200/800 p and 600/200 p and also continuously further polished
Fig. 5 Samples that mounted onresin power
Table 3 General properties of base metals
Properties Stainless steel Mild steel
Density 8.00 g/cm3 7.85 g/cm3
Melting point 1,400–1,450 °C 1,426–1,538 °C
Electrical resistivity 6.89×10⁻⁷Ω.m 1.611×10⁻⁷Ω.m
Thermal conductivity 16.2 W/m.K (min) 54 W/m.K (min)
Thermal expansion 17.2×10⁻⁶/K 12×10−6/K
Fig. 6 A simulation work for 8 kA, 15 cycles, and 3 kN of force (2-mmmild steel)
Fig. 7 A simulation work for 8 kA, 15 cycles, and 3 kN of force (2-mmstainless steel)
Fig. 8 A simulation work for 8 kA, 15 cycles, and 3 kN of force (2-mmmild and stainless steel)
Int J Adv Manuf Technol
Author's personal copy
using Metadi polishing cloth with suspension liquid of0.05 micron. This polishing process has been conducted forabout 30 min to 1 h on each sample until the shining surfaceswere seen. The well-polished samples were later kept innitrogen-filled chamber to reduce the oxidation effects beforetaking into the SEM scanner. At last, the ferric chloride(500 ml for 10 samples) was used to etch these well-prepared samples in a pot for about 30–45 min. After that,the samples were rinsed off using plain water and dried usingan air blower. It was sent to SEM scanning procedures withoutany delay because the mild steels are very sensitive to atmo-spheric moisture.
3 Results and discussion
3.1 A comparative study of simulation and real weld joints
Simulation procedures for the similar and dissimilar weldjoints (mild and stainless steel) were performed usingSORPAS, the spot-welding process software before the realexperiment starts. In SORPAS, the electrical-mechanical-thermal characteristics’ equations or boundary conditions orcontact resistance’s characteristics are all built in so the userhas to select only few parameters such as the thickness of basemetals, material type, electrode tip diameter, process parame-ters, and so on. As the results of simulation works for mild,stainless, and mixed steels, symmetrical weld zones for sim-ilar steels and asymmetrical weld zones for dissimilar steelswere obtained. These are quite possible because of the differ-ent electrical properties of base materials which may lead todifferent thermal flow characteristics (Table 3). Thereby, thesimulative results of welded zones are categorized into fourregions so as to compare with the real welded samples pre-cisely. The noticeable zones are firstly, the fusion zone,
secondly, the heat-affected zone, thirdly, the heat-extendedzone, and fourthly, the base metal.
Table 3 lists the general properties of mild and stainlesssteels. From the table itself, it is clearly seen that the meltingpoint of both materials are slightly differed from each other sothe melting process starts at different rates of temperaturewhen fused together.
As for the mild steel weld joint (Fig. 6), it is simulated for8 kA, 15 cycles, and 3 kN of force. The thermal conductivityrate is higher as compared to stainless steels and thereforewider range of heat-affected (HAZ) and heat-extended (HEZ)zones is noticed in the mild steel welds [9]. However, thefusion zone of mild steel seemed to be shorter in diameter ascompared to stainless steel because of the thermal expansionrate. It can be compared from the simulation results for bothsteels (Fig. 7).
On the other hand, the thermal conductivity rate is lower instainless steel as compared to mild steel which results inshorter heat-affected and heat-extended regions. However,the diameter of welded regions looked to be wider as com-pared to mild steel due to the thermal expansion rate [10]. Thisphenomenon is certainly noticed when both sheets werewelded together. Figure 8 shows the asymmetrical weld re-gions as it contained dissimilar metal sheets of mild andstainless steels [11]. So it is now clearly seen that the weldedareas in dissimilar steels have heat imbalances and resultingasymmetrical weld bead.
3.2 Diameter increments and tensile shear test
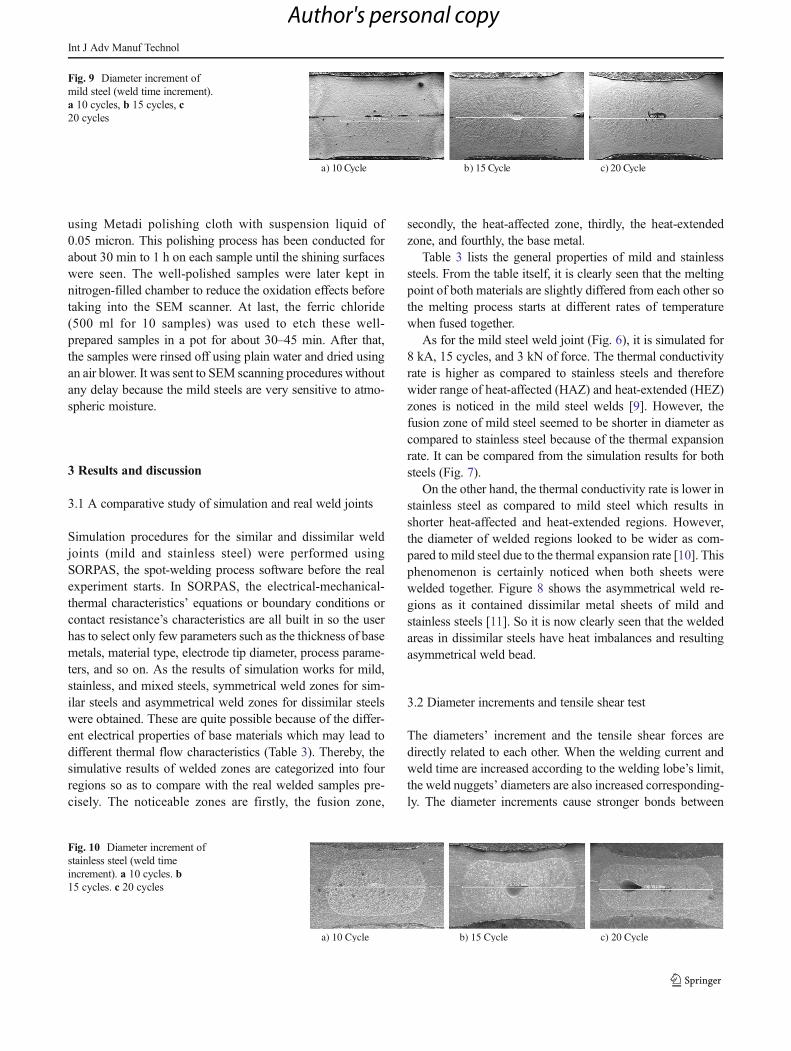
The diameters’ increment and the tensile shear forces aredirectly related to each other. When the welding current andweld time are increased according to the welding lobe’s limit,the weld nuggets’ diameters are also increased corresponding-ly. The diameter increments cause stronger bonds between
a) 10 Cycle b) 15 Cycle c) 20 Cycle
Fig. 9 Diameter increment ofmild steel (weld time increment).a 10 cycles, b 15 cycles, c20 cycles
a) 10 Cycle b) 15 Cycle c) 20 Cycle
Fig. 10 Diameter increment ofstainless steel (weld timeincrement). a 10 cycles. b15 cycles. c 20 cycles
Int J Adv Manuf Technol
Author's personal copy

sheets and therefore more tensile shear force is required tobreak the weld joints. Figures 9, 10, and 11 are showing thesamples that subjected to weld time increments. A comparisonof all the three different weld joints and the correspondingtensile failure modes is shown in Fig. 12 for the weld timeincrements.
Similarly, Figs. 13, 14, and 15 are showing the samples thatsubjected to welding current increments. A comparison of allthe three different weld joints and the corresponding tensilefailure modes are shown in Fig. 16 for the welding currentincrements.
Having considered the tensile shear test, the welding cur-rent and weld time increments have proportionally increasedthe diameters of welded areas and required more tensile shearforces to break the bonds between metal sheets (weld joints)regardless of base metals [12]. For instance, when the currentfrom 7 to 8 kA and 8 to 9 kAwere increased, the diameters ofweld nuggets were increased and consequently more tensileforce were drawn to break the welded joints. Similar type oftensile force increments was noticed for the weld time
increments. Thus, when the weld time from 10 to 15 cyclesand 15 to 20 cycles were gradually increased, the diameters ofweld nuggets increased and thereby higher tensile forces wererequired to break the bounds as how we saw in the weldingcurrent increments. It may be recalled from the Joules law tounderstand mathematically that the heat is proportional to thesquared welding current and the resistance of the path as wellas the welding time (Q=I2Rt). Moreover, the tensile shearforce of stainless steel seemed to be higher as compared tomild steel because of the natural material strength. However,the mixed steels’ strength fall between both steels’ strength asshown in Fig. 3. The tensile test results are shown in Fig. 3 formild steel, stainless steel, and both steel mixed joints (Fig. 17).
3.3 Failure modes of tensile test
Having considered the failure modes of tensile test, the con-ventional way of checking the crack initiations is followed inaccordance with weld types. For example, an improper orinsufficient weld joint will fracture itself as interfacial failureand a better weld joint will fracture itself as pullout fracture[13, 14]. By checking so, there is no difference between betterand best weld joint, although it can be used to differentiatefrom poor failures (IF). Hence, the post-crack initiating prop-agation was observed in this experiment in order to differen-tiate the better and best weld joints. In such ways, the interfa-cial fracture (IF) is still remained as interfacial failure (IF) butthe pullout failure is divided into two category as partialfracture (PF) and pullout fracture or button pullout (TF). Thus,a moderately good weld has crack from heat-affected zone ofeither sides and the resulting partial fracture (PF) of basemetals. These types of fractures are acceptable as good weldjoints, but it has high tendency of neck breaking during tensiletest. However, a very good weld has better bonding betweensheets and resulting tear from both sides (TF) when post-crack
Fig. 12 Diameter increment for all the material (weld time increments)
a) 7 kA b) 8 kA c) 9 kA
Fig. 13 Diameter increment ofmild steel (welding currentincrements).a 7 kA, b 8 kA, c9 kA
a) 10 Cycle b) 15 Cycle c) 20 Cycle
Fig. 11 Diameter increment ofdissimilar (mild + stainless) steel(weld time increment). a10 cycles. b 15 cycles. c 20 cycles
Int J Adv Manuf Technol
Author's personal copy

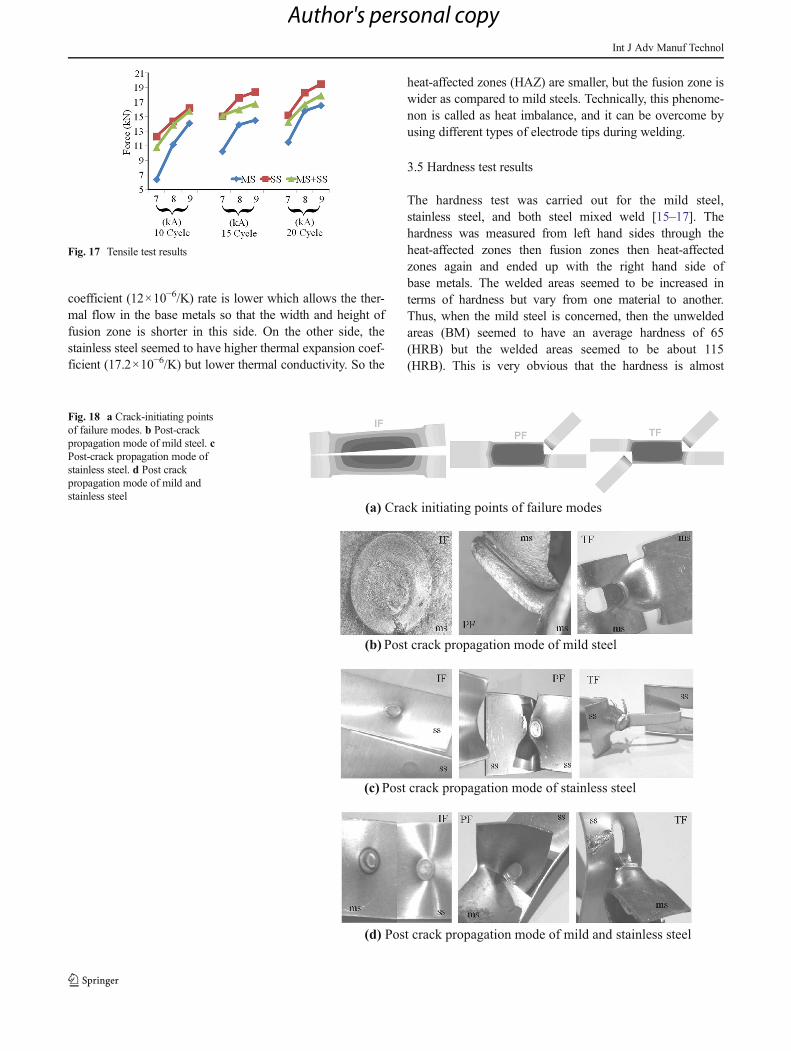
failure test is carried out. So the post-crack-initiating propa-gation was studied to differentiate the better and best weldjoints. Furthermore, when dissimilar weld joints are subjectedto tensile shear test, the weaker side (mild steel) breaks firstand consecutively the stronger side (stainless steel) followsthereafter. In this experiment, the post-crack failures are no-ticed for all the three different weld joints. Figure 18a showsthe exact places where the crack initiates during tensile test,and the following figures (Fig. 18b–d) are showing the mildsteels, stainless steels, and both steels’ mixed post-crack fail-ures, respectively.
3.4 Metallurgical study
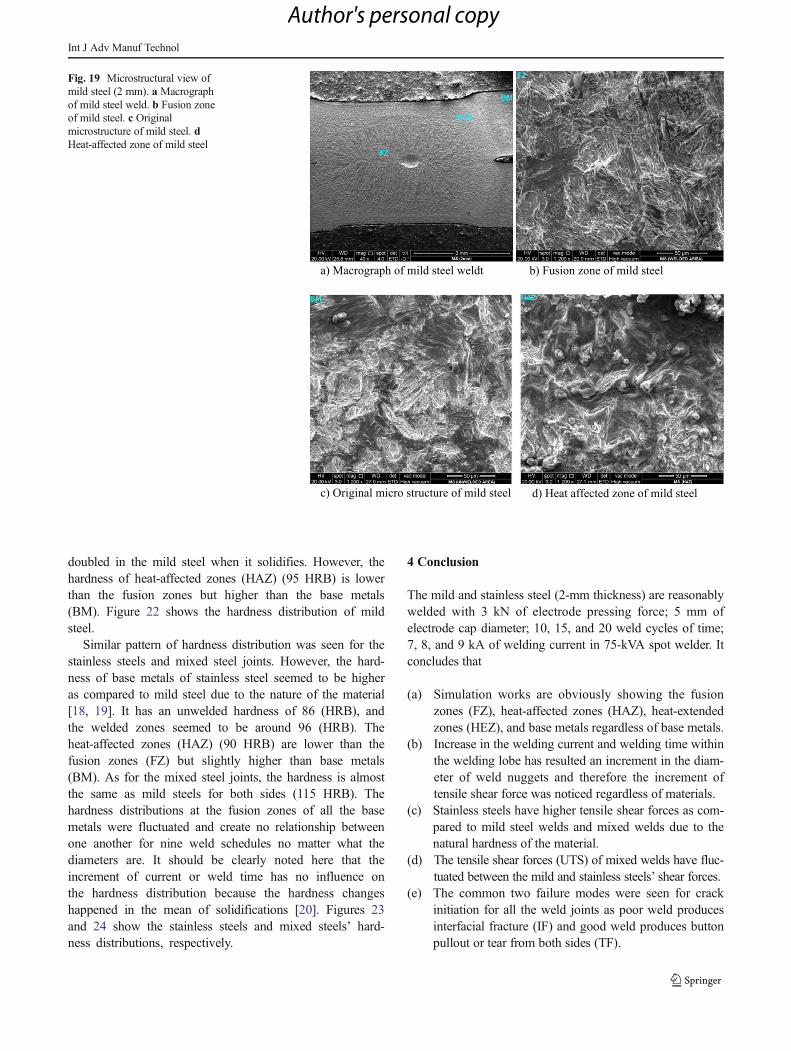
The metallurgical study of mild, stainless, and mixed steels’weld joints have given clear pictures of weld nugget diametersand its microstructural organizations. The fusion zone of mildsteel seemed to be coarse grains while the heat-affected areasseemed to be finer grains regardless of controlling parameterchanges. The macro and micrographs of these patterns havebeen noticed for mild steel and it has been shown in Fig. 19a–d.
The parameter changes have directly influenced the grainsat both: the fusion zones and the heat-affected zones. The basemetals’ microstructures have more pearlite and less ferrite inits region as how it was made about with smaller grains ascompared to the other two zones. The heat-affected zones aretransformed into martensite phases with some areas of pearliteand ferrite with refined grains. Moreover, the heat-extendedzones are also slightly affected with this transformation. How-ever, the fusion zones seemed to be coarsened and were largerin grain size as compared to the other two regions. This regionhad the highest martensite formation with very few areas ofpearlite nodules [15]. Similar types of results were noticed foraustenitic stainless steel except the heat-affected zones. Theheat-affected zones were seen to be a much narrowed region
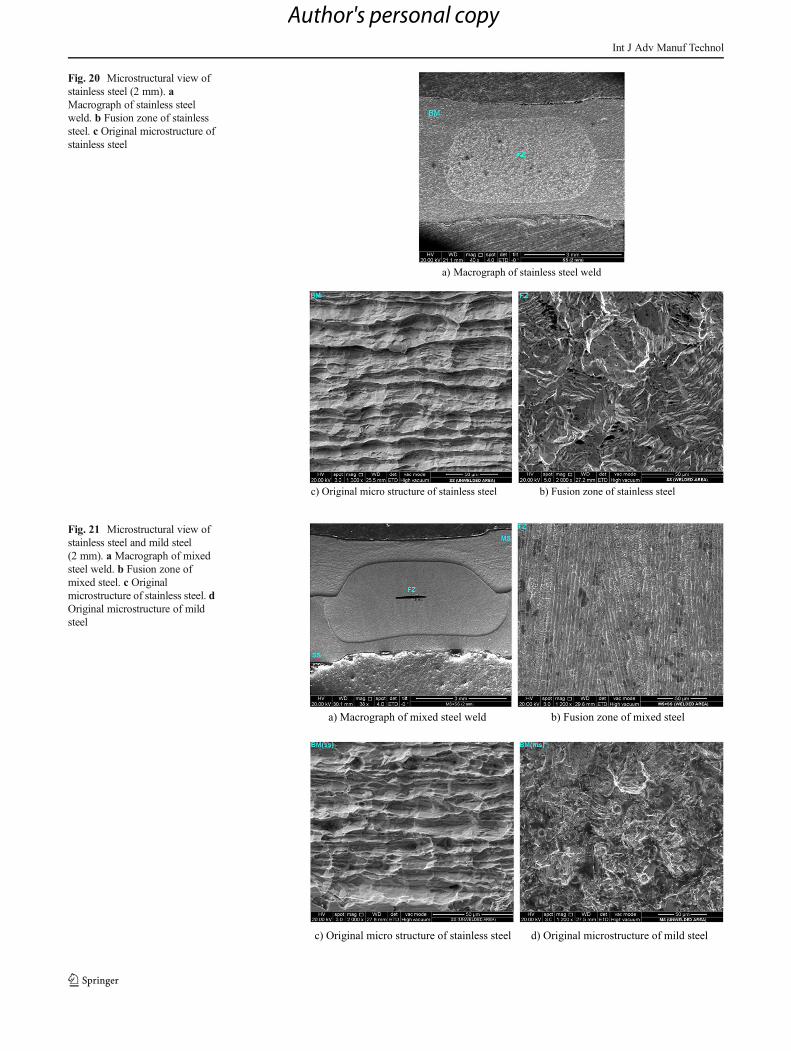
next to the fusion zones, and the heat-extended zones are notcompletely seen [16]. Figure 20 shows the complete micro-structure view of welded and unwelded areas of 2-mm aus-tenitic stainless steel. The chromium (Cr) to nickel (Ni) ratiowas altered during the welding process which resulted thelathy ferrite to be increased when it undergoes the cold work.During the solidification process, it transforms into austenite,leaving the core of ferritic dendrite as skeleton (vermicular)[17]. The columnar dendrites were rearranged randomly.
The heat imbalance (asymmetrical welded zone) is clearlyseen in Fig. 21 as the mild and stainless steels have differentthermal and electrical properties as seen in the simulationworks [18]. The heat misbalancing problem can be overcomeby using servo-based force actuator or using additional resis-tance pad between the electrode and stainless steel side as howAmerican Welding Society suggests. Recalling the literature,the thermal conductivity coefficients (54 W/m.K (min)) arehigher in mild steels as compared to stainless steels (16.2 W/m.K (min)); therefore, wider ranges of heat-affected zones(HAZ) are noticed. However, the thermal expansion
a) 7 kA b) 8 kA c) 9 kA
Fig. 14 Diameter increment ofstainless steel (welding currentincrements). a 7 kA, b 8 kA, c9 kA
a) 7 kA b) 8 kA c) 9 kA
Fig. 15 Diameter increment ofdissimilar (mild + stainless) steel(welding current increments). a7 kA, b 8 kA, c 9 kA
Fig. 16 Diameter increment for all the material (welding currentincrements)
Int J Adv Manuf Technol
Author's personal copy
coefficient (12×10−6/K) rate is lower which allows the ther-mal flow in the base metals so that the width and height offusion zone is shorter in this side. On the other side, thestainless steel seemed to have higher thermal expansion coef-ficient (17.2×10⁻⁶/K) but lower thermal conductivity. So the
heat-affected zones (HAZ) are smaller, but the fusion zone iswider as compared to mild steels. Technically, this phenome-non is called as heat imbalance, and it can be overcome byusing different types of electrode tips during welding.
3.5 Hardness test results
The hardness test was carried out for the mild steel,stainless steel, and both steel mixed weld [15–17]. Thehardness was measured from left hand sides through theheat-affected zones then fusion zones then heat-affectedzones again and ended up with the right hand side ofbase metals. The welded areas seemed to be increased interms of hardness but vary from one material to another.Thus, when the mild steel is concerned, then the unweldedareas (BM) seemed to have an average hardness of 65(HRB) but the welded areas seemed to be about 115(HRB). This is very obvious that the hardness is almost
(a) Crack initiating points of failure modes
(b)Post crack propagation mode of mild steel
(c) Post crack propagation mode of stainless steel
(d) Post crack propagation mode of mild and stainless steel
Fig. 18 a Crack-initiating pointsof failure modes. b Post-crackpropagation mode of mild steel. cPost-crack propagation mode ofstainless steel. d Post crackpropagation mode of mild andstainless steel
Fig. 17 Tensile test results
Int J Adv Manuf Technol
Author's personal copy
doubled in the mild steel when it solidifies. However, thehardness of heat-affected zones (HAZ) (95 HRB) is lowerthan the fusion zones but higher than the base metals(BM). Figure 22 shows the hardness distribution of mildsteel.
Similar pattern of hardness distribution was seen for thestainless steels and mixed steel joints. However, the hard-ness of base metals of stainless steel seemed to be higheras compared to mild steel due to the nature of the material[18, 19]. It has an unwelded hardness of 86 (HRB), andthe welded zones seemed to be around 96 (HRB). Theheat-affected zones (HAZ) (90 HRB) are lower than thefusion zones (FZ) but slightly higher than base metals(BM). As for the mixed steel joints, the hardness is almostthe same as mild steels for both sides (115 HRB). Thehardness distributions at the fusion zones of all the basemetals were fluctuated and create no relationship betweenone another for nine weld schedules no matter what thediameters are. It should be clearly noted here that theincrement of current or weld time has no influence onthe hardness distribution because the hardness changeshappened in the mean of solidifications [20]. Figures 23and 24 show the stainless steels and mixed steels’ hard-ness distributions, respectively.
4 Conclusion
The mild and stainless steel (2-mm thickness) are reasonablywelded with 3 kN of electrode pressing force; 5 mm ofelectrode cap diameter; 10, 15, and 20 weld cycles of time;7, 8, and 9 kA of welding current in 75-kVA spot welder. Itconcludes that
(a) Simulation works are obviously showing the fusionzones (FZ), heat-affected zones (HAZ), heat-extendedzones (HEZ), and base metals regardless of base metals.
(b) Increase in the welding current and welding time withinthe welding lobe has resulted an increment in the diam-eter of weld nuggets and therefore the increment oftensile shear force was noticed regardless of materials.
(c) Stainless steels have higher tensile shear forces as com-pared to mild steel welds and mixed welds due to thenatural hardness of the material.
(d) The tensile shear forces (UTS) of mixed welds have fluc-tuated between the mild and stainless steels’ shear forces.
(e) The common two failure modes were seen for crackinitiation for all the weld joints as poor weld producesinterfacial fracture (IF) and good weld produces buttonpullout or tear from both sides (TF).
a) Macrograph of mild steel weldt
c) Original micro structure of mild steel
b) Fusion zone of mild steel
d) Heat affected zone of mild steel
Fig. 19 Microstructural view ofmild steel (2 mm). a Macrographof mild steel weld. b Fusion zoneof mild steel. c Originalmicrostructure of mild steel. dHeat-affected zone of mild steel
Int J Adv Manuf Technol
Author's personal copy
a) Macrograph of stainless steel weld
c) Original micro structure of stainless steel b) Fusion zone of stainless steel
Fig. 20 Microstructural view ofstainless steel (2 mm). aMacrograph of stainless steelweld. b Fusion zone of stainlesssteel. c Original microstructure ofstainless steel
a) Macrograph of mixed steel weld b) Fusion zone of mixed steel
c) Original micro structure of stainless steel d) Original microstructure of mild stee
Fig. 21 Microstructural view ofstainless steel and mild steel(2 mm). a Macrograph of mixedsteel weld. b Fusion zone ofmixed steel. c Originalmicrostructure of stainless steel. dOriginal microstructure of mildsteel
Int J Adv Manuf Technol
Author's personal copy

(f) Post-crack-initiating propagation was observed for all theweld joints and found that pullout failure mode (TF) wasthe best weld joint as compared to partial failure mode(PF) and interfacial failure mode (IF).
(g) Hardness of welded zones was increased to almost dou-ble the value for the mild and mixed steels. However, thehardness distribution across the fusion zone was fluctu-ated regardless of process parameter increments.
(h) Hardness of the stainless steels was slightly increasedduring solidification, but the distribution along thewelded zones was fluctuating in values as how the mildand mixed steels have resulted.
(i) The mild and dissimilar steels’ micrographs have shownthe fusion, heat-affected, heat-extended, and base metalzones very clearly, but the stainless steel’s heat-affectedand heat-extended zones are not visible at microlevelzooming because of the narrowed regions.
(j) Metallurgical views have clearly shown that the heatimbalance has occurred in mixed weld joints due todifferent electrical resistivity and thermal conductivityrates.
Acknowledgments I would like to thank the Ministry of Science,Technology and Innovation, Malaysia (MOSTI) for their financial sup-port during the experiment. This research is an extension of my post-doctoral research work at the University Malaya, Malaysia.
References
1. Aravinthan A, Nachimani C, (2011) Analysis of spot welds growthon mild and stainless steel (1 mm). Welding Journal, August: 143–147
2. Cha BW, Na SJ (2003) A study on the relationship between weldingconditions and residual stress of resistance. J Manuf Syst 22:31–40
3. AmudaMOH,Mridha S (2009)Micro structural features of AISI 430ferritic stainless steel weld produced under varying process parame-ters. Int J Mech Mater Eng 4(2):160–166
4. Jamasri MN, Ilman R, Soekrisno T (2011) Corrosion fatigue behav-ior of RSW dissimilar metal welds between carbon steel and austen-itic stainless steel with different thickness. Procedia Eng 10:649–654
5. Bayraktar E,Moiron J, Kaplan D (2006) Effect of welding conditionson the formability characteristics of thin sheet steels: mechanical andmetallurgical effects. J Mater Process Technol 175:20–26
6. Triyono A (2009) Comparative study of fatigue assessment methodswith and without considering residual stress on resistance spot-welded unequal sheet thickness stainless steel. Int J Eng Technol11:456–462
7. Marashi P, Pouranvari M, Amirabdollahian S, Abedi A, Goodarzi M,(2008) Microstructure and failure behavior of dissimilar resistancespot welds between low carbon galvanized and austenitic stainlesssteels. Materials Science and Engineering A: 175–180
8. Pouranvari M (2011) Analysis of fracture mode of galvanized lowcarbon steel resistance spot welds. Int J Multidiscip Sci Eng 2(6):66–72
9. Aravinthan A, Nachimani C (2011) Metallurgical study of spot weldgrowth on mild steel with 1 mm and 2 mm thicknesses. J Inst EngMalaysia 72:36–42
10. Shamsul JB, HisyamMM (2007) Study of spot welding of austeniticstainless steel type 304. J Appl Sci Res 3(11):1494–1499
11. Lee WS (2004) Deformation and failure response of 304L stainlesssteel SMAW joint under dynamic shear loading. Mater Sci Eng A381:206–215
12. Darwish SM (2003)Weld bonding strengths and balances the stressesin spot welded dissimilar thickness joints. J Mater Process Technol134:352–362
13. Darwish SM, Al-Samhan AM (2004) Peel and shear strength of spot-welded and weld-bonded dissimilar thickness joints. J Mater ProcessTechnol 147:138–146
14. Kent P, Von M, Henning EN (2000) Comparison of peel bond andshear tensile test methods for needle punched geo synthetic clayliners. Geotext Geomembr 18:203–214
Fig. 22 Hardness of mild steel
Fig. 23 Hardness of stainless steel
Fig. 24 Hardness of mixed steel
Int J Adv Manuf Technol
Author's personal copy

15. Khodabakhshi F, Kazeminezhad M, Kokabi AH (2011) Mechanicalproperties and microstructure of resistance spot welded severelydeformed low carbon steel. Mater Sci Eng A 15:356–343
16. Dursun O, Zyurek Z (2008) An effect of weld current and weldatmosphere on the resistance spot weld ability of 304L austeniticstainless steel. Mater Des 29:597–603
17. Fukumoto S, Fujiwara K, Toji S, Yamamoto A (2008) Small-scaleresistance spot welding of austenitic stainless steels. Mater Sci Eng A492:243–249
18. Pouranvari M, Marashi SPH (2010) Key factors influencing mechan-ical performance of dual phase steel resistance spot welds. SciTechnol Weld Join 15:149–155
19. Gould JE, Khurana SP, Li T, (2006) Predictions of microstructureswhen welding automotive advanced high-strength steels. WeldingJournal 86:111s–116s
20. Pilar DT, Oscar M, Manuel L (2011) Combined effect of resistancespot welding and post-welding sensitization on the degree of sensi-tization of AISI 304 stainless steel. Corros Sci 53:2670–2675
Int J Adv Manuf Technol
Author's personal copy