WELDING RESEARCH Direct Observations of Austenite, Bainite...
10
WELDING RESEARCH SEPTEMBER 2004 -S 244 ABSTRACT. In-situ time-resolved X-ray diffraction (TRXRD) experiments were performed during stationary gas tungsten arc (GTA) welding of AISI 1045 C-Mn steel. These real-time synchrotron-based experiments tracked phase transforma- tions in the heat-affected zone of the weld under rapid heating and cooling condi- tions. The diffraction patterns were recorded at 100 ms intervals, and were later analyzed using diffraction peak pro- file analysis to determine the relative frac- tion of ferrite (α) and austenite (γ) phases in each diffraction pattern. Lattice para- meters and diffraction peak widths were also measured throughout the heating and cooling cycle of the weld, providing addi- tional information about the phases that were formed. The experimental results were coupled with temperatures calcu- lated by a thermo-fluids weld model, al- lowing the transformation kinetics of the α→γ phase transformation to be evalu- ated. During heating, complete austeniti- zation was observed in the heat-affected zone of the weld, and the kinetics of the α→γ phase transformation were modeled using a Johnson-Mehl-Avrami (JMA) ap- proach. The results from the 1045 steel weld were compared to those of a 1005 low-carbon steel from a previous study. Differences in austenitization rates of the two steels were attributed to differences in the base metal microstructures, particu- larly the relative amounts of pearlite and the extent of the allotriomorphic ferrite phase. During weld cooling, the austenite transformed to a mixture of bainite and martensite. In situ diffraction was able to distinguish between these two nonequilib- rium phases based on differences in their lattice parameters, diffraction peak widths, and their transformation rates, re- sulting in the first real-time X-ray diffrac- tion observations of bainite and marten- site formation made during welding. Introduction Transformations between the body- centered cubic (BCC) form of iron (α-fer- rite) and the face-centered cubic (FCC) form of iron (γ-austenite) during heating and cooling are principally responsible for the microstructure and properties of steels. These transformations have been studied in great detail for many decades to establish optimum thermal-mechanical processing treatments for a wide variety of steels (Refs. 1–3). However, when steels are welded, the optimized base metal properties are altered by the localized weld thermal cycles. The result is the cre- ation of nonequilibrium microstructures in the weld fusion zone (FZ) and heat- affected zone (HAZ). These microstruc- tures are significantly different in both ap- pearance and properties from those found in the base metal (Refs. 4–6). Such non- equilibrium phases can compromise the integrity of the weld joint, making it im- portant to understand how the welding conditions lead to their creation. In widely used C-Mn steels, the carbon content of the steel plays an important role in the microstructural evolution of the weld. As the carbon content increases, welding-induced changes in the mi- crostructure become more pronounced due to the nonuniform distribution of car- bon in the microstructure. These changes are most prominent during the rapid weld cooling, which further intensifies these ef- fects, resulting in microstructures that de- viate significantly from equilibrium. The mechanisms responsible for these trans- formations are well known (Refs. 4–6); however, few direct observations of the transformation sequence have been re- ported. Previous investigations of low-carbon steel containing 0.05 wt-% C served as a baseline for the experiments on the medium-carbon 1045 steel presented here. The earlier work on low-carbon steel was performed in situ using synchrotron radiation under both spatially resolved (Refs. 7, 8) and time-resolved experimen- tal conditions (Ref. 9). Kinetic parameters were determined, allowing the prediction of the α→γ transformation during weld heating of the low-carbon steel to be made (Ref. 8). In this investigation, a medium- carbon steel containing 0.46 wt-% carbon was rapidly heated and cooled during sta- tionary arc welding. During welding, syn- chrotron radiation was also used to track the phase transformations that occurred in the HAZ of the weld. These experi- ments produced a series of X-ray diffrac- tion patterns revealing the real-time crys- tal structure of the weld. Results of these observations showed complete austeniti- zation of the initial microstructure during rapid weld heating, and subsequent trans- formations during rapid weld cooling. Quantitative information about the phase transformation kinetics was extracted from these data through thermal and phase transformation modeling. These re- sults were compared to those of the low- Direct Observations of Austenite, Bainite, and Martensite Formation during Arc Welding of 1045 Steel Using Time-Resolved X-ray Diffraction Phase transformations were tracked in real time using a synchrotron accelerator BY J. W. ELMER, T. A. PALMER, S. S. BABU, W. ZHANG, AND T. DEBROY KEY WORDS Time-Resolved X-ray Diffraction Synchrotron Radiation Phase Transformations Kinetics Austenite Bainite Martensite Arc Welding Steels Heat-Affected Zone J. W. ELMER and T. A. PALMER are with the Lawrence Livermore National Labora- tory, Livermore, Calif. S. S. BABU is with the Oak Ridge National Laboratory, Oak Ridge, Tenn., W. ZHANG and T. DEBROY are with Pennsylvania State University, University Park, Pa.
Transcript of WELDING RESEARCH Direct Observations of Austenite, Bainite...

WELDING RESEARCH
SEPTEMBER 2004-S244
ABSTRACT. In-situ time-resolved X-raydiffraction (TRXRD) experiments wereperformed during stationary gas tungstenarc (GTA) welding of AISI 1045 C-Mnsteel. These real-time synchrotron-basedexperiments tracked phase transforma-tions in the heat-affected zone of the weldunder rapid heating and cooling condi-tions. The diffraction patterns wererecorded at 100 ms intervals, and werelater analyzed using diffraction peak pro-file analysis to determine the relative frac-tion of ferrite (α) and austenite (γ) phasesin each diffraction pattern. Lattice para-meters and diffraction peak widths werealso measured throughout the heating andcooling cycle of the weld, providing addi-tional information about the phases thatwere formed. The experimental resultswere coupled with temperatures calcu-lated by a thermo-fluids weld model, al-lowing the transformation kinetics of theα→γ phase transformation to be evalu-ated. During heating, complete austeniti-zation was observed in the heat-affectedzone of the weld, and the kinetics of theα→γ phase transformation were modeledusing a Johnson-Mehl-Avrami (JMA) ap-proach. The results from the 1045 steelweld were compared to those of a 1005low-carbon steel from a previous study.Differences in austenitization rates of thetwo steels were attributed to differences inthe base metal microstructures, particu-larly the relative amounts of pearlite andthe extent of the allotriomorphic ferritephase. During weld cooling, the austenitetransformed to a mixture of bainite andmartensite. In situ diffraction was able todistinguish between these two nonequilib-
rium phases based on differences in theirlattice parameters, diffraction peakwidths, and their transformation rates, re-sulting in the first real-time X-ray diffrac-tion observations of bainite and marten-site formation made during welding.
Introduction
Transformations between the body-centered cubic (BCC) form of iron (α-fer-rite) and the face-centered cubic (FCC)form of iron (γ-austenite) during heatingand cooling are principally responsible forthe microstructure and properties ofsteels. These transformations have beenstudied in great detail for many decades toestablish optimum thermal-mechanicalprocessing treatments for a wide variety ofsteels (Refs. 1–3). However, when steelsare welded, the optimized base metalproperties are altered by the localizedweld thermal cycles. The result is the cre-ation of nonequilibrium microstructuresin the weld fusion zone (FZ) and heat-affected zone (HAZ). These microstruc-tures are significantly different in both ap-pearance and properties from those foundin the base metal (Refs. 4–6). Such non-equilibrium phases can compromise theintegrity of the weld joint, making it im-portant to understand how the weldingconditions lead to their creation.
In widely used C-Mn steels, the carbon
content of the steel plays an importantrole in the microstructural evolution ofthe weld. As the carbon content increases,welding-induced changes in the mi-crostructure become more pronounceddue to the nonuniform distribution of car-bon in the microstructure. These changesare most prominent during the rapid weldcooling, which further intensifies these ef-fects, resulting in microstructures that de-viate significantly from equilibrium. Themechanisms responsible for these trans-formations are well known (Refs. 4–6);however, few direct observations of thetransformation sequence have been re-ported.
Previous investigations of low-carbonsteel containing 0.05 wt-% C served as abaseline for the experiments on themedium-carbon 1045 steel presentedhere. The earlier work on low-carbon steelwas performed in situ using synchrotronradiation under both spatially resolved(Refs. 7, 8) and time-resolved experimen-tal conditions (Ref. 9). Kinetic parameterswere determined, allowing the predictionof the α→γ transformation during weldheating of the low-carbon steel to be made(Ref. 8). In this investigation, a medium-carbon steel containing 0.46 wt-% carbonwas rapidly heated and cooled during sta-tionary arc welding. During welding, syn-chrotron radiation was also used to trackthe phase transformations that occurredin the HAZ of the weld. These experi-ments produced a series of X-ray diffrac-tion patterns revealing the real-time crys-tal structure of the weld. Results of theseobservations showed complete austeniti-zation of the initial microstructure duringrapid weld heating, and subsequent trans-formations during rapid weld cooling.Quantitative information about the phasetransformation kinetics was extractedfrom these data through thermal andphase transformation modeling. These re-sults were compared to those of the low-
Direct Observations of Austenite, Bainite,and Martensite Formation during Arc
Welding of 1045 Steel Using Time-ResolvedX-ray Diffraction
Phase transformations were tracked in real time using a synchrotron accelerator
BY J. W. ELMER, T. A. PALMER, S. S. BABU, W. ZHANG, AND T. DEBROY
KEY WORDS
Time-Resolved X-ray DiffractionSynchrotron RadiationPhase TransformationsKineticsAusteniteBainiteMartensiteArc WeldingSteelsHeat-Affected Zone
J. W. ELMER and T. A. PALMER are withthe Lawrence Livermore National Labora-tory, Livermore, Calif. S. S. BABU is with theOak Ridge National Laboratory, Oak Ridge,Tenn., W. ZHANG and T. DEBROY are withPennsylvania State University, UniversityPark, Pa.
elmer qwk 8/2/04 4:54 PM Page 244

WELDING RESEARCH
-S245WELDING JOURNAL
carbon steel to better understand the in-fluence of carbon content on phase trans-formations that occur during the weldingof steel.
Differences in the phase transforma-tion behavior of the low- and medium-carbon steels were apparent. During heat-ing, the kinetics of the α→γ transforma-tion showed that the 1045 steel initiallytransformed at a higher rate than the 1005steel but then slowed down, eventually re-quiring more time to transform than the1005 steel. This difference was associatedwith differences in the starting mi-crostructures of the two steels. Duringcooling, the high rates produced duringthe stationary arc spot welding techniqueused in the TRXRD experiments provedto be rapid enough to produce a combina-tion of bainite (nonlamellar ferrite plusFe3C) and martensite (interstitial carbon)in the microstructure of the 1045 steel, butthese phases were not observed in similarexperiments on the low-carbon steels.
The results presented here demon-strate not only differences in the phasetransformation behavior between low-and medium-carbon steels, but also howin-situ X-ray diffraction can be used toprovide real-time observations of impor-tant phase transformations during thewelding of steels.
Experimental Procedures
TRXRD Experiments
Gas tungsten arc (GTA) welds weremade on AISI 1045 forged steel bars hav-ing the following composition: (0.46 C,0.85 Mn, 0.27 Si, 0.02 Ni, 0.11 Cr, 0.014 P,0.01 Cu, 0.02 S, 0.027 Al, 0.001 Nb, 0.01Mo, 0.005 V; by wt-%). These sampleswere machined from 10.8-cm-diameterforged bar stock into welding samples,12.7 cm long and 10.2 cm diameter. Weldswere then made on the cylindrical steel
bars in an environ-mentally sealedchamber to avoidatmospheric conta-mination of thewelds. A schematicillustration of theexperimental setupis shown in Fig. 1,and a brief summary of the welding para-meters used here is given in Table 1. Fur-ther details of similar welding experimentshave been previously reported for tita-nium and titanium alloys (Refs. 10, 11),other steels (Ref. 12), and stainless steelalloys (Refs. 13, 14).
The in situ TRXRD experiments wereperformed during welding using the 31-pole wiggler beam line, BL 10-2, at Stan-ford Synchrotron Radiation Laboratory(SSRL) with SPEAR (Stanford Positron-Electron Accumulation Ring) operatingat an electron energy of 3.0 GeV and aninjection current of ~100 mA. As illus-trated in Fig. 1, a focused monochromaticsynchrotron X-ray beam was passedthrough a 540-mm tungsten pinhole torender a submillimeter beam on the sam-ple at an incident angle of ~25 deg. Thissetup yielded a beam flux on the sample of~1012 photons/s, which was determinedexperimentally using an ion chamber im-mediately downstream from the pinhole.A photon energy of 12.0 keV (λ = 0.1033nm) was chosen to facilitate phase identi-fication and to be far enough in energyabove the Fe K-edge (7.112 keV) to mini-mize the background contribution due toFe K-fluorescence from the steel sample.
X-ray diffraction patterns wererecorded using a 50-mm-long 2048-element position-sensitive Si photodiodearray detector. The array was mounted ona dual-stage water-cooled Peltier-effectthermoelectric cooler at a distance of ap-proximately 10 cm behind the weld tocover a 2θ range from 22 to 52 deg. This
2θ range was optimized to contain a totalof six diffraction peaks, three from theBCC phase (α-Fe) and three from theFCC phase (γ-Fe). Calibration of the X-ray diffraction patterns was performedusing a thin niobium foil, which has a well-characterized BCC crystal structure.
Analysis of each peak in every diffrac-tion pattern was performed to determinethe semiquantitative volume fractions offerrite and austenite present as a functionof welding time. This analysis measuredthe integrated intensity of each peak usinga sum of one or more Gaussian peak pro-file-fitting functions using an automatedcurve-fitting routine developed in IgorPro®, Version 4.0 (Ref. 14). The raw inte-grated intensities of the diffraction peakswere then converted into phase fractionsby dividing the integrated peak area for
Fig. 1 — Schematic diagram of the TRXRD experimental setup for synchro-tron-based in situ observations of phase transformations during welding.
Fig. 2 — Calculated pseudo-binary phase diagram for the AISI 1045 steel. Thenominal carbon concentration of the alloy is indicated as the vertical dashedline.
Table 1 — Summary of GTA Welding Para-meters Used in the TRXRD Experiments
Welding electrode W (2% Th)Electrode diameter 4.7 mmTorch polarity DCENMaximum current 175 ABackground current 131 APulsing frequency 300 HzPeak on time 50%Shielding gas heliumArc on time 17 sResulting fusion
zone width 9.9 ± 0.66 mm
elmer qwk 8/2/04 4:54 PM Page 245
WELDING RESEARCH
SEPTEMBER 2004-S246
the BCC phase by the total integratedareas of the BCC and FCC phases. Thefraction of the FCC phase was then deter-mined as the difference between unity andthe BCC fraction, since only two phaseswere observed in this system.
Phase Equilibria and Base MetalMicrostructure
The phase transformation sequence inthe 1045 steel was calculated from ther-modynamic relationships using Thermo-calc and the Fe2000 database (Ref. 15).These calculations were used to deter-mine the transformation temperatures forthe AISI 1045 steel by considering the ef-fects of Fe, C, Si, Mn, Ni, and Cr on theliquid, ferrite, austenite, and cementitephase fields. The calculated phase-bound-ary temperatures for this multicomponentalloy are illustrated in the pseudo-binarydiagram shown in Fig. 2. In this figure, thevertical dashed line indicates the nominalcarbon content of the alloy.
The thermodynamic calculations indi-cate that the equilibrium starting mi-crostructure of this alloy consists of a mix-ture of ferrite and Fe3C carbide phases.During heating, this microstructure beginsto transform to austenite when the A1temperature of 712°C is reached. Com-plete transformation to austenite occurswhen the A3 temperature of 765°C isreached, and this austenite remains stableuntil melting begins to occur at 1410°C.These transformations reverse duringcooling; however, kinetic limitations mayalter the predicted phase transformationstart and completion temperatures, andmay produce nonequilibrium phases.
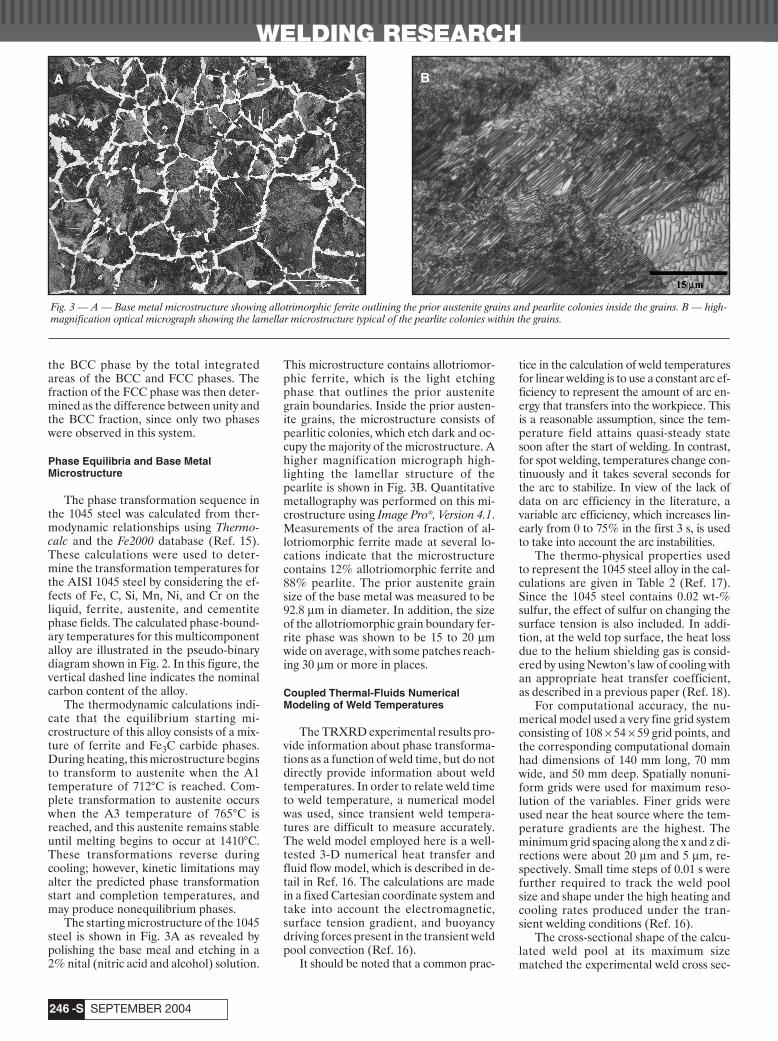
The starting microstructure of the 1045steel is shown in Fig. 3A as revealed bypolishing the base meal and etching in a2% nital (nitric acid and alcohol) solution.
This microstructure contains allotriomor-phic ferrite, which is the light etchingphase that outlines the prior austenitegrain boundaries. Inside the prior austen-ite grains, the microstructure consists ofpearlitic colonies, which etch dark and oc-cupy the majority of the microstructure. Ahigher magnification micrograph high-lighting the lamellar structure of thepearlite is shown in Fig. 3B. Quantitativemetallography was performed on this mi-crostructure using Image Pro®, Version 4.1.Measurements of the area fraction of al-lotriomorphic ferrite made at several lo-cations indicate that the microstructurecontains 12% allotriomorphic ferrite and88% pearlite. The prior austenite grainsize of the base metal was measured to be92.8 µm in diameter. In addition, the sizeof the allotriomorphic grain boundary fer-rite phase was shown to be 15 to 20 µmwide on average, with some patches reach-ing 30 µm or more in places.
Coupled Thermal-Fluids Numerical Modeling of Weld Temperatures
The TRXRD experimental results pro-vide information about phase transforma-tions as a function of weld time, but do notdirectly provide information about weldtemperatures. In order to relate weld timeto weld temperature, a numerical modelwas used, since transient weld tempera-tures are difficult to measure accurately.The weld model employed here is a well-tested 3-D numerical heat transfer andfluid flow model, which is described in de-tail in Ref. 16. The calculations are madein a fixed Cartesian coordinate system andtake into account the electromagnetic,surface tension gradient, and buoyancydriving forces present in the transient weldpool convection (Ref. 16).
It should be noted that a common prac-
tice in the calculation of weld temperaturesfor linear welding is to use a constant arc ef-ficiency to represent the amount of arc en-ergy that transfers into the workpiece. Thisis a reasonable assumption, since the tem-perature field attains quasi-steady statesoon after the start of welding. In contrast,for spot welding, temperatures change con-tinuously and it takes several seconds forthe arc to stabilize. In view of the lack ofdata on arc efficiency in the literature, avariable arc efficiency, which increases lin-early from 0 to 75% in the first 3 s, is usedto take into account the arc instabilities.
The thermo-physical properties usedto represent the 1045 steel alloy in the cal-culations are given in Table 2 (Ref. 17).Since the 1045 steel contains 0.02 wt-%sulfur, the effect of sulfur on changing thesurface tension is also included. In addi-tion, at the weld top surface, the heat lossdue to the helium shielding gas is consid-ered by using Newton’s law of cooling withan appropriate heat transfer coefficient,as described in a previous paper (Ref. 18).
For computational accuracy, the nu-merical model used a very fine grid systemconsisting of 108 × 54 × 59 grid points, andthe corresponding computational domainhad dimensions of 140 mm long, 70 mmwide, and 50 mm deep. Spatially nonuni-form grids were used for maximum reso-lution of the variables. Finer grids wereused near the heat source where the tem-perature gradients are the highest. Theminimum grid spacing along the x and z di-rections were about 20 µm and 5 µm, re-spectively. Small time steps of 0.01 s werefurther required to track the weld poolsize and shape under the high heating andcooling rates produced under the tran-sient welding conditions (Ref. 16).
The cross-sectional shape of the calcu-lated weld pool at its maximum sizematched the experimental weld cross sec-
Fig. 3 — A — Base metal microstructure showing allotrimorphic ferrite outlining the prior austenite grains and pearlite colonies inside the grains. B — high-magnification optical micrograph showing the lamellar microstructure typical of the pearlite colonies within the grains.
A B
elmer qwk 8/2/04 4:54 PM Page 246

WELDING RESEARCH
-S247WELDING JOURNAL
tion having a width just under 10 mm anda maximum depth of 4.2 mm. Using the re-sults from the weld model, the tempera-ture distributions, heating rates, and cool-ing rates were calculated as a function ofwelding time at the TRXRD location.
These temperatures could then be cou-pled with the TRXRD results to developtime-temperature-transformation kineticinformation about the transformations oc-curring during weld heating and cooling ofthe 1045 steel alloy.
Results
The TRXRD experiments were takenat a single location in the HAZ of the 1045steel bar during welding. In situ diffractionpatterns were recorded over a sufficientamount of time so that the entire heatingand cooling cycle of the weld could be cap-tured. These data are summarized in Fig.4, where the diffraction patterns are dis-played in a pseudo-color format. In thisfigure, the baseline diffraction data areshown for several seconds before the arcwas turned on, for 17 s during the timewhen the arc was on, and for an additional20 s of cooling time. Here, the higher peakintensities are indicated by the light tones,and lower peak intensities are indicated bydark tones, so that the diffraction peaksappear as streaks along the time axis attheir appropriate 2θ locations over therange of times. Six diffraction peaks ap-pear in Fig. 4. From low to high 2θ values,these peaks correspond to the FCC(111),BCC(110), FCC(200), BCC(200),FCC(220), and BCC(211), as indicated bythe calculated diffraction pattern shown inFig. 5.
Only three peaks corresponding to theBCC phase are present before the arc isinitiated. After the arc is turned on, thesethree peaks rapidly shift to lower 2θ valuesdue to the lattice expansion effect causedby weld heating. With continued heating,three new peaks, corresponding to theFCC phase, appear. All six peaks coex-isted for several seconds before the BCCpeaks began to fade in intensity, leavingonly the FCC diffraction peaks. The FCCpeaks are then stable until the arc is extin-guished at t=17 s, after which the FCCpeaks rapidly shift to higher 2θ values due
Fig. 4 — TRXRD results showing the changes in the diffraction peak locationsas a function of welding time. Six peaks are present, three from each phase.
Fig. 5 — Calculated diffraction pattern, showing the six possible peaks inthe detector window, assuming equal amounts of the FCC and BCC phases.
Table 2 — Summary of the Thermophysical Data for 1045 Steel Used in the Coupled Thermal Fluids Model to Predict Weld Temperatures
Liquidus temperature, TL 1768 KSolidus temperature, TS 1713 KDensity of liquid metal, ρ 7.7 × 10³ kg/m3
Effective viscosity of liquid, µ 0.16 kg/m·sEffective thermal conductivity of liquid, kL 335 W/m·KThermal conductivity of solid, kS 36.4 W/m·KSpecific heat of solid, CPS 586 J/kg·KSpecific heat of liquid, CPL 746 J/kg·KTemperature coefficient of surface tension, dγ/dT –4.3 × 10⁻⁴ N/m·KCoefficient of thermal expansion 1.51 × 10⁻⁵ K–1
Convective heat transfer coefficient top surface 1.59 × 10³ W/m2·K
Table 3 — Summary of JMA Modeling Results on 1045 Steel, and Comparison with Previous Dataon 1005 Steel.
Q (kJ/mole) n ln(k0) Eavg
AISI 1045 steel with thermal cycle at R = 4.75 mm 117.1 0.95 11.4 0.049AISI 1045 steel with thermal cycle at R = 5.0 mm 117.1 0.82 12.2 0.052AISI 1045 steel with thermal cycle at R = 5.25 mm 117.1 0.60 13.4 0.075AISI 1005 steel with thermal cycle at R = 5.0 mm 117.1 1.45 12.3 0.099
Note: The activation energy for the diffusion of carbon in austenite was held constant, and the JMA parametersn and ln(k0) were calculated from TRXRD experimental data in all cases. The average error (Eavg) is defined as(√Efit)/N, and the bold-faced values correspond to the recommended parameters for the two steels.
2-θ Diffraction Angle (deg)2-θ (deg)
fcc(111)
bcc(110)
fcc(200)
bcc(200)
arc off
arc on
fcc(200)
bcc(200)
elmer qwk 8/2/04 4:54 PM Page 247

WELDING RESEARCH
SEPTEMBER 2004-S248
to the lattice contraction effect as the weldcools. After an additional 1.5 s of coolingtime, the BCC peaks reappear and in-crease in intensity as the weld cools.
In Fig. 4, there is a wealth of informationabout the phases that exist at all times dur-ing the welding cycle; for example, infor-mation about the lattice parameters of eachphase and how they change with weldingtime, plus other information such as thewidth, intensity, and areas of each of the dif-fraction peaks during the welding cycle.These additional data can be determinedthrough individual peak profile analysis,and based on a portion of these data, thevolume fraction of each phase during weld-ing can be semiquantitatively estimated toprovide other clues about the phase trans-formations taking place during welding.
The most important data gatheredfrom the peak profile analysis are the rel-ative fractions of the BCC and FCCphases present throughout both the heat-ing and cooling cycles. These data areplotted in Fig. 6, showing that the alloy in-vestigated starts out fully ferritic, then att=3.6 s, begins to transform to austenite.The transformation takes 3.6 s to go tocompletion under the increasing tempera-ture of the welding arc. The austenitephase is stable until the arc is turned off att=17.0 s, and then continues to be the onlyphase for an additional 1.5 s while the weldcools. The BCC phase then appears att=18.5 s, and continues to increase inamount as the FCC→BCC transforma-tion proceeds. At the end of the experi-ment, the transformation appears incom-plete, leaving some untransformed FCC atthis point during weld cooling.
The lattice parameters of each phasecan be determined from the 2θ positions
of the diffraction peaks using Bragg’s lawand the energy of the X-ray beam (Ref.19). The results are plotted in Fig. 7, show-ing the lattice parameters of the BCC andFCC phases as a function of welding time.The lattice parameter of the BCC phase atroom temperature was measured to be2.901 Å, and increases rapidly to 2.925 Åduring the initial heating cycle of the weld.The austenite phase first appears at t=3.4s, when the ferrite lattice parameter wasmeasured to be 2.923 Å. The lattice para-meter of the FCC phase increases withwelding time until the arc was turned off,then decreases rapidly during weld cool-ing. The BCC phase reappears duringweld cooling at t=18.5 s where it has a lat-tice parameter of 2.914 Å. The lattice pa-rameter of the BCC phase then decreasesuntil t=20.8 s where it unexpectedly in-creases from 2.906 Å to 2.908 Å beforecontinuing to decrease again as the weldcontinues to cool.
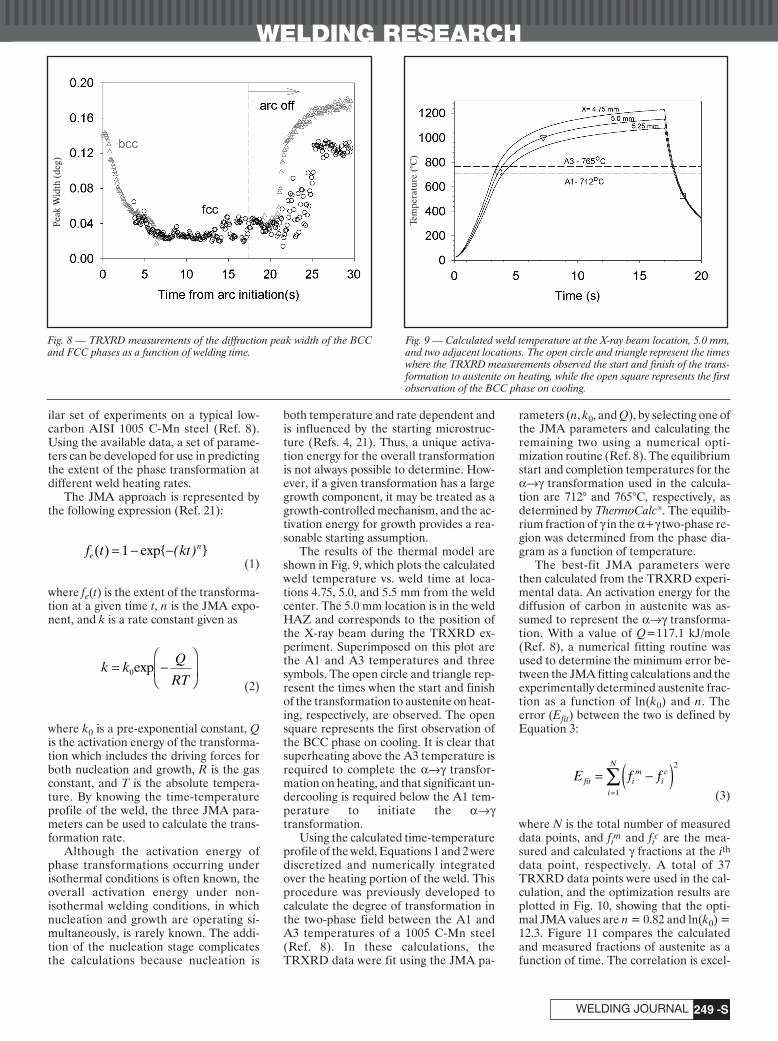
The widths of the diffraction peaks areplotted in Fig. 8 for the BCC(110) andFCC(111) phases. Both phases show sim-ilar trends during welding, whereby thepeak widths decrease during heating andincrease during cooling. The results showthat the width of the BCC 110 peak is 0.14deg in the starting condition and decreasesto 0.04 deg just before it disappears att=7.2 s. When the austenite peaks first ap-pear, at t=3.4 s, the peak widths are abouttwice as wide as they are just before the arcis extinguished. The decrease in peakwidth with increasing temperature iscaused by annealing, which creates moreperfect diffraction conditions at highertemperatures. These phenomena havebeen observed in similar TRXRD experi-ments on other materials systems (Refs.
11, 14). Once the arc is extinguished, therapid weld cooling causes the widths of thepeaks to increase. The results show thatthe BCC peak widths increase more dur-ing cooling than they decreased duringheating, suggesting that the rapid weldcooling has led to the creation of a differ-ent BCC phase after welding than before.
Discussion
α→γ Phase Transformation on Heating
The TRXRD results presented aboveprovide information about the relativefractions of the BCC and FCC phases,their lattice parameters, and the widths oftheir diffraction peaks as a function ofweld heating and cooling time. Included inthese results is information related to thekinetics and types of phase transforma-tions occurring in the HAZ during weld-ing. Modeling of the experimentally mea-sured transformation rates will be used tobetter understand the mechanisms behindeach transformation and to develop para-meters useful in the prediction of phasetransformations.
It is known that the transformation ofthe pearlitic microstructure (ferrite andcementite) to austenite during heating iscontrolled by carbon diffusion in austenite(Ref. 20). In the experiments performedhere, transformation of the microstruc-ture during heating was shown to occurrapidly due to the high heating rate of theweld. Assuming the transformation is con-trolled by the diffusion of carbon inaustenite, the kinetics of this transforma-tion can be modeled by the Johnson-Mehl-Avrami (JMA) method (Refs. 4,21). This approach has been used in a sim-
Fig. 6 — TRXRD measurements of the relative fraction of the BCC and FCCphases as a function of welding time.
Fig. 7 — TRXRD measurements of the lattice parameter of the BCC andFCC phases as a function of welding time.
Phas
e Fr
actio
n
Lat
tice
para
met
er b
cc (
A)
Lat
ice
para
met
er fc
c (A
)
elmer qwk 8/2/04 4:54 PM Page 248
WELDING RESEARCH
-S249WELDING JOURNAL
ilar set of experiments on a typical low-carbon AISI 1005 C-Mn steel (Ref. 8).Using the available data, a set of parame-ters can be developed for use in predictingthe extent of the phase transformation atdifferent weld heating rates.
The JMA approach is represented bythe following expression (Ref. 21):
(1)
where fe(t) is the extent of the transforma-tion at a given time t, n is the JMA expo-nent, and k is a rate constant given as
(2)
where k0 is a pre-exponential constant, Qis the activation energy of the transforma-tion which includes the driving forces forboth nucleation and growth, R is the gasconstant, and T is the absolute tempera-ture. By knowing the time-temperatureprofile of the weld, the three JMA para-meters can be used to calculate the trans-formation rate.
Although the activation energy ofphase transformations occurring underisothermal conditions is often known, theoverall activation energy under non-isothermal welding conditions, in whichnucleation and growth are operating si-multaneously, is rarely known. The addi-tion of the nucleation stage complicatesthe calculations because nucleation is
both temperature and rate dependent andis influenced by the starting microstruc-ture (Refs. 4, 21). Thus, a unique activa-tion energy for the overall transformationis not always possible to determine. How-ever, if a given transformation has a largegrowth component, it may be treated as agrowth-controlled mechanism, and the ac-tivation energy for growth provides a rea-sonable starting assumption.
The results of the thermal model areshown in Fig. 9, which plots the calculatedweld temperature vs. weld time at loca-tions 4.75, 5.0, and 5.5 mm from the weldcenter. The 5.0 mm location is in the weldHAZ and corresponds to the position ofthe X-ray beam during the TRXRD ex-periment. Superimposed on this plot arethe A1 and A3 temperatures and threesymbols. The open circle and triangle rep-resent the times when the start and finishof the transformation to austenite on heat-ing, respectively, are observed. The opensquare represents the first observation ofthe BCC phase on cooling. It is clear thatsuperheating above the A3 temperature isrequired to complete the α→γ transfor-mation on heating, and that significant un-dercooling is required below the A1 tem-perature to initiate the α→γtransformation.
Using the calculated time-temperatureprofile of the weld, Equations 1 and 2 werediscretized and numerically integratedover the heating portion of the weld. Thisprocedure was previously developed tocalculate the degree of transformation inthe two-phase field between the A1 andA3 temperatures of a 1005 C-Mn steel(Ref. 8). In these calculations, theTRXRD data were fit using the JMA pa-
rameters (n, k0, and Q), by selecting one ofthe JMA parameters and calculating theremaining two using a numerical opti-mization routine (Ref. 8). The equilibriumstart and completion temperatures for theα→γ transformation used in the calcula-tion are 712° and 765°C, respectively, asdetermined by ThermoCalc®. The equilib-rium fraction of γ in the α+γ two-phase re-gion was determined from the phase dia-gram as a function of temperature.
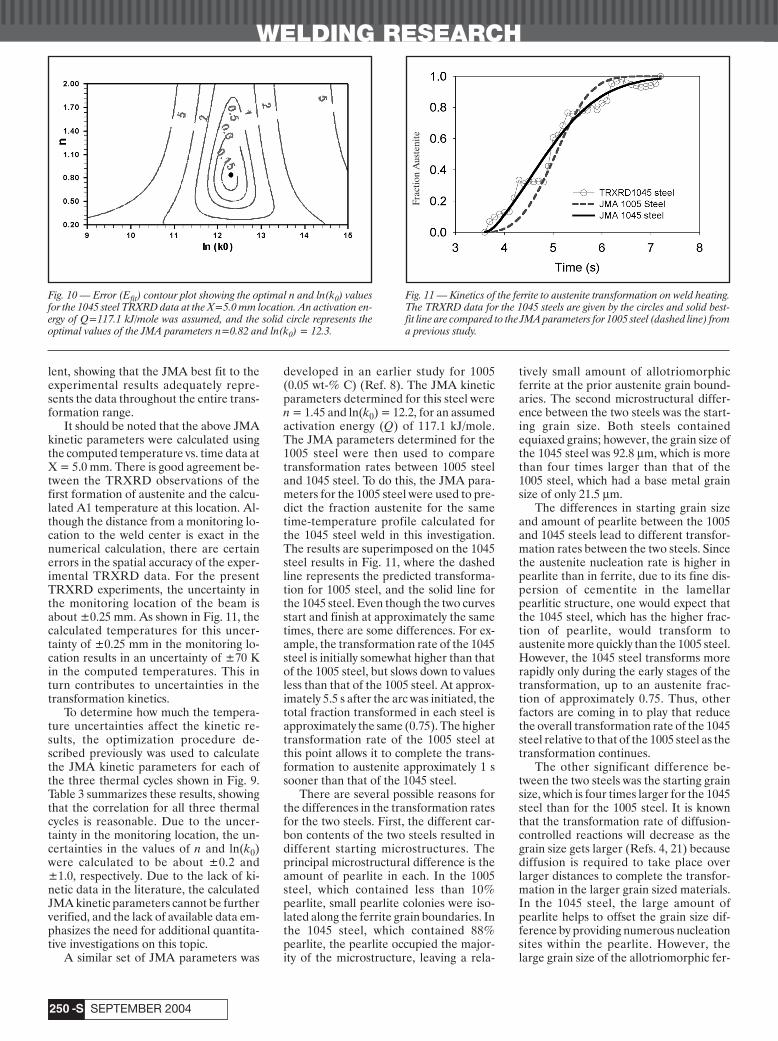
The best-fit JMA parameters werethen calculated from the TRXRD experi-mental data. An activation energy for thediffusion of carbon in austenite was as-sumed to represent the α→γ transforma-tion. With a value of Q=117.1 kJ/mole(Ref. 8), a numerical fitting routine wasused to determine the minimum error be-tween the JMA fitting calculations and theexperimentally determined austenite frac-tion as a function of ln(k0) and n. Theerror (Efit) between the two is defined byEquation 3:
(3)
where N is the total number of measureddata points, and fim and fic are the mea-sured and calculated γ fractions at the ithdata point, respectively. A total of 37TRXRD data points were used in the cal-culation, and the optimization results areplotted in Fig. 10, showing that the opti-mal JMA values are n = 0.82 and ln(k0) =12.3. Figure 11 compares the calculatedand measured fractions of austenite as afunction of time. The correlation is excel-
E f ffit i
mic
i
N
= −( )=∑
2
1
k k
Q
RT= −
0exp
f t kten( ) exp= − −1 { ( ) }
Fig. 8 — TRXRD measurements of the diffraction peak width of the BCCand FCC phases as a function of welding time.
Fig. 9 — Calculated weld temperature at the X-ray beam location, 5.0 mm,and two adjacent locations. The open circle and triangle represent the timeswhere the TRXRD measurements observed the start and finish of the trans-formation to austenite on heating, while the open square represents the firstobservation of the BCC phase on cooling.
Peak
Wid
th (
deg)
Tem
pera
ture
(°C
)
elmer qwk 8/2/04 4:54 PM Page 249
WELDING RESEARCH
SEPTEMBER 2004-S250
lent, showing that the JMA best fit to theexperimental results adequately repre-sents the data throughout the entire trans-formation range.
It should be noted that the above JMAkinetic parameters were calculated usingthe computed temperature vs. time data atX = 5.0 mm. There is good agreement be-tween the TRXRD observations of thefirst formation of austenite and the calcu-lated A1 temperature at this location. Al-though the distance from a monitoring lo-cation to the weld center is exact in thenumerical calculation, there are certainerrors in the spatial accuracy of the exper-imental TRXRD data. For the presentTRXRD experiments, the uncertainty inthe monitoring location of the beam isabout ±0.25 mm. As shown in Fig. 11, thecalculated temperatures for this uncer-tainty of ±0.25 mm in the monitoring lo-cation results in an uncertainty of ±70 Kin the computed temperatures. This inturn contributes to uncertainties in thetransformation kinetics.
To determine how much the tempera-ture uncertainties affect the kinetic re-sults, the optimization procedure de-scribed previously was used to calculatethe JMA kinetic parameters for each ofthe three thermal cycles shown in Fig. 9.Table 3 summarizes these results, showingthat the correlation for all three thermalcycles is reasonable. Due to the uncer-tainty in the monitoring location, the un-certainties in the values of n and ln(k0)were calculated to be about ±0.2 and±1.0, respectively. Due to the lack of ki-netic data in the literature, the calculatedJMA kinetic parameters cannot be furtherverified, and the lack of available data em-phasizes the need for additional quantita-tive investigations on this topic.
A similar set of JMA parameters was
developed in an earlier study for 1005(0.05 wt-% C) (Ref. 8). The JMA kineticparameters determined for this steel weren = 1.45 and ln(k0) = 12.2, for an assumedactivation energy (Q) of 117.1 kJ/mole.The JMA parameters determined for the1005 steel were then used to comparetransformation rates between 1005 steeland 1045 steel. To do this, the JMA para-meters for the 1005 steel were used to pre-dict the fraction austenite for the sametime-temperature profile calculated forthe 1045 steel weld in this investigation.The results are superimposed on the 1045steel results in Fig. 11, where the dashedline represents the predicted transforma-tion for 1005 steel, and the solid line forthe 1045 steel. Even though the two curvesstart and finish at approximately the sametimes, there are some differences. For ex-ample, the transformation rate of the 1045steel is initially somewhat higher than thatof the 1005 steel, but slows down to valuesless than that of the 1005 steel. At approx-imately 5.5 s after the arc was initiated, thetotal fraction transformed in each steel isapproximately the same (0.75). The highertransformation rate of the 1005 steel atthis point allows it to complete the trans-formation to austenite approximately 1 ssooner than that of the 1045 steel.
There are several possible reasons forthe differences in the transformation ratesfor the two steels. First, the different car-bon contents of the two steels resulted indifferent starting microstructures. Theprincipal microstructural difference is theamount of pearlite in each. In the 1005steel, which contained less than 10%pearlite, small pearlite colonies were iso-lated along the ferrite grain boundaries. Inthe 1045 steel, which contained 88%pearlite, the pearlite occupied the major-ity of the microstructure, leaving a rela-
tively small amount of allotriomorphicferrite at the prior austenite grain bound-aries. The second microstructural differ-ence between the two steels was the start-ing grain size. Both steels containedequiaxed grains; however, the grain size ofthe 1045 steel was 92.8 µm, which is morethan four times larger than that of the1005 steel, which had a base metal grainsize of only 21.5 µm.
The differences in starting grain sizeand amount of pearlite between the 1005and 1045 steels lead to different transfor-mation rates between the two steels. Sincethe austenite nucleation rate is higher inpearlite than in ferrite, due to its fine dis-persion of cementite in the lamellarpearlitic structure, one would expect thatthe 1045 steel, which has the higher frac-tion of pearlite, would transform toaustenite more quickly than the 1005 steel.However, the 1045 steel transforms morerapidly only during the early stages of thetransformation, up to an austenite frac-tion of approximately 0.75. Thus, otherfactors are coming in to play that reducethe overall transformation rate of the 1045steel relative to that of the 1005 steel as thetransformation continues.
The other significant difference be-tween the two steels was the starting grainsize, which is four times larger for the 1045steel than for the 1005 steel. It is knownthat the transformation rate of diffusion-controlled reactions will decrease as thegrain size gets larger (Refs. 4, 21) becausediffusion is required to take place overlarger distances to complete the transfor-mation in the larger grain sized materials.In the 1045 steel, the large amount ofpearlite helps to offset the grain size dif-ference by providing numerous nucleationsites within the pearlite. However, thelarge grain size of the allotriomorphic fer-
Fig. 10 — Error (Efit) contour plot showing the optimal n and ln(k0) valuesfor the 1045 steel TRXRD data at the X=5.0 mm location. An activation en-ergy of Q=117.1 kJ/mole was assumed, and the solid circle represents theoptimal values of the JMA parameters n=0.82 and ln(k0) = 12.3.
Fig. 11 — Kinetics of the ferrite to austenite transformation on weld heating.The TRXRD data for the 1045 steels are given by the circles and solid best-fit line are compared to the JMA parameters for 1005 steel (dashed line) froma previous study.
Frac
tion
Aus
teni
te
elmer qwk 8/2/04 4:54 PM Page 250
WELDING RESEARCH
-S251WELDING JOURNAL
rite regions in the 1045 steel has an indi-rect effect on the transformation rate.These large ferrite regions should be thelast portion of the 1045 steel microstruc-ture to transform and, as such, will controlthe total amount of time required to com-pletely austenitize the microstructure.Since the allotriomorphic patches in the1045 steel exceeded 30 µm in places, onemight expect that the total time requiredto transform the 1045 steel would belonger than that of the 1005 steel, whichhad an average grain size of 21.5 µm.
Therefore, the JMA kinetic analysis ofthe TRXRD data adequately describesthe α→γ transformation kinetics of the1045 steel, providing a quantitative meansfor predicting austenite formation in theHAZ of similar carbon content steelwelds. Comparisons between the α→γtransformation kinetics of the 1045 steeland 1005 steel illustrated how the carboncontent affects the transformation ratethrough its effect on the starting mi-crostructure of the base metal. Additionalwork is planned to look at even higher-carbon steel welds in order to further ex-tend these observations.
γ→α Phase Transformation on Cooling
The cooling transformations in steelcan be more complicated than the heatingtransformations because of the potentialformation of nonequilibrium phases athigh cooling rates. It is already known thatdiffusion-dependent transformations,such as the formation of pearlite, a lamel-lar microstructure of alternating ferriteand cementite phases, occur at low coolingrates (Ref. 3). As the cooling rate in-creases, diffusion of carbon may not berapid enough to allow the lamellar pearlite
microstructure to form. Shear-type trans-formations thus begin to dominate at thesehigher cooling rates. For example, bainite,which is characterized by a microstructureof mixed ferrite and cementite with non-lameller features, forms through a combi-nation of diffusion and shear at intermedi-ate cooling rates (Ref. 3). Martensite, onthe other hand, forms entirely by a shearmechanism and only at high cooling rates,producing a microstructure containinglath or plate-like characteristics with thecarbon trapped in interstitial sites of thecrystal lattice (Ref. 3).
The formation of bainite and marten-site cannot be described by the equilib-rium phase diagram presented in Fig. 2,since these transformations occur undernonequilibrium conditions. However, onecan use calculated continuous coolingtransformation (CCT) diagrams to pro-vide information about microstructuralevolution during continuous cooling. Inthis work, we used the model developed byBhadeshia et al. (Refs. 22, 23), to predictthe continuous cooling transformation di-agram for the AISI 1045 steel — Fig. 12.The diagram was constructed from time-temperature-transformation (TTT) datacalculated from paraequilibrium thermo-dynamics of the α→γ transformation byusing the additivity rule (Ref. 24), and pre-dicts the onset of the different transfor-mations that can occur during cooling.The CCT diagram was overlaid with threedifferent cooling curves, one predicted bythe heat transfer and numerical modelfrom Fig. 9 and two other linear coolingrates of 10°C/s and 60°C/s from a peaktemperature of 1124°C. The plots showthat a minimum cooling rate of 10°C/s isneeded to avoid the formation of ferrite +pearlite microstructure. Moreover, a max-
imum cooling rate of 60°C/s is needed toavoid the formation of martensite. Thebainite start temperature for this steel ispredicted to be 485°C, and martensitestart temperature is predicted to be 324°C.Both temperatures are far below the equi-librium A1 temperature. The predictedcooling rate by the heat transfer model ishigher than 60°C/s and therefore a pre-dominantly martensitic microstructure isexpected in the final microstructure.
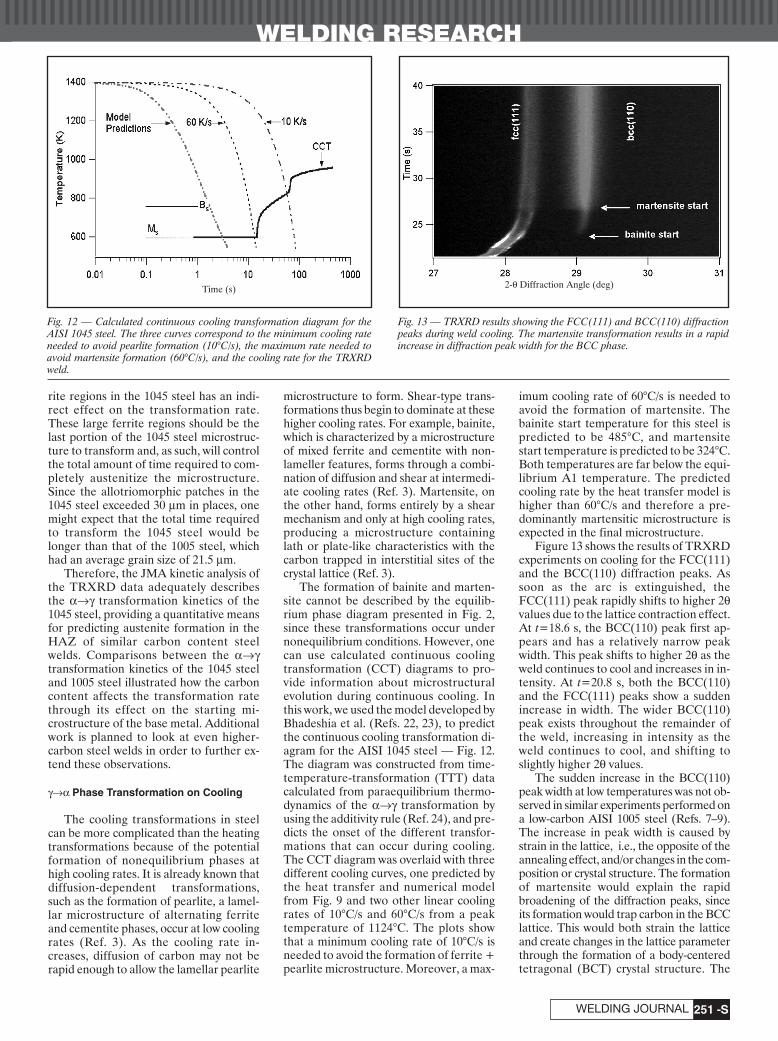
Figure 13 shows the results of TRXRDexperiments on cooling for the FCC(111)and the BCC(110) diffraction peaks. Assoon as the arc is extinguished, theFCC(111) peak rapidly shifts to higher 2θvalues due to the lattice contraction effect.At t=18.6 s, the BCC(110) peak first ap-pears and has a relatively narrow peakwidth. This peak shifts to higher 2θ as theweld continues to cool and increases in in-tensity. At t=20.8 s, both the BCC(110)and the FCC(111) peaks show a suddenincrease in width. The wider BCC(110)peak exists throughout the remainder ofthe weld, increasing in intensity as theweld continues to cool, and shifting toslightly higher 2θ values.
The sudden increase in the BCC(110)peak width at low temperatures was not ob-served in similar experiments performed ona low-carbon AISI 1005 steel (Refs. 7–9).The increase in peak width is caused bystrain in the lattice, i.e., the opposite of theannealing effect, and/or changes in the com-position or crystal structure. The formationof martensite would explain the rapidbroadening of the diffraction peaks, sinceits formation would trap carbon in the BCClattice. This would both strain the latticeand create changes in the lattice parameterthrough the formation of a body-centeredtetragonal (BCT) crystal structure. The
Fig. 12 — Calculated continuous cooling transformation diagram for theAISI 1045 steel. The three curves correspond to the minimum cooling rateneeded to avoid pearlite formation (10°C/s), the maximum rate needed toavoid martensite formation (60°C/s), and the cooling rate for the TRXRDweld.
Fig. 13 — TRXRD results showing the FCC(111) and BCC(110) diffractionpeaks during weld cooling. The martensite transformation results in a rapidincrease in diffraction peak width for the BCC phase.
Time (s) 2-θ Diffraction Angle (deg)
elmer qwk 8/2/04 4:54 PM Page 251
WELDING RESEARCH
SEPTEMBER 2004-S252
strain induced by the martensite would alsoexplain similar changes in the broadening ofthe austenite peaks that occurred at thesame time.
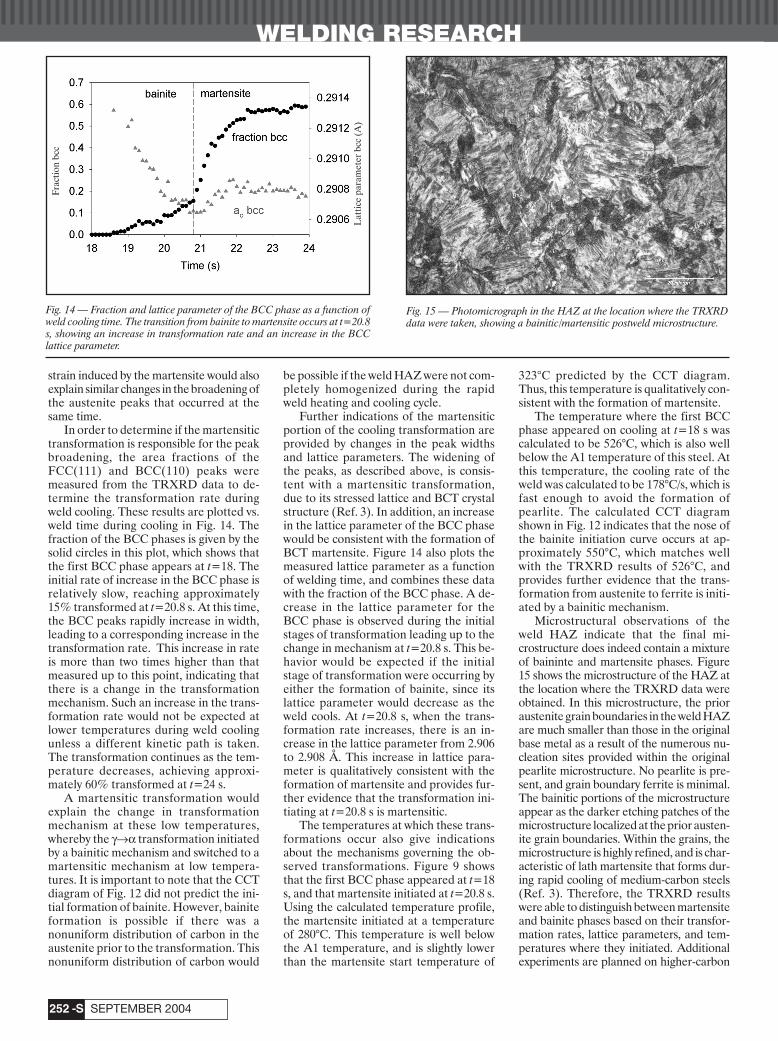
In order to determine if the martensitictransformation is responsible for the peakbroadening, the area fractions of theFCC(111) and BCC(110) peaks weremeasured from the TRXRD data to de-termine the transformation rate duringweld cooling. These results are plotted vs.weld time during cooling in Fig. 14. Thefraction of the BCC phases is given by thesolid circles in this plot, which shows thatthe first BCC phase appears at t=18. Theinitial rate of increase in the BCC phase isrelatively slow, reaching approximately15% transformed at t=20.8 s. At this time,the BCC peaks rapidly increase in width,leading to a corresponding increase in thetransformation rate. This increase in rateis more than two times higher than thatmeasured up to this point, indicating thatthere is a change in the transformationmechanism. Such an increase in the trans-formation rate would not be expected atlower temperatures during weld coolingunless a different kinetic path is taken.The transformation continues as the tem-perature decreases, achieving approxi-mately 60% transformed at t=24 s.
A martensitic transformation wouldexplain the change in transformationmechanism at these low temperatures,whereby the γ→α transformation initiatedby a bainitic mechanism and switched to amartensitic mechanism at low tempera-tures. It is important to note that the CCTdiagram of Fig. 12 did not predict the ini-tial formation of bainite. However, bainiteformation is possible if there was anonuniform distribution of carbon in theaustenite prior to the transformation. Thisnonuniform distribution of carbon would
be possible if the weld HAZ were not com-pletely homogenized during the rapidweld heating and cooling cycle.
Further indications of the martensiticportion of the cooling transformation areprovided by changes in the peak widthsand lattice parameters. The widening ofthe peaks, as described above, is consis-tent with a martensitic transformation,due to its stressed lattice and BCT crystalstructure (Ref. 3). In addition, an increasein the lattice parameter of the BCC phasewould be consistent with the formation ofBCT martensite. Figure 14 also plots themeasured lattice parameter as a functionof welding time, and combines these datawith the fraction of the BCC phase. A de-crease in the lattice parameter for theBCC phase is observed during the initialstages of transformation leading up to thechange in mechanism at t=20.8 s. This be-havior would be expected if the initialstage of transformation were occurring byeither the formation of bainite, since itslattice parameter would decrease as theweld cools. At t=20.8 s, when the trans-formation rate increases, there is an in-crease in the lattice parameter from 2.906to 2.908 Å. This increase in lattice para-meter is qualitatively consistent with theformation of martensite and provides fur-ther evidence that the transformation ini-tiating at t=20.8 s is martensitic.
The temperatures at which these trans-formations occur also give indicationsabout the mechanisms governing the ob-served transformations. Figure 9 showsthat the first BCC phase appeared at t=18s, and that martensite initiated at t=20.8 s.Using the calculated temperature profile,the martensite initiated at a temperatureof 280°C. This temperature is well belowthe A1 temperature, and is slightly lowerthan the martensite start temperature of
323°C predicted by the CCT diagram.Thus, this temperature is qualitatively con-sistent with the formation of martensite.
The temperature where the first BCCphase appeared on cooling at t=18 s wascalculated to be 526°C, which is also wellbelow the A1 temperature of this steel. Atthis temperature, the cooling rate of theweld was calculated to be 178°C/s, which isfast enough to avoid the formation ofpearlite. The calculated CCT diagramshown in Fig. 12 indicates that the nose ofthe bainite initiation curve occurs at ap-proximately 550°C, which matches wellwith the TRXRD results of 526°C, andprovides further evidence that the trans-formation from austenite to ferrite is initi-ated by a bainitic mechanism.
Microstructural observations of theweld HAZ indicate that the final mi-crostructure does indeed contain a mixtureof baininte and martensite phases. Figure15 shows the microstructure of the HAZ atthe location where the TRXRD data wereobtained. In this microstructure, the prioraustenite grain boundaries in the weld HAZare much smaller than those in the originalbase metal as a result of the numerous nu-cleation sites provided within the originalpearlite microstructure. No pearlite is pre-sent, and grain boundary ferrite is minimal.The bainitic portions of the microstructureappear as the darker etching patches of themicrostructure localized at the prior austen-ite grain boundaries. Within the grains, themicrostructure is highly refined, and is char-acteristic of lath martensite that forms dur-ing rapid cooling of medium-carbon steels(Ref. 3). Therefore, the TRXRD resultswere able to distinguish between martensiteand bainite phases based on their transfor-mation rates, lattice parameters, and tem-peratures where they initiated. Additionalexperiments are planned on higher-carbon
Fig. 14 — Fraction and lattice parameter of the BCC phase as a function ofweld cooling time. The transition from bainite to martensite occurs at t=20.8s, showing an increase in transformation rate and an increase in the BCClattice parameter.
Fig. 15 — Photomicrograph in the HAZ at the location where the TRXRDdata were taken, showing a bainitic/martensitic postweld microstructure.
Frac
tion
bcc
Lat
tice
para
met
er b
cc (
A)
elmer qwk 8/2/04 4:55 PM Page 252

WELDING RESEARCH
-S253WELDING JOURNAL
steels where the amount of martensiteformed will be greater, and where the ef-fects of carbon on the microstructure will beeven more apparent.
Conclusions
TRXRD experiments were performedin the HAZ of AISI 1045 steel during sta-tionary arc welding. These experimentalobservations provided real-time in situdiffraction patterns of the phase transfor-mations occurring during rapid weld heat-ing and cooling.
Diffraction peak profile analysis wasused to determine the relative fraction ofBCC and FCC phases during the weldingcycle, as well as the lattice parameters anddiffraction peak widths for each of thephases during the entire weld cycle.
A 3-D transient numerical weld modelwas used to predict weld temperatures as afunction of weld time and location. Themodel calculated the evolution of the FZ ve-locity fields and temperatures, and was vali-dated by comparing the predicted and ex-perimentally measured geometry of the FZ.
The TRXRD results and the weld tem-peratures were used to model the kineticsof the α→γ phase transformation duringweld heating of the 1045 steel using aJohnson-Mehl Avrami analysis. The re-sults yielded kinetic parameters for theJMA prediction of the transformation ofn=0.82 and ln(k0)=12.3 for an activationenergy of Q=117.1 kJ/mole.
The JMA results of the α→γ phasetransformation of the 1045 steel measuredhere were compared with previously cal-culated JMA parameters for a low-carbon1005 steel. Differences between the twosteels showed that the initial transforma-tion rate of the 1045 steel is more rapidthan that of 1005 steel, but that the trans-formation rate of the 1045 steel slowsdown, eventually requiring more timethan the 1005 steel to complete the trans-formation to austenite.
The transformation rates of both steelsappear to be controlled by the diffusion ofcarbon, and were influenced by the relativefraction of pearlite in the starting mi-crostructure and the starting grain size ofthe steel. The higher fraction of pearlite inthe microstructure of the 1045 steel resultedin its initial high transformation rate, but itslarger grain size, combined with its largepatches of allotriomorphic ferrite, resultedin its longer total transformation time.
During rapid weld cooling, the austen-ite that formed in the HAZ of the 1045steel was shown to back transform to fer-rite with significant undercooling belowthe A1 temperature. This transformationinitiated as a BCC phase with a relativelynarrow diffraction peak width at 526°C,which was shown to be the result of a bai-
nite transformation mechanism. During continued cooling, the trans-
formation rate suddenly increasedtwofold, and the BCC diffraction peakwidth and lattice parameters increaseddramatically at a temperature of 280°C.These effects were attributed to the for-mation of martensite, which completedthe transformation.
These TRXRD experiments representthe first real-time diffraction observationsof the formation of bainite and martensiteduring the welding of steels.
Acknowledgments
This work was performed under theauspices of the U.S. Department of En-ergy (DOE), Lawrence Livermore Na-tional Laboratory, under Contract No. W-7405-ENG-48. This work was supportedby DOE, Office of Basic Energy Sciences,Division of Materials Science. Portions ofthis research were carried out at the Stan-ford Synchrotron Radiation Laboratory, anational user facility operated by StanfordUniversity on behalf of the U.S. Depart-ment of Energy, Office of Basic EnergySciences. Additional portions of the re-search were performed by Oak Ridge Na-tional Laboratory, sponsored by the Divi-sion of Materials Sciences andEngineering, U.S. Department of Energy,under Contract DE-AC05-00OR22725with UT-Battelle, LLC. The authorswould like to express their gratitude to Mr.Bob Vallier of LLNL for performing themetallographic characterization of thebase metal and welded samples.
References
1. Honeycomb, R. W. K., and Bhadeshia, H.K. D. H. 1982. Steels, Microstructure and Prop-erties. Metals Park, Ohio: ASM International.
2. Bhadeshia, H. K. D. H. 2001. Bainite inSteels, 2nd ed. Institute of Materials, London.
3. Krauss, G. 1980. Steels: Principles of HeatTreating of Steels. Metals Park, Ohio: ASM In-ternational.
4. Grong, Ø. 1994. Metallurgical Modelling ofWelding, chap. 1. London, U.K.: The Institute ofMaterials.
5. Ashby, M. F., and Easterling, K. E. 1982.A first report on diagrams for grain growth inwelds. Acta Metall. 30:1969.
6. Ion, J. C., Easterling, K. E., and Ashby, M.F. 1984. A second report on diagrams of mi-crostructure and hardness for heat-affectedzones in welds. Acta Metall. 32:1949.
7. Elmer, J. W., Wong, J., and Ressler, T.2001. Spatially resolved X-ray diffraction map-ping of phase transformations in the HAZ ofcarbon-manganese steel arc welds. Metall. andMater. Trans. A 32A(5): 1175–1187.
8. Elmer, J. W., Palmer, T. A., Zhang, W.,Wood, B., and DebRoy, T. 2003. Kinetic mod-eling of phase transformations occurring in theHAZ of C-Mn steel welds based on direct ob-servations. Acta Materialia 51: 3333–3349.
9. Wong, J., Ressler, T., and Elmer, J. W.2003. Dynamics of phase transformations andmicrostructure evolution in carbon-manganesesteel arc welds using time resolved synchrotronX-ray diffraction. Part 2. J. Synchrotron Radia-tion 10(3): 154–167.
10. Elmer, J. W., Wong, J., and Ressler, T.1998. Spatially resolved X-ray diffraction phasemapping and α→β→α transformation kineticsin the HAZ of commercially pure titanium arcwelds. Metall. Mater. Trans. A 29A(11): 2761.
11. Elmer, J. W., Palmer, T. A., and Wong,J. 2003. In-situ observations of phase transitionsin Ti-6Al-4V alloy welds using spatially re-solved X-ray diffraction. Journal of AppliedPhysics 93(4): 1941–1947.
12. Babu, S. S., Elmer, J. W., David, S. A.,and Quintana, M. 2002. In-situ observations ofnon-equilibrium austenite formation duringweld solidification of a Fe-C-Al-Mn low alloysteel. Proceedings of the Royal Society: Mathe-matical, Physical and Engineering Sciences 458:811–821.
13. Elmer, J. W., Wong, J., and Ressler, T.2000. In-situ observations of phase transforma-tions during solidification and cooling ofaustenitic stainless steel welds using time-resolved X-ray diffraction. Scripta Materialia43(8): 751–757.
14. Palmer, T. A., Elmer, J. W., and Wong, J.2002. In-situ observations of ferrite/austenitetransformations in duplex stainless steel weld-ments using synchrotron radiation. Science andTechnology of Welding and Joining 7(3):159–171.
15. Sundman, B., Jansson, B., and Anders-son, J. 1985. Calphad — Computer Coupling ofPhase Diagrams and Thermochemistry 9(2): 153.
16. Zhang, W., Roy, G. G., Elmer, J. W., andDebRoy, T. 2003. Modeling of heat transfer andfluid flow during GTA spot welding of 1005steel. Journal of Applied Physics 93(5):3022–3033.
17. Cverna, F. 2002. Thermal Properties of Met-als. Materials Park, Ohio: ASM International.
18. Elmer, J. W., Palmer, T. A., Babu, S. S.,Zhang, W., and DebRoy, T. 2004. Phase trans-formation dynamics during welding of Ti-6Al-4V. Journal of Applied Physics 95(12):8327–8339.
19. Cullity, B. D., and Stock, S. R. 2001. El-ements of X-Ray Diffraction, 3rd Ed. UpperSaddle River, N.J.: Prentice Hall.
20. Speich, G. R., Demarest, V. A., andMiller, R. L. 1981. Formation of austenite dur-ing intercritical annealing of dual phase steels.Metallurgical Transactions A 12A:1419.
21. Christian, J. W. 1975. Theory of Transfor-mations in Metals and Alloys, Part I, 2nd Ed. Ox-ford, U.K.: Pergamon.
22. Bhadesia, H. K. D. H., Svensson, L. E.,and Gretoft, B. 1985. A model for the develop-ment of microstructure in low-alloy steel (FE-MN-SI-C) weld deposits. Acta Metallurgica33(7): 1271.
23. Bhadesia, H. K. D. H. 1982. Thermody-namic analysis of isothermal transformation di-agrams. Metal Science 16(3): 159.
24. Babu, S. S., and Bhadesia, H. K. D. H.1990. Transformation from bainite to acicularferrite in reheated Fe-Cr-C weld deposits. Ma-terials Science and Technology 6(10): 1005.
elmer qwk 8/2/04 4:55 PM Page 253