AUSTENITE FORMATION IN A COLD-ROLLED …digital.csic.es/bitstream/10261/111365/1/Austenite...
33
1 AUSTENITE FORMATION IN A COLD-ROLLED SEMIAUSTENITIC STAINLESS STEEL Carola Celada * , David San Martín MATERALIA Research Group, Department of Physical Metallurgy, Centro Nacional de Investigaciones Metalúrgicas (CENIM – CSIC), Av. Gregorio del Amo 8, 28040 Madrid, Spain E-mail addresses: [email protected] ; [email protected] Abstract The progress of the martensite (α’) to austenite (γ) phase transformation has been thoroughly investigated at different temperatures during the continuous heating of a cold-rolled precipitation hardening metastable stainless steel at a heating rate of 0.1 K/s. Heat treated samples have been characterized using different experimental complementary techniques: high- resolution dilatometry, magnetization and thermoelectric power (TEP) measurements, micro- hardness Vickers testing, optical/scanning electron microscopy and tensile testing. The two-step transformation behavior observed is thought to be related to the presence of a pronounced chemical banding in the initial microstructure. This banding has been characterized using electron probe microanalysis (EPMA). Unexpectedly, dilatometry measurements seem unable to locate the end of the transformation accurately, as this technique does not detect the second step of this transformation (last 20 % of it). It is shown that once the starting (A S ) and finishing (A F ) transformation temperatures have been estimated by magnetization measurements, the evolution of the volume fractions of austenite and martensite can be evaluated by TEP or micro-hardness measurement quite reliably as compared to magnetization measurements. The mechanical response of the material after being heated to temperatures close to A S , A F and (A F -A S )/2 is also discussed.
Transcript of AUSTENITE FORMATION IN A COLD-ROLLED …digital.csic.es/bitstream/10261/111365/1/Austenite...

1
AUSTENITE FORMATION IN A COLD-ROLLED SEMIAUSTENITIC
STAINLESS STEEL
Carola Celada*, David San Martín
MATERALIA Research Group, Department of Physical Metallurgy, Centro Nacional de
Investigaciones Metalúrgicas (CENIM – CSIC), Av. Gregorio del Amo 8, 28040 Madrid, Spain
E-mail addresses: [email protected]; [email protected]
Abstract
The progress of the martensite (α’) to austenite (γ) phase transformation has been thoroughly
investigated at different temperatures during the continuous heating of a cold-rolled
precipitation hardening metastable stainless steel at a heating rate of 0.1 K/s. Heat treated
samples have been characterized using different experimental complementary techniques: high-
resolution dilatometry, magnetization and thermoelectric power (TEP) measurements, micro-
hardness Vickers testing, optical/scanning electron microscopy and tensile testing. The two-step
transformation behavior observed is thought to be related to the presence of a pronounced
chemical banding in the initial microstructure. This banding has been characterized using
electron probe microanalysis (EPMA). Unexpectedly, dilatometry measurements seem unable to
locate the end of the transformation accurately, as this technique does not detect the second step
of this transformation (last 20 % of it). It is shown that once the starting (AS) and finishing (AF)
transformation temperatures have been estimated by magnetization measurements, the evolution
of the volume fractions of austenite and martensite can be evaluated by TEP or micro-hardness
measurement quite reliably as compared to magnetization measurements. The mechanical
response of the material after being heated to temperatures close to AS, AF and (AF-AS)/2 is also
discussed.

2
Keywords
Metastable austenitic stainless steel; martensite; reversion process; high-resolution dilatometry;
magnetization measurements; thermoelectric power; EPMA measurements.
*Corresponding author:
Carola Celada
Department of Physical Metallurgy
Centro Nacional de Investigaciones Metalúrgicas (CENIM-CSIC)
Avda Gregorio del Amo 8, 28040 Madrid, Spain
Email: [email protected]
Tel. +34915538900 (Ext 281)
Fax +34915347425
3
1 INTRODUCTION
Due to their excellent combination of properties and corrosion resistance, austenitic stainless
steels (SSs) are desirable candidates for a great number of applications [1,2]. However, the lack
of high strength precludes their wide spread use in an important number of these applications. In
this regard, a route for improving the strength of this type of steels that is gaining wide
acceptance, without degrading ductility, is the annealing of a heavily cold-rolled metastable
austenitic SS to produce nano/submicron austenite grain structures [3-8].
A few investigations published recently in the scientific literature point out the main factors that
influence the achievement of ultrafine-grained (UFG) microstructures. In summary, these are
the alloy composition, the degree of deformation, generally thickness reduction by cold rolling,
and the heating temperature and holding time selected for complete reverse transformation
above AF (temperature at which a fully austenitic microstructure is obtained during heating) [5-
10]. Understanding how the reversion or reaustenitization of the initially deformed
microstructure takes places under different processing conditions helps to understand what
mechanisms control this transformation, leads to the optimization of the processing route and
the achievement of the best combination of properties. Tomimura and co-workers [5] reported
that the reverse transformation of martensite (α’) to austenite (γ) occurs by a diffusionless
mechanism for low values of the ration Cr/Ni, whereas a diffusive mechanism prevails for high
values of the ratio Cr/Ni in metastable Fe-Cr-Ni ternary alloys. R. Kapoor and I.S. Batra [11]
investigated the effect of the heating rate on the reverse transformation in three different
stainless steels and found that the reverse mechanism changes from diffusive to diffusionless
with increasing heating rates in precipitation hardening steel grades PH 13-8 and PH 17-4. The
mechanism of the reversion process of cold-deformed steels, i.e, if it is diffusional or
diffusionless (similar to martensitic transformations) [5,6] is likely to be influenced by the
metastability of the austenite, which depends on the alloy chemical composition. Besides, the
metastability of austenite determines the degree of cold deformation required to obtain 100 %
martensite and, in reverted UFG austenitic microstructures, the metastability will determine the

4
strain hardening behavior and the total uniform elongation during tensile straining which, in
metastable austenitic steels, is very much influenced by the transformation induced plasticity
(TRIP) effect due to the strain induced martensite formation.
In annealed condition, the microstructure of the metastable austenitic stainless steel under
investigation in this work can be transformed to α’ under the application of stresses/strains [12]
or when subjected to cryogenic treatments [13]. This transformation can be accelerated by
applying external magnetic fields [14-16]. After its transformations to α’, the optimum
mechanical properties are obtained by inducing the precipitation of nano-intermetallic phases at
temperatures around 573-823 K (300-550 ºC) [17]. In this work, a detailed investigation is
carried out on this steel to understand why a two-step martensite to austenite (α’→ γ)
transformation is observed during the continuous heating formation of austenite (0.1 K/s) of an
initial cold-rolled martensitic microstructure. It will be discussed that high-resolution
dilatometry needs to be supported by other techniques such as magnetization measurements to
obtain reliable results of the temperature evolution of the volume fraction of austenite. It is also
shown that micro-hardness Vickers and, specially, thermoelectric power (TEP) measurements
can be used to obtained reasonable estimations of the volume fraction of austenite within the
starting (AS) and finishing (AF) transformation temperatures. Finally, scanning electron
microscopy (SEM) results seem to show that submicrometer size microstructures are obtained
during continuous heating up to temperature AF, 1098 K (825 ºC). The mechanical behavior
during tensile testing of samples heat treated to different temperatures between AS and AF has
been evaluated and discussed.

5
2 MATERIAL AND EXPERIMENTAL PROCEDURE
2.1 Chemical composition of the steel
The material under investigation is a metastable semi-austenitic and precipitation hardening
stainless steel, whose chemical composition is given in Table I. The manufacturing process
consists of a continuous casting followed by a hot-rolling and a cold-rolling until sheets of about
0.5 mm in thickness are obtained. Therefore, the material under investigation in this research
was received in the form of cold-rolled sheets.
The α’→ γ transformation was studied during continuous heating, at a rate of 0.1 K/s using
different experimental techniques which are described as follows.
2.2 High-resolution dilatometry and microstructural characterization
High-resolution dilatometry experiments were carried out using samples of 12 mm in length and
4 mm in width, which were heat treated in the high precision furnace of a high-resolution
dilatometer (Adamel Lhomargy DT1000) in a vacuum atmosphere of 10-1 mbar. Several works
published in the last years [18-20] have shown that hot-rolled C-Mn steels with banded
ferrite/pearlite microstructures experience significant anisotropic dilatation behavior depending
on the dilatometry sample machining direction with respect to the rolling direction. In this work,
the length of the dilatometry samples was machined perpendicular to the rolling direction of the
steel sheets. This way, possible anisotropies associated with variations in the machining
direction employed have been avoided. The estimation of the characteristic transformation
temperatures (starting and finishing transformation temperature, AS and AF respectively) was
intended from the in-situ measurement of the temperature dependent volume changes monitored
with this technique [21] up to temperatures of 1173 K (900 ºC). In addition, to study the
evolution of the volume fraction of austenite (fγ) during the transformation, interrupted heating
by helium-gas quenching experiments were performed at different selected temperatures. The

6
metallographic inspection of these samples was carried out on the cross section (perpendicular
to the rolling direction) of the steel sheets. Samples were ground and polished using standard
metallographic procedures. Final polishing of these samples was carried using a colloidal silica
solution. After etching the samples with the hot Lichtenegger-Blöch color etching solution at
333 K (60 ºC) for 30 seconds [22], the microstructure was inspected using optical (Nikon
Epiphot 200) and scanning electron (FEG-SEM Hitachi S4800) microscopes. Along with the
microstructural characterization, micro-hardness Vickers measurements were performed on
these samples in polished condition using a WILSON WOLPER 401 MVA equipment and a
load of 1 Kg.
The presence of microsegregation of alloying elements (Ni, Cr, Cu and Ti) was investigated by
means of an electron probe microanalysis (EPMA) in a JEOL JXA-8900M microprobe with a
wavelength dispersive spectrometer (WDS) at the ICTS National Center for Electron
Microscopy (CNME), located at the Complutense University of Madrid. Two-dimensional
EPMA maps were recorded in an as-received sample using a step size of 0.3 μm over an area of
90 μm x 150 μm.
2.3 Magnetization measurements.
Magnetization measurements were conducted using square-shaped samples with a side length of
3 mm. These samples have been heat-treated using the furnace of the DT1000 dilatometer,
mentioned in the previous section, at temperatures within AS and AF. A Quantum Design
MPMS-XL SQUID magnetometer has been employed for these measurements. Magnetization
curves have been recorded at 300 K (27 ºC) for each heat treated sample by varying the external
applied magnetic field from 0 to 5 Tesla in steps of 0.2 Tesla. The system takes two
measurements at each incremental field step, and the average data point is noted. The results are
very accurate (error of ± 0.01%), since the SQUID can detect minute variations (of order of 1 x
10-14 T) of a sample’s response to an applied magnetic field. As γ is a paramagnetic phase (small

7
and positive susceptibility) and α’ is ferromagnetic (large and positive susceptibility); if both
phases are present in the microstructure of this steel, the total magnetization, as a result of an
applied magnetic field, can be regarded as proportional to the volume fraction of α’ (the
contribution of paramagnetic γ can be discarded as long as the applied magnetic field is not very
large [15]. However, it should be borne in mind that if the martensite volume fraction is very
small, some remaining magnetization might be detected in the sample and be wrongly
interpreted as coming only from martensite. To convert the magnetization measurements into
the transformed martensite volume fraction, it is necessary to have a reference value ( ).
Thus, if the saturation magnetization of a heat treated sample ( ) is known, the amount of
austenite present in that sample can be estimated from:
1 ′ [1]
2.4 Thermoelectric power measurements.
Thermoelectric power (TEP) measurements were performed in samples of 30 mm in length and
5 mm in width. In this case, the heat-treatments were performed using the furnace of a high-
resolution dilatometer (Adamel Lhomargy LK02). TEP measurements have been carried out in
the following way: the sample was pressed mounted between two blocks of a reference metal
(pure copper in this study). One of the blocks is held at 288 K (15 ºC) and the other at 298 K (25
ºC) to obtain a temperature gradient (ΔT=10 K with a tolerance of ±0.1 K). As a result of this
temperature gradient imposed between the two extremes of the sample a difference in potential
is created (ΔV). The Seebeck coefficient of thermoelectric power measured by this equipment is
the ratio between ΔV and ΔT. The apparatus does not give the absolute TEP value of the sample
(S*), but a relative TEP (S) in comparison to the TEP of pure copper blocks (S0*) at 293 K (20
ºC) [23]. The TEP value does not depend on the shape of the sample, which is a great advantage
of this technique. Moreover, the measurement is performed very quickly (less than 1 min) and
precisely (about ±0.5%). The resolution is of the order of 0.001 µV/K.
8
2.5 Tensile testing.
Tensile tests were carried out on sub-size samples heat treated up to 918, 953 and 1123 K (645,
680 and 850 ºC) using the furnace of the Adamel Lhomargy LK02 dilatometer. These
temperatures were selected to have approximately a volume fraction of austenite transformed of
0.1, 0.5 and 1.0, respectively. Sub-size specimens had a gauge length of 7 mm and a width of 2
mm. Two tensile tests were performed for each condition, at room temperature and applying a
strain rate of 5x10⁻⁴ s-1 until fracture occurred.
3 RESULTS
The as-received material comprises almost 100 % of martensite phase (volume fraction, fα’
~0.97), with small amounts of χ-phase (fχ ~0.02), and retained (austenite/delta ferrite) phases
(fγ+δ ~ 0.01) [24]. Figure 1 displays an optical (a) and a SEM micrograph (b) of the initial
microstructure after etching with L-B color etching solution at 333 K (60 ºC) for 30 seconds.
The presence of χ-phase has been highlighted by arrows. This chemical etching is very sensitive
to the content of alloying elements in solid solution. As Fig. 1(a) shows, the as-received
material exhibits a pronounced chemical banding. This chemical banding has been thoroughly
investigated in a previous work [24], where it has been discussed how this microsegregation
originates during the solidification process and it is accentuated by the hot and cold-rolling
steps. As the chemical banding may influence the reaustenitization process, the
microsegregation of the mayor alloying elements was characterized by EPMA. Figure 2 shows
some two-dimensional EPMA maps that were recorded over the area that appears delimited by
white dash lines in Figure 1(a). Each EPMA map contains the concentration of each alloying
element by means of an intensity parameter that was normalized with the mean chemical
composition of the steel. It was found that Ni, Cu and Ti segregate together in the bands, while
Cr has an opposite behavior (please see reference [24] for more details).

9
Figure 3 shows a characteristic dilatometry plot recorded during continuous heating at a rate of
0.1 K/s up to 1173 K (900 ºC). Two main consecutive contractions have been observed. The
first contraction, starts at ~790 K (~517 ºC) and finishes around 883 K (610 ºC) and is thought
to be related mainly with a combination of precipitation reactions and the partial recovery of the
deformed martensitic microstructure in this range of temperatures. The second contraction is
associated with the α’ → γ phase transformation. The starting (AS) and finishing (AF)
transformation temperatures estimated initially from the dilatometry plots are 918±2 K (645±2
ºC) and 1043±6 K (770±6 ºC), respectively. Up to 3 different experiments have been performed
to obtain these values. As a first approximation, the temperature evolution of the volume
fraction of γ has been estimated using the lever-rule method [21]. The volume fraction of
austenite transformed (fγ) during heating, as determined by this method has been calculated as
the ratio of the observed contraction (ΔLα’e – ΔL) to the maximum possible contraction at each
temperature (ΔLα’e – ΔLγ
e), and calculated by:
′ – ′– γ [2]
where ΔLα’e and ΔLγ
e represent the extrapolated dilatations in the low-temperature and high-
temperature range, respectively (as depicted in Figure 3). The result of the temperature
evolution of the volume fraction of austenite estimated using Equation [2] is shown in Figure
4(b) as a continuous solid line.
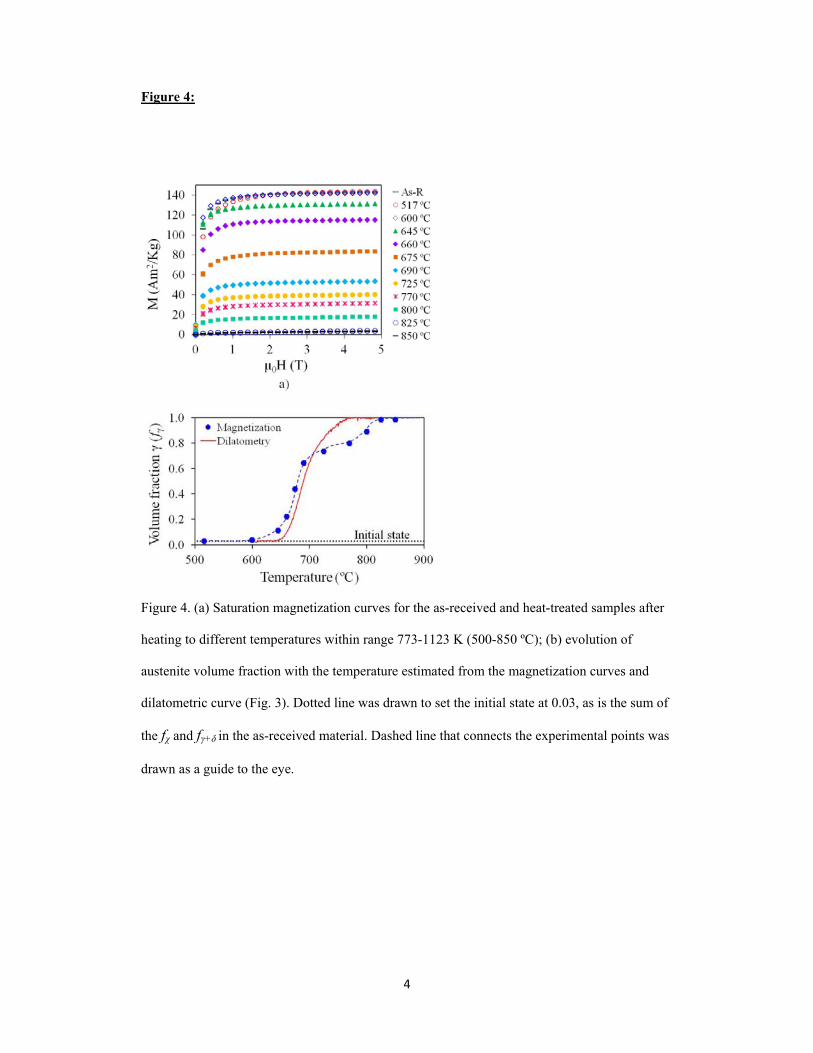
In Figure 4(a), the magnetization curves are given for the different samples heat treated up to
different temperatures between 773 and 1123 K (500 and 850 ºC). As it was discussed in
Section 2, for the determination of the volume fraction of γ using Equation [1] it is necessary to
use a reference sample. For this purpose, three cold rolled samples of the initial microstructure,
with a known volume fraction of martensite (fα’ ~0.97), were used and a saturation
magnetization mean value of ~142±1 emu/g was obtained. This value approximately
corresponds to a value of ~146±1 emu/g for a microstructure that would ideally contain

10
100 % of martensite. The temperature evolution of the volume fraction of austenite as estimated
from the magnetization curves shown in Figure 4(a) using Equation [1] is given in Figure 4(b).
A clear disagreement is observed when the dilatometry and magnetization measurements are
compared (Fig. 4b). The temperature evolution of the volume fraction and the position the
transformation temperatures (AS and AF) are significantly different. The transformation starts at
a much lower temperatures, ~873-883 K (~600-610 ºC), than the AS initially estimated by
dilatometry, 918 K (~645 ºC). Besides, at 1043 K (770 ºC) (AF from dilatometry) there is still a
fα’ ~0.20 that remains untransformed. The magnetization measurements establish that the
complete reaustenitization of the microstructure occurs at around 1098 K (825 ºC) after heating
at 0.1 K/s.
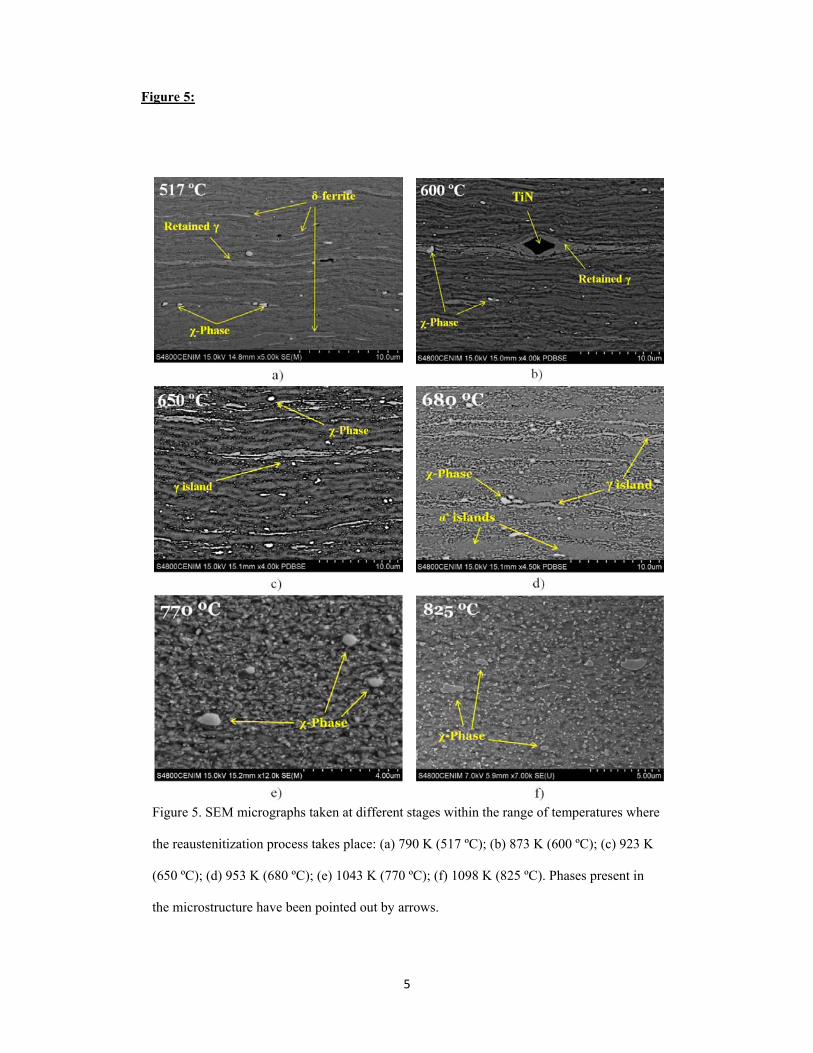
Figure 5 displays some SEM micrographs taken from samples that were subjected to interrupted
heat treatments at different temperatures. At 790 K (517 ºC) and 873 K (600 ºC) (Fig. 5a and
5b) the martensitic microstructure appears as partially recovered. In addition, recrystallization
seems to takes place in the cold-worked retained-γ regions [25]. Some retained-γ islands have
been identified at 790 K (517 ºC), as well as some δ-ferrite stringers. Figure 5(c) displays a
micrograph taken at 923 K (650 ºC) where the nucleation process has begun at deformation
bands, where the dislocation density is higher. Some retained-γ islands can also be observed.
These big islands of γ have probably grown from retained-γ islands already present in the as-
received material or from areas in the microstructure with higher content in γ-stabilizers, such as
Ni or Cu (please see EPMA maps in Figure 2). According to the magnetization results, at 918 K
(645 ºC) around a volume fraction of γ of 0.1 has already transformed from α’, which is
consistent with the microstructure observed in Figure 5(c). As Figures 5(d)-(f) show, the volume
fraction of γ keeps growing with increasing temperatures until a completely austenitic
microstructure with a sub-micron grain size is obtained at 1098 K (825 ºC). As the
transformation proceeds, it becomes more difficult to estimate the evolution of the volume
fraction of austenite from these electron micrographs due to the very fine microstructure
obtained and poor contrast observed between γ and α’. Although, apparently, there are no clear
11
differences in the microstructure observed at 1123 K (770 ºC) and 1098 K (825 ºC) (Fig. 5(e-f)),
magnetization measurements have revealed that at 1123 K (770 ºC) a 20 % of the initial
martensitic microstructure remains untransformed. Finally, it is evident from this SEM images
that the estate of precipitation of the microstructure after heating at 0.1 K/s is significant; in
Figure 5(f) these submicro- and micro-meter sized precipitates (χ-phase) appear as light grey.
Other nanometer precipitates are expected to be formed in this steel on heating [17].
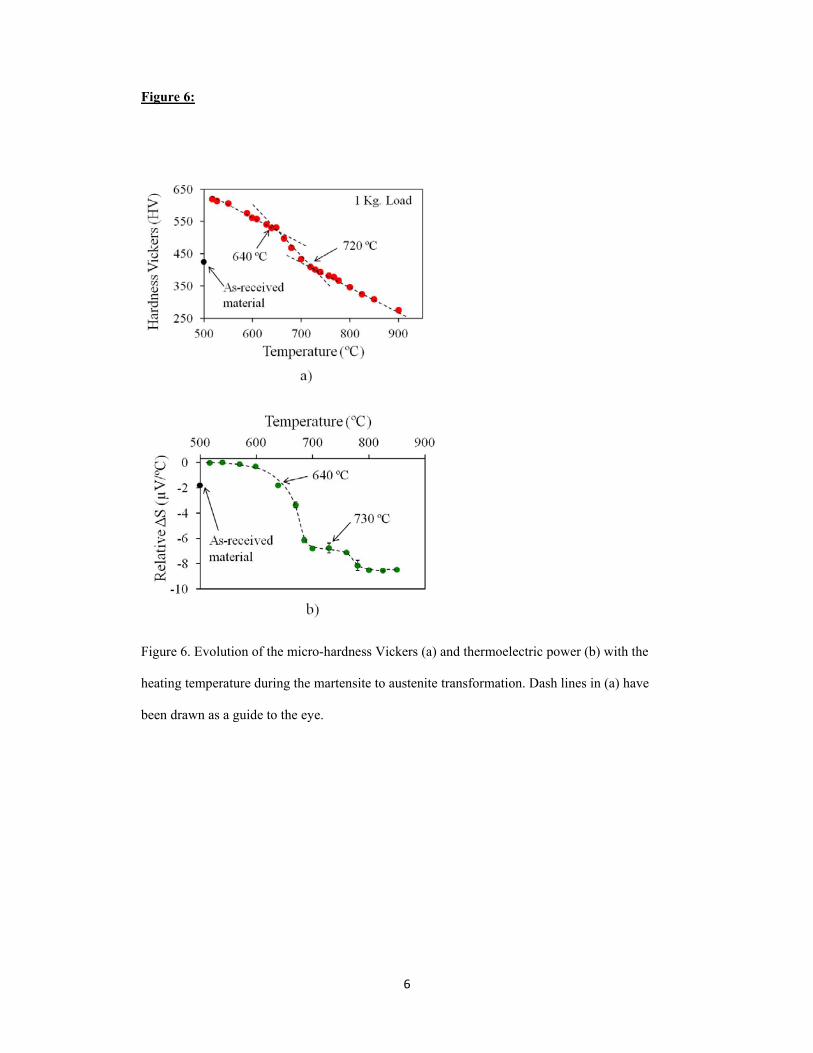
In Figure 6 the evolution of the micro-hardness Vickers (a) and TEP measurements (b) as a
function of the heating temperature have been plotted. In this work, all TEP measurements have
been corrected using the value obtained at 790 K (517 ºC) as the origin. From Fig. 6(a) it can be
observed that there is an increase in hardness from the as-received state (425 HV) to the sample
treated at 790 K (517 ºC) (620 HV). There is also an increment of about 2 µV/K in the TEP
from the as-received state to the measurement at 790 K (517 ºC). From this heating temperature
both the micro-hardness and the TEP values decrease with the temperature. It is interesting to
highlight that a fast drop is observed in both plots between 913 K (640 ºC) and 993 K (720 ºC).
From 1073 K (800 ºC) (around AF given by magnetic measurements) the hardness decreases
linearly with the heating temperature, while the TEP remains almost constant.
Figure 7 (a) shows the engineering stress-plastic strain curves obtained for the as-received
material and for samples that were heat-treated up to 918, 953 and 1123 K (645, 680 and 850
ºC). At these temperatures, very different fγ: 0.11±0.02, 0.51±0.02 and 0.98±0.02 (as measured
with the magnetization measurements), respectively, have been estimated. In Figure 7 (b) the
mean values for the yield strength (YS), ultimate tensile strength (UTS), uniform elongation
(εun) and total elongation (εt) have been plotted. The YS and UTS increase from the as-received
state to the sample heat-treated up to 918 K (645 ºC), and from this point these properties
decrease with increasing temperatures. On the contrary, εun and εt increase as the heating
temperature increases and the UTS decreases, as it would be expected.

12
4 DISCUSSION
4.1 REAUSTENITIZATION PROCESS
4.1.1 Microstructural Characterization
As it was shown in Figure 1(a) and Figure 2, this steel in the as-received condition exhibits a
pronounced chemical banding along the transversal section perpendicular to the rolling
direction. The characterization of this banding and discussion regarding its origin has been
presented with detail somewhere else [24]. These compositional variations are very significant,
especially in the Ni, Cu and Cr maps (Figure 2). It is well known that Cr is a α’-stabilizer, while
Ni and Cu are γ-stabilizers. Particularly, Ni is used in commercial stainless steels like 304 or
316 to stabilize the γ phase at room temperature. Since the presence of Ni lowers the
temperature range over which γ is stable, Ni-rich bands are transformed first than Ni-depleted,
(which are also rich in Cr), due to their lower local AS temperature [26]. This seems to be
observed in the SEM micrograph taken at 923 K (650 ºC) (Fig. 5(c)). At this temperature the
nucleation of γ has started at preferred deformation bands which are likely more enriched in Ni
and Cu. In this micrograph, the larger γ islands may have grown from the retained-γ present in
the as-received material, around which the content of γ-stabilizers is higher. From the evolution
of the transformation showed in Figures 5 (c-f) it is observed that the α’→ γ transformation after
slow heating at 0.1 K/s takes place diffusionally; γ nucleates within the α’ leading to equiaxed
grains that gradually grow during the reaustenitization process.
4.1.2 High resolution dilatometry and magnetization measurements
Austenite (FCC crystal structure) and low-carbon martensite or ferrite (BCC crystal structure)
have very different atomic volumes [27]. When the steel transforms from one phase to the other
the atomic volume of the sample changes, which gives rise to a shape change that can be
detected using high resolution dilatometry. In the absence of a transformation one should expect

13
a linear behavior with a slope given by the coefficient of thermal expansion of the phase or
phases present in the microstructure. Other processes like precipitation reactions or
recrystallization/recovery also influence the atomic volume of these phases as they can affect
the lattice parameters. Figure 3 shows two contractions during heating; the first one, 790-883 K
(517-610 ºC), has been observed in similar steels and can be associated with the precipitation of
intermetallic phases [17] and the partial recovery of the initially deformed microstructure. The
second one, 918-1043 K (645-770 ºC) is due to the α’→ γ transformation. In the ranges 883-918
K (610-645 ºC) and 1043-1098 K (770-825 ºC) the dilatometry curve shows a linear expansion
and, thus, no transformation should be expected in these temperature intervals.
Several dilatometry studies can be found in the literature on the continuous heating
transformations in martensitic precipitation hardening steels [11,28,29]. Kapoor and Batra [11]
studied three different precipitation hardening steels (M350, PH 13-8Mo, 17-4 PH) and, for all
three, observed a contraction in the dilatometry plots before the start of the martensite to
austenite transformation (As) very similar to that observed in this work (Figure 3). These
authors associated this contraction with precipitation reactions of intermetallic phases in
martensite. In the dilatometry plots shown in the work of Hsiao et al [28], the same weak
contraction is observed during heating of 17-4 PH, although no discussion was carried out by
the authors. More recently, Christien et al. [29] have argued and demonstrated experimentally
that the first contraction observed in this steel could be also due to the formation of some
amount of austenite. On the other hand, in a recent work by Huang et al. [30], carried out in an
interstitial free steel, these researchers detected a contraction around 873-973 K (600-700 ºC)
during the slow heating of a deformed (50 %) sample. Huang et al. argue that this contraction
was due to the recrystallization of the microstructure because: 1) the ferrite to austenite
transformation takes place at much higher temperatures and 2) no contraction was observed
after the sample was given a high temperature heat treatment to obtain a recrystallized
microstructure. Other authors have observed similar contractions during recrystallization of
ferrite in cold-rolled low carbon steels [31-33]. All these experimental observations discussed

14
above would support that the first contraction is due to a combination of precipitation and
recrystallization of the initial cold-rolled microstructure. As both processes are taking place at
the same time it is difficult to separate the contribution of each to the total strain. Besides, it is
less likely that this contraction is due to the austenite reversion as observed by Christien in 17-4
PH, as the volume fraction of austenite only increases in this steel after heating above 873 K
(600 ºC), which is close to the end of the first contraction (Fig. 4).
As it was shown in Figure 4, when a comparison was made between the temperature evolution
of the volume fraction of γ as determined by high-resolution dilatometry and the magnetization
measurements a poor agreement was found. For this steel, under the heating conditions
investigated, it was surprising to observe that high-resolution dilatometry was not sensitive to
the first 10 % nor to the last 20 % of this transformation. Moreover, the magnetization
measurements (Fig. 4b) show that in those linear dilatation segments where no phase
transformation was expected to take place, the volume fraction of γ increases significantly,
especially between 1043 K (770 ºC) and 1098 K (825 ºC). As it has been discussed above
dilatometry is able to detect phase changes among phases that possess different atomic volumes
or changes in the atomic volume of a single phase due to precipitation reactions or
deformation/recovery/recrystallization of those phases since the atomic volume depend on the
lattice parameters of the crystal structure. A process/transformation resulting in a dilatation that
counteracts the contraction due to the α’ → γ transformation must be taking place in this case
during heating. In an alternative way, in-situ high energy X-ray diffraction experiments at a
synchrotron source have been planned to determine the evolution of the volume fraction and,
specially, the lattice parameters of austenite and martensite [16] with the aim of comparing them
with the results obtained in this work. The fact that this transformation takes place in bands due
to the chemical banding suggests that this proposed study should be done under transmission
mode to obtain a complete image of the bulk, not only the surface of the sample. Very recently,
Christien et al. [29] have experienced the same problems after studying the continuous heating
behavior of 17-4 PH stainless steel. While high resolution dilatometry measurements located the
15
AF temperature, apparently, around 1083 K (810 ºC) (after heating at ~0.28 K/s), in-situ neutron
diffraction experiments clearly showed that the transformation had not finished at 1203 K (930
ºC) and only after heating to 1243 K (970 ºC), martensite peaks disappear from the diffraction
patters. To explain their dilatometry observations and the difficulties found to determine the AF
temperature with dilatometry in this steel, the temperature evolution of the density of austenite
and martensite during heating was determined by using the experimental lattice parameters
obtained with neutron diffraction. They concluded that at high temperatures the densities of
these two phases are so similar that it becomes very difficult to differentiate them to the eyes of
dilatometry. However, this justification would not explain why, in the current investigation,
during the linear increase from 883 K (610 ºC) to 918 K (645 ºC) (Fig. 3), a linear dilatometry
behavior is observed, while the austenite volume fraction increases up to 0.1 (Fig. 4b).
The two-step transformation behavior, experimentally observed in the magnetization
measurements, can be explained based on the chemical banding present in the initial
microstructure, which results in having martensitic regions in the microstructure with different
thermal stability. Ni- and Cu-rich (Cr-depleted) regions transform to austenite at lower
temperatures, while those poorer in these elements and enriched in Cr transform at higher
temperatures [6,34].
4.1.3 Micro-hardness Vickers and Thermoelectric power measurements (TEP)
In order to strengthen and support the experimental characterization carried out using high-
resolution dilatometry and magnetization measurements, the temperature evolution of this
transformation was also followed-up using micro-hardness Vickers and TEP measurements. In
the range of temperatures investigated and shown in Figures 3, 4 and 6, there are three main
processes taking place in the microstructure: precipitation/dissolution of second phases
(precipitates), recovery/recrystallization and austenite formation. As it has been discussed,
magnetization is a very useful technique to differentiate between phases that have very different

16
magnetic properties such as austenite (paramagnetic) and martensite (ferromagnetic).
Magnetization measurements might be sensitive to precipitation reactions as these can modify
the matrix composition and affect, in this way, the magnetic moment of the austenite/martensite
and, thus, the saturation magnetization values. However, the volume fraction of precipitates
formed in this range of temperatures above 773 K (500 ºC) is relatively small and its influence
on these measurements is very weak. Therefore, variations in the volume fractions of austenite
and martensite can be monitored accurately with this technique. TEP is a powerful technique
used to monitor microstructural changes such as recovery, recrystallization and dissolution-
precipitation processes in steels and Fe-based alloys, since it is very sensitive to both the
amount of atoms in solid solution or degree of deformation (amount of dislocation in the
microstructure) [35-39]. From the results depicted in Figure 6, it is very interesting to highlight
that this technique is also very sensitive to the evolution of the volume fraction of γ and α’ in
the microstructure as it reflects the two-step transformation behavior. As it has been emphasized
above, the volume fraction of precipitates formed above 773 K (500 ºC) is small. Please note
that the TEP at 790 K (517 ºC) (Fig. 6b) has increase about 2 µV/K with respect to the initial as-
received state due to precipitation of nanometer scale intermetallic precipitates [17]. As most
precipitation takes place below this temperature, the total contribution of
precipitation/recrystallization to the TEP remains in the order of the nV/K, while changes due to
austenite formation are in the order of the µV/K. As a result, this technique seems reliable to
determine the temperature evolution of the martensite to austenite volume fractions in the steel
under investigation. In contrast to magnetization and TEP measurements, hardness
measurements have not resulted as sensitive as these other two techniques to variations in the
volume fraction of austenite/martensite. The recovery/recrystallization of the microstructure and
precipitation/coarsening of precipitates results in a significant continuous decrease of the
hardness values below 873 K (600 ºC) (Fig. 6a), while the dissolution of precipitates and
austenite grain growth leads to a continuous decrease as we approach 1123 K (850 ºC). Still,
hardness measurements are sensitive to the sharp increase in the volume fraction of austenite
between 913 K (640 ºC) and 993 K (720 ºC), although it is not able to differentiate clearly the

17
two step transformation behavior. Finally, whereas from the magnetization and TEP
measurements, the AS and AF temperatures could be estimated, this would not be possible from
the hardness measurements, as a linear decrease in hardness is observed below 913 K (640 ºC)
and above 993 K (720 ºC).
Having the above discussion in mind and assuming that the AS and AF temperatures, 873 K (600
ºC) and 1098 K (825 ºC) respectively, have been reliably determined in this work by
magnetization measurements, the evolution of the TEP and micro-hardness Vickers within this
range of temperatures can be converted to transformed volume fraction of γ using the following
simple expression:
[3]
Where Xi and Xf represent the values of micro-hardness or TEP at 873 K (600 ºC) and 1098 K
(825 ºC), respectively, and X is the value of the micro-hardness or TEP at each measured
temperature within this range. The results obtained are shown in Figure 8. The micro-hardness
and TEP measurements give reasonable estimations of the evolution of the volume faction of γ
when compared with the magnetization results. All techniques reveal that the transformation
occurs faster between 873 K (600 ºC) and 993 K (720 ºC), while it slows down from 993 K (720
ºC) up to the end. To summarize, although magnetization measurements appear as the most
accurate and reliable experimental technique to study the evolution of this transformation in this
type of steels, it is possible to use other experimental techniques such as micro-hardness Vickers
and TEP measurements to gain insight about the reaustenitization process. These techniques
have advantages over magnetization measurements: are chipper, easier to use and are usually
available in laboratories.

18
4.2 MECHANICAL PROPERTIES
Besides micro-hardness Vickers measurements, the mechanical properties were characterized by
means of tensile testing. In Figure 6 (a) the increase in hardness observed when the initial as-
received state and the point at 790 K (517 ºC) are compared is attributed to the precipitation
hardening underwent by the steel when heated between 673 K (400 ºC) and 823 K (550 ºC). It
has been reported that nano-intermetallic phases of type Ni3(Ti,Al) and Fe2Mo with sizes
ranging 20-200 nm precipitate within the α’ phase [17]. As it has been discussed before, the
evolution of the TEP shows a similar behavior (Fig. 6b) and this should be expected because
several investigation have reported that precipitation in steels leads to an increase in the TEP
[36,37,39]. Further heating above 773 K (500 ºC) up to 873 K (600 ºC) leads to the coarsening
of existing precipitates and additional recovery of martensite. As a result, the hardening effect
decreases from 620 HV to 560 HV (at 873 K (600 ºC)). Around 873 K (600 ºC) the formation of
new γ nuclei starts and existing γ islands also grow in size (Fig. 5). From this temperature up to
1098 K (825 ºC) the hardness drops continuously as the volume fraction of the softer (compared
to martensite) austenite increases. It is interesting to note that around 973 K (700 ºC), the
hardness of the steel is similar to that the initial microstructure, although at this temperature, the
microstructure already contains around 65% of austenite. This result highlights the important
strengthening effect of the intermetallic phases formed during heating in the microstructure. At
1098 K (825 ºC) the transformation is completed and the microstructure presents a hardness
value around 330 HV. For temperatures above 1098 K (825 ºC) the hardness keeps dropping
down as mechanisms such as austenite grain growth or further coarsening of precipitates
contribute to decrease the hardness of the steel. Mechanical test results shown in Figure 7 are in
good agreement with the hardness results. They clearly reveal that the strength and ductility are
strongly influenced by the applied heat treatment. Among the conditions tested, the highest
strength was obtained for samples heat treated up to 918 K (645 ºC). At this temperature,
although there is a small volume fraction of austenite (fγ=0.11±0.02) that would soften the
microstructure, the remaining martensitic microstructure presents a high density of intermetallic
phases that contribute to increase the strength and lower the ductility (Fig. 7b). As for the

19
micro-hardness results, with increasing temperatures these intermetallic precipitates coarsen and
the volume fraction of γ increases, leading to a loss of the mechanical tensile strength and gain
in ductility [40,41].
Metastable austenitic stainless steels are designed to be thermodynamically unstable so that a
phase transformation of γ to α’ can take place due to a drop in temperature, elastic stressing,
plastic straining or any combination of these events. The metastability of austenite improves the
formability of these steels, as necking is delayed. During straining, the austenite phase
transforms to martensite and additional plastic deformation is gained through the so-called
Transformation Induced Plasticity effect (TRIP). This is observed as a plateau in tensile curve
of samples heat-treated to 1098 K (825 ºC) (fγ=0.98±0.02, Figure 7a). Further straining of these
samples increases the strength due to the increasing amount of strain-induced α’ in the
microstructure [42,43]. Datta et al. [42] reported some stress-strain curves obtained for this
same steel. In their study the material was subjected to an industrial annealing and a fully
austenitic microstructure with a mean austenite grain size (AGS) of the order of 10 μm was
obtained. A comparison of the main mechanical parameters, derive from the stress-strain curve
presented by Datta and co-workers [42], and those obtained in this study is made in Table II.
Differences observed between both investigations highlight the important influence of the
heating cycle on the microstructure and mechanical properties of this steel. During an industrial
annealing steel samples are generally introduce in a furnace previously pre-heated to a certain
temperature. Therefore, the overage heating rate is expected to be much faster (~5 K/s) than the
one studied in this work (0.1 K/s). A much higher state of precipitation during slow heating
should be expected as it has been discussed previously in this work. Besides, the fact the
austenite grain size is much larger for their work (10 µm) compared to ours (SEM micrographs
in Figure 6 seem to show that austenite grains are of submicrometer size), presumes that a much
higher heating temperature than 1098 K (825 ºC) has been used industrially. In summary,
having a finer grain size and a higher density of precipitates is probably the reason behind the
larger YS and UTS values measured in this study compared to the work of Datta and co-

20
workers [42]. It is also interesting that although there is an important increase in the strength of
the steel, the εun remains very similar, which could lead to the conclusion that these precipitates
do not affect negatively the TRIP effect or even contribute to improve the ductility of the steel
in a similar fashion as it has recently been observed by Raabe and co-workers high-Mn
austenitic steel [44]. More research regarding the type of precipitates present in these
microstructures using transmission electron microscopy is currently under investigation.
5 CONCLUSIONS
The reaustenitization process of a cold-rolled metastable semi-austenitic stainless steel has been
studied by means of different complementary experimental techniques: high-resolution
dilatometry, magnetization measurements, optical and scanning electron microscopy, micro-
hardness Vickers, thermoelectric power measurement and tensile testing. This experimental
research, has given valuable analysis of this phase transformation during continuous heating.
The main conclusions of this work are summarized as follows:
1. The temperature evolution of the α’ to γ has been reliably determined using
magnetization measurements. This technique has shown that this transformation takes
place in two consecutive steps. The origin of this behavior is explained based on the
pronounced chemical banding present in the initial microstructure. Those regions of the
microstructure enriched in Ni and Cu (and depleted in Cr) are likely to transform at
lower temperatures compared to those depleted in Ni and Cu. The AS and AF
temperatures estimated with this technique are located around 873 K (600 ºC) and 1098
K (825 ºC), respectively.
2. Surprisingly high-resolution dilatometry results do not correlate well with the results
obtained by magnetization measurements.

21
3. Once AS and AF temperatures have been determined, micro-hardness Vickers and
thermoelectric power measurements have been proven very useful to follow-up the
progress of the α’ → γ phase transformation. An estimation of the temperature
evolution of the volume fraction of γ using these techniques correlate well with the
magnetization measurements. Besides, these two techniques have been found helpful to
study processes such as precipitation reactions that take place in this steel below AS
temperature.
4. The α’ → γ phase transformation during heating at 0.1 K/s takes place by a diffusional
mechanism. Scanning electron micrographs show that equiaxed grains nucleate and
grow during heating within the martensitic microstructure. Scanning electron
micrographs show that after heating at 0.1 K/s up to AF= 1098 K (825 ºC) a
submicrometer size austenitic microstructure is obtained.
5. The fully austenitic microstructure exhibits a yield strength (YS) of 810 MPa, ultimate
tensile strength (UTS) of 1163 MPa, a uniform elongation of 20 % and total elongation
of 26 %. While the strength of the material has been improved compared to industrially
annealed counterparts (Datta and co-workers [42]), the total uniform elongation has
remained very similar.
6 AKNOWLEDGEMENTS
The authors would like to acknowledge the financial support from the Ministerio de Economía y
Competitividad (project No. MAT2010-19522) and C. Celada would like to thank the Consejo
Superior de Investigaciones Científicas (CSIC) in the form of a JAE-predoc grant under the
program “Junta para la Amplianción de Estudios”, co-funded by the European Social Fund.
Authors are grateful to Centro Nacional de Microscopía Electrónica (CNME), located at
Complutense University of Madrid (UCM), for the provision of laboratory facilities and to
Alfredo Fernández Larios for the technical support. Authors acknowledge Alfonso García
Delgado and Wilfredo Edgar More Seminario, for the technical support with the scanning

22
electron microscope at Centro Nacional de Investigaciones Metalúrgicas (CENIM-CSIC). Julio
Romero de Paz from the Research Support Center of Physical Techniques (CAI-Técnicas
Físicas, UCM) is acknowledged for the provision of the SQUID magnetometer facility and the
technical support. Javier Vara Miñambres and Nacho Ruiz Oliva from CENIM are gratefully
acknowledged for their continuous experimental support.
7 REFERENCES
1. P. Lui: Mater. Char., 2000, vol. 44, pp. 413-424.
2. M. Eskandari, A. Najafizadeh, A. Kermanpur, and M. Karimi: Mater. Design., 2009, vol.
30, pp. 3869-3872.
3. R.D.K. Misraa, Z. Zhanga, Z. Jia , P.K.C. Venkatsuryaa, M.C. Somanib, L.P. Karjalainenb:
Mater. Sci. Eng. A, 2012, vol. 548, pp. 161-174.
4. I. Shakova, V. Dudko, A. Belyakov, K. Tsuzaki, R. Kaibyshev: Mater. Sci. Eng. A, 2012,
vol. 545, pp. 176-186.
5. K. Tomimura, S. Takaki, S. Tanimoto, Y. Tokunaga: ISIJ Int., 1991, vol. 31, pp. 725-727.
6. K. Tomimura, S. Takaki, Y. Tokunaga: ISIJ Int., 1991, vol. 31, pp. 1431-1437.
7. Y. Murata, S. Ohashi, Y. Uematsu: ISIJ Int., 1993, vol. 33, pp. 711-720.
8. Y. Ma, J.E. Jin, Y.K. Lee: Scr. Mater., 2005, vol. 52, pp. 1311-1315.
9. S. Rajasekhara, L.P. Karjalainen, A. Kyröläinen, P.J. Ferreira: Mater. Sci. Eng. A, 2010.
Vol. 527, pp. 1986-1996.
10. J. Huang, X. Ye, J. Gu, X. Chen, Z. Xu: Mater. Sci. Eng. A, 2012, vol. 532, pp. 190-195.
11. R. Kapoor, I.S. Batra: Mater. Sci. Eng. A, vol: 371, pp. 324-334.
12. J. Post, C. de Vries, J. Huétink, J Mater. Process. Tech., 2009, vol. 209, pp. 5558-5572.
13. D. San Martin, N.H. van Dijk, E. Bruck, S. van der Zwaag: Mater. Sci. Eng. A, 2008, vol.
481–482, pp. 757–761.
14. D. San Martın, K.W.P. Aarts, P.E.J. Rivera-Dıaz-del-Castillo, N.H. van Dijk, E. Bruck, S.
van der Zwaag: J Magn. Magn. Mater., 2008, vol. 320, pp. 1722-1728.

23
15. D. San Martin, N.H. van Dijk, E. Jiménez-Melero, E. Kampert, U. Zeitler, S. van der
Zwaag: Mater. Sci. Eng. A, 2010, vol. 527, pp. 5241-5245.
16. D. San Martin, E. Jimenez-Melero, J. A. Duffy, V. Honkimaki, S. van der Zwaag and N. H.
van Dijk: J App. Crystallog., 2012, vol. 45, pp. 748-757.
17. Mats Hattestrand, Jan-Olof Nilsson, Krystyna Stiller, Ping Liu, Marcus Andersson, Acta
Mater., 2004, vol. 52, pp. 1023-1037.
18. T.A. Kop, J. Sietsma, S. van der Zwaag: Mater. Sci. Tech., 2001, vol. 17, pp. 1569–74.
19. R.A. Jaramillo, M.T. Lusk, M.C. Mataya: Acta Mater., 2004, vol. 52, 851–858.
20. Y-G. Cho, D-W. Suh, J.K. Lee, H.N. Han: Scripta Mater., 2011, vol. 65, 569–572
21. C. García de Andrés, F.G. Caballero, C. Capdevila, L.F. Álvarez: Mater. Char., 2002, vol.
48, pp. 101-111.
22. D. San Martín, P. E. J. Rivera Diaz del Castillo, E. Peekstok, S. van der Zwaag: Mater.
Char., 2007, vol. 58, pp. 455-460.
23. Y. Kawaguchi, S. Yamanaka: J Alloy. Compd., 2002, vol. 336, pp. 301-314.
24. C. Celada, I. Toda-Caraballo, B. Kim, D. San Martín: Mater. Char., 2013, vol. 84, pp.
142-152.
25. A.F. Padilha, R.L. Plaut and P.R. Rios: ISIJ Int., 2003, vol. 43, pp. 135-143.
26. R. Kapoor, L. Kumar, I.S. Batra: Mater. Sci. Eng. A, 2003, vol. 352, pp. 318-324.
27. D. San Martin, P.E.J. Rivera-Diaz-del-Castillo and C. Garcia de Andres: Scr. Mater., 2008,
vol. 58, pp. 926-929.
28. C.N. Hsiao, C.S. Chiou, J.R. Yang: Mater. Chem. Phys., 2002, 74, pp. 134–142.
29. F. Christien, M.T.F. Telling, K.S. Knight: Mater. Char., 2013, vol. 82, pp. 5057.
30. M. Huang, A. Pineau, O. Bouaziz, T-D. Vu: Mater. Sci. Eng. A, 2012, vol. 541, pp. 196-
198.
31. H.N. Han, J.K. Lee, S-J. Kim: Mater. Lett., 2005, vol. 59, pp. 158-161.
32. H. Azizi-Alizamini, M. Militzer, W. Poole: Metall. Mater. Trans. A, 2011, pp. 1544-1557.
33. T. de Cock, C. Capdevila, F.G. Caballero, C. García de Andrés: Scripta Mater., 2006, vol.
54, pp. 949-954.

24
34. A. Bojack, L. Zhao, P.F. Morris, J. Sietsma: Mater. Char., 2012, vol. 71, pp. 77-86.
35. N. Lavaire, J. Merlin, V. Sardoy: Scripta Mater., 2001, vol. 44, pp. 553-559.
36. F.G. Caballero, A. Garcia-Junceda, C. Capdevila, C. García de Andrés: Scr. Mater., 2005,
vol. 52, pp. 501-505.
37. F.G. Caballero, C. Capdevila, L.F. Álvarez, C. García de Andrés: Scripta Mater., 2004, vol.
50, pp. 1061-1066.
38. J.P. Ferrer, T. De Cock, C. Capdevila, F.G. Caballero, C. García de Andrés: Acta Mater.,
2007, vol. 55, pp. 2075-2083.
39. C. Capdevila, M.K. Miller, J. Chao, “Phase separation kinetics in a Fe–Cr–Al alloy”, Acta
Mater., 2012, vol. 60, pp. 4673-4684.
40. R. Schnitzer, G. A. Zickler, E. Lach, H. Clemens, S. Zinner, T. Lippmann, H. Leitner:
Mater. Sci. Eng. A, 2010, vol. 527, pp. 2065-2070.
41. R. Schnitzer, S. Zinner and H. Leitner: Scr. Mater., 2010, vol. 62, pp. 286-289.
42. K. Datta, R. Delhez, P. M. Bronsveld, J. Beyer, H. J. M. Geijselaers and J. Post: Acta
Mater., 2009, vol. 57, pp. 3321- 3326.
43. T. Meinders, E. S. Perdahcioglu, M. van Riel, H.H. Wisselink: Int. J. Mach. Tool.
Manufact., 2008, vol. 48, pp. 485-498.
44. D. Raabe, D. Ponge, O. Dmitrieva and B. Sander: Scr. Mater., 2009, vol. 60, pp. 1141-
1144.

TABLES
Table 1:
Table I. Chemical composition (wt. %) of the steel with Fe to balance.
Cr Ni Mo Cu Ti Al Si Mn C+N
12.00 8.87 4.05 1.91 1.35 0.39 0.36 0.33 <0.01
Table 2:
Table II. Comparison between mechanical properties obtained for the same steel after an
industrial annealing and the continuous heating treatment studied in this work.
YS (MPa) UTS (MPa) εun (%) εt (%)
K. Datta et al. [42] 250 950 20 – Current work 810±8 1163±1 19.7±0.3 25.5±0.1

1
FIGURES
Figure 1:
Figure 1. Optical micrograph (a) and secondary electron SEM micrograph (b) of the cross
section of the as-received microstructure after etching with Lichtenegger-Blöch color
etching solution at 333 K (60 ºC) for 30 s. In (a) the white dash lines delineate the area that
has been analyzed by EPMA.

2
Figure 2:
Figure 2. Two-dimensional EPMA maps recorded over an area (delimited with white dash lines
in Fig. 1(a)) of the cross section of the as-received material for the following alloying elements:
(a) Ni; (b) Cu; (c) Ti and (d) Cr.

3
Figure 3:
Figure 3. Dilatometry curve monitored during continuous heating up to 1173 K (900 ºC) at a
heating rate of 0.1 K/s. Dotted lines are the extrapolated austenitic length change (ΔLγe) and
martensitic length change (ΔLα’e). The location of AS and AF temperatures, as estimated by
dilatometry, have been highlighted.
4
Figure 4:
Figure 4. (a) Saturation magnetization curves for the as-received and heat-treated samples after
heating to different temperatures within range 773-1123 K (500-850 ºC); (b) evolution of
austenite volume fraction with the temperature estimated from the magnetization curves and
dilatometric curve (Fig. 3). Dotted line was drawn to set the initial state at 0.03, as is the sum of
the fχ and fγ+δ in the as-received material. Dashed line that connects the experimental points was
drawn as a guide to the eye.
5
Figure 5:
Figure 5. SEM micrographs taken at different stages within the range of temperatures where
the reaustenitization process takes place: (a) 790 K (517 ºC); (b) 873 K (600 ºC); (c) 923 K
(650 ºC); (d) 953 K (680 ºC); (e) 1043 K (770 ºC); (f) 1098 K (825 ºC). Phases present in
the microstructure have been pointed out by arrows.
6
Figure 6:
Figure 6. Evolution of the micro-hardness Vickers (a) and thermoelectric power (b) with the
heating temperature during the martensite to austenite transformation. Dash lines in (a) have
been drawn as a guide to the eye.

7
Figure 7:
Figure 7. (a) Stress-plastic strain curves of the as-received state and samples treated at different
temperatures and hence with different volume fractions of austenite (fγ); (b) Evolution of different
mechanical properties estimated from (a). In this figure, YS=yield strength, UTS=ultimate tensile
strength, εun=uniform elongation and εt=total elongation. Continuous lines have been drawn as
guide to the eye.

8
Figure 8:
Figure 8. Comparison of the temperature evolution of the austenite volume fraction estimated
using three different techniques: hardness-Vickers (HV), magnetization measurements (Magn.
Meas.) and thermoelectric power measurements (TEP).