
Welcome to SAS New South Wales User Group Q2 2015 Groups...Welcome to SAS New South Wales User Group...
88
Welcome to SAS New South Wales User Group Q2 2015 Committee: Scott Bass Peter Stagg Bhupendra Pant Patrick Cuba Chris Latham James Enoch (SAS) Marna Smit (SAS)
Transcript of Welcome to SAS New South Wales User Group Q2 2015 Groups...Welcome to SAS New South Wales User Group...

Welcome toSAS New South Wales User Group
Q2 2015Committee:Scott Bass
Peter StaggBhupendra Pant
Patrick CubaChris Latham
James Enoch (SAS)Marna Smit (SAS)

5:15pm Registration
5:30pm Welcome & Introduction James Enoch, SAS
5:35pm Big Data Analytics – The Future of analysisCarmen Gallagher - SAS
5:55pm How to get Money from StrangersKim Gill & Dr. Con Menictas
6:15pm Dynamic Reporting Systems using ODS & ExcelPeter Stagg – Decision Informatics
6:35pm Wrap up and Lucky draw
6:50pm Drinks
8:00pm Event Concludes

Welcome & Introduction James Enoch, SAS

Tips & Tricks From the Committee Scott Bass, Senior Information Analyst, Bupa

Big Data Analytics – The Future of analysisCarmen Gallagher - SAS

Copyright © 2015, SAS Institute Inc. All rights reserved.
SNUG meeting –Big Data AnalyticsCarmen GallagherHead of Information Management & Big DataSAS Australia/New Zealand

Copyright © 2014, SAS Institute Inc. All rights reserved.Copyright © 2012, SAS Institute Inc. All rights reserved.
Big Data Analytics WHERE WE ARE NOW
2005 2007 2009 2011 2013
ANALYTICSBIG DATA HADOOPLots of data Processing
PowerAccurate /Decisions

WHO CARES?
LG R‐S73CT refrigerator 2001. 730 liter, 15.1 inch full color TFT‐LD with touch screen, internet enabled
2000 LG introduces it’s Internet Enabled Refrigerator
2015 Amazon introduces “Amazon Dash Button”
BIG DATA
Place it. Press it. Get it.When you're running low, simply press Dash Button, and Amazon quickly delivers so you can skip the last‐minute trip to the store.
Copyright © 2015, SAS Institute Inc. All rights reserved.

BIG DATA IT’S ALL TALK OVER HERE
By 2017, 90 percent of all Samsung hardware will be Internet-connected. Five years from now, every
Samsung product will be part of the Internet of things, no matter whether it’s an air
purifier or a vacuum cleaner.
Samsung CEO and president BK Yoon, Jan 2015
Copyright © 2015, SAS Institute Inc. All r ights reserved.

BIG DATA WHAT DOES IT MEAN FOR ME
Copyright © 2015, SAS Institute Inc. All r ights reserved.
SAS as you know it isn’t going anywhere
The way your company uses data to report won’t change any time soon
You still use all the same proceedures they’re being re-written to also work in Hadoop
Co-existence of two different types of architecture to enable your organisation

Copyr igh t © 2014 , SAS Ins t i t u te I nc . A l l r i gh t s reserved .
Hadoop will soon become a replacement complement to: Business Intelligence; Data Warehousing; Data Integration; Analytics.
SOURCE: Integrating Hadoop with BI and DW - TDWI Best Practices Report
WHY HADOOP?
HADOOP IN PRODUCTION:
10%
28%
13%10%
12%
27%
YES
< 12 MONTHS
< 24 MONTHS
< 36 MONTHS
3+YEARS
NEVER

Copyr igh t © 2014 , SAS Ins t i t u te I nc . A l l r i gh t s reserved .
SAS and Hadoop – The big Picture
SAS and Hadoop are made for each other
SAS and Hadoop will help you answer bigger questions
SAS is making it easy for our users to leverage Hadoop

Copyr igh t © 2014 , SAS Ins t i t u te I nc . A l l r i gh t s reserved .
What is Hadoop ? An Apache Software Foundation project
• Open-source• Origins in early 2000s with contributions from Google, Yahoo! and
Framework/Ecosystem of tools for processing Big Data1. Hadoop Common: The common utilities that support the other Hadoop
subprojects2. Hadoop Distributed File System (HDFS): A distributed file system that
provides high –througput access to application data3. Hadoop MapReduce/YARN: A software framework for distributed
processing of large data sets on compute clusters

Copyr igh t © 2014 , SAS Ins t i t u te I nc . A l l r i gh t s reserved .
Idea #1 - HDFS. Never forgets!
Head Node Node 1 Node 2 Node 3 Node 4…MYFILE.TXT..block1 -> block1copy1..block2 -> block2copy2..block3 -> block3copy3

Copyr igh t © 2014 , SAS Ins t i t u te I nc . A l l r i gh t s reserved .
Idea #1 - HDFS. Never forgets!
Head Node Node 1 Node 2 Node 3 Node 4…MYFILE.TXT..block1 -> block1copy1 block1copy2..block2 -> block2copy2 block2copy2..block3 -> block3copy2 block3copy3

Copyr igh t © 2014 , SAS Ins t i t u te I nc . A l l r i gh t s reserved .
Idea #1 - HDFS. Never forgets!
Head Node Node 1 Node 2 Node 3 Node 4…MYFILE.TXT..block1 -> block1copy1 block1copy2..block2 -> block2copy2 block2copy2..block3 -> block3copy2 block3copy3

Copyr igh t © 2014 , SAS Ins t i t u te I nc . A l l r i gh t s reserved .
Idea #2 - MapReduce
We Want the Minimum Age in the Room
Each Row in the audience is a data node
I’ll be the coordinator• From outside to center, accumulate MIN• Sweep from back to front. Youngest Advances

Copyr igh t © 2014 , SAS Ins t i t u te I nc . A l l r i gh t s reserved .
SAS® Within the HADOOP ECOSYSTEM
Next-Gen SAS® User
User Interface
Metadata
Data Access
DataProcessing
FileSystem
SAS® User
MPI Based
SAS® LASR™ Analytic
Server
SAS® High-Performance
Analytic Procedures
HDFS
Base SAS & SAS/ACCESS® to Hadoop™
SAS Metadata
Pig
Map Reduce/YARN
In-Memory Data Access
SAS® Visual Analytics
SAS®
Enterprise Miner™
SAS® Data Integration
SAS® Data Loader for Hadoop
HiveSAS Embedded
Process
SAS® In-Memory Statistics for
Hadoop

Copyr igh t © 2014 , SAS Ins t i t u te I nc . A l l r i gh t s reserved .
DATA TO DECISION LIFECYCLE on Hadoop
TEXT
MANAGE DATA
EXPLOR
E
DATA
DEVELOP MODELS
DEP
LOY
&
MO
NIT
OR
• SAS/ACCESS (Hadoop/Impala) • SAS Data Management• SAS Federation Server
• SAS Data Quality Accelerator for Hadoop
• SAS Code Accelerator for Hadoop• SAS Data Loader for Hadoop • SAS Visual Analytics
• SAS In-memory Statistics for Hadoop
• SAS HPA Products• SAS Visual Statistics
• SAS In-memory Statistics for Hadoop
• Model Manager
• SAS Scoring Accelerator for Hadoop

Copyr igh t © 2012 , SAS Ins t i t u te I nc . A l l r i gh t s reserved .
MANAGE DATA READ/WRITE TO HDFS
/* Create directory on HDFS*/ filename cfg "C:\Sample_Data\hadoop_config.xml";proc hadoop options=cfg username="hadoop" password="hadoop";
hdfs mkdir="/user/hadoop/testfolder" ;run;/* Copy file from local SAS to HDFS*/filename cfg "C:\Sample_Data\hadoop_config.xml";proc hadoop options=cfg username="hadoop" password="hadoop";
hdfs copyfromlocal="C:\Sample_data\dept.txt"out="/user/hadoop/testfolder/";run;/* Copy file from HDFS to local SAS */filename cfg "C:\Sample_Data\hadoop_config.xml";proc hadoop options=cfg username="hadoop" password="hadoop";
hdfs copytolocal="/user/hadoop/testfolder" out="C:\Sample_data\" ;run;

Copyr igh t © 2012 , SAS Ins t i t u te I nc . A l l r i gh t s reserved .
MANAGE DATA MAPREDUCE
/*Invoke MapReduce Word Count program*/filename cfg "C:\Sample_Data\hadoop_config.xml";proc hadoop options=cfg username="hadoop" password="hadoop" verbose; hdfs delete="/user/hadoop/output_MR1";
mapreduce input="/user/hadoop/gutenberg“ output="/user/hadoop/output_MR1"jar="C:\Sample_data\hadoop-examples-2.0.0-mr1-cdh4.1.2.jar"outputkey="org.apache.hadoop.io.Text"outputvalue="org.apache.hadoop.io.IntWritable"reduce="org.apache.hadoop.examples.WordCount$IntSumReducer"combine="org.apache.hadoop.examples.WordCount$IntSumReducer"map="org.apache.hadoop.examples.WordCount$TokenizerMapper"reducetasks=0;
run;

Copyr igh t © 2012 , SAS Ins t i t u te I nc . A l l r i gh t s reserved .
MANAGE DATA SAS/ACCESS
• Base SAS Procedures executed in-database for Hadoop• FREQ, REPORT, SORT, SUMMARY/MEANS, TABULATE
• Supported Hadoop distributions & combinations*• Cloudera CDH 5.0 running Hive/Hive2• Hortonworks HDP 2.0 running HiveServer2• IBM InfoSphere BigInsights 2.1 running Hive• MapR M5 2.0.1 running Hive• Pivotal/Greenplum HD running Hive• Pivotal/Greenplum MR 2.0.1 running Hive

Copyr igh t © 2012 , SAS Ins t i t u te I nc . A l l r i gh t s reserved .
MANAGE DATA SAS/ACCESSLIBNAME cdh_hdp HADOOP PORT=10000 SERVER=sascldserv02 user=hadoop password=hadoop ;/* Create new table*/proc sql;connect to hadoop(PORT=10000 SERVER=sascldserv02 USER=hadoop PASSWORD="hadoop"); exec( create table cars_prc (make string, model string, msrp double) ) byhadoop; quit;
/* Copy from another table*/proc sql;
insert into cdh_hdp.cars_prc select make, model, msrp from sashelp.cars ;
quit;/* List contents*/proc sql; select * from cdh_hdp.cars_prc; quit;

Copyr igh t © 2012 , SAS Ins t i t u te I nc . A l l r i gh t s reserved .
MODEL DEVELOPMENT SAS HIGH PERFORMANCE ANALYTICS
High-Performance Text Mining
• HPTMINE
• HPTMSCORE
High-Performance Data Mining1
• HPREDUCE
• HPNEURAL
• HPFOREST
• HP4SCORE
• HPDECIDE
• HPCLUS
• HPSVM
• HPBNET
• HPTSDR
High-Performance Econometrics
• HPCOUNTREG
• HPSEVERITY
• HPQLIM
• HPPANEL
• HPCOPULA
• HPCDM
High-Performance Optimization
• OPTLSO
• Select features in
• OPTMILP
• OPTLP
• OPTMODEL
• OPTGRAPH
High-Performance Statistics
• HPLOGISTIC
• HPREG
• HPLMIXED
• HPNLMOD
• HPSPLIT
• HPGENSELECT
• HPFMM
• HPCANDISC
• HPPRINCOMP
• HPPLS
• HPQUANTSELECT
1Includes SAS High-Performance Statistics
Common Set (HPDS2, HP DMDB, HPSAMPLE, HPSUMMARY, HPIMPUTE, HPBIN, HPCORR)#

Copyr igh t © 2012 , SAS Ins t i t u te I nc . A l l r i gh t s reserved .
DEPLOY & MONITOR SAS SCORING ACCELERATOR FOR HADOOP
• Publish SAS® Enterprise Miner™ models or SAS/STAT linear models inside the Hadoop
• Fully integrated with SAS® Model Manager to streamline registration, validation and performance monitoring
• Reduced data movement and improve data governance by streamlining model deployment processes within Hadoop

Copyr igh t © 2012 , SAS Ins t i t u te I nc . A l l r i gh t s reserved .
FINDING THE VALUE BIG DATA INNOVATION LAB
SAS BIG DATA INNOVATION LAB• 12 WEEKS• YOUR SCENARIO• YOUR DATA• OUR SOFTWARE • INFRASTRUCTURE (CLOUD/HARDWARE) INCLUDED

Copyr igh t © 2012 , SAS Ins t i t u te I nc . A l l r i gh t s reserved .
BIG DATA BIG PLAY OFFERING13 MAY 2015

Copyr igh t © 2013 , SAS Ins t i t u te I nc . A l l r i gh t s reserved .
THANK YOU!4 short years and…
• Hadoop is on the opening session, 2 Hadoop leaders’s share the panel discussion at Exec Track
• 50% of the people attending an executive conference talk have an active Hadoop project
• SAS has built a family of applications that take full advantage of Hadoop as an analytics platform
For more Information: http://www.sas.com/hadoop

Copyr igh t © 2012 , SAS Ins t i t u te I nc . A l l r i gh t s reserved .
@datalysis
carmengallagher Thank You!
http://www.sas.com/au/sashadoop

How to get Money from StrangersKim Gill & Dr. Con Menictas

“How to Get Money From Strangers!”
Dr Con MenictasKim Gill
Mark Grosser

The Charity Problem
1. How do we get people to give?
2. How do we keep them giving?
3. How do we make them advocates to our cause?


Individual Giving
Direct Mail Appeals
Online donations
Telethon responders
Peer to Peer fundraising
Cash DonorsCash Donors
Monthly support
Regular GivingRegular Giving

Supporter Engagement Strategies
F2F Fundraisers
Telemarketing
Online
PillarsPillars
Welcome Packs
Milestone Comms
Calls to Upgrade
Retention Strategies
ToolsTools

Challenges
Low level analytics and data
Only transactional data (RP data)
Might know the what but not the why
Hardware not a priority
Limited budget
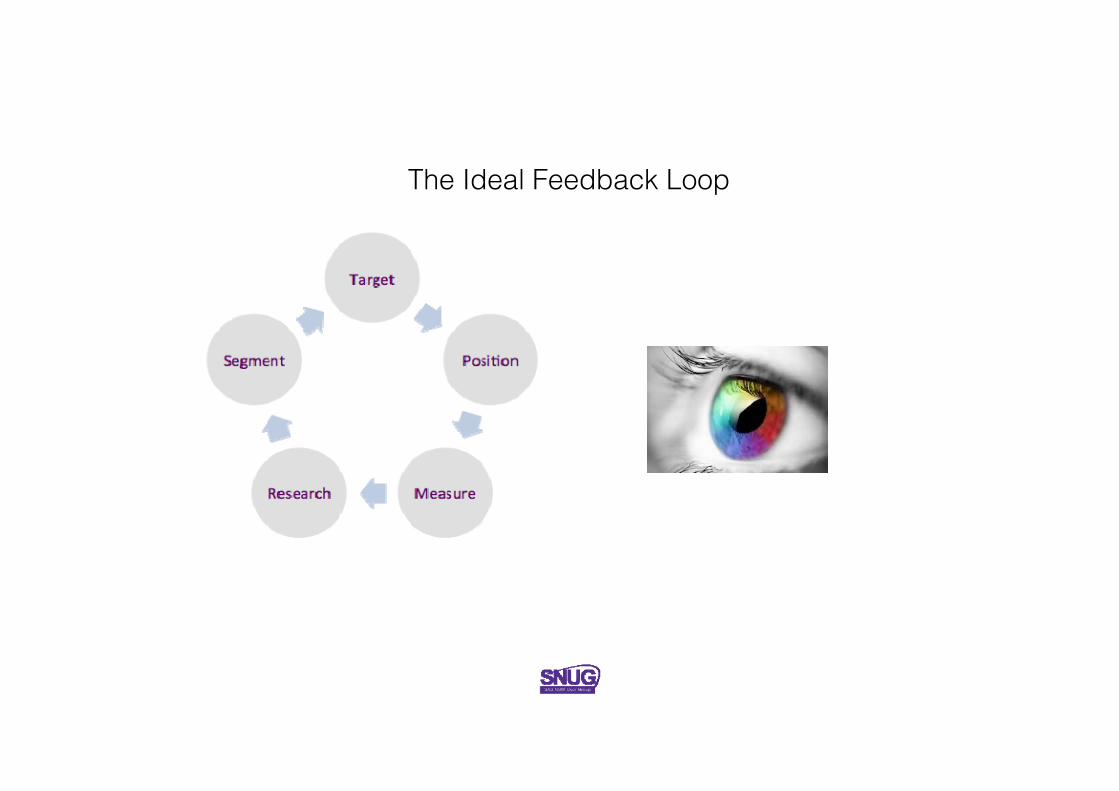
The Ideal Feedback Loop

What Can Be An Ideal Starting Point?
is the utility (or net benefit or well-being) a person obtains from choosing
alternative . The behavior of the person is utility-maximizing i.e., person
chooses the alternative that provides the highest utility.

Behavioural Economics and Experimental Psychology
The Psychology of Judgment and Decision Making
Daniel Kahneman
Awarded the 2002 Nobel Memorial Prize in Economics
for his work on Discrete Choice Modelling

Humans have problems rating or ranking objects.
Humans utility maximise so asking them what they like the most fails.
Humans want all the benefits and none of the costs.
Choice modelling delve deeper into the mechanics of human choice.
Choice modelling forces trade-offs between products or services
Within products and services forces attributes and levels to compete.
What is Choice Modelling?

Choice experiments vary the characteristics (levels) of each brand factor (attribute).
We use a systematic approach known as optimal experimental designs, which are orthogonal and efficient.
The efficiency of the design ensures that the standard errors of the parameter estimates are going to be minimized.
Experimental Designs and Orthogonality

Decision Strategies

Decision Strategy Properties

Decision Assumptions

Choice Complexity Aspects

Advantages of Discrete Choice Experiments
Force respondents to consider trade-off between alternatives.
Estimate the level of customer demand for alternative products.
Enable implicit prices to be estimable for factors and their levels.
Simulate competitive, retaliatory and strategic responses.

Disadvantages of Discrete Choice Experiments
Complex choice experiments may occasion cognitive computational burden.
Respondents might be unable to articulate attitudes toward new concepts.
They may feel forced to think about issues they would otherwise not think of.
Poorly designed studies may over-value emotional or preference variables.
Choice modelling does not take into account the number items per purchase.

The Problem for Today
How can we use choice experimentation and modelling to overcome the charity dilemma?

Is there a coarse preference elicitation for Charity?
Should we consider an overall likelihood of donation?
Is it feasible to assume minimal heterogeneity?
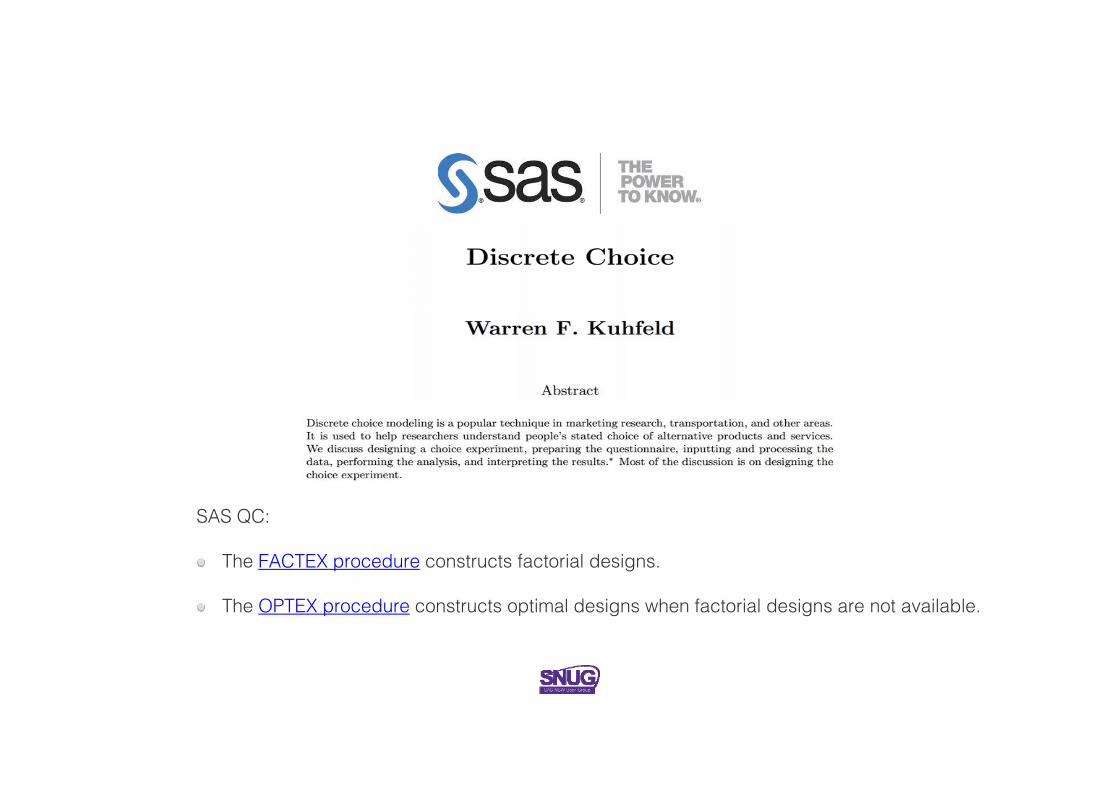
SAS QC:
The FACTEX procedure constructs factorial designs.
The OPTEX procedure constructs optimal designs when factorial designs are not available.
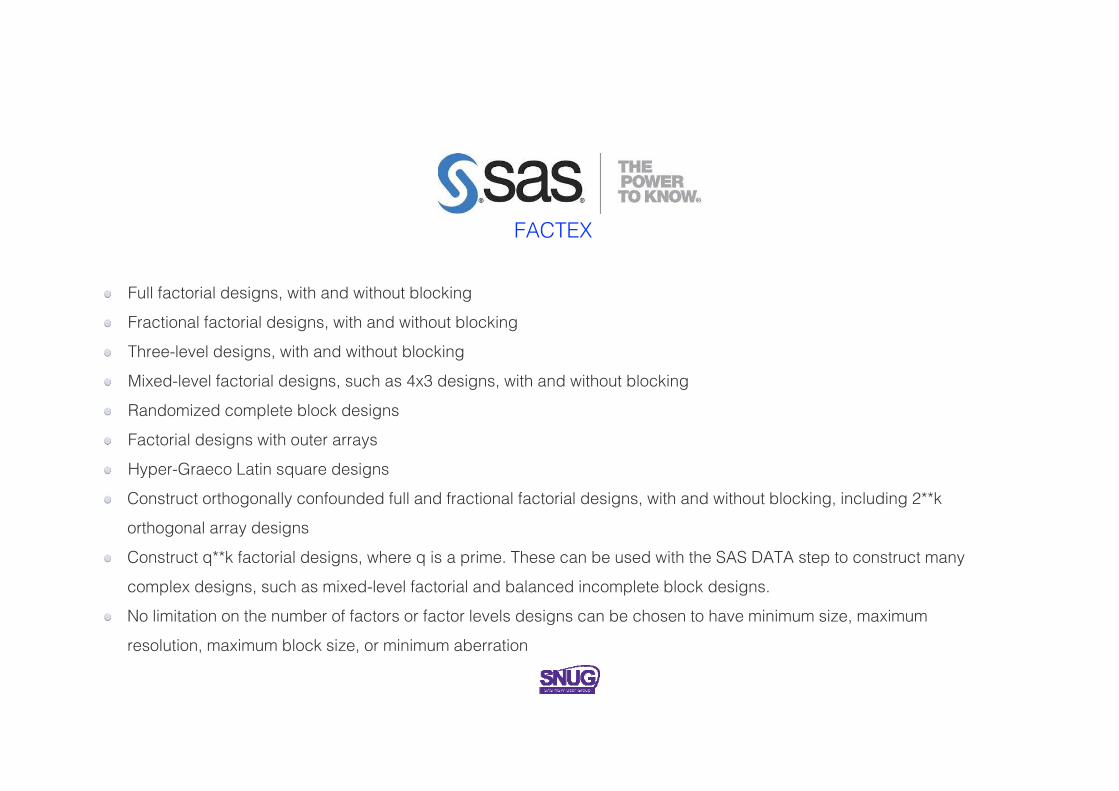
FACTEX
Full factorial designs, with and without blocking
Fractional factorial designs, with and without blocking
Three-level designs, with and without blocking
Mixed-level factorial designs, such as 4x3 designs, with and without blocking
Randomized complete block designs
Factorial designs with outer arrays
Hyper-Graeco Latin square designs
Construct orthogonally confounded full and fractional factorial designs, with and without blocking, including 2**k
orthogonal array designs
Construct q**k factorial designs, where q is a prime. These can be used with the SAS DATA step to construct many
complex designs, such as mixed-level factorial and balanced incomplete block designs.
No limitation on the number of factors or factor levels designs can be chosen to have minimum size, maximum
resolution, maximum block size, or minimum aberration

OPTEX
Searches for D-optimal or A-optimal designs
Intended for situations in which a standard design is not appropriate
Add points to an existing design
Augment preexisting covariates
Evaluate an existing design
Improve an existing design
Various search algorithms and selection criteria are available
Flexible GLM-type models are available incomplete block designs.
No limitation on the number of factors or factor levels
Designs can be chosen to have minimum size, maximum resolution, maximum block size, or
minimum aberration

TYPES OF OPTIMALITY
A-optimality: minimizes the average variance of the estimates of the regression coefficients.
C-optimality: minimizes the variance of a best linear unbiased estimator of a predetermined linear
combination of model parameters.
D-optimality (determinant): maximizes the differential Shannon information content of the parameter
estimates.
E-optimality (eigenvalue): maximizes the minimum eigenvalue of the information matrix.
T-optimality (trace): maximizes the trace of the information matrix.
G-optimality: minimizes the maximum variance of the predicted values.
I-optimality (integrated): minimizes the average prediction variance over the design space.
V-optimality (variance): minimizes the average prediction variance over a set of m specific points.

THE OPTEX PROCEDURE
%mktdes(factors=x1-x2=2 x3-x5=3, n=18)
Design Number D-Efficiency A-Efficiency G-EfficiencyAve of the Predicted
SEs
1 99.0008 97.9412 93.5502 0.7145
2 99.0008 97.9412 88.6512 0.7145
3 98.6998 97.2973 94.8683 0.7169
4 98.6998 97.2973 94.8683 0.7169
5 98.6998 97.2973 94.8683 0.7169

Attribute and Level Matrix

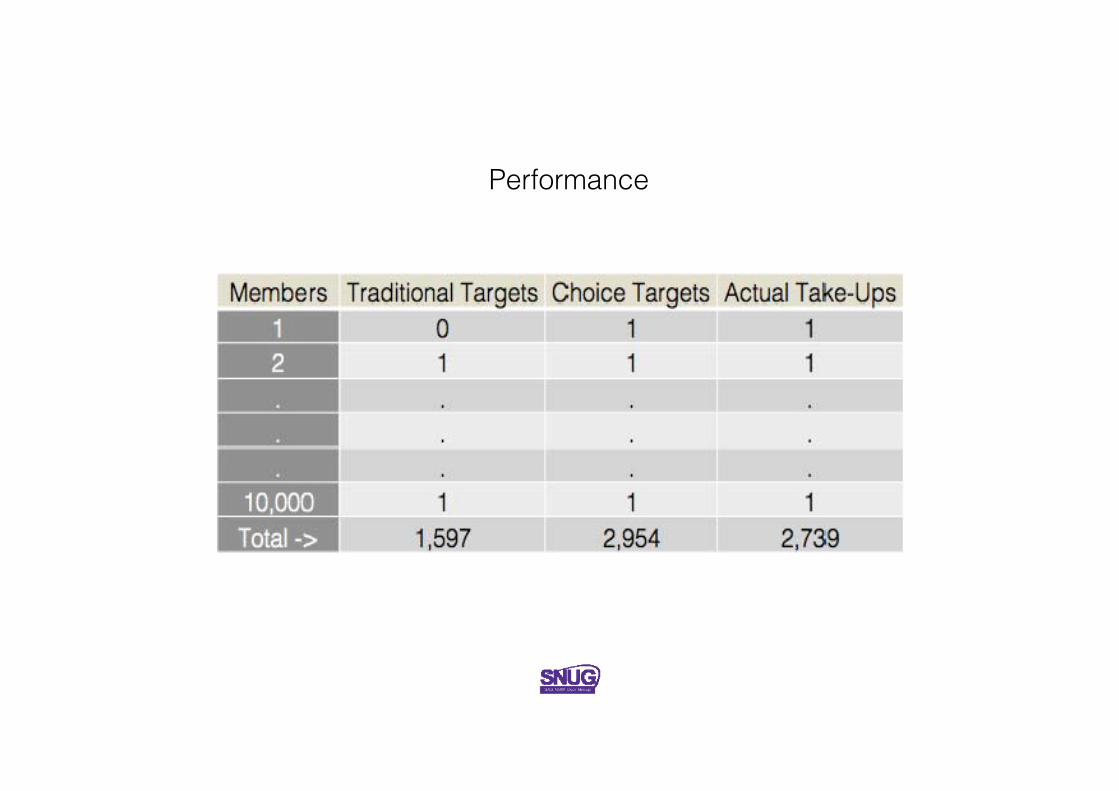
Performance

6:15pm Dynamic Reporting Systems using ODS & Excel
Peter Stagg – Decision Informatics

60
Dynamic Reporting Systems Using ODS and Excel
Peter Stagg60

61
Discussion
• Requirements• What we have• Data• Dynamic Macro Code• Excel• Output

62
Requirement• Quality Assurance (QA) over 400 separate
sources of data from 6 states and 2 territories• Conduct activity comparisons with previous
year’s data• Ensure consistency of the summarised data.• Individual reports for each data source• Written to be used in future QA episodes• Fast turnaround

63
Requirement
• Used in all sites across the county• Allows editing and responses to be added• Multiple page output

Rules Out
• PDF – Too many pages– No response entry capability
• HTML/Web Reports– No response capability– Administration overheads
64

EXCELSo that leaves
65

66
Data
• Values in the data provided in inconsistent datasets between years– Each year new measures or changes in
measures• Site data amalgamated into one set of state
data (2 datasets per state)• 3 million to 780 million records in size
– Raw format.

67
Data
• Datasets need to be summarised before comparison for the report

68
Current Report is wide and shallowKeeps on going

SO HOW DO WE MAKE IT READABLE?
Narrow and deep
69

WHAT DO WE NEED TO DO?
70

Key Points
• Dynamic macro code • Transpose data• Create warning flags in data• Insert formulas into the sheet• Write out as Proc Report

72
Dynamic Macro Code
• Set up macro vars at beginning of process• Create dynamic formats• Create warning flags• No changes required in macro code for
each round
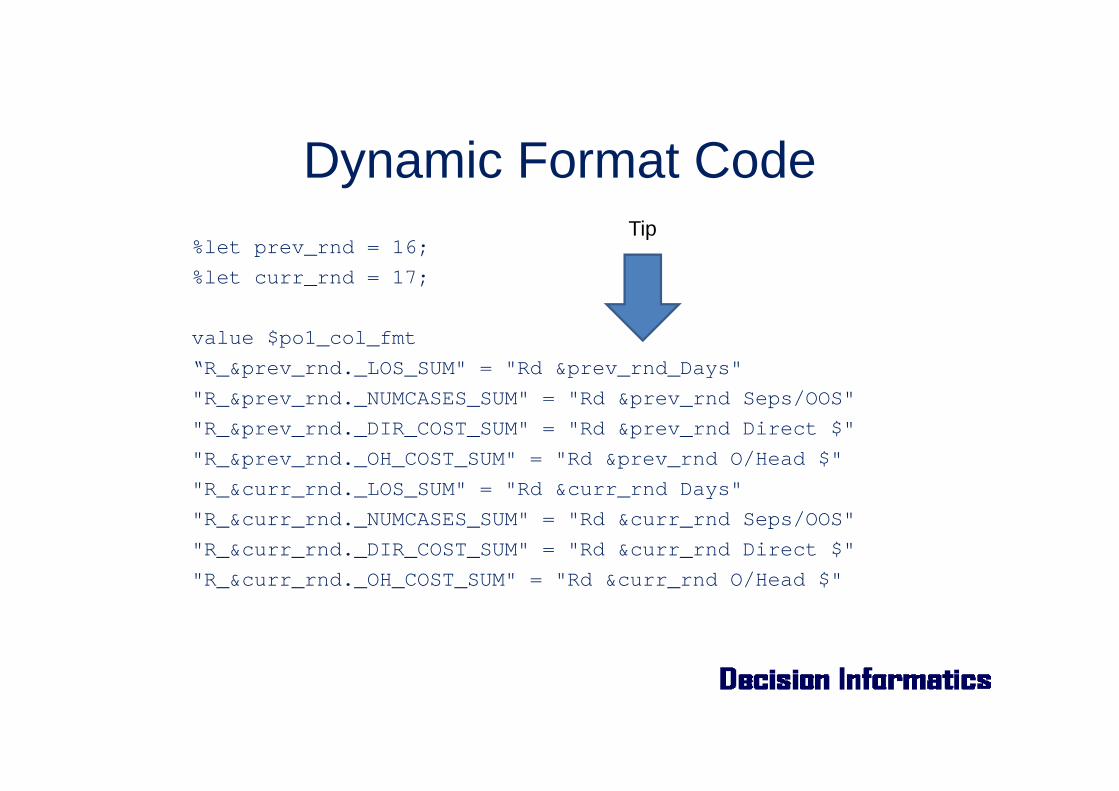
Dynamic Format Code%let prev_rnd = 16;%let curr_rnd = 17;
value $po1_col_fmt“R_&prev_rnd._LOS_SUM" = "Rd &prev_rnd_Days""R_&prev_rnd._NUMCASES_SUM" = "Rd &prev_rnd Seps/OOS""R_&prev_rnd._DIR_COST_SUM" = "Rd &prev_rnd Direct $""R_&prev_rnd._OH_COST_SUM" = "Rd &prev_rnd O/Head $""R_&curr_rnd._LOS_SUM" = "Rd &curr_rnd Days""R_&curr_rnd._NUMCASES_SUM" = "Rd &curr_rnd Seps/OOS""R_&curr_rnd._DIR_COST_SUM" = "Rd &curr_rnd Direct $""R_&curr_rnd._OH_COST_SUM" = "Rd &curr_rnd O/Head $"
Tip

Excel Formulas Data dsname;Set dsname2;order = put(tr_col,$po1_order_fmt.);if order =0 then
total = 'Total';else if order = 1 then
total = ' ';else if order in (1,2,3,4,5,6,9,10,11,12,13) then
total = '=SUM(RC[-19]:RC[-1])-RC[-9]';else if order in (7) then
total = '=R[-1]C/R[-5]C';else if order in (8) then
total = '=R[-2]C/R[-5]C';
Tip
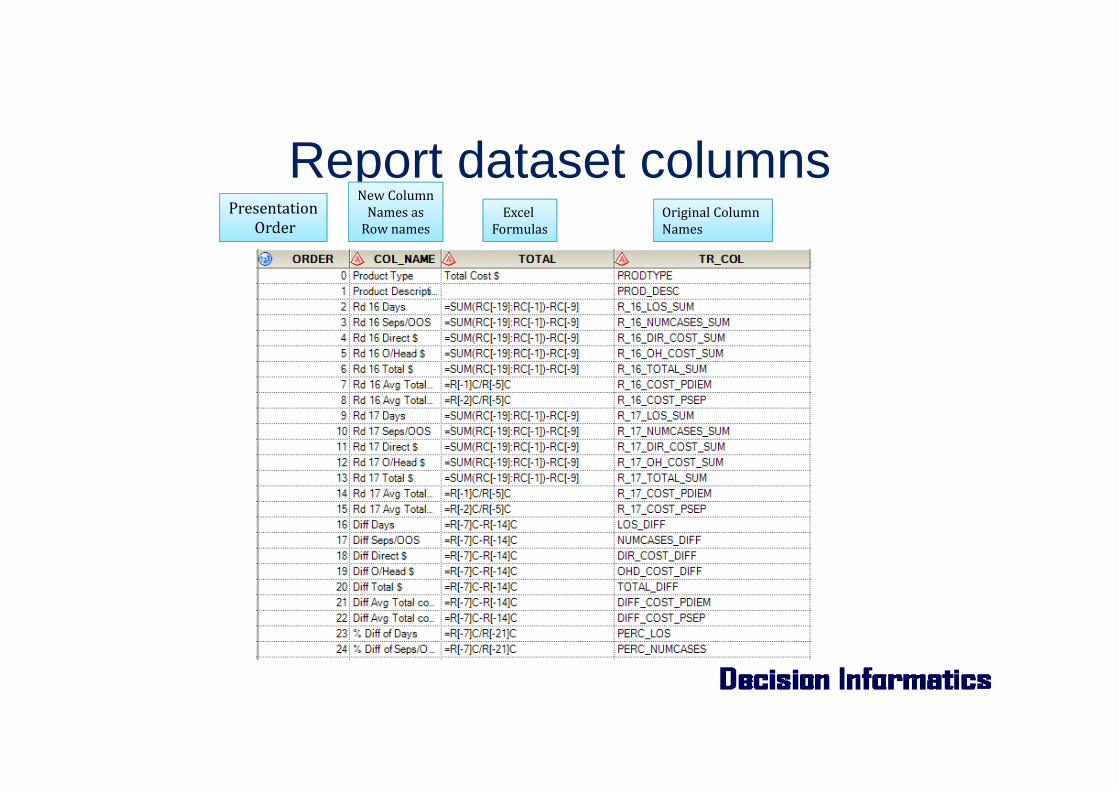
Report dataset columnsExcel
FormulasOriginalColumnNames
PresentationOrder
NewColumnNamesasRownames

76
ODS to Excel
• Many ways to create spreadsheet via ODS
• Chose ODS tagsets.ExcelXP– Allows formatting– Traffic lighting– Sheet presentation options.

77
ODS Excel
• Set up file output and first sheet
• Options
• New worksheet• Options
• Close workbook
• ODS tagsets.excelXP file = “directory\filename.xls”
• Sheetname• Filter
• ODS tagsets.excelXP [no file dest]
• Sheetname• Filter
• ODS tagsets.excelXP close
77

ODS Excel statementsODS TAGSETS.EXCELXP FILE="&_pathoutputfile./report_%trim(&value)_%trim(&rundate)_.xls" style=meadow
OPTIONS(EMBEDDED_TITLES='YES‘FROZEN_HEADERS= "&frozen_head" /* row number */ EMBEDDED_footnotes='YES' AUTOFIT_HEIGHT='YES' AUTOFILTER='YES' /*filter to be showing */SHEET_name='summary' ) ; < Titles ><SAS Statements>ODS tagsets.excelXP close

79
Proc report
• Usedtooutputinastandardlayout.• FormatswrittentomatchExcelstyle
• tagattr='format:#,##0’• tagattr='format:###.00%‘• tagattr='format:#,##0.00'
Tip

Output codeODS TAGSETS.EXCELXP NOTE if more than one sheet output the filename is not needed after the first statement
FILE="&_pathoutputfile./report_%trim(&value)_%trim(&rundate)_.xls" style=meadowOPTIONS(EMBEDDED_TITLES='YES' FROZEN_HEADERS= "&frozen_head" EMBEDDED_footnotes='YES' AUTOFIT_HEIGHT='YES' AUTOFILTER='NO' SHEET_name='P01' ) ;
title1 j=CENTER c=black height=4 bold ‘Report Title' ;
proc report data= main_p01_report split='*' noheader;
where filter_variable= &Macro_Value;column order COL_NAME &prodList total;
define order /order noprint ;define col_name /DISPLAY style = [ background=lightgrey TEXTALIGN = LEFT font_weight = bold];%do i = 1 %to &prod_count;
define %sysfunc(scan(&prodlist , &i, ' ')) /DISPLAY width = 10; /* column names for Products */%end;
define total /display "Total Cost $"; /* Excel Formulas */
compute col_name;
CALL DEFINE (_COL_, "STYLE","style = [ background=lightgrey TEXTALIGN = C font_weight = bold]");if col_name = 'Comments' then CALL DEFINE (_ROW_, "STYLE","style = [ background=$comm.]");
if order in (0,1) then CALL DEFINE (_ROW_, "STYLE","style = [ background=lightgrey TEXTALIGN = C font_weight = bold]");else if order in (2,3,4,5,6,7,8,9,10,11,12,13,14,15,16,17,18,19,20,21,22) then CALL DEFINE (_ROW_, 'STYLE',"style =[tagattr='format:#,##0' TEXTALIGN = R ]");else if order in (23,24,25,26,27,28,29) then CALL DEFINE (_ROW_, 'STYLE',"style=[tagattr='format:###.00%' TEXTALIGN = R ]");endcompute;
footnote1 j=left c=black height=1 " Footnote";

Output code (Header)ODS TAGSETS.EXCELXP FILE="&_pathoutputfile./report_%trim(&value)_%trim(&rundate)_.xls" style=meadowOPTIONS(EMBEDDED_TITLES='YES' FROZEN_HEADERS= "&frozen_head" EMBEDDED_footnotes='YES‘AUTOFIT_HEIGHT='YES' AUTOFILTER='NO' SHEET_name='P01' ) ; title1 j=CENTER c=black height=4 bold Report Title' ;

Output code (Body)
proc report data= main_p01_report split='*' noheader;where filter_variable= &Macro_Value;
column order COL_NAME &prodList total;
define order /order noprint ;define col_name /DISPLAY style = [ background=lightgreyTEXTALIGN = LEFT font_weight = bold];/* This is the Product List */%do i = 1 %to &prod_count;define %sysfunc(scan(&prodlist , &i, ' ')) /DISPLAY width = 10; /* column names for Products */%end;
define total /display "Total Cost $"; /* Excel Formulas */

Output code (compute)compute col_name;CALL DEFINE (_COL_, "STYLE","style = [ background=lightgrey TEXTALIGN = C font_weight = bold]");
if col_name = 'Comments' then CALL DEFINE (_ROW_, "STYLE","style = [ background=$comm.]");
if order in (1) then CALL DEFINE (_ROW_, "STYLE","style = [ background=lightgrey TEXTALIGN = C font_weight = bold]");else if order in (2,3,4,5,6,7,8,9,10,11,12,13,14,15,16,17,18,19,20,21,22) then CALL DEFINE (_ROW_, 'STYLE',"style =[tagattr='format:#,##0' TEXTALIGN = R ]");
else if order in (23,24,25,26,27,28,29) then CALL DEFINE (_ROW_, 'STYLE',"style=[tagattr='format:###.00%' TEXTALIGN = R ]");endcompute;
footnote1 j=left c=black height=1 " Footnote";ods tagsets.excelxp close;

Building the call stepsproc sql;select count (DISTINCT(SITE)) into :counterfrom x;select distinct(site) into :var_lisT1 -:var_list%trim(&counter)from x;quit;
Note: SAS 9.4 does not require the end macro var. It creates the vars dynamically. If doing multiple runs and various site numbers this way ensures no false macro varsare passed
%macro rept;%do I = 1 %to &counter;%output(site = &var_list&i);%end;%mend;%rept;
84
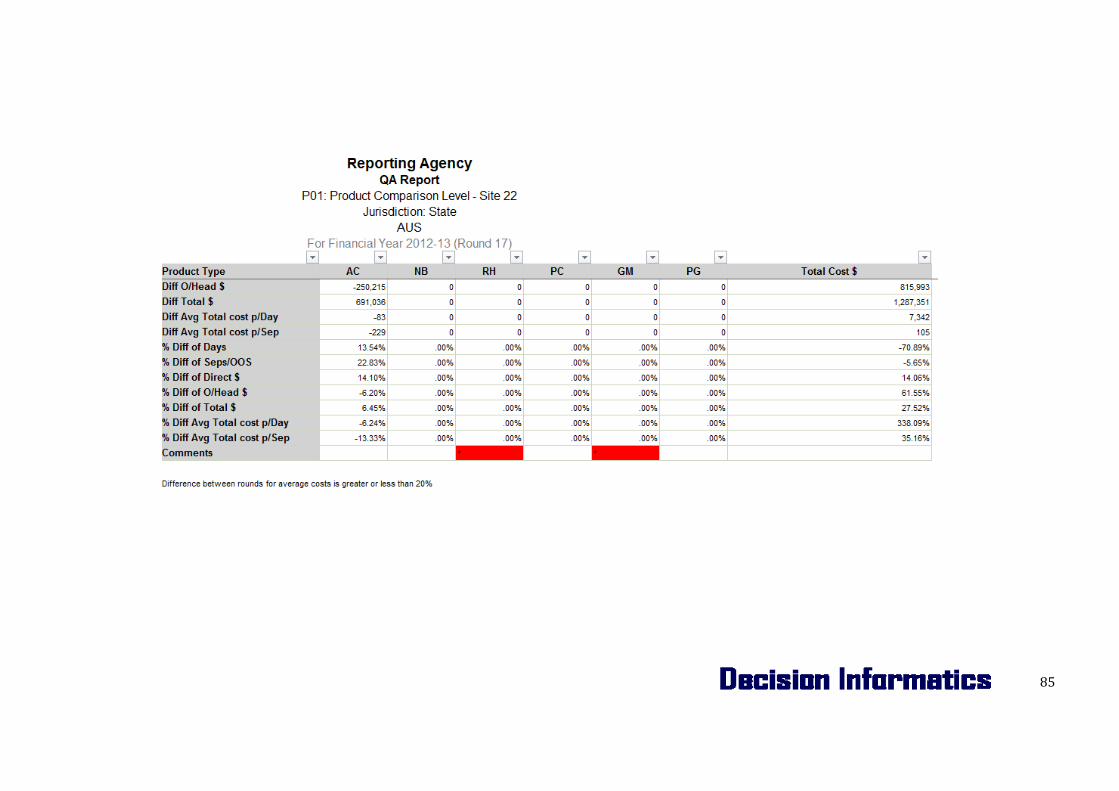
85

References• http://support.sas.com/rnd/base/ods/odsmarkup/TipSheet_ods_xl_xp.pdf• http://support.sas.com/rnd/base/ods/odsmarkup/excelxp_demo.html• http://support.sas.com/resources/papers/proceedings10/031-2010.pdf• http://support.sas.com/resources/papers/proceedings15/SAS1700-2015.pdf
86

Wrap Up
• Survey – Please complete• Best Presentation Award
• Q2 – Ron Elazar & Dharmik Jeena from Westpac• Wins iPod Nano & goes into draw for trip to SAS Global Forum 2015• 2013 Winner – Bob Whitehead just returned from Washington
• SANZOC – SAS Australia & New Zealand Online Community• Lucky Draw• Attendance – No Shows