Weather Support to the Space Shuttle ΠAn Historical ...
25
Weather Support to the Space Shuttle An Historical Perspective Dan G. Bellue 1 , Billie F. Boyd 2 , William W. Vaughan 3 , Tim Garner 1 , Johnny W. Weems 2 , John T. Madura 4 , and Harold C. Herring 5 1 Spaceflight Meteorology Group 2 45th Weather Squadron 3 University of Alabama in Huntsville 4 Kennedy Space Center 5 Computer Sciences Raytheon 1. INTRODUCTION The primary launch site since Americas entry in the 1950s into the space race (and for all American manned launches) has been the east coast of Central Florida, home of Cape Canaveral Air Force Station (CCAFS) (part of the Air Forces Eastern Range (ER)) and the National Aeronautics and Space Administrations (NASA) Kennedy Space Center (KSC). Prior to the first Space Shuttle launch 12 April 1981, the Air Force assumed sole operational responsibility (1 October 1978) for weather support at KSC (including ground processing and launch operations) in addition to Air Force launches at the ER. That Air Force support continues today and is provided by the 45th Weather Squadron (45 WS). The NOAA National Weather Services Spaceflight Meteorology Group supports NASA at the Johnson Space Center (Brody et al., 1997) for all Space Shuttle flight operations, which includes weather forecasts for Space Shuttle landings at KSC and abort sites. The NASA Johnson Space Center was assigned as Space Shuttle Program Manager (19 March 1972) for the Space Shuttle with NASA Marshall Space Flight Center being responsible for the propulsion systems development. Its Aerospace Environment (subsequently Atmospheric Science) Division also provided the natural environment requirements and interpretations for the design and development of the Space Shuttle. Well into the Space Shuttle Program, (following the Challenger accident) two other significant weather support organizations were added the NASA Weather Office at KSC and the Applied Meteorology Unit (AMU). This paper will discuss all aspects of weather support to the Space Shuttle, from its early design phase through the Columbia accident (Winters et al., 2004), 1 February 2003. 2. DESIGN SUPPORT 2.1 Background The natural (terrestrial and space) environment design requirements for the Space Shuttle were based ________________________ *Corresponding Author: Dan G. Bellue, NOAA / NWS/Spaceflight Meteorology Group ZS8, 2101 NASA Parkway, Johnson Space Center, Houston, TX 77058; e-mail: [email protected] on the specified mission performance capabilities. These were expressed in the Level I and II program definition and requirements. The initial Space Shuttle natural environment design requirements were based on those for the Saturn-Apollo. They were tailored and supplemented to meet the needs of the Space Shuttle, a vehicle that involved many of the characteristics of a space vehicle and conventional aircraft. The responsibility for most of the definitions of these requirements and their interpretation for design applications rested mainly with the Aerospace Environment Division at the NASA Marshall Space Flight Center. Much of this effort benefited from the lessons learned during the Saturn-Apollo program. Some of these lessons, along with those from the Space Shuttle development and operations, will be addressed in this section. 2.2 Design Requirements The natural environment design requirements for the Space Shuttle were documented and maintained as Appendix 10.10 of the Level II Program Definition and Requirements, JSC 07700, Volume X Space Shuttle Flight and Ground System Specifications. As the development of the Space Shuttle proceeded from the initial design studies, this document was modified and expanded upon to accommodate the needed natural environment design inputs to meet the Space Shuttle mission requirements. Included as source documents for natural environment design requirements not otherwise expressed in Appendix 10.10 were NASA- TMX-64757 Terrestrial Environment (Climatic) Criteria Guidelines for Use in Space Vehicle Development, 1973 Revision and NASA-TMX-64627 Space and Planetary Environment Criteria Guidelines for Use in Space Vehicle Development, 1971 Revision. These documents provided the basic information on the natural environment for the Space Shuttle development. Interactions during the design process for the Space Shuttle system and its various elements involved a variety of special studies and associated interpretations regarding the natural environment requirements. These were elaborated on within and expressed in the various engineering activities and processes used for specific design issues. Figure 1 provides a schematic for the natural environment definition and analysis process
Transcript of Weather Support to the Space Shuttle ΠAn Historical ...
Weather Support to the Space Shuttle � An Historical Perspective
Dan G. Bellue1, Billie F. Boyd2, William W. Vaughan3, Tim Garner1, Johnny W. Weems2, John T. Madura4, and Harold C. Herring5
1Spaceflight Meteorology Group 245th Weather Squadron 3 University of Alabama in Huntsville 4 Kennedy Space Center 5Computer Sciences Raytheon
1. INTRODUCTION
The primary launch site since America�s entry in the 1950�s into the space race (and for all American manned launches) has been the east coast of Central Florida, home of Cape Canaveral Air Force Station (CCAFS) (part of the Air Force�s Eastern Range (ER)) and the National Aeronautics and Space Administration�s (NASA) Kennedy Space Center (KSC).
Prior to the first Space Shuttle launch 12 April 1981, the Air Force assumed sole operational responsibility (1 October 1978) for weather support at KSC (including ground processing and launch operations) in addition to Air Force launches at the ER. That Air Force support continues today and is provided by the 45th Weather Squadron (45 WS).
The NOAA National Weather Service�s Spaceflight Meteorology Group supports NASA at the Johnson Space Center (Brody et al., 1997) for all Space Shuttle flight operations, which includes weather forecasts for Space Shuttle landings at KSC and abort sites.
The NASA Johnson Space Center was assigned as Space Shuttle Program Manager (19 March 1972) for the Space Shuttle with NASA Marshall Space Flight Center being responsible for the propulsion systems development. It�s Aerospace Environment (subsequently Atmospheric Science) Division also provided the natural environment requirements and interpretations for the design and development of the Space Shuttle.
Well into the Space Shuttle Program, (following the Challenger accident) two other significant weather support organizations were added � the NASA Weather Office at KSC and the Applied Meteorology Unit (AMU).
This paper will discuss all aspects of weather support to the Space Shuttle, from its early design phase through the Columbia accident (Winters et al., 2004), 1 February 2003. 2. DESIGN SUPPORT 2.1 Background
The natural (terrestrial and space) environment design requirements for the Space Shuttle were based ________________________
*Corresponding Author: Dan G. Bellue, NOAA / NWS/Spaceflight Meteorology Group ZS8, 2101 NASA Parkway, Johnson Space Center, Houston, TX 77058; e-mail: [email protected]
on the specified mission performance capabilities. These were expressed in the Level I and II program definition and requirements. The initial Space Shuttle natural environment design requirements were based on those for the Saturn-Apollo. They were tailored and supplemented to meet the needs of the Space Shuttle, a vehicle that involved many of the characteristics of a space vehicle and conventional aircraft. The responsibility for most of the definitions of these requirements and their interpretation for design applications rested mainly with the Aerospace Environment Division at the NASA Marshall Space Flight Center. Much of this effort benefited from the �lessons learned� during the Saturn-Apollo program. Some of these lessons, along with those from the Space Shuttle development and operations, will be addressed in this section.
2.2 Design Requirements The natural environment design requirements for
the Space Shuttle were documented and maintained as Appendix 10.10 of the Level II Program Definition and Requirements, JSC 07700, Volume X �Space Shuttle Flight and Ground System Specifications�. As the development of the Space Shuttle proceeded from the initial design studies, this document was modified and expanded upon to accommodate the needed natural environment design inputs to meet the Space Shuttle mission requirements. Included as source documents for natural environment design requirements not otherwise expressed in Appendix 10.10 were NASA-TMX-64757 �Terrestrial Environment (Climatic) Criteria Guidelines for Use in Space Vehicle Development, 1973 Revision� and NASA-TMX-64627 �Space and Planetary Environment Criteria Guidelines for Use in Space Vehicle Development, 1971 Revision�. These documents provided the basic information on the natural environment for the Space Shuttle development. Interactions during the design process for the Space Shuttle system and its various elements involved a variety of special studies and associated interpretations regarding the natural environment requirements. These were elaborated on within and expressed in the various engineering activities and processes used for specific design issues. Figure 1 provides a schematic for the natural environment definition and analysis process

Fig. 1. Natural Environment Definition and Analysis Process for Space Shuttle Engineering Application.
employed for the Space Shuttle engineering applications.
Some examples of the special analyses and reassessments that led to improvements in the interpretation and/or definition of natural environment requirements for the Space Shuttle development relative to the mission requirements include the following: (1) incorporation of a wind bias into the trajectory, thus improving launch capability regarding maximum dynamic pressure (max-q) wind loads (2) assessment of cross-wind landing gear load constraint, thus leading to enhanced design improvement, (3) refined external tank icing analysis regarding atmospheric effects inputs, (4) re-entry heating analyses update using improved Global Reference Atmosphere Model development, (5) solid rocket motor exhaust by-products dispersion assessments relative to atmospheric dispersion and transport, (6) development of an ascent wind loads prelaunch advisory team, and (7) development of a monthly sample of Radar/Jimsphere Detail Wind Profiles for use in assessing the operational Space Shuttle ascent winds loads capability regarding to launch delay probability.
The content of the Space Shuttle Natural Environments Design Requirements document, Appendix 10.10 of the Level II Program Definition and Requirements, specifically addressed the following: (1) avoidance of in-flight thunderstorm penetrations, (2) hail impact for Orbiter impact (crew safety) on windshield during landing phase, (3) winds during ground
operations, ascent, entry, and landing phases, abort, ferry operations and support for facilities, (4) lightning discharges, (5) thermodynamic elements during ground operations, ascent, on-orbit, de-orbit, entry, and landing plus external tank sub-orbital entry, (6) ionospheric, (7) radiation�galactic cosmic, trapped radiation, solar particle events, radiation dose limits, (8) meteoroid, (9) astrodynamic constants, (10) thermal�ground and space environments, and (11) water impact and recovery conditions. Much of this information, and subsequent updates from lessons learned during the Space Shuttle development and operations, were incorporated into the NASA-HDBK-1001 �Terrestrial Environment (Climatic) Criteria Handbook for Use in Space Vehicle Development� available from the NASA Technical Standards Program Website http://standards.nasa.gov. This handbook is currently being updated and revised with publication expected in latter part of 2005.
2.3 Terrestrial Environment Issues Experience gained in developing terrestrial
environment design criteria for previous aerospace vehicles, Redstone, Jupiter, and Saturn-Apollo, proved to be most effective. It was recognized that the terrestrial environment design requirements for the Space Shuttle should be: (1) available at the inception of the program and based on the desired operational performance, (2) issued under the signature of the

Table 1. Key Terrestrial Environment Parameters Needed versus Engineering Systems (X) and Mission Phase
(P)
StorageX PX PXX PX PXX PX PX PX PX PMission Operations
RefurbishmtPPPPPPP
Facil/spt EqPPPPPP
Ferry/ Transport
PX PPX PPX PX PPX PX PPTelemetry, Tracking & Communication
Post-land PPX PPPX PPX PPThermal Control
LandingPPX PPX PPXX PX PP Optics
DescentPX PXX PXPPElectrical Power
OrbitalXXXXXX PX PX PXMaterials
FlightX PPXPX PXXPPAvionics
Stages Recvry
X P X PPPPX P X P Loads
Liftoff/ Ascent
X PPPPX PPPX PX PControl
Pre-launch DOL cnt dn
PPPPPPX PPX PX PThermal Loads/ Aerodynamic Heat
Rollout/On-pad
PPPPPPPX PX PAerodynamics
Transport & Ground Hdl
PPPPPPX PPPX PX P Performance/ Trajectory/G&N
TestingPX P XX PPX PXX PX PStructures/ Airframe
Manufactur-ing
XX PXPX P XPropulsion/ Engine Sizing
Mission Analysis
XX P X PX P X PX P X PX PX PX PX PSystem
Mission Phase
Geologic Hazzards
Severe Weather
Sea State
Precip or Hail
HumidityClouds & Fog
Atmosph Electricy
Solar/ Thermal Radiation
Atmosph Constit
AtmosphricThermodyn
Winds & Gusts
Launch Vehicle System s (Sub-)
PTerrestrial Environment ParameterX
program manager and be part of the controlled program definition and requirements documentation, and (3) specify the terrestrial environment for all phases of activity including pre-launch, launch, ascent, on-orbit, descent, and landing. In addition, the natural environment requirements �control point� representative was an active member of the Space Shuttle design team.
The terrestrial environment phenomena play a significant role in the design and flight of all space vehicles and in the integrity of the associated systems and structures. Terrestrial environment design guidelines for the Space Shuttle were based on statistics and models of atmospheric and climatic information relative to the vehicle�s development requirements, desired operational capabilities, launch and landing locations. The Space Shuttle was not designed for launch and flight operations in severe weather conditions such as hurricanes, thunderstorms, and other sustained strong wind events.
Assessment of the terrestrial environment requirements early in the Space Shuttle development was advantageous in developing a vehicle with minimal operational sensibility to the natural environment, consistent with the mission requirements. Table 1 provides a matrix of the key terrestrial environment parameters versus engineering systems and mission phase that were addressed in the Space Shuttle design requirements development. This early planning permitted the development of improved and new
measuring, forecasting, and communications systems tailored to meet Space Shuttle operational needs. The following sections of the paper address the significant progress made in these areas during the Space Shuttle **operational period. The knowledge of the terrestrial environment design requirements was used for establishing test requirement for the Space Shuttle and designing associated support equipment. These data were also used to define the fabrication, storage, transportation, test, and preflight design conditions for both the whole system and the components that make up the system.
Ideally the Space Shuttle design should accommodate all expected operational natural environment conditions. However, this is neither economically nor technically feasible. For this reason, consideration was given to protection of the Space Shuttle from some extremes by use of support equipment, special facilities, and specialized forecast __________________________________________
** The first four Space Shuttle flights met objectives outlined in the Orbital Flight Test Program. After the landing of STS-4, President Ronald Reagan proclaimed the Space Shuttle �fully operational, ready to provide economical and routine access to space�� which began the Space Shuttle�s �operational period.� More precisely, the Columbia Accident Investigation Board described the Space Shuttle as �a developmental vehicle that operates not in routine flight but in the realm of dangerous exploration.�

personnel to advise on the expected occurrence of critical terrestrial environment conditions. The services of specialized forecast personnel proved very economical in comparison with a more extensive vehicle design that would be necessary to cope with all terrestrial environment possibilities.
In general, natural environment requirements documents do not specify how the designer should use the data in regard to a specific launch vehicle design. Such specifications may be established only through analysis and study of a particular design problem. This was also the case with the Space Shuttle.
The Space Shuttle presented some interesting conditions regarding the natural environment inputs used for design, mission planning, and on-orbit and entry operations. For launch, the risk was essentially associated with the probability of launch delay since the atmospheric conditions can readily be monitored relative to the capability of the operational Space Shuttle. Measurement systems focused on the Space Shuttle requirements and specialized forecast personnel familiar with the terrestrial environment capabilities (launch constraints) basically ensure that the Space Vehicle�s ground, launch and ascent operations will not be compromised by the terrestrial environment. However, for on-orbit operations, a lower risk for exceeding natural environment design requirements is necessary due to limited observational and specialized forecast capabilities for �space weather� phenomena. To a lesser degree, a similar condition existed for the Space Shuttle regarding re-entry and landing. The final decision to de-orbit is made about 1.5 hours prior to landing. In addition the re-entry trajectory covers an extensive path over varying locations, depending on the trajectory. Thus, the terrestrial environment design requirements for this phase of operations are specified at a lower risk level than those associated with the launch and ascent operations, which can be monitored and accommodated by launch delay if necessary.
One of the early developments for the Space Shuttle flight evaluation analyses was an integrated meteorological data record involving Eastern Range (ER) ground and ascent meteorological measurements. A similar record was provided for entry and landing based mainly on the NASA Global Reference Atmosphere Model. Finally, due to the quality of the natural environment design requirements, operational support requirements, and the prelaunch monitoring capabilities associated with meteorological measurements and specialized forecasts, the risk of having the performance of a Space Shuttle compromised due to exceeding natural environment conditions is exceedingly small.
2.4 Lessons Learned The Space Shuttle, along with the Saturn-Apollo,
provided a wealth of natural environment related �lessons learned�. Not only were they applicable to these programs, but also the lessons are just as important for future flight programs. In addition, the lessons learned contributed to the advancement of
knowledge of the atmospheric and space environment in varying degrees, some even benefiting other areas of atmospheric and space environment applications. Included in this scope is the more recent emphasis on development of space weather forecasting capabilities.
One simple evidence of terrestrial environment related lessons learned being applied is the current NASA-HDBK-1001 �Terrestrial Environment (Climatic) Criteria Handbook for Use in Aerospace Vehicle Development� and the predecessor editions issued since the early 1960�s. This �definition� document provides information on the terrestrial environment formulated and based on experiences from the applications to aerospace vehicle design, mission analysis, and operations, including discussions with and requests from engineers involved in the design, mission analysis, and operations process. Another is the development of a unique three-dimensional time-dependent �Global Reference Atmosphere Model�, initially produced to support aerospace vehicle re-entry thermal design calculations. As experience was gained, new information was used to update and improve the contents for subsequent editions of these items. They provide source information for the development of specific terrestrial environment requirements for the design, development, and operations of new aerospace vehicles and associated facilities necessary to meet the desired capabilities for the vehicle�s assigned missions.
2.4.1 Some Lessons Learned Examples Recently, the NASA Technical Standards Program
http://standards.nasa.gov undertook an initiative to identify lessons learned that might be linked to technical standards plus, subsequently, an effort to develop lessons learned datasets that can also be linked to the content of classroom and electronic engineering training courses. One of the actions was to identify candidate atmospheric and space environment related lessons learned that might be expanded upon for use in this initiative. Based on the experiences of various people a number of candidate lessons learned were identified from Space Shuttle and Saturn/Apollo experiences. Several are summarized in the subsequent section of the paper. They are listed in no particular order of priority or relative significance. They illustrate the type of lessons learned encountered and the relative importance of atmospheric and space environment related lessons learned. The Space Shuttle experiences, in particular, played an important part in contributing to these lessons learned.
A. Title: Natural Environment Design Requirements
for a Program: Control and Single Focus Contact Issue: All space vehicle (launch vehicle and
spacecraft) programs and projects involve flight through the natural (atmospheric and space) environments. There are usually several groups; both industry and government, involved in the design and development of launch vehicles and spacecraft. Having a coordinated and controlled set of natural environment design inputs

tailored to meet the mission requirements for the space vehicle is critical, not only from a risk and cost aspect, but from a technical view to ensure consistent engineering analyses. Otherwise, the various trade-off analyses for the vehicle structure, control, thermal, design concepts, etc., will not be based on a common natural environment input baseline. This will result in non-uniform products that greatly complicate the comparisons and management decisions that must be made.
Lesson: The specification and control of natural
environment definitions and requirements are important for engineering studies used in vehicle design trade-offs and development activities. This is especially true when there are several organizations involved in the vehicle development activities. It is critical that a single control point be established for natural environment inputs used in the design and development of a space vehicle to ensure consistent engineering analysis. Designers must be cognizant that although the natural environment definitions may be the same, the design requirements may be very different for manned vehicles than those for unmanned or robotic missions.
B. Title: �Critical Discipline Area� Designation for
Program Development Issue: Essentially all programs, early in their
development, designate critical discipline areas from which inputs are required to support the specification of program guidelines, mission requirements, and system design. Often the natural environments were not included in the list of critical disciplinary areas.
Lesson: The natural environment definitions and
requirements are usually one of the key drivers for the development of an aerospace vehicle program relative to accomplishment of its assigned mission. Thus, to avoid oversight of these inputs early in the establishment of program requirements, the natural environment should always be designated in the initial listing of critical disciplines for the program.
C. Title: Launch Availability With Respect To Abort
Landing Site Weather Issue: The Orbital Space Plane Program had a
requirement that necessitated calculating a probability of launch availability with respect to abort landing site weather. When the contractors� proposed program configurations shifted from lifting bodies to capsules, the resulting loss of cross-range and down-range capability required that all points along the ascent trajectory be considered possible abort landing sites. Thus, instead of a few discrete locations with available long-term weather data, a continuous set of locations is required, many over the ocean with little or no long-term weather monitoring data available. The original requirement did not explicitly state how the probability was to be calculated, and at the systems design review presentations, it became apparent that the prime
contractors had not adequately considered this issue. The complexity of the calculations and, more importantly, the issue of data availability, contributed to this factor not being considered in the decisions leading to the capsule concepts.
Lesson: Whenever a program requirement is
written that depends on the probability of occurrence of natural environmental phenomena or of a particular set of conditions, the requirement needs to be very explicitly stated as to how the probability is to be computed, what data and models are to be used, etc.
D. Title: Metric-English Units Application
Understanding. Issue: Radiosonde measurement calculations from
the launch site used incorrect units for mean sea level. These measurements were used to calculate vehicle responses for use in flight evaluation analyses, leading to a mismatch with flight data. Mars Rover experience is another example of the importance of verifying the units used in performance calculations. SI (metric) system has been used in the scientific and international communities for many decades. More and more data sets and technical models needed in the engineering process are only available in metric units. The aerospace engineering community needs to accelerate its transition to metric units to alleviate this technical and cost issue.
Lesson: The incorrect application of units to an
application can result in considerable opportunity for technical data interpretation errors and operational consequences. This is particularly true for programs that use mix of Metric and English units. Double-checking of units being used is critical to avoid issues associated with misuse of units.
E. Title: Wind Vectors Vs Engineering Vector
Conventions. Issue: Flight mechanics use of wind vectors relative
to the conventional meteorological usage. In the case of flight mechanics, the vector is stated relative to direction a force is being applied. However, for meteorology, the wind vector is stated relative to direction from which wind force is coming.
Lesson: The proper interpretation and application
of wind vectors is important to avoid a 180 degrees error in the vehicle�s structural loads and control system response calculations.
F. Title: Design Requirements, Not Climatology. Issue: While based on climatology and models,
both physical and statistical, natural environment requirements are parts of the overall vehicle design effort necessary to ensure that the mission operational requirements are met. Thus they must be selected and defined on this basis. Simply making reference to

climatological databases of atmospheric and space environment measurements will not produce the desired vehicle performance. This was done with respect to an action for the Apollo Block I/II spacecraft and produced a costly re-design situation.
Lesson: Members of the natural environment group
assigned as the control point for inputs to a program must also be part of the vehicle design requirements development process. Likewise, they should be an integral part of the vehicle design team and participate in all reviews, etc. to ensure proper interpretation and application of natural environment definitions and requirements relative to overall space vehicle (launch vehicle and spacecraft) design needs.
For the sake of brevity only six examples of lessons
learned have been listed. There are many more lessons learned. See Vaughan and Anderson, 2004 for further details.
3. LAUNCH SUPPORT
On the Eastern Range (ER), weather support for
resource (people and facilities) protection from lightning, winds, and hail, may seem similar to that required at any other semitropical area. However, many aspects of space launch weather support are unique, including: a large amount of weather sensitive processing outdoors 24/7 in the area of America�s thunderstorm capital; complex weather constraints for each operation requiring precise time and location forecasts; significant economic and schedule impacts for false alarms; potentially catastrophic impacts to America�s Space Program for failures to warn; very high political and media visibility; and an extensive, complex and sometimes unique weather infrastructure to provide required support.
Prelaunch processing is time consuming and weather sensitive. However, the actual launch is even more weather sensitive. Given this fact, one might wonder why better climatological times are not selected for the launch time. Weather is not the most important variable in selecting a launch time. The many factors that enter into determination of the launch window (as discussed below) prior to any weather consideration, combined with the very dynamic weather of Florida, lead to weather becoming a prime cause of launch delays and/or scrubs (see Table 3 following).
There are several factors that carry more weight than weather considerations in establishing the launch window. For example, for Space Shuttle missions, if a launch hold would cause the crew day to exceed 18 hours, the timeline must permit rescheduling of activities to achieve mandatory payload objectives and limit the crew to 18 hours. Also, the launch window must accommodate mandatory payload objectives and other factors such as collision avoidance of orbiting spacecraft and debris, and for interplanetary missions, planet alignment. Furthermore, climatology ranks below such factors as the following for determining Space Shuttle launch windows: available days, minimum duration,
daylight landing opportunity, daylight launch, daylight landings at abort sites, and daylight return to launch site.
Two items complicate the weather support mission of the 45 WS: (1) the location of the Cape Canaveral Air Force Station (CCAFS)/KSC complex and (2) the extreme weather sensitivity of the mission combined with high cost of error. The area of maximum thunderstorm occurrence in the United States is in Central Florida, just a few miles upstream from the CCAFS/KSC complex. Consequently, thunderstorms represent the single greatest threat to operations on CCAFS/KSC, bringing deadly lightning and damaging winds, and thus launch delays. Table 2 shows monthly frequency of thunderstorms for the Shuttle Landing Facility (SLF) in 3-hourly increments, rounded to the nearest whole percent (- indicates less than 0.5 percent) for the �thunderstorm season� based on 30 years (1973-2003) of hourly observations at the SLF (AFCCC, 2003). These climatological data clearly show a thunderstorm
Table 2
Percent of Hourly Observations with Thunderstorms at the KSC Shuttle Landing Facility (1973-2003)
LST APR MAY JUN JUL AUG SEP 00-02 1 1 1 1 2 2 03-05 1 1 1 1 1 2 06-08 - 1 1 1 1 2 09-11 1 1 3 2 3 3 12-14 3 4 13 14 14 8 15-17 3 6 17 21 19 10 18-20 3 5 10 11 10 7 21-23 1 2 4 3 4 4 maximum during summer afternoons, reaching 21 percent of hourly observations for 1500 to 1700 Local Standard Time (LST) in July. Days with thunderstorms (as opposed to hourly data) exceed 50 percent in both July and August. The number of cloud-to-ground strikes per year is widely variable within the CCAFS/KSC complex. The annual average ranges from 5 to 13 flashes per km2 (Boyd et al., 1995).
Weather presents a significant hazard to all phases of space vehicle operations. During the processing phase, launch vehicles and their payloads are prepared for flight. These activities, which often occur outdoors, can involve propellants, ordnance, and sensitive electronic systems, all at risk from lightning strikes, winds, and precipitation (Boyd et al., 1995).
During the launch phase, the booster and its payload are more at risk due to the possibility of the vehicle triggering a lightning strike, or adverse changes in upper level winds that exceed the booster�s structural capability. To assess the triggered lightning threat, the United States Air Force and NASA jointly developed a complex set of weather lightning launch commit criteria (LLCC) (Boyd et al., 1993). (Note: LLCCs are discussed in more detail in paragraph 3.2). Upper-air data are provided to each customer, who assesses the impact to their launch vehicle. Smith and Adelfang

(1992) detailed how this is accomplished for the Space Shuttle. Impact of weather on launches is shown in Table 3, which clearly shows that weather is the leading cause for launch scrubs. Categories, other than weather, include �user�, defined primarily as vehicle
Table 3
Eastern Range Launch Countdowns (POR: 1 Oct 88-25 Aug 00)
Count- down
Launch (on time)
Launch With Delay
Scrubbed Launch
494 (100%) 173 (35%) 146 (30%) 175 (35%) Cause of Delay/Scrub User
60 (12%) User
74 (15%) Range
36 (8%) Range
12 (2%) Weather
50 (10%) Weather
89 (18%)
problems and �range� which includes all range instrumentation and/or safety concerns independent of the weather systems.
The ER Safety Office has multiple weather support requirements, including observation of the vehicle during ascent, toxic hazard forecasts (Parks, et al., 1996), potential blast effects of an explosion at the launch pad (Boyd and Wilfong, 1988, Boyd et al., 2000), and debris fallout in case of an accident, all very weather sensitive. Boyd et al. (1999) described all aspects of weather support to safety.
3.1 ER Weather instrumentation The ER has one of the world�s most dense
networks of operational weather instrumentation. Data from this network are used to assess and forecast weather conditions required to support space launch operations. Improvements and upgrades are made constantly to minimize the impact of weather while ensuring the safe processing and launch of space systems. All networks have undergone considerable modifications during the period of Space Shuttle support, and most instrumentation has been modified or replaced within the past decade. One of the most recent improvements is the Range Standardization and Automation (RSA) project described in detail by Wilfong et al. (2002) and Harms et al. (2003)
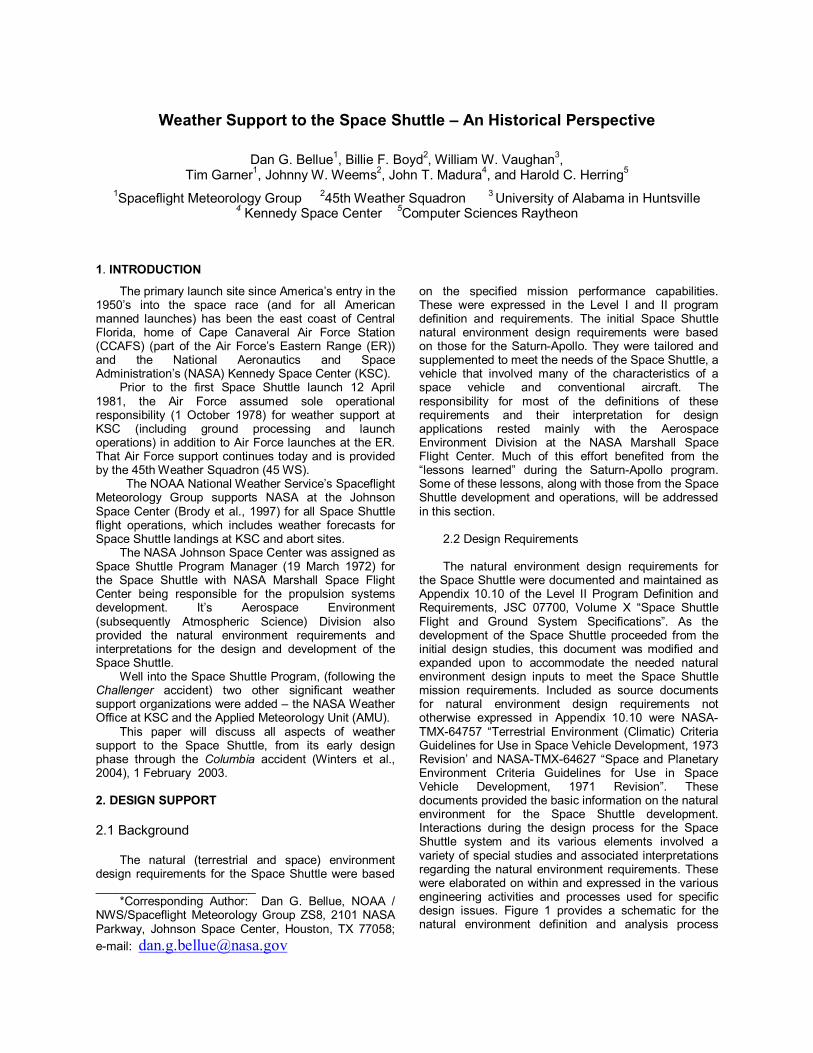
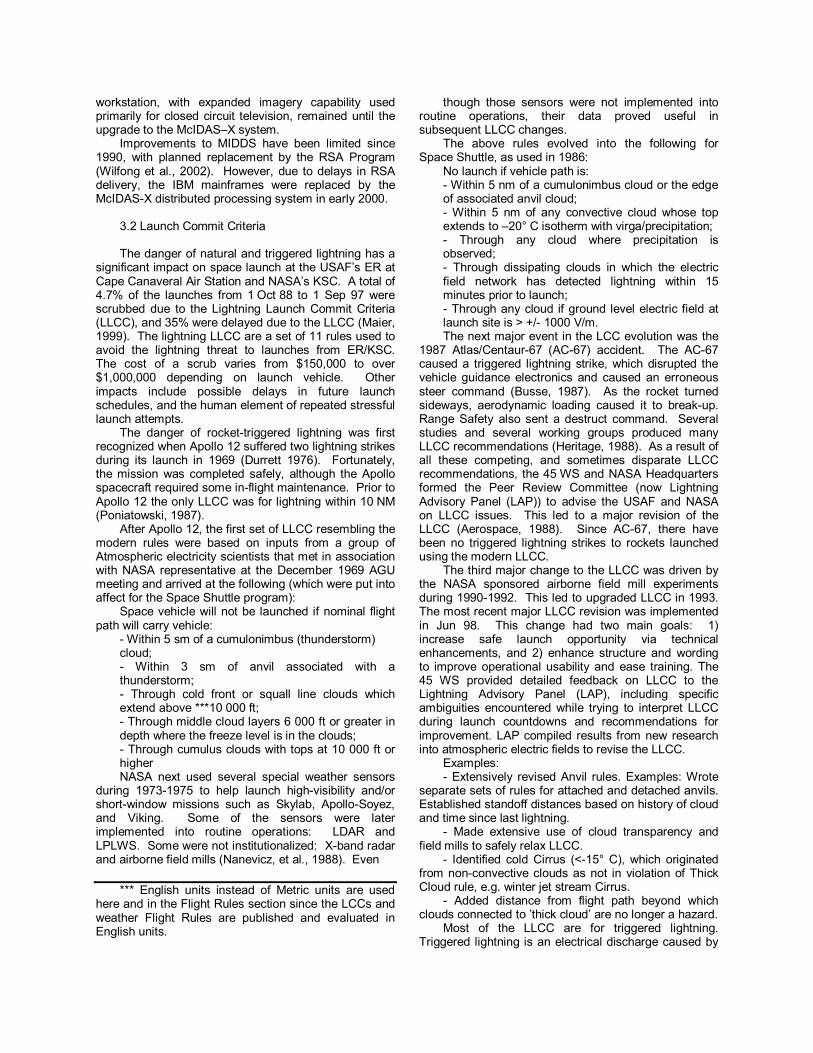
In 1978, when the Air Force assumed responsibility for KSC weather support, (between the end of the Apollo Program and start of the Space Shuttle Program), the ER instrumentation consisted of: the Launch Pad Lightning Warning System (a mix of two field mill types as shown in Figure 2, 14 instrumented towers as shown in Figure 3 (plus those at the Shuttle Landing Facility (SLF) and launch pads), an FPS-77 weather radar, a 150 meter meteorological tower, and an old (but extensive) upper-air system, anchored by the GMD-4 for tracking balloons, plus the radar/Jimsphere detail wind profile measuring system, and rocketsondes. Jimspheres had been developed to eliminate wind measurement errors introduced by
spurious horizontal balloon motion and obtain altitude resolution needed in support of earlier launch vehicles (Scoggins, 1967). The resultant design was a two-meter diameter radar-tracked sphere with 398 roughness elements, fully described by Wilfong, et al., (1996).
Since the start of the Space Shuttle Program, two major accidents plus many study groups (Theon, 1986, Busse, 1987, NRC, 1988, and Hosker et al. 1993) and field programs/experiments (Taylor et al., 1989, Williams et al., 1992) led to improvements in meteorological instrumentation for the ER.
By 2004, the ER meteorological instrumentation included: four independent lightning detection systems, an extensive upper-air system (consisting of radars, balloons, and Jimspheres), hundreds of boundary layer sensors, including the 150 meter meteorological tower, two weather radars, direct satellite read-out, and a Meteorological Interactive Data Display System (MIDDS), with a major effort almost completed to replace the upper-air mainstay with a GPS based system (see paragraph 3.1.2).
Fig. 2. Two type field mills.
3.1.1 Lightning Systems In preparation for the Space Shuttle program, the
first major weather instrumentation improvement was the Cloud-to-Ground Lightning Surveillance System (CGLSS). A test system with three sensors was

installed 1 June � 12 July 1979 with leased equipment at KSC, as part of the Federal Evaluation of Lightning Tracking System (FELTS). The system was then procured in February 1981 with joint funding by NASA and the Air Force. This system was installed prior to the first Space Shuttle launch in 1981. In August 1983, a contract was awarded to add a low gain system.
By February 1984, the system consisted of two low gain direction finders (DFs) located at the Ti-Co Airport (28.5N 80.8W) and Merritt Island (28.4N 81.3W) and three medium gain DFs located at the same Merritt Island location and the Orlando and Melbourne Airports (Erickson, 1985) (Figure 4). After 1984, the system continued under development and was accepted into the ER inventory as a fully certified system 24 July 1989.
From 1989 to 1994 the system was further upgraded to a network of five LLP Model 141 Advanced Lightning Direction Finders (ALDF). During the 1995-1998 period the system was converted to a short-
Fig. 3. Wind Towers Circa 1978.
baseline 6-antenna magnetic direction-finding/time-of-arrival IMproved Accuracy from Combined Technology (IMPACT) system. The CGLSS is deployed in and around the launch and operations areas to ensure the requirements for high location accuracy and detection efficiency are satisfied. Recently one of the sensor sites (Duda) became unavailable due to area growth. That sensor site was relocated to the Deseret site and a thorough analysis of system accuracy was completed (Boyd et al., 2005). That move was accomplished in 2004 (Figure 5). This arrangement limits the CGLSS effective range to about 100 km. The CGLSS operates 24 hours per day, 7 days per week. The CGLSS is
operated and maintained by the Range Technical Services (RTS) Contractor, currently Computer Sciences Raytheon, who supplies the data to the 45 WS for their evaluation. In 1978, the Launch Pad Lightning Warning System (LPLWS) consisted of a mix of two types of field mills, 23 mills developed and installed by NASA and eight Air Force mills (Gulick and Wacker, 1977, and Stubbs, 1978). This system measured the electrification of the atmosphere at the earth�s surface and inferred the charge aloft. This LPLWS, with some variation of the number of mills in service, co-existed until after the Atlas Centaur accident in 1987. In early 1985, it consisted of: 20 full-time NASA (KSC) mills, plus four or five added during launches, and six Air Force mills, of which three were inactive (Erickson, 1985).
As part of a detailed look at weather support from 1985-1989 (Theon, 1986, Busse, 1987, and NRC, 1988), NASA and the Air Force agreed on a joint project to upgrade the LPLWS. The NASA Marshall Space
Fig. 4. CGLSS Circa 1985.
Flight Center (MSFC) developed the LPLWS field mill instruments and base station computer. The USAF 45th Space Wing (45SW) developed the LPLWS host computer and real-time display and also integrated and tested the overall system. The improved system consists of a network of 31 field mills distributed in and around the launch and operations areas of CCAFS and KSC. Operations, maintenance, and data flow are the same as the CGLSS.
Installation of the Lightning Detection and Ranging (LDAR) system started in 1991 (Lennon and Maier,

1991) and was tested 1992-94 (Maier, et al., 1995). The system consists of a network of seven time-of-arrival radio antenna receiver sites, which provides a three-dimensional depiction of the lightning, including: in-cloud, cloud-to-cloud, cloud-to-air, and cloud-to-ground lightning. Each site receives VHF radiation at 66 MHz, logarithmically amplifies the received signal, and then transmits the signal to a central site using dedicated microwave links. Each site operates autonomously and is powered by batteries recharged by solar panels. LDAR was developed by the NASA KSC Instrumentation and Measurements Branch and is currently operated and maintained by a NASA contractor (Command Technologies Inc.). NASA entered into a commercialization effort with Global Atmospherics, Inc. (GAI) (Harms, et al., 1997) and the Air Force is currently in the process of procuring a commercial system to replace the NASA development system.
Data from the National Lightning Detection Network (NLDN) was added in the early 90�s to satisfy lightning detection requirements beyond 100 km. The NLDN is a long baseline mix of high gain MDFs and time of arrival (TOA) sensors operated as a commercial service. Sensor data are collected and processed in real-time at a network control center in Tucson, Arizona and then the processed data are broadcast to subscriber locations.
Fig. 5 CGLSS, 2004 Locations.
3.1.2 Upper-air Systems The second major weather instrumentation change
in conjunction with start-up of the Space Shuttle Program was replacement of the GMD-4 upper-air
system. The replacement, the Meteorological Sounding System (MSS) was a joint range procurement started in 1979, with MSS-1 accepted at the ER July 1982. Other trackers for this transponder sonde were added in 1983 and 1984. While the MSS was �state-of-the-art� at installation, computer advancements allowed almost continuous software improvements in data processing of the upper air information, primarily in quality control and speed to customer (Wilfong and Boyd, 1989 and Bauman, et al. 1992).
The upper-air system is possibly the most critical single weather system on the ER. The high cost of space vehicles and payloads demands careful monitoring and evaluation of vehicle loading caused by in-flight winds. Modern launch programs, including Space Shuttle and Titan IV, develop a steering profile from actual observations and uplink to the vehicle as close as possible to launch. Essentially the launch vehicle�s payload capability must be reduced by the loading uncertainties, thus reducing launch probability (increasing launch delay risks) (Wilfong, et. al., 1996). Various authors, Wilfong and Boyd (1989), Smith and Adelfang (1992), and Adelfang et al. (1993), have described these models and the impact of upper air variability on launch operations.
The radar-tracked Jimsphere program evolved as the primary system for making high- resolution wind profile measurements in support of the Space Shuttle and other launches for vehicle structural and control system design limitations during the maximum dynamic pressure flight. However, both NASA and Range Safety require more complete upper-air data: temperature, humidity, pressure, and winds (as provided by rawinsondes). To provide Range Safety their required data, the ER used transceiver sondes, which were tracked and processed by the MSS to provide upper-level parameters required by Range Safety. The MSS used a 2.4 m solid aluminum parabolic tracking antenna to communicate with and track the airborne sonde. Standard 600 or 800-gram latex balloons were used to loft the MSS sonde to near 20 km altitude.
3.1.2.1 Automated Meteorological Profiling System
(AMPS) A contract was awarded July 1996 to replace the
MSS and radar/Jimsphere system at both the Western and Eastern Ranges with an Automated Meteorological Profiling System (AMPS). AMPS (Divers et al. (2000)), was designed to track up to six flight elements of either type (low or high resolution) simultaneously. The flight element telemeters raw GPS information for winds, temperature, and humidity (PTU) data on a 403 MHz downlink to the ground element. Pressure is computed by AMPS. A narrow band RF system is employed which can be tuned to any of 16 discrete frequencies to permit the simultaneous tracking of multiple flight elements within the 401 to 406 MHz band. In the equipment cabinet, the RF signals are fed to each of the individual tracking units, referred to as Signal Processing Subsystems (SPS). Each SPS contains three primary components - a processor module, a GPS

module, and a 403 MHz receiver module plus the associated power supply.
There are six identical SPS units that can be individually assigned to track a specific flight element. The LAN hub is located in the equipment cabinet, with the SC as the server and six SPS units as the workstations. The System Computer receives the wind and PTU data packets from up to six flight elements simultaneously and generates the real-time displays and data outputs to the USAF data collection system. Data files for each profile are archived within the SC. All operator interfaces for command and control of the system is through the SC.
The AMPS low-resolution flight element (LRFE), used for measurement of atmospheric winds and pressure, temperature, and humidity (PTU), is lofted by a standard weather balloon. The high-resolution flight element (HRFE), for wind measurements only, is carried by a 2-meter Jimsphere. An inverse differential GPS approach is used for calculation of the wind.
The AMPs was accepted operationally at the ER in 2004, but continues under development.
Fig. 6. AMPS.
3.1.2.2 Doppler Radar Wind Profiler The evaluation of radar wind profilers to directly
improve structural stress analysis support started at the ER in 1985, when NASA arranged comparisons of two Doppler Radar Wind Profilers, one from the US and the other from Germany. Ultimately, neither of these vendors was selected and in 1987 NASA awarded a contract to Tycho Technologies to design and build a demonstration super-profiler system (Smith, 1989). The NASA/KSC Doppler Radar Wind Profiler (DRWP), commonly referred to as the 50 MHz DRWP, operates at 49.25 MHz with an average power-aperture of 108 Wm2. The system was installed adjacent to the north end of the Shuttle Landing Facility (SLF) on KSC in 1989 in a low power configuration (4 kW). The system was completed in 1990 with the installation of a high power amplifier (250kW) that significantly extended the vertical range of the system (although the system is normally operated at 125kW). The system provides estimates of the horizontal wind components directly above the radar at 5-minute intervals. A wide range of
parameter settings provides complete flexibility in the radar operating characteristics.
Soon after its installation in 1989, Marshall Space Flight Center (MSFC) recognizing the shortfalls of consensus averaging, developed the median filter/first-guess algorithm (MFFG) and associated QC methodology (Wilfong et al. 1993). The Applied Meteorology Unit (AMU) implemented the algorithm and QC software in 1994 (Schumann et al. 1999). The MFFG algorithm is currently used on the ER to generate the wind profiles from the 50-MHz spectra. The real-time QC methodology as described by Fitzpatrick et al., 2000 is used to support the Space Shuttle day of launch.
The 50 MHz DRWP system is currently in the process of modernization and transfer of ownership from NASA to the Air Force.
3.1.3 Boundary Layer Sensors Boundary layer sensing at the ER is accomplished
by two major systems: a network of 44 meteorological towers with wind, temperature, and dew point sensors at various levels and a network of five 915 MHz Doppler Radar Wind Profilers (DRWPs) with Radio Acoustic Sounding Systems (RASS). In addition, a 150-meter meteorological tower is available to provide additional boundary layer measurements. The tower network was established in the early 60's to provide data for predicting the path of the highly toxic propellants. Its design was a result of the Ocean Breeze-Dry Gulch diffusion experiments conducted both at CCAFS and Vandenberg. The 150-meter ground winds tower was built to support the Apollo program but has been refurbished for Space Shuttle support and continues to function some 40 years later. The network was expanded from 14 (Figure 3) to 29 locations in the early 80�s to cover an area of approximately 790 km2. In 1987 the network was further expanded to 49 locations to cover an area (including west and southwest of KSC on the mainland) of approximately 1600 km2 (Figure 7), which accommodated forecasting techniques recommended by Watson et al. (1989). Doubling the effective coverage area allowed the network the possibility to include several convective development regions at the same time. This very irregularly spaced network was reduced to 44 sites in the early 90�s. That is the number of current sites, with an average spacing of 5 km between towers over the majority of CCAFS/KSC proper. Most towers are 16 to 18 m tall, with sensors at two levels. Three others are 67 m and one is 165 m with sensors at various heights. All report wind, temperature, and dew point, either each minute or every five minutes. The towers are organized into three different groups: (1) launch critical, (2) safety critical, and (3) forecast critical. The application determines the sensor complement on the tower, how the base station interrogates the tower, and how the data are processed and displayed at the base station. All data are processed and displayed as an integrated network and any tower can contribute to any application.

Plans for the Ulysses and Galileo missions, with their nuclear powered payloads, in the late 80�s emphasized the need for better boundary layer information. Early efforts in install acoustic sounders were not successful. To fill the data gap from the top of the wind towers to the lowest gate of the 50 MHz DRWP, the ER started a project in May 1992 to procure and install a network of 915 MHz boundary layer profilers with RASSs (Madura, et al., 1991, Lucci, et al., 1998). The network is arranged in a diamond-like pattern over the area with an average spacing of 10 to 15 km. The network samples low level winds from 120 m to 3 km every 10 minutes and produces virtual temperature profiles every 15 minutes, greatly enhancing the forecasters� ability to track the sea breeze convergence zone. It also produces near real-time winds for use in emergency toxic dispersion calculations and improved meteorological data input to other safety models such as BLASTX for assessing damage potential from blasts in case of accidents. The system�s value in safety toxic dispersion forecasts was illustrated by Boyd et al. (2000).
RIVER
INDIA
N
Kennedy Space Center& Cape CanaveralAir Force Station
Wx Towers & Profilers
BANANARIV
ER
MO
SQUITO
LAGOON
POINSETT
LAKE
OCEAN
ATLANTIC
TITUSVILLE
COCOA
COCO
A BE
ACH
ROCKLEDGE
CAPE CANAVE RAL
BANANA CREEK
BANANA CREEK
VAB
SM AB
SRBPROC ESSING
OPF
CRAWLERWAY
SMARF
NASA CAUSEWAY WEST
PA
RK
WA
Y
PHILLIP
S
TITUSVIL
LE RD
BEACH RD
TOWWAY
3
NASA PARKWAY WEST
ST
AT
IC T
ES
T R
OA
D
NASA PARKWAY
WEATHERSTATION � A�
ROCC
VIB
528
NASA CAUSEWAY EAST
EAST
KE
NN
ED
Y
PA
RK
WA
YSO
UT
H
KE
NN
ED
Y P
AR
KW
AY
NO
RTH
WEATHERSTATION � B�
Skid Strip
Complex 39B
Complex 39A
Complex 41
Complex 40
Complex 36
Complex 46
Complex 20
Complex 17
PORT AREA
CCASINDUSTRIAL AREA
KSCINDUSTRIAL AREA
KSCINDUSTRIAL AREA
ITL AREA
2016
1617P
Mosquito Lagoon
SLFUser
Towers
1612
2008
P
492� tower
Playalinda
204� tower
SLC 40Titan User Tower
SLC 41Atlas V User Tower
False Cape
User Tower
Wind Towers
New RSA Tower
915 MHz DRWP
Mini-SODAR
50 MHz DRWP
Old Tower
P
Lori Wilson
000
1
204� towerP
MI Beacon
SLC 36Atlas User Tower
1500
2202
0889Viera
P
Pad 39BShuttle User Towers
Shuttle LandingFacility
204� tower
000
2
010
3
000
6
040
3
03
00
030
3
0022
01
08
021
1
031
1
041
2
041
5
042
1
05
06
05
09
071
4
08
03
08
05
08
19
100
0
10
07
101
2
1605
0011
129
9
0795
P
Pad 39AShuttle User Towers
001
5
009
5
03
16
130
5
12
04
011
0
03
13
05
11
051
2
051
3
As of 13 Sep 02
001
9
041
8
000
3
010
3
009
5
Fig. 7. Weather Instrumentation.
The system underwent extensive modification and testing before final certification and acceptance into the ER inventory in 2004.
3.1.4 Radar A 5cm AN/FPS-77 radar, placed on top of the
Range Control Center (RCC) located on Cape
Canaveral, replaced the 3cm CPS-9 and was used in the 1970s to support weather operations. The resident phosphorous memory CRT, Plan Position Indicator (PPI) only, was replaced by a standard radar retention CRT to more clearly and accurately monitor potential severe weather. The location of the antenna on top of the RCC, although advantageous for maintenance access and control, presented serious RF interference with sensitive spacelift and spacecraft operations. An attempt to install a trigger mechanism to preclude radiation at critical azimuths was initiated with limited success. The radar was required to be totally shut down on numerous occasions to eliminate the possibility of interfering with sensitive spacecraft operations and/or movements. It also presented a �cone of silence� in an area of primary thunderstorm development (Boyd et al., 2003).
Loss or restriction of the radar during weather critical portions of these operations was unacceptable, as was the cone of silence problem. This problem was a significant factor in the subsequent choice to locate the WSR 74C antenna on top of Building 423, at Patrick AFB in 1984. To supplement the AN/FPS-77 radar, dial-up capability to receive a digitized display of the Daytona Beach radar (WSR-57) was added prior to STS-4 in 1982. This dial-up capability was further expanded to include WSR-57 information from Tampa and Miami through the Integrated Storm Information System (ISIS) during the late 1980s.
In 1983, the ER installed a WSR-74C (5cm wavelength) weather radar to replace the FPS-77. There were several considerations in selection of the WSR-74C: (1) requirement to detect light precipitation, thus the 5cm wavelength choice, (2) minimization of ground clutter effects; a factor in the remote relocation of the antenna, (3) adaptation of volume scanning capability, (4) dependability; proven history of performance, and (5) ease of operation.
Relocation of the antenna solved the RF problem, but created new concerns. Communications, data processing, and relay to the remote site at Cape Canaveral became problems. A project was immediately started to incorporate a volume scan processor developed by McGill University to produce data sets from 24 elevation angles between 0.6 and 35.9 sampled over five minute intervals (Austin, et al., 1988). This upgrade included a local redesign of the radar pedestal to double the normal rotation rate of the radar. In 1987, the volume scan project was completed.
Two WSR-74C radar control and display consoles were installed, one for Range Weather Operations (RWO) located at CCAFS and one for the Applied Meteorology Unit (AMU) (Ernst et al., 1995). The transmitter/receiver antenna was located at Patrick Air Force Base (PAFB).
One significant shortfall of this volume scan processing system was the McGill equipment did not control the radar transmitter and receiver functions. This required the continued use of the original control consoles and remote control long-line equipment, which occupied much needed space in the ROCC. It was also the source of significant reliability problems. (These

shortfalls were resolved by installation of the IRIS/Open software in 1997, as discussed in following paragraphs). Data digitization allowed forecasters to construct and display Constant Altitude Plan Position Indicators (CAPPIs), vertical cross-sections, and echo tops, animate displays, and extract point information such as maximum tops and radial location. The CAPPI function is especially useful during launch countdowns to allow interrogation at any desired level.
In addition to the new capabilities, digital image files of CAPPIs, vertical cross-sections, and echo tops were created by the Central Processing System and sent to the Meteorological Interactive Data Display System (MIDDS) where they could be transmitted and integrated with satellite imagery and lightning detection displays and provided to the Spaceflight Meteorology Group.
The third of the first five nationally procured �NEXRAD� (WSR-88D) was installed at the Melbourne National Weather Service (NWS) Office in 1989. The ER has access to that NWS WSR-88D via three Principal User Processors (PUPs); one each located at the RWO and AMU at CCAFS, and one at the Patrick AFB weather station. Addition of the WSR-88D radar significantly enhanced operational capability because of the longer 10cm wavelength and accessibility of velocity vector information. However the volume scanning WSR-74C remained the radar of choice for operations because of its faster volume scan, ease of operation, enhanced customized displays, and total control by local operators. The WSR-88D�s chief contributions would be the identification and processing of severe weather predictors, radial wind data, and as a hot backup.
In 1997 a project was completed which upgraded the WSR 74C system to the IRIS/Open software (Boyd et. al., 1999). That system increased volume scan update rate from every five minutes to every 2.5-minutes. It is more user-friendly, customized local products make cross section development easier and provides the capability to display reflectivity over any user-defined range with user defined color-coding. These new features enable routine detection and display of weak reflectivity features such as nonprecipitating clouds and mesoscale boundaries (e.g. fine lines and sea or river breeze) close to the radar. Following each 2.5-minute volume scan build cycle, the system generates the following products, each available for display: Vertical Cross Sections, Maximum Reflectivity, Maximum Echo Top, Vertically Integrated Liquid (VIL), Track/Forecast Product Display (TRACK), Constant Altitude PPI (CAPPI), and Warn/Centroid Product Display (WARN).
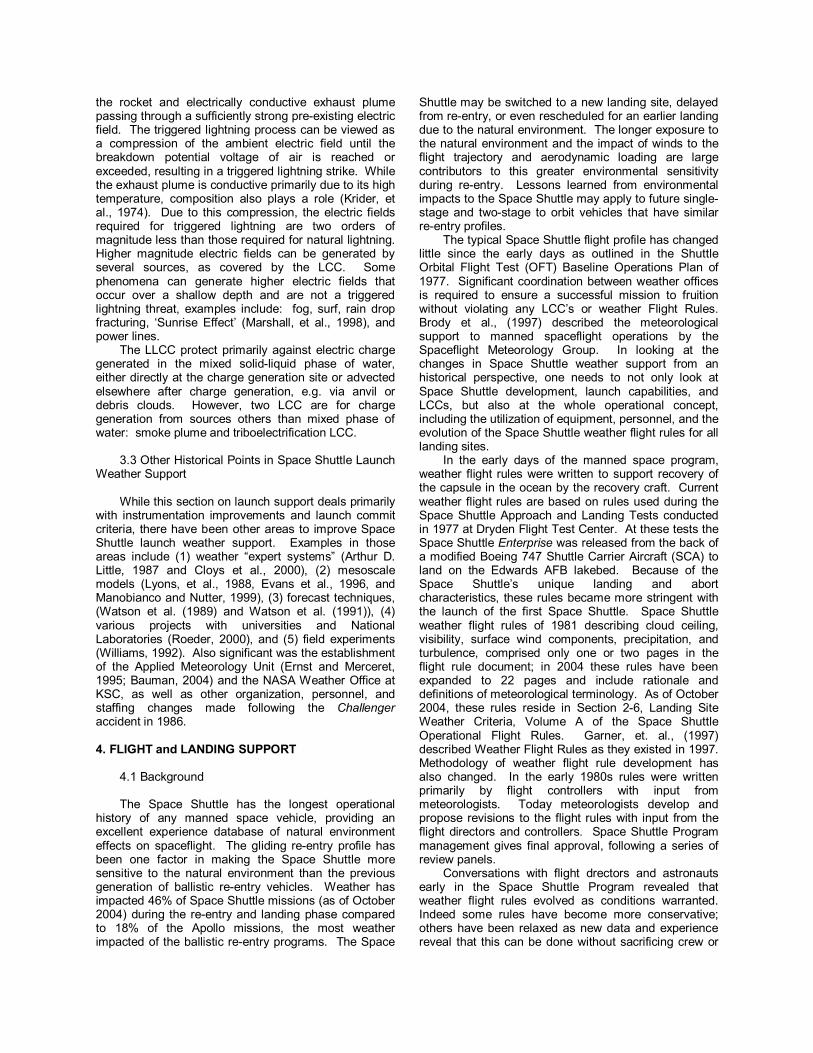
The volume scan strategy was refined in June 2000 by the AMU to better support operations (Short, et al., 2000). The new scan strategy (Figure 8) employed by the 45WS WSR-74C uses twelve elevation angles and maintains the 2.5-minute volume scan. This new scan strategy selection improved radar coverage 37% in the climatological 0°C to -20°C layer, where cloud electrification is generated. This scan strategy also improved Lightning LCC evaluation and lightning advisories as well as eliminating wasted beam overlap.
The new scan strategy was also designed to produce constant vertical gaps with range at a fixed altitude between half-beam-widths. This simplifies interpreting the radar products. The vertical lines in Figure 8 indicate the locations of the closest and most distant launch complexes relative to the radar. The line is thickened between 10 400 ft and 27 600 ft to emphasize the electrically important layer between the average 0°C height minus two standard deviations and the average -20°C height plus two stand deviations. The elevation angles are executed in the following order: 0.4°, 3.2°, 6.6°, 10.9°, 16.1°, 22.4°, 26.0°, 19.2°, 13.4°, 8.6°, 4.8°, and 1.8°. Furthermore, the interweaving of angles on an up/down cycle reduces bearing wear.
The Commercial-Off-The-Shelf (COTS) IRIS/Open software was upgraded in 2003 to take advantage of recent improvements to this COTS system.
0
5000
10000
15000
20000
25000
30000
35000
0
5000
10000
15000
20000
25000
30000
35000
Radar Beam Coverage: WSR-74C (Current Scan)26 22.4 19.1 16.1 13.4 10.9 8.6 6.6
4 .8
3.2
1.8
0.4
Elevation
0 10 20 30 40 50 60
Horizontal Range (nm)
SLC 17A SLC 39B
Fig. 8. Radar Scan Strategy.
3.1.5 Satellite and Display Systems At the start of the Space Shuttle program, local
meteorological sensors had their own unique stand-alone control and display capabilities. During routine daily operations at the Cape Canaveral Forecast Facility (CCFF), the forecasters received information from the sensors in a variety of ways ranging from CRT displays, teletype, and hard-copy form located throughout the facility. As much time was spent on assimilating and processing the data as in analysis of the data. The need for a local integrated, interactive display system became increasingly obvious. The problem was amplified during launch operations when the data had to be shared among several launch team members each with unique responsibilities. Increased manpower was a poor solution to the problem. However, rapidly expanding computer applications offered a far better solution.
The Air Force and NASA combined to fund the Meteorological Interactive Data Display System (MIDDS) in 1983 as described Erickson et al. (1985). The Space Science and Engineering Center (SSEC) at the University of Wisconsin-Madison submitted a proposal in August 1983 to build and install a MIDDS

based on their McIDAS system developed over the previous fifteen years. The proposal was accepted, funds appropriated, and notice to proceed given in early 1984.
In July 1984 the first remote workstation was installed in the Cape Canaveral Forecast Facility (CCFF) with a dedicated digital communications link to SSEC. In December 1984, a room designed to house the MIDDS IBM mainframe computers and peripherals, was completed on the 3rd floor of the Range Control Center (RCC) at CCAFS. During the following month, Jan 1985, full installation of an embedded IBM 4341 computer began. The system had four megabytes of real memory, 16 megabytes of virtual memory, two associated workstations (one located in the CCFF) consisting of video display with graphic overlay, alphanumeric CRT, keyboard, position control joysticks, command data tablet, and printer. The video had capability of displaying 64 image frames and 32 graphic overlays allowing multiple loops of satellite imagery both visible and infrared at various resolutions. Local datasets were provided via communication with the Cyber 740 located in the CCAFS Central Computer Complex (CCC). Local mesonet datasets consisted of average electric field (LPLWS), wind tower (WINDS), and cloud-to-ground lightning (LLP). Conventional North American meteorological data including surface and upper observations, forecasts, model output, and related text products were obtained via commercial vendor (FAA604) teletype line. Local upper air data from the MSS NOVA computer was also delivered to the 4341 via the Cyber 740 communications link. Peripherals included 3 Okidata 2350 printers, a Modgraph color copier, and 2 VGR 4000s with both Polaroid and 35mm capability.
Just as important as centralizing data display, was the improvement of satellite data display. Satellite imagery was first available via a 9600 bps DDS communications link with SSEC, then real-time GOES satellite ingest became operational with installation of two receiver/antenna on the roof of the RCC. Installation of a totally redundant MIDDS was completed in September 1986. Connectivity with Johnson Space Center in Houston was established to port information from the local mesonet, upper air files and radar into their common system. Connectivity was also established with the NASA Marshall Space Center at Huntsville, AL.
The CCFF was relocated from the ground floor to the 3rd floor of the RCC in mid 1985. Three workstations were installed in separate consoles; one dedicated to the duty forecaster, one for launch support, and one shared between launch operations and duty forecasting. They were named functionally: Forecaster, Launch Weather Officer (LWO), and Senior Weather Officer (SWO). Routines were developed using string tables, which enhanced forecaster applications and briefing capabilities. Although a data tablet was available, the command line was typically used for creating displays and file requests. The commands were complicated which limited their operational use for all except the more experienced. A simplified
programming capability using modified Basic language (McBASI) was designed and implemented by SSEC on the request of users at Cape Canaveral and Johnson Space Center. This enhanced capability rapidly led to local development of dozens of programs which allowed all forecasters to easily extract and format local datasets. The programs could be implemented by simple one or two word commands. One of the more notable allowed the user to extract the azimuth/range of any cloud-to-ground lightning strike relative to any input point. This particular application was imported into following system upgrades allowing lightning and wind information to be widely distributed. Others allowed the user to implement a myriad of forecast applications with a single keystroke. Launch briefing graphics and aids were developed using text files and string tables easily implemented by single keystrokes. Marshall Space Center also developed modifications of local McIDAS commands, which were incorporated at the CCFF; the most noteworthy was �JIMPLT�; it enhanced the capability to graph any meteorological parameter such as wind, or temperature. This command, integrated into the McBASI programs, had far reaching effects. It is used extensively to monitor user wind and temperature constraint criteria as well as upper air soundings and is integrated into all launch countdown briefings.
Direct link workstations were added at the observation site at the Kennedy Space Center Shuttle Landing Facility (SLF), the upper air facility on Cape Canaveral AFS, and the Patrick AFB Weather Station. A dial-in terminal was placed the Melbourne National Weather Service Facility.
Following the loss of AC-67 and the subsequent findings related to weather support and equipment, a plan to fully document, test and certify all weather systems, both hardware and software, including MIDDS, was implemented. The system configuration was frozen for operational testing in March 1988. Testing was performed on the redundant system. A Verification Test Plan (VTP) was developed and executed; over 450 commands were performed to exercise each function available in the system. A weather officer who could evaluate the resultant data for validity performed operation of the system during those tests. Results were summarized in a Verification Test Report (VTR) and submitted to the Software Review Board (SRRB). The SRRB recommendation of acceptance was presented to the System Operational Acceptance Board (SOAB) with final acceptance given in November 1988. The same acceptance procedures were followed for subsequent operational acceptance of future hardware and software upgrades.
An upgrade to IBM 4381 mainframes in 1990 increased computing speed and storage capacity and expanded available graphics and image frames from 64 to 128. Data from the local mesonet along with surface and upper air observations could be archived for user access for seven to ten days. The entire MIDDS was relocated from the RCC to the new Range Operations Control Center, ROCC, in April 1991. Three workstations were available along with a supplemental Wide World workstation. This supplemental
workstation, with expanded imagery capability used primarily for closed circuit television, remained until the upgrade to the McIDAS�X system.
Improvements to MIDDS have been limited since 1990, with planned replacement by the RSA Program (Wilfong et al., 2002). However, due to delays in RSA delivery, the IBM mainframes were replaced by the McIDAS-X distributed processing system in early 2000.
3.2 Launch Commit Criteria The danger of natural and triggered lightning has a
significant impact on space launch at the USAF�s ER at Cape Canaveral Air Station and NASA�s KSC. A total of 4.7% of the launches from 1 Oct 88 to 1 Sep 97 were scrubbed due to the Lightning Launch Commit Criteria (LLCC), and 35% were delayed due to the LLCC (Maier, 1999). The lightning LLCC are a set of 11 rules used to avoid the lightning threat to launches from ER/KSC. The cost of a scrub varies from $150,000 to over $1,000,000 depending on launch vehicle. Other impacts include possible delays in future launch schedules, and the human element of repeated stressful launch attempts.
The danger of rocket-triggered lightning was first recognized when Apollo 12 suffered two lightning strikes during its launch in 1969 (Durrett 1976). Fortunately, the mission was completed safely, although the Apollo spacecraft required some in-flight maintenance. Prior to Apollo 12 the only LLCC was for lightning within 10 NM (Poniatowski, 1987).
After Apollo 12, the first set of LLCC resembling the modern rules were based on inputs from a group of Atmospheric electricity scientists that met in association with NASA representative at the December 1969 AGU meeting and arrived at the following (which were put into affect for the Space Shuttle program):
Space vehicle will not be launched if nominal flight path will carry vehicle:
- Within 5 sm of a cumulonimbus (thunderstorm) cloud;
- Within 3 sm of anvil associated with a thunderstorm;
- Through cold front or squall line clouds which extend above ***10 000 ft;
- Through middle cloud layers 6 000 ft or greater in depth where the freeze level is in the clouds;
- Through cumulus clouds with tops at 10 000 ft or higher
NASA next used several special weather sensors during 1973-1975 to help launch high-visibility and/or short-window missions such as Skylab, Apollo-Soyez, and Viking. Some of the sensors were later implemented into routine operations: LDAR and LPLWS. Some were not institutionalized: X-band radar and airborne field mills (Nanevicz, et al., 1988). Even
*** English units instead of Metric units are used
here and in the Flight Rules section since the LCCs and weather Flight Rules are published and evaluated in English units.
though those sensors were not implemented into routine operations, their data proved useful in subsequent LLCC changes.
The above rules evolved into the following for Space Shuttle, as used in 1986:
No launch if vehicle path is: - Within 5 nm of a cumulonimbus cloud or the edge
of associated anvil cloud; - Within 5 nm of any convective cloud whose top
extends to �20° C isotherm with virga/precipitation; - Through any cloud where precipitation is
observed; - Through dissipating clouds in which the electric
field network has detected lightning within 15 minutes prior to launch;
- Through any cloud if ground level electric field at launch site is > +/- 1000 V/m.
The next major event in the LCC evolution was the 1987 Atlas/Centaur-67 (AC-67) accident. The AC-67 caused a triggered lightning strike, which disrupted the vehicle guidance electronics and caused an erroneous steer command (Busse, 1987). As the rocket turned sideways, aerodynamic loading caused it to break-up. Range Safety also sent a destruct command. Several studies and several working groups produced many LLCC recommendations (Heritage, 1988). As a result of all these competing, and sometimes disparate LLCC recommendations, the 45 WS and NASA Headquarters formed the Peer Review Committee (now Lightning Advisory Panel (LAP)) to advise the USAF and NASA on LLCC issues. This led to a major revision of the LLCC (Aerospace, 1988). Since AC-67, there have been no triggered lightning strikes to rockets launched using the modern LLCC.
The third major change to the LLCC was driven by the NASA sponsored airborne field mill experiments during 1990-1992. This led to upgraded LLCC in 1993. The most recent major LLCC revision was implemented in Jun 98. This change had two main goals: 1) increase safe launch opportunity via technical enhancements, and 2) enhance structure and wording to improve operational usability and ease training. The 45 WS provided detailed feedback on LLCC to the Lightning Advisory Panel (LAP), including specific ambiguities encountered while trying to interpret LLCC during launch countdowns and recommendations for improvement. LAP compiled results from new research into atmospheric electric fields to revise the LLCC.
Examples: - Extensively revised Anvil rules. Examples: Wrote
separate sets of rules for attached and detached anvils. Established standoff distances based on history of cloud and time since last lightning.
- Made extensive use of cloud transparency and field mills to safely relax LLCC.
- Identified cold Cirrus (<-15° C), which originated from non-convective clouds as not in violation of Thick Cloud rule, e.g. winter jet stream Cirrus.
- Added distance from flight path beyond which clouds connected to �thick cloud� are no longer a hazard.
Most of the LLCC are for triggered lightning. Triggered lightning is an electrical discharge caused by
the rocket and electrically conductive exhaust plume passing through a sufficiently strong pre-existing electric field. The triggered lightning process can be viewed as a compression of the ambient electric field until the breakdown potential voltage of air is reached or exceeded, resulting in a triggered lightning strike. While the exhaust plume is conductive primarily due to its high temperature, composition also plays a role (Krider, et al., 1974). Due to this compression, the electric fields required for triggered lightning are two orders of magnitude less than those required for natural lightning. Higher magnitude electric fields can be generated by several sources, as covered by the LCC. Some phenomena can generate higher electric fields that occur over a shallow depth and are not a triggered lightning threat, examples include: fog, surf, rain drop fracturing, �Sunrise Effect� (Marshall, et al., 1998), and power lines.
The LLCC protect primarily against electric charge generated in the mixed solid-liquid phase of water, either directly at the charge generation site or advected elsewhere after charge generation, e.g. via anvil or debris clouds. However, two LCC are for charge generation from sources others than mixed phase of water: smoke plume and triboelectrification LCC.
3.3 Other Historical Points in Space Shuttle Launch
Weather Support While this section on launch support deals primarily
with instrumentation improvements and launch commit criteria, there have been other areas to improve Space Shuttle launch weather support. Examples in those areas include (1) weather �expert systems� (Arthur D. Little, 1987 and Cloys et al., 2000), (2) mesoscale models (Lyons, et al., 1988, Evans et al., 1996, and Manobianco and Nutter, 1999), (3) forecast techniques, (Watson et al. (1989) and Watson et al. (1991)), (4) various projects with universities and National Laboratories (Roeder, 2000), and (5) field experiments (Williams, 1992). Also significant was the establishment of the Applied Meteorology Unit (Ernst and Merceret, 1995; Bauman, 2004) and the NASA Weather Office at KSC, as well as other organization, personnel, and staffing changes made following the Challenger accident in 1986.
4. FLIGHT and LANDING SUPPORT
4.1 Background The Space Shuttle has the longest operational
history of any manned space vehicle, providing an excellent experience database of natural environment effects on spaceflight. The gliding re-entry profile has been one factor in making the Space Shuttle more sensitive to the natural environment than the previous generation of ballistic re-entry vehicles. Weather has impacted 46% of Space Shuttle missions (as of October 2004) during the re-entry and landing phase compared to 18% of the Apollo missions, the most weather impacted of the ballistic re-entry programs. The Space
Shuttle may be switched to a new landing site, delayed from re-entry, or even rescheduled for an earlier landing due to the natural environment. The longer exposure to the natural environment and the impact of winds to the flight trajectory and aerodynamic loading are large contributors to this greater environmental sensitivity during re-entry. Lessons learned from environmental impacts to the Space Shuttle may apply to future single-stage and two-stage to orbit vehicles that have similar re-entry profiles.
The typical Space Shuttle flight profile has changed little since the early days as outlined in the Shuttle Orbital Flight Test (OFT) Baseline Operations Plan of 1977. Significant coordination between weather offices is required to ensure a successful mission to fruition without violating any LCC�s or weather Flight Rules. Brody et al., (1997) described the meteorological support to manned spaceflight operations by the Spaceflight Meteorology Group. In looking at the changes in Space Shuttle weather support from an historical perspective, one needs to not only look at Space Shuttle development, launch capabilities, and LCCs, but also at the whole operational concept, including the utilization of equipment, personnel, and the evolution of the Space Shuttle weather flight rules for all landing sites.
In the early days of the manned space program, weather flight rules were written to support recovery of the capsule in the ocean by the recovery craft. Current weather flight rules are based on rules used during the Space Shuttle Approach and Landing Tests conducted in 1977 at Dryden Flight Test Center. At these tests the Space Shuttle Enterprise was released from the back of a modified Boeing 747 Shuttle Carrier Aircraft (SCA) to land on the Edwards AFB lakebed. Because of the Space Shuttle�s unique landing and abort characteristics, these rules became more stringent with the launch of the first Space Shuttle. Space Shuttle weather flight rules of 1981 describing cloud ceiling, visibility, surface wind components, precipitation, and turbulence, comprised only one or two pages in the flight rule document; in 2004 these rules have been expanded to 22 pages and include rationale and definitions of meteorological terminology. As of October 2004, these rules reside in Section 2-6, Landing Site Weather Criteria, Volume A of the Space Shuttle Operational Flight Rules. Garner, et. al., (1997) described Weather Flight Rules as they existed in 1997. Methodology of weather flight rule development has also changed. In the early 1980s rules were written primarily by flight controllers with input from meteorologists. Today meteorologists develop and propose revisions to the flight rules with input from the flight directors and controllers. Space Shuttle Program management gives final approval, following a series of review panels.
Conversations with flight drectors and astronauts early in the Space Shuttle Program revealed that weather flight rules evolved as conditions warranted. Indeed some rules have become more conservative; others have been relaxed as new data and experience reveal that this can be done without sacrificing crew or

vehicle safety. This is evident if one compares the basic rules for ceiling, visibility, wind, and weather from the early 1980s to the present. The ceiling limits have been relaxed and lowered as crew members became trained and familiar with these lower limits. Ceiling limits at the various landing sites have been modified eight times in the history of the Space Shuttle Program. Visibility limits have been modified six times. Surface wind conditions have been modified eleven times. The precipitation and thunderstorm rule has been modified a total of eleven times, and continues to be one of the most difficult rules to evaluate properly.
4.2 Mission Profile and Landing Types Sections 2 and 3 outlined the Space Shuttle
development and launch support. The weather LCCs used by the Launch Weather Officer to advise the Launch Director at KSC of launch pad and ascent trajectory weather are critical to this support. This section deals with the remainder of the Space Shuttle Flight Profile from �clearing the pad� through �wheels stop� (see Figure 9) where weather flight rules are used to advise the Mission Control Center (MCC) Flight Director at JSC of contingency and Nominal End Of Mission (EOM) landing site weather constraints. These rules are evaluated for various landing sites, which would be used in an abort contingency should an in-flight emergency occur prior to reaching orbit or during the early stages of the mission, and for nominal EOM conditions. Also, the evolution of weather support for the various landing sites as it relates to equipment and personnel will be discussed.
Various abort landings include: Return To Launch Site (RTLS), East Coast Abort Landing (ECAL) Transoceanic Abort Landing (TAL), Abort Once Around (AOA), first day Primary Landing Site (PLS), Emergency Landing Site (ELS), Augmented Contingency Landing Site (ACLS), and End Of Mission (EOM). In addition, there are under-burn and over-burn sites downrange of the orbiter�s trajectory; these could be required should an abnormal de-orbit burn occur. Forecasts for all of these landing site options are made available routinely to the MCC.
The contingency abort landing table, which is built into the Space Shuttle�s onboard software load, lists numerous sites around the world. For STS-1, STS-2, and STS-3 there was no designated Transoceanic Abort Landing (TAL) site. However, Rota, Spain was designated as an abort landing site. Kadena (KAD), Guam (RODN) and Honolulu, Hawaii (KHNL) were used as contingency landing sites in addition to the Shuttle Landing Facility at KSC, Florida, Edwards AFB (EDW), California, and Northrup Strip (NOR), New Mexico. For STS-4 Dakar, Senegal was listed as the TAL site and continued to be the primary low inclination TAL site until the Challenger accident in January 1986. Zaragoza and Moron, Spain were designated as TAL sites, as well, when high inclination missions were flown. For Return To Flight after the Challenger accident, Ben Guirer, Morocco and Banjul, The Gambia, were added to the TAL site list. When the treaty with Senegal expired, Banjul replaced Dakar as a TAL site and was used for all low inclination missions until it was deactivated in 2002.
Fig. 9. Typical Shuttle Mission Profile (NASA, 1977).

In 1981 Emergency Landing Sites (ELS) were Honolulu, Hawaii, and Kadena, Guam, as well as the three CONUS Sites of KSC, EDW, and NOR. From 1988 the list was increased to roughly twenty sites around the world.
In October 2004 preparations are underway to activate yet another TAL site in Istres, France.
4.3 Operations, Equipment, and Personnel Since the beginning of the Space Shuttle Program,
weather has played a critical role in Space Shuttle operations. Providing weather information to shuttle crews and flight controllers has evolved steadily as new technologies have developed. The OFT Flight Operations Baseline Operations Plan described the task of the initial Spaceflight Meteorology Group in the MCC. SMG was to monitor and evaluate weather at the various Space Shuttle landing sites around the world. At that time the NESR was located on the third floor of the MCC. SMG undertook the responsibility of flight rule evaluation and forecasting for Space Shuttle landings, outfitted with the following equipment: (1) two facsimile machines to receive maps from the National Meteorological Center, (2) a Continental Meteorological Data System (COMEDS) terminal to receive various teletype weather bulletins, Terminal Aerodrome Forecasts (TAFs) and surface and upper air observations, (3) a UNIFAX satellite receiver, (4) a Closed Circuit Television (CCTV) system, (5) a weather radar display (CRT) with drops from Galveston and Daytona Beach Radars, and (6) a voice loop cabinet to house the MCC CCTV displays, the MCC clock, and the key set for communicating with the flight control team. The staff consisted of a Meteorologist-In-Charge (MIC), one forecaster and two Meteorological Technicians (Met Tech).
Three CONUS landing sites during early missions were used with forecasts issued for each landing opportunity for each site. Forecasts were hand-written and delivered to the control room via a pneumatic tube system. Weather briefings were conducted after each control team handover utilizing the CCTV system. The OFT Flight Operations Baseline Operations Plan stated that the Natural Environments Support Room (NESR) would receive and analyze weather information on the (Contingency Landing) airfields, which would be passed to the crew by the control team.
During the early days of Space Shuttle operations, procedures were developed as requirements became apparent. Continuous weather flight support coverage began at Launch minus 2 (L-2) days and continued through End Of Mission (EOM). The Launch minus 1 (L-1) Day activities, including the Flight Director�s and Crew Weather Briefing, were developed to allow for a �dry-run� in the launch count. It also sensitized the entire team for any expected changing weather conditions. While on-orbit, the Crew and Flight Control Team required weather forecasts for each ELS (including the three primary CONUS landing sites) around the world. Landing sites were KSC, NOR, EDW, HNL, and KAD. Weather forecasts for each emergency
landing opportunity were issued during each 8-hour shift and briefed to the flight controllers via CCTV. �Block Weather�, which consisted of forecasts for all landing sites, was updated twice daily and uplinked to the crew. These forecasts were necessary because continuous communications with the orbiter was not available. In the event of an on-orbit emergency and a loss of communications, the orbiter crew would be able to select a reasonably safe ELS for landing based on the forecast weather conditions. With the completion of the Tracking Data and Relay Satellite System (TDRSS) constellation in the early 1990s, communication with the Space Shuttle crew became almost continuous and the requirement to have onboard weather forecasts for emergency landing sites became obsolete. In addition, the Mission Management Team (MMT) was briefed each day for the following three sets of landing opportunities, using hand-drawn weather charts and hand-written forecasts.
The National Weather Service�s Automation of Field Operations and Services (AFOS) consoles were added to SMG�s operation in late 1970s, when the NESR was moved to the 2nd floor Lobby Wing of Building 30. The staff was increased to a total of five lead forecasters in 1984 in response to the proposed Space Shuttle schedule of 20 flights per year. Additional equipment was installed, as well. Similar forecast integration problems described earlier in this paper at the CCAFS were occurring at SMG. The ability to collect, analyze, and display the variety of data became a significant operational problem as more landing sites and data sets were added to the mix. The site survey for the JSC Meteorological Information Data Display System (MIDDS), a McIDAS based weather information system developed by the Space Science Engineering Center at the University of Wisconsin was conducted in the spring 1984. A remote workstation from the CCAFS MIDDS was provided to SMG in 1985 and used in mission support. Installation of the JSC MIDDS (Rotzoll, 1991) occurred in 1987. Also in 1987, the SMG Techniques Development Unit (TDU) was created with a staff of three meteorologists. Real-time digital satellite imagery was made available through the JSC MIDDS and used in mission support in 1988 when the Space Shuttle Returned To Flight after the Challanger accident. Local data sets from KSC, EDW, and WSSH became available as wind tower networks were established at EDW and NASA towers added at WSSH. Access to gridded numerical model data became available in the early 1990s and application software development was begun to further adapt the MIDDS system for use in mission support.
Data at the TAL sites increased for the Return To Flight after the Challenger accident in January 1986, as well. Automated weather observing towers and Radio Theodolite Upper Air Equipment were added and upper air data from the TAL sites was made available for the first time. Prior to this time, the nearest raob site was used to develop upper wind forecasts at the TAL sites.
A sixth Lead Forecaster and an Administrative Assistant were added to the staff in 1990. By 1992, SMG had a staff of one Meteorologist-In-Charge, seven
Lead Meteorologists, four TDU Meteorologists, and an Administrative Assistant. The staffing was reduced in 1994 to 11 with the loss of one lead Meteorologist and one TDU Meteorologist due to budget cuts within NASA and a lower-than-expected Space Shuttle flight rate.
Early briefing resources consisted of black and white CCTV dissemination of Geosynchronous Orbiting Environmental Satellite East (GOES-E), GOES-West (GOES-W), and the European Meteorological Satellite (METEOSAT) facsimile images and hand-drawn weather forecast charts for each landing site. Hard-copies of these products with handwritten forecasts on the astronaut crew�s Ascent Checklist weather sheets were faxed to the astronaut crew at the Crew Quarters at the Kennedy Space Center (KSC) prior to launch.
Animation of satellite images became available when the SMG obtained a remote workstation from the USAF Weather Facility at the Cape Canaveral Air Force Station. This information proved extremely useful to SMG forecasters and flight controllers, and allowed the entire Mission Control Center Team to better visualize weather systems influencing the weather decisions in the launch and landing counts.
Many Space Shuttle support procedures were revisited prior to Return to Flight following the January 1986 Challenger accident. Major changes included the acquisition of the JSC MIDDS, which not only allowed animation of satellite imagery in real-time, but also brought into practice the use of computer generated forecast charts. A separate surface winds display was developed which retrieved and displayed five (5) minute wind speed and direction data from the three CONUS landing sites using the remote wind tower networks at each of these sites. This display, located in SMG and at the Flight Directors (FD) console, allowed real-time read-outs of wind speed and direction with computations and displays of crosswind, headwind, and tailwind components for each sensor and runway. Digital Voice equipment was installed that allowed more flexibility in voice communication with the MCC.
The move from the SMG�s cramped operations area in the Building 30 Lobby Wing to the 2nd floor Building 30M occurred in 1992. MIDDS workstations were upgraded to PS2 terminals. This move resulted in several upgrades and improvements in weather dissemination, as well. While losing the direct CCTV capability, a video converter and a 10x10 video switcher were added to allow color weather images and graphics to be distributed to the MCC and remote sites including the Crew Quarters at KSC. This capability allowed a monitor to be dedicated for displaying current observations and forecast updates to flight controllers during the launch and landing counts. Additionally, electronic transfer of upper air data using output from a MIDDS based text editor began (Myers et al, 1993). Upper wind forecasts were disseminated using the same interface, and an attempt was made to uplink these landing wind forecasts to the Crew while on-orbit for landing simulations. Access to the NEXt generation RADar (NEXRAD) data became available in 1992 when the NEXRAD Principle Users Processor (PUP) from the League City, Texas radar was added to SMG�s
equipment roster. Data from the Melbourne, Florida NEXRAD was connected to SMG�s PUP and greatly increased SMG�s ability to monitor and track precipitation and winds in the KSC area.
SMG began issuing all forecast products electronically in 1995. Since then the process has gone through several iterations to reach the existing process of generating forecasts in the Mission Support Forecast Editor (MSFE) in MIDDS and distributing the products to a variety of users via the world-wide-web, the MCC Administrative Local Area Network (LAN), and email.
Migration from the mainframe computer to a UNIX-based distributed processing system occurred in 1995 and early 1996, just after the new Mission Control Center (MCC) was built. Rapid prototyping was used to quickly integrate the new UNIX-based MIDDS workstations into operations, without risking a degradation of existing capabilities. The configuration also ensured compatibility with the new MCC UNIX-based environment. Remote displays with a suite of weather products for the Flight Director and CAPCOM consoles were developed.
SMG acquired a WFO-configured Automated Weather Information Processing System (AWIPS) in 2000. Since then much effort has been done to import the various worldwide data sources into AWIPS Localizations for the three CONUS landing sites, the TAL sites, and JSC have been created to better access and display these data sets. Unique maps required for Space Shuttle support have been created to display various landing trajectories for weather Flight Rule evaluation. Various local applications have been created or ported from MIDDS to AWIPS, as well. In addition, access to numerical model data has increased and local meso-scale models are being run over KSC and the TAL sites. Plans are to expand this process to the remaining CONUS sites in the near future.
4.4 Weather Flight Rule Evolution Weather Flight Rules have evolved since the early
days of Space Shuttle operations. Flight Rules for the Shuttle Approach and Landing Test in 1977 (NASA, 1977) listed required meteorological conditions for safe and successful tests. These conditions included cloud ceilings and cloud cover below the mated vehicles, Surface wind components, visibility, precipitation, and turbulence. These criteria were the beginnings of the Shuttle Operational Flight Rules, and were modified as needed, as preparations for the operational Space Shuttle proceeded.
Current flight rules state that the Flight Rules �outline preplanned rules decisions designed to minimize the amount of real-time rationalization required when non-nominal situations occur from the start of the Terminal Countdown through Crew Egress or ground support equipment (GSE) cooling activation, whichever occurs later.� The weather portion of the Shuttle Flight Rules is no exception. Additionally, Shuttle weather decision authority is outlined in the STS flight rules (NASA, 2004) under section A1-8, which states:

A. The Johnson Space Center (JSC) Mission Control Center (MCC) is responsible for launch abort landing and End-Of-Mission (EOM) weather decisions and associated recommendations to the Mission Management Team (MMT) chairman. B. The Kennedy Space Center (KSC) Launch Director is responsible for the launch decision for weather acceptability at the launch pad for ascent trajectory and associated recommendations to the MMT Chairman.
This philosophy began in the early Space Shuttle days and continues to the present. The STS-1 Flight Rules stated under Section 1-18: �The Flight Director is responsible for calling a �HOLD� for all problems that jeopardize the ability to safely monitor and recover the orbiter and crew after launch. This includes problems in the following areas: MCC, GSTDN (Ground Spacecraft Tracking and Data Network), LANDING AREA FACILITIES, and WEATHER.�
Weather Flight Rules for STS-1 (March, 1981) were included in Section 4-32, Landing Conditions for Edwards AFB, Northrup Strip, and KSC. Part A of this section lists the necessary meteorological conditions, which were: cloud cover less than 5/10, visibility 7 miles or better, surface wind break-down of 25 kts or less head wind and 10 kts or less cross wind and tailwind, no precipitation, no more than light to moderate turbulence, and no thunderstorms within a 10 nm radius of the landing site or within 5 nm of the approach path below 60 000 ft. Also, a weather reconnaissance flight was required to evaluate various handling characteristics and slant range visibility.
In June 1981 these rules were reorganized, but carried the same content as the STS-1 weather Flight Rules. Also, a surface wind gust limit of 5 kts or less was added in this revision.
In May 1982 planned (Nominal EOM) versus contingency (RTLS, TAL, AOA, 1st day PLS, and Block Data Landing Sites) de-orbit opportunities were defined and different cloud ceiling and visibilities were set for each.
When STS-4 flew in June 1982 the weather rule was renumbered and became Section 4-55, Landing Conditions for Planned and Contingency De-Orbit Opportunities.
The surface wind components breakdown established a 15 kt crosswind limit for concrete runways versus a 20 kt crosswind limit for lakebed runways and the new avoidance limits were established at a 2 nm clearance above and a 5 nm horizontal clearance from any thunderstorm, precipitation, or any cloud with radar echo.
For STS-8 in August 1983, a cloud ceiling limit of 20 000 ft was established, the crosswind limit for a concrete runway was lowered to 10 kts and the tailwind limit was raised to 15 kts. Thunderstorms and lightning became an issue during the launch count of STS-8 causing a 17 minute delay, and the terminology of �no thunderstorms within 30 nm� was used for the first time in the flight rules. STS-8 marked the first night launch and landing of the Space Shuttle.
For STS-9 (September 1983) the cloud ceiling limit was lowered to 15 000 ft, avoidance of convective clouds with tops colder than � 20° C was added to the thunderstorm avoidance section, the tailwind limit was dropped back to 10 kts, and a night crosswind limit of 10 kts was added. The rule was renumbered to 4-54.
The rules for STS-41-B (February 1984) added a crosswind table and designated the day and night limits for a KSC or NOR landing to be 12 kts. STS-41-B marked the first KSC Space Shuttle landing.
By March 1984 (STS-41-C) the EOM crosswind limit for KSC was lowered to 8 kts. For the first attempt of STS-41-D (April 1984) the gust rule limit was raised to 8 kts.
In October 1984 due to some concerns of fog developing at KSC after an attempted landing of STS-41-DR, a 3° F dew point temperature rule was added by the Ascent / Entry Flight Director. Also, the thunderstorm �exclusion zone� for EOM at KSC was a circle extended out to 50 nm around the SLF.
In January 1985 the cloud ceiling limit for EOM and any contingency landing site with a Microwave Landing System (MLS) was lowered to 8000 ft and visibility limits for any contingency landing site with an MLS were lowered to 5 nm. Also, the EOM crosswind limits for KSC and NOR were lowered back to 10 kts.
The nighttime crosswind limit at EDW was lowered to 10 kts in June 1985.
During the STS-51-I launch count and after several delays, a trajectory overlay for radar data was created and used for the first time to evaluate the precipitation and thunderstorm rule. Figure 10 depicts this overlay for a low inclination RTLS landing. The dashed-line boundary within the 20 nm circle depicts the thunderstorm avoidance horizontal distance and the numbers along each approach path depict the altitude in thousands of feet of the orbiter. Thus, any thunderstorm within the boundary would have to be avoided by a 2 nm
Fig. 10. First Thunderstorm Overlay.

vertical distance. By October 1985 the weather rules stated that consideration would be given to exposure to light to moderate precipitation during RTLS. In December 1985, the weather rule was renamed and renumbered as Section 4-57 Landing Site Weather Criteria.
After the Challenger accident in January 1986, all aspects of mission support including the Flight Rules were reexamined. By April 1987 flight rule rationale began to be added to the document. Landing Site Weather Criteria was renumbered to Section 4-64. A Weather Rules Workshop was conducted at JSC in October 1987. The dew point temperature rule was deleted and avoidance of any precipitation was re-instituted. In addition, clear approaches to both prime and backup runways (except the pre-launch evaluation of the 1st day PLS) were required.
The rain shower �racetrack� and thunderstorm �keyhole� overlays were added to Section 4-64 in January 1989. Figure 11 is a graphic depiction of this �keyhole� overlay used to evaluate thunderstorm proximity. Also, the RTLS rain shower exception rule was introduced, as was the avoidance of detached opaque thunderstorm anvil cirrus and showers with cloud tops colder than -10° C.
In February 1990 the TAL and AOA ceiling and visibility limits were combined into the EOM limits for sites with MLS, and were lowered to 8000 ft ceilings and 5 nm visibility.
In July 1990 the requirement for low level measured winds and atmospheric data was added to section 4-64, specifically for Descent Analysis. (Upper air data listed in Section 4-1 had been required since STS-1 for launch to assess the wind load analysis.) Also, the surface wind gust limit was raised to 10 kts.
Fig. 11. First Thunderstorm Keyhole (NASA, 1989).
The Weather Coordinator, a position staffed by an astronaut and used to support the Space Shuttle Program Manager during the launch count, was responsible for creating the first combined weather rules table in August 1990. The table was later updated in July 1991 and eventually was incorporated into the Weather Flight Rules. By October 1992 new landing limits for KSC were introduced for peak winds less than or equal to 20 kts from any direction, cloud ceilings equal to or above 10 000 ft, and 2/10 or less cloud cover below 10 000 ft. The tailwind limit was listed as less than or equal to 10 kts �steady state� and less than or equal to 15 kts �peak�. The crosswind limit was raised to 15 kts and the crosswind limits for Extended Duration missions (missions which exceed a specified time limit) was established at 12 kts or less. The 2/10 cloud rule at KSC resulted from an Ascent/Entry Flight Techniques Panel (A/EFTP) report of SMG�s daily forecast verification, which assessed that forecasting cloud ceilings at 90 to 120 minutes for EOM was one of SMG�s major forecast problems.
A massive rewrite of the weather flight rules began in early 1994. By January 1995, a new set of rules had been revised and moved into section A2-6. This rewrite included tables and trajectory overlay graphics, which added clarity to the weather rules evaluation. There were 17 pages in the new Section A2-6, Landing Site Weather Criteria.
By May 1995 the RTLS cloud ceiling and visibility limits were reduced to 5000 ft and 4 nm in an attempt to gain launch probabilities in preparation for the building of the International Space Station (ISS).
A year later revised thunderstorm and precipitation overlay graphics were introduced. Figure 12 is one example of these new graphics. Avoidance of showers with tops colder than + 5° C and with radar reflectivity greater than 30 dbz was added to the precipitation portion of the rule on recommendation from the NASA Lightning Advisory Panel. A limit of 17 kts cross wind
Fig. 12 Final Thunderstorm Overlay (NASA, 1996).

with the Shuttle Training Aircraft (STA) �Go� recommendation was added to the winds section. The Extended Duration Mission length was defined as Flight Day (FD) 17 or greater. This definition became important since the crosswind limit was lowered for long-duration (Extended Duration) missions.
In June 1996 the Landing Site Weather Criteria was given a new number of A2.1.1-6 and comprised 32 pages in length.
In August 1996 the 2/10 cloud rule at KSC was relaxed and used as a guideline instead of a rule. By May 1997 the cloud ceiling and visibility limits for TAL were revised to 5000 ft and 5 nm and the AOA limits were lowered to 8000 ft and 5 nm. Again, this was done to increase launch probability. Also, the Extended Duration mission was defined as the Mission Commander�s (CDR�s) FD 19 or above, which further defined the crosswind limit.
In April 1999 definitions for radial and lateral limits were added to the expanded thunderstorm/precipitation section of the rules. Only two runway approaches were listed as required and the section for avoiding cumulus clouds attached to a smoke plume produced by a fire was added. In addition, the ACLS / ECAL / ELS limits were further defined.
In June 2002 the section was moved to Section A2-6 comprising 33 pages. In June 2004 a rewrite of the RTLS rainshower exception rule was proposed with a meteorological definition section added, and the cumbersome thunderstorm trajectory graphics deleted.
Modifications for the RTLS and TAL rainshower rule continue in late 2004 in preparation for the Return To Flight following the Columbia accident.
4.6. Meteorological Impacts to Landing A review of observed weather since February 1994
at possible landing times during actual Space Shuttle mission operations shows that proximity of precipitation to the landing site has been the most frequent unacceptable weather phenomena. Low cloud ceiling is the second most frequently observed unacceptable weather. Verification of landing weather forecasts issued by the SMG shows that cloud ceiling height forecasts are the least skillful weather element forecast. This is not too surprising since cloud ceiling limits for the Space Shuttle are set relatively high compared to general aviation requirements and forecast techniques for short-term cloud ceiling height are limited.
Prior to the construction of the International Space Station (ISS) many Space Shuttle launches and landings were planned for the early morning hours at the Kennedy Space Center. This provided a favorable climatology for landing. Launch time and subsequent landing times for missions that rendezvous with the ISS are dictated by orbital mechanics so Space Shuttle missions could no longer take advantage of favorable landing time climatology. This is particularly evident in regard to crosswinds. Prior to the advent of ISS rendezvous missions the Space Shuttle had never been delayed from landing at the Kennedy Space Center due to crosswinds. Since ISS missions began crosswinds
have prevented or impacted KSC landings during 6 missions (13 landing attempts).
5. FERRY FLIGHT SUPPORT
An important area of Space Shuttle weather support not covered in this paper is Ferry Flight. A brief summary of that support is quoted as follows, from the introduction of a paper by Priselac et al. (1997)
The Space Shuttle is very sensitive to ambient weather conditions and weather support is extremely critical, especially after the Orbiter lands at locations other than the principal landing site at Kennedy Space Center (KSC). Weather concerns range from condensation in any of the Orbiter steering jets (causing degradation of on-orbit steering due to refreeze of moisture in space) to rain, lightning, wind, and exposure to severe thunderstorms. Continued outside exposure is of special concern, since there is no hangar large enough to house the mated Orbiter and modified Boeing 747 Shuttle Carrier Aircraft (SCA) which, combined, measure 230 ft long, 195 ft wide, and 77 ft high. Ferry processing entails the longest exposure to the elements. When a Shuttle lands at Edwards AFB, CA (EDW), servicing and preparations for Ferry begin and normally last six days. Then, depending upon weather conditions, Ferry begins on day seven. In addition, Space Shuttles are periodically returned to the Rockwell plant in Palmdale CA for refurbishment. Thus, Shuttles are ferried both east and west across the United States, under very demanding weather specifications.�
6. SUMMARY
Melding the science of meteorology and the needs
of the Space Shuttle community into useable information is an ongoing process.
The Space Shuttle development and operations have benefited from (1) coordinated and consistent definitions of the natural (terrestrial and space) environment design requirements and their interpretation, (2) monitorship of the various engineering analyses involving the natural environment, (3) improved and new measurement systems, (4) careful monitoring of conditions existing prior to launch, ascent, on-orbit, entry, and landing, (5) guidance from specialized and tailored weather forecasts based on the operational and range safety constraints for the Space Shuttle. Therefore, the operational capability, and thus performance, of the Space Shuttle regarding the natural environment design inputs relative to the program�s mission requirements has been excellent. This was achieved by the dedication of many people within NASA, U.S. Air Force, NOAA and their associated contractor teams.
This paper describes the weather support evolution of one of man�s most complex machines and operations. As of October 2004 the Space Shuttle is preparing to fly another 30 or so missions before it is retired. Development of the Crew Exploration Vehicle (CEV) will help prepare for future space exploration. Ideally, lessons learned with the Space Shuttle will be

used in the development and operation of this and future spacecraft.
7. ACRONYMS 45WS 45th Weather Squadron AC-67 Atlas Centaur - 67 ACLS Augmented Contingency Landing Site A/EFTP Ascent/Entry Flight Techniques Panel AFCCC Air Force Combat Climatology Center AFOS Automation of Field Operations and Services ALDF Advanced Lightning Direction Finder AMPS Automated Meteorological Profiling System AMU Applied Meteorology Unit AOA Abort Once Around AWIPS Advanced Weather Information Processing System CAPCOM Capsule Communicator CAPPI Constant Altitude Plan Position Indicator CCAFS Cape Canaveral Air Force Station CCTV Closed-circuit Television CDR Mission Commander CEV Crew Exploration Vehicle CGLSS Cloud-to-Ground Lightning Surveillance System CLS Contingency Landing Site COTS Commercial-off-the-shelf COMEDS Continental U.S. Meteorological Data System CONUS Continental United States CPS-9 Early 3 cm Radar DF Direction Finder DRWP Doppler Radar Wind Profiler ECAL East Coast Abort Landing ED Extended Duration EDW Edwards Air Force Base ELS Emergency landing Site EOM End Of Mission ER Eastern Range FD Flight Day or Flight Director FELTS Federal Evaluation of Lightning Tracking System FPS-77 US Air Force and Navy Radar GMD Ground Meteorological Device GOES Geosynchronous Orbiting Environmental Satellite GPS Global Position Satellite GSE Ground Support Equipment GSTDN Ground Spacecraft Tracking and Data Network HNL Honolulu, HI HRFE High Resolution Flight Element IMPACT Improved Accuracy from Combined Technology ISS International Space Station JSC Johnson Space Center KAD Kadena, Guam KSC Kennedy Space Center
LAN Local Area Network LDAR Lightning Detection and Ranging LCC Launch Commit Criteria LLCC Lightning Launch Commit Criteria LLP Lightning Location Protection LPLWS Launch Pad Lightning Warning System LRFE Low Resolution Flight Element LST Local Standard Time LWO launch Weather Officer Max-Q Maximum dynamic pressure MCC Mission Control Center McIDAS Man-computer Interactive Data Analysis System MDF Magnetic Direction Finder METEOSAT European Meteorological Satellite MFFG medium filter/first guess MIC Meteorologist In Charge MIDDS Meteorological Interactive Data Display System MLS Microwave Landing System MMT Mission Management Team MSFC Marshall Space Flight Center MSFE Mission Support Forecast Editor MSS Meteorological Sounding System NASA National Aeronautics and Space Administration NASA-HDBK NASA Handbook NESR Natural Environments Support Room NEXRAD Next Generation Radar - Doppler NLDN National Lightning Detection Network NOAA National Oceanic and Atmospheric Administration NOR Northrup Strip NRC National Research Council OFT Orbital Flight Test PAFB Patrick Air Force Base PLS Primary Landing Site PPI Plan Position Indicator PUP Principle User Processor QC Quality Control RASS Radio Acoustic Sounding System RATS Radio Theodolite System RF Radio Frequency ROCC Range Operations Control Center RSA Range Standardization and Automation RTC Range Technical Services RTLS Return To Launch Site RWO Range Weather Operations SLF Shuttle Landing Facility SMG Spaceflight Meteorology Group SPS Signal Processing Subsystems SRRB Software Review Board STA Shuttle Training Aircraft STS Space Transportation System TDU Techniques Development Unit TAL Transoceanic Abort Landing TDRSS Tracking and Data Relay Satellite System TOA time of arrival TRACK Track/Forecast Product Display

USAF United States Air Force VHF Very High Frequency VIL Vertical Integrated Liquid VTP Verification Test Plan WARN Warn/Centroid Product Display WFO Weather Forecast Office WSR Weather Surveillance Radar WSSH White Sands Space Harbor 8. ACKNOWLEDGEMENTS
The authors wish to thank Col. Robert LeFebre, Mr. Frank Brody, Mr. Richard Lafosse, and Mr. Karl Silverman for their critical reviews of this paper. 9. BIBLIOGRAPHY
Aerospace, 1988: Launch Vehicle Lightning -
Atmospheric Electrical Constraints Post-Atlas/Centaur 67 Incident, Aerospace Corporation Report #TOR-0088 (3441-45)-2, 12 pp.
Air Force Combat Climatology Center, 2004: Operational Climatic Data Summary (OCDS) for the Shuttle Landing Facility at the Kennedy Space Center, Asheville, NC.
Arthur D. Little, Inc., 1987: Shuttle Transportation System Meteorological Expert�STSMET Thunderstorm Weather Forecasting Expert System -TWFES, Final Report (Reference 55855) to John F. Kennedy Space Center, NASA, 158 pp.
Austin, G.L., A. Kilambi, A. Bellon, N. Leoutsarakos, M. Ivanich, B. Boyd, and C. Golub, 1988: Operational, Highspeed Interactive Analysis and Display System for Intensity Radar Data Processing. Preprints, Fourth International Conference On Interactive Information And Processing Systems For Meteorology, Oceanography, And Hydrology, Anaheim, CA, Amer. Meteor. Soc., 79-84.
Bauman, W.H., J.T. Madura, and B.F. Boyd, 1992: Near Real-Time High Resolution Upper Air Balloon Measurements For Space Launch Support. Paper 92-0721, AIAA 30th Aerospace Sciences Meeting And Exhibit, Reno, NV, AIAA,.
___, William H. III, William P. Roeder, Richard A. Lafosse, David W. Sharp, and Francis J. Merceret, 2004: The Applied Meteorology Unit � Operational Contributions to Spaceport Canaveral. 11th Conference on Aviation, Range, and Aerospace Meteorology, Hyannis, MA, Amer. Meteor. Soc., Paper 6.3.
Boyd, B.F., and T.L. Wilfong, 1988: Impact of Weather on Acoustic Propagation Forecasts for Launch Support. Paper 88-0199, AIAA 26th Aerospace Sciences Meeting and Exhibit, Reno, NV, AIAA.
___, B.F., J.T. Madura, and M.E. Adams, 1993: Meteorological Support to the United States Air Force and NASA at the Eastern Range and Kennedy Space Center. Paper 93-0753, AIAA 31st Aerospace Sciences Meeting & Exhibit, Reno, NV, AIAA.
___, B., W. Roeder, J. Lorens, D. Hazen, and J. Weems, 1995: Weather Support to Pre-launch Operations at the Eastern Range and Kennedy Space Center. Preprints, Sixth Conference on Aviation
Weather Systems, Dallas, TX, Amer. Meteor. Soc., 135-140.
___, B.F., D.E. Harms, M.S. Gremillion, and M.E. Fitzpatrick, 1999: Weather Radar Improvements for Space Launch Support. Preprints, 29th International Conference on Radar Meteorology, Montreal, Quebec, Amer. Meteor. Soc., 856-859.
___, B.F., D.E. Harms, M.E. Fitzpatrick, R.P. Stout, P.N. Rosati, D.D. Berlinrut, C.R. Parks, and K.B. Overbeck 1999: Weather Support To Range Safety, JANNAF, S&EPS, San Diego, CA, CPIA Pub 687, Vol I, 59-69.
___, B.F., D.E. Harms, P.N. Rosati, C.R. Parks, and K.B. Overbeck, 2000: Weather Support To Range Safety For Forecasting Atmospheric Sonic Propagation. Ninth Conference on Aviation, Range, and Aerospace Meteorology, Orlando, FL, Amer. Meteor. Soc., 432-437.
___, B.F., J.W. Weems, W.P. Roeder, C.S. Pinder, and T.M. McNamara, 2003: Use of Weather Radar to Support America�s Space Program � Past, Present, and Future. 31st International Conference on Radar Meteorology, Seattle, WA, Amer. Meteor. Soc., 815-818.
____, Billie F., William P. Roeder, Diana L. Hajek and Matthew B Wilson, 2005: Installation, Upgrade, and Evaluation of a Short Baseline Cloud-to-Ground Lightning Surveillance System Used to Support Space Launch Operations. Conference on Meteorological Applications of Lightning Data, San Diego, CA, Amer. Meteor. Soc., Paper P2.4
Brody, F.C., R.A. Lafosse, D.G. Bellue, and T.D. Oram, 1997: Operation of the National Weather Service Spaceflight Meteorology Group, WAF, 12, 526-544.
Busse, J.R, Chairman Investigation Board 1987: Report Of Atlas/Centaur-67/FLTSATCOM F-6 Investigation Board, Volume I�Final Report, 326 pp.
Cloys, K.P., M.K. Walters, L.K. Coleman, and W. P. Roeder, 2000: On the Use of Neural Networks and Conditional Climatology to Predict Peak Wind Speed at Cape Canaveral�s Atlas Launch Pad. Ninth Conference on Aviation, Range, and Aerospace Meteorology, Orlando, FL., Amer. Meteor. Soc., 182-187.
Divers, R.P., A.Z. Chandler, P. Viens, K. Bzdusek, G. Herman, R. Hoover, and T. Mitchell, 2000: Automated Meteorological Profiling System (AMPS) Description. Ninth Conference on Aviation, Range, and Aerospace Meteorology, Orlando, FL, Amer. Meteor. Soc.
Durrett, W.R., 1976: Lightning-Apollo To Shuttle, 13th Space Congress, Cocoa Beach, FL, 4-27 to 4-32.
Erickson, J.E., 1985: Archival of Special Meteorological Data Sets. [Available from USAF, 45WS].
___, J.E., B.F. Boyd, and J.W. Oliver, 1985: Meteorological Interactive Data Display System (MIDDS) Data Base. Preprints, International Conference on Interactive Information and Processing Systems for Meteorology, Oceanography, and Hydrology, Los Angeles, CA, Amer. Meteor. Soc., 173-175.
Ernst, J.A. and F.J. Merceret, 1995: The Applied Meteorology Unit: A Tri-Agency Applications

Development Facility Supporting the Space Shuttle. Preprints, Sixth Conference on Aviation Weather Systems, Dallas, TX, Amer. Meteor. Soc.
Evans, R.J., C.J. Tremback, and W A. Lyons, 1996: The Implementation and Evaluation of the Emergency Response Dose Assessment System (ERDAS), at Cape Canaveral Air Station/ Kennedy Space Center. Preprints, Ninth Joint Conference on the Applications of Air Pollution Meteorology, Atlanta, GA, Amer. Meteor. Soc., 193-197.
Fitzpatrick, M.E., R.S. Schuman, W. C. Lambert, F. J. Merceret, G. D. Wilke, And J. D. Chapman, 2000: Operational Quality Control of 50 MHz DRWP Wind Profiles for Space-lift Support. Ninth Conference on Aviation, Range, and Aerospace Meteorology, Orlando, FL, Amer. Meteor. Soc. 575-579.
Garner, T.W., D.G. Bellue and G.W. Baggett, 1997: Weather Flight Rules for Space Shuttle Operations. Paper 97-0182, AIAA 35th Aerospace Sciences Meeting and Exhibit, Reno, NV, AIAA..
Gehman, H.W., 2003: Report of Columbia Accident Investigation Board Volume I, August 2003, 23-25.
Gulick, J.R. and J. Wacker, 1977: KSC and CCAFS Joint Study, Meteorology, [Available from USAF, 45WS], 30 pp.
Harms, D.E., B.F. Boyd, R.M. Lucci, M.S. Hinson, and M.W. Maier, 1997: Systems Used to Evaluate the Natural and Triggered Lightning Threat to the Eastern Range and Kennedy Space Center. Preprints, 28th Conference on Radar Meteorology, Austin, TX, Amer. Meteor. Soc., 240-241.
___, D.E., B.F. Boyd, F.C. Flinn, J.T. Madura, T.L. Wilfong, and P.R. Conant, 2003: Weather Systems Upgrades to Support Space Launch at the Eastern Range and the Kennedy Space Center. 12th Symposium on Meteorological Observations and Instrumentation, Long Beach, CA, Amer. Meteor. Soc., Paper 7.1.
Heritage, 1988: Heritage Committee Report, Aerospace Corporation Report #TOR-0088 (3441-45)-2.
Hosker, R.P., Jr., K.S. Rao, R.M. Eckman, J.T. McQueen, and G.E. Start, 1993: An Assessment of the Dispersion Models in the MARSS System Used at the Kennedy Space Center, NOAA Tech Memo ERL ARL-205, Dec 93, 91 pp.
Justus, C.G. and D.L. Johnson, 1999: �The NASA/MSFC Global Reference Atmospheric Model � 1999 Version (GRAM-99)�, NASA TM-1999-209630.
Krider, E.P., R.C. Noggle, M.A. Uman, and R.E. Orville, 1974: Lightning And The Apollo 17/Saturn V Exhaust Plume, Journal Of Spacecraft And Rockets, 11, No. 2, Feb 74, 72-75.
Lennon, C. and L. Maier, 1991: Lightning Mapping System. International Aerospace and Ground Conference on Lightning and Static Electricity, NASA Conference Pub 3106, Vol II, pp 89-1-89-10.
Lucci, R.M., D.E. Harms, and B.F. Boyd. 1998: Current And Future Wind Profilers In Support Of The Spacelift Mission At The Eastern Range And Kennedy Space Center. Extended Abstracts, Fourth International Symposium on Tropospheric Profiling: Needs and Technologies, Snowmass, CO, 206-208.
Lyons, W.A., D.A. Moon, C.S. Keen, and J.A. Schuh, 1988: Providing Operational Guidance for the Development of Sea Breeze Thunderstorms at the Kennedy Space Center: An Experiment Using A Mesoscale Numerical Model. Preprints, Fourth International Conference on Interactive Information And Processing Systems For Meteorology, Oceanography, And Hydrology, Anaheim, CA. Amer. Meteor. Soc., 268-275.
Madura, J.T., B.F. Boyd, W.H. Bauman, and M.E. Adams, 1991: Lower Tropospheric Measurements Required To Improve Weather Forecasts for Cape Canaveral AFS and Kennedy Space Center Florida. Extended Abstracts, Lower Tropospheric Profiling: Needs and Technologies, Boulder, CO, 119-120.
Maier, Launa, Carl Lennon, and Thomas Britt, 1995: Lightning Detection and Ranging (LDAR) System Performance Analysis. Preprints, Sixth Conference On Aviation Weather Systems, Dallas, TX, Amer. Meteor. Soc., 305-309.
Maier, M. W., 1999: Weather Impacts On Space Launch Operations At The United States Eastern Range. Eighth Conference On Aviation, Range, And Aerospace Meteorology, Dallas, TX., Amer. Meteor. Soc.
Manobianco, J. and P. A. Nutter, 1999: Evaluation of the 29-km Eta Model, Part II: Subjective Verification Over Florida, Wea. Forecasting, 14, 18-37.
Marshall, T.C., W.D. Rust, M. Stolzenberg, W.P. Roeder, and P.R. Krehbiel, 1998: A Study of Enhanced Fair-Weather Electric Fields Occurring Soon After Sunrise, submitted to Journal Geophysical Research
Myers, B., M. Wehman, and G. Norman Jr., 1993: An OS/2 McIDAS Forecast Editor. 9th AMS International Conference of the Interactive Information and Processing Systems for Meteorology, Oceanography, and Hydrology, Anaheim, CA, Amer. Meteor. Soc., 238-241.
Nanevicz, J.E., J.S. Thayer, and H. Heritage, 1988: An Aircraft-Borne Electric Field Measuring System For Rocket Launch Support. International Aerospace And Ground Conference On Lightning And Static Electricity, Oklahoma City, OK, 87-93
NASA, 2000: Terrestrial Environment (Climatic) Criteria Handbook for Use in Aerospace Vehicle Development, NASA-HDBK-1001.
NASA/JSC, 1983: Natural Environment Design Requirements, Space Shuttle Flight and Ground System Specification, Level II Program Definition and Requirements, NASA-JSC07700, Volume X.
NASA/JSC, 1977: Orbital Flight Test Baseline Operations Plan, Flight Operations, Rev A, 2-11
NASA/JSC, 1989: Space Shuttle Flight Operations Rules, Mission Operations Directorate, 4-51
NASA/JSC, 1996: Space Shuttle Flight Operations Rules, Mission Operations Directorate, 2-25
National Research Council, 1988: Meteorological Support for Space Operations, Review and Recommendations, Washington D. C., National Academy Press, 77 pp.
Parks, C., K. Overbeck, R. Evans, B. Boyd, D. Berlinrut, and R. Nyman, 1996: Forecasting Toxic

Hazards in Support of Space and Missile Operations at the Eastern Range. Fifth International Conference on Atmospheric Sciences and Applications to Air Quality, Seattle, WA.
Pearson, S.D., W.W. Vaughan, G.W. Batts, and G.L. Jasper, 1996: �Importance of the Natural Terrestrial Environment With Regard to Advanced Launch Vehicle Design and Development�. NASA TM 108511.
Poniatowski, K.S., 1987: Manned/Unmanned Launch Vehicle Weather History At Lift-Off 1960 To Present, Unpublished, NASA Hqs, May 1987, 55 pp
Priselac, Edward D, James E. Sardonia, and Thomas C. Adang, 1997: Operational Weather Support for NASA Space Shuttle Ferry Flights. Preprints, Seventh Conference On Aviation, Range, And Meteorology, Long Beach, Amer. Meteor. Soc., 35-39.
Roeder, W.P., J.E. Sardonia, S.C. Jacobs, M.S. Hinson, D.E. Harms, and J.T. Madura, 1999: Avoiding Triggered Lightning Threat To Space Launch From The Eastern Range/Kennedy Space Center. Eighth Conference On Aviation, Range, And Aerospace Meteorology, Dallas, TX, Amer. Meteor. Soc., 120-124.
___, W.P. and D.E. Harms, 2000: Using Climatology to Improve Weather Forecasting for America�s Space Program. Preprints, Twelfth Conference on Applied Climatology, Asheville, NC, Amer. Meteor. Soc., 66-69.
Ryan, R., J. et al., 1996: �Working on the Boundaries: Philosophies and Practices of the Design Process�, NASA/TP-3642.
Schumann, R.S., G.E. Taylor, F.J. Merceret, and T.L. Wilfong, 1999: Performance characteristics of the Kennedy Space Center 50-MHz Doppler Radar Wind Profiler Using the Median Filter/first-guess Reduction Algorithm. J. Atmos. Oceanic Technol., 16, 532-549.
Scoggins, J.R., 1964: Sphere Behavior and the Measurement of Wind Profiles. NASATN-3994, National Aeronautics and Space Administration, 53 pp.
Short, D., M. Gremillion, C. Pinder, and W.P. Roeder, 2000: Volume Scan Strategies for the WSR 74C in Support of Space Launch. Ninth Conference on Aviation, Range, and Aerospace Meteorology, Orlando, FL, Amer. Meteor. Soc., 551-556.
Smith, O.E. and S.I. Adelfang, 1992: STS Ascent Structural Loads Statistics. Paper 92-0720, AIAA 30th Aerospace Sciences Meeting and Exhibit, Reno, NV, AIAA.
Smith, S.A, 1989: Progress in the Use of Wind Profiling Radars for Shuttle Launch Support. Preprints, Third Conference on Aviation Systems, Anaheim, CA, Amer. Meteor. Soc., 99-101.
Stubbs, D.R., 1978: Filed internal letter, subject: Field Mill Network-KSC/AFETR Consolidation, dated 1 Nov 98.
Taylor, G.E., M.K. Atchinson, C.R. Parks, E.L. Rhodes, and B.F. Boyd, 1989: The Kennedy Space Center Atmospheric Boundary Layer Experiment. 1989 JANNAF Safety & Environmental Protection Subcommittee Meeting, Brooks Air Force Base, TX, (CPIA Publication 508, pp 75-83).
Theon, John (Panel Chair), 1986: Report of the Space Shuttle Weather Forecasting Advisory Panel to
the NASA Associate Administrator for Space Flight, 32 pp.
Vaughan, W.W. and S.C. Brown, 1985: �Natural Environment Considerations for Space Shuttle System Development Support�. Journal of Spacecraft and Rockets, 22 (3), 355-360.
___, W.W. and B.J. Anderson, 1993: �Launch and the Environment: Lessons Learned�. AIAA Aerospace America, May 1993, 30-31.
___, W.W. and O.E. Smith, 1970: �Progress in Aerospace Meteorology and Review of Atmospheric Considerations for the Space Shuttle�. Bull. Amer. Meteor. Soc., 51, No. 9, 799-907.
___, W.W. and B.J. Anderson, 2004: �Aerospace Meteorology Lessons Learned Relative to Aerospace Vehicle Design and Operations\�. Proceeding of the American Meteorological Society�s Eleventh Conference on Aviation, Range, and Aerospace Meteorology, Amer. Meteor. Soc.
Watson, A.I., R.E. Lopez. R.L. Holle, J.R. Daugherty, and R. Ortiz, 1989: Short-term Forecasting of Thunderstorms at Kennedy Space Center, Based on the Surface Wind Field. Preprints, Third Conference on Aviation Systems, Anaheim, CA, Amer. Meteor. Soc., 222-227.
___, A.I., R.L. Holle, R.E. Lopez, R. Ortiz, and J.R. Nicholson, 1991: Surface Wind Convergence as a Short-term Predictor of Cloud-to-ground Lightning at Kennedy Space Center. Wea Forecasting, 6, 120-126.
Wilfong, T.L. and B.F. Boyd, 1989: Winds Aloft To Support Space and Missile Launches. Preprints, Third International Conference On The Aviation Weather System, Anaheim, CA, Amer. Meteor. Soc.,102-107.
___, T.L., S.A. Smith, and R.L. Creasy, 1993: High Temporal Resolution Velocity Estimates From A Wind Profiler. J. Spacecr. Rockets, 30, 348-354.
___, T.L., C.L. Crosiar, B.F. Boyd, and S.T. Heckman, 1996: Upper Air Data Systems to Support Space Launch Range Activities. Paper 96-0266, AIAA 34th Aerospace Sciences Meeting and Exhibit, Reno, NV, AIAA.
___, Timothy, L. Sr., D.L. Davis, U.H. Grote, B.L. Shaw, K.A. Winters, and W. Schmeiser, 2002: Tailoring the Advanced Weather Interactive Processing System (AWIPS) for Space Launch Range Support. Preprints Symposium on the Advanced Weather Interactive Processing System (AWIPS), Orlando, FL. Amer. Meteor. Soc., 118-123
Williams, S.F., K. Caesar, K. Southwick, 1992: The Convection and Precipitation Electrification (CaPE) Operations Summary and Data Inventory, NCAR, Boulder, CO, 425 pp.
Winters, Katherine, A., William P. Roeder, John T. Madura, and Harold C. Herring, 2004: Use of Archived Weather Data from Spaceport Florida in Support of Space Shuttle Columbia Accident Investigation. 14th Conference on Applied Climatology, Seattle, WA, Amer. Meteor. Soc., Paper P4.7, 7pp.