Wear-Related Phenomena in Advanced...
75
Wear-Related Phenomena in Advanced Materials Guest Editors: Alexander Tsouknidas, Luca Settineri, Pedro Arrazola, and Nikolaos Michailidis Advances in Tribology
Transcript of Wear-Related Phenomena in Advanced...

Wear-Related Phenomena in Advanced MaterialsGuest Editors: Alexander Tsouknidas, Luca Settineri, Pedro Arrazola, and Nikolaos Michailidis
Advances in Tribology

Wear-Related Phenomena inAdvanced Materials
Advances in Tribology
Wear-Related Phenomena inAdvanced Materials
Guest Editors: Alexander Tsouknidas, Luca Settineri,Pedro Arrazola, and Nikolaos Michailidis

Copyright © 2011 Hindawi Publishing Corporation. All rights reserved.
This is a special issue published in “Advances in Tribology.” All articles are open access articles distributed under the Creative CommonsAttribution License, which permits unrestricted use, distribution, and reproduction in any medium, provided the original work is prop-erly cited.

Editorial Board
George G. Adams, USAArvind Agarwal, USAMihai Arghir, FrancePranesh B. Aswath, USAShyam Bahadur, USAB. Bhushan, USANavin Chand, IndiaHuseyin Cimenoglu, TurkeyEnrico Ciulli, ItalyJ. Paulo Davim, PortugalPatrick De Baets, BelgiumAbdallah Elsharkawy, KuwaitLiang Fang, ChinaKambiz Farhang, USA
Michel Fillon, FranceK. Friedrich, GermanyHiromu Hashimoto, JapanMeng Hua, Hong KongSaid Jahanmir, USAGun Hee Jang, KoreaYuansheng Jin, ChinaMitjan Kalin, SloveniaMotohiro Kaneta, JapanYuan Kang, TaiwanAjay Kapoor, AustraliaKoji Kato, JapanT. G. Keith, USAM. M. Khonsari, USA
Dae Eun Kim, KoreaBankim C. Majumdar, IndiaBraham Prakash, SwedenRichard Salant, USAJerzy T. Sawicki, USAIan Sherrington, UKSujeet Kumar Sinha, SingaporeG. W. Stachowiak, AustraliaAndras Z. Szeri, USAJ. Vizintin, PolandAnna Walicka, PolandQian Wang, USASi-Wei Zhang, China
Contents
Wear-Related Phenomena in Advanced Materials, Alexander Tsouknidas, Luca Settineri, Pedro Arrazola,and Nikolaos MichailidisVolume 2011, Article ID 842686, 2 pages
Development of New PM Iron-Based Materials for Self-Lubricating Bearings, Cristina Teisanu andStefan GheorgheVolume 2011, Article ID 248037, 11 pages
A Characterization Method for Al Recovery from Dross Based on Compression at ElevatedTemperatures, S. Maropoulos, D. Kountouras, X. Voulgaraki, S. Papanikolaou, and I. SanaidisVolume 2011, Article ID 395716, 5 pages
Model of Fracture, Friction, and Wear Phenomena of Porous Iron, A. A. Shatsov, I. V. Ryaposov,and D. M. LarininVolume 2011, Article ID 810254, 16 pages
Characterization of Tool Wear in High-Speed Milling of Hardened Powder Metallurgical Steels,Fritz Klocke, Kristian Arntz, Gustavo Francisco Cabral, Martin Stolorz, and Marc BuschVolume 2011, Article ID 906481, 13 pages
Wear Behavior and Its Correlation with Mechanical Properties of TiB2 Reinforced Aluminium-BasedComposites, N. B. Dhokey and K. K. RaneVolume 2011, Article ID 837469, 8 pages
Friction Induced Wear of Rapid Prototyping Generated Materials: A Review, A. TsouknidasVolume 2011, Article ID 746270, 7 pages
Integrated Approach for a Knowledge-Based Process Layout for Simultaneous 5-Axis Milling ofAdvanced Materials, F. Klocke, T. Bergs, M. Busch, L. Rohde, M. Witty, and G. F. CabralVolume 2011, Article ID 742360, 7 pages
Hindawi Publishing CorporationAdvances in TribologyVolume 2011, Article ID 842686, 2 pagesdoi:10.1155/2011/842686
Editorial
Wear-Related Phenomena in Advanced Materials
Alexander Tsouknidas,1 Luca Settineri,2 Pedro Arrazola,3 and Nikolaos Michailidis4
1 Laboratory for Machine Tools and Manufacturing Engineering, Mechanical Engineering Department,Aristotle University of Thessaloniki, 54124 Thessaloniki, Greece
2 Department of Production Systems and Business Economics, Polytechnic University of Turin, 10129 Torino, Italy3 Mechanical and Manufacturing Department, Mondragon University, 20500 Arrasate-Mondragon, Spain4 Physical Metallurgy Laboratory, Mechanical Engineering Department, Aristotle University of Thessaloniki, P.O. BOX 490,54124 Thessaloniki, Greece
Correspondence should be addressed to Nikolaos Michailidis, [email protected]
Received 19 December 2011; Accepted 19 December 2011
Copyright © 2011 Alexander Tsouknidas et al. This is an open access article distributed under the Creative Commons AttributionLicense, which permits unrestricted use, distribution, and reproduction in any medium, provided the original work is properlycited.
1. Aims and Scope of the Issue
The title of this editorial reflects an effort in creating aunique research forum, to harbor fundamental as well asreview articles, meeting the forefront of this scientific field.The Guest Editors sought to attract articles on friction,wear, surface properties, and the development of sufficientprocedures, to arrest wear progression as well as to indicatemechanisms to prolong the effectiveness of the implicatedmaterials.
In these terms it was exciting and rewarding to embracerelated papers of scientists from around the world. Theconcept of wear-related phenomena in advanced materials,along with a short introduction on the subjects, addressedby the accepted papers, will be presented in the followingparagraphs.
2. Introduction
Wear has, by its very nature, always dominated the interestof engineers and physicists, as it represents a materialproperty of enormous practical importance. Even though itis a multidisciplinary phenomenon based on simultaneouslyoccurring mechanical, physical, and chemical processes,recent advances in sophisticated material design and devel-opment and characterization techniques have sustainedmethodologies to comprehend and predict wear progression.The capacity to systematically and effectively describe weardevelopment is a perspective of great importance to engi-neers who use materials and mechanical components or aredirectly involved with their manufacturing processes.
3. Wear in Advanced Materials
Milling is a characteristic manufacturing process in whichwear exerts a dominating effect on both product qualityand cost. There exists a consensus throughout the litera-ture that high-performance cutting of difficult-to-machinematerials strongly depends on the engagement parametersas well as on the tool and workpiece materials, and thusanalytical-experimental optimization procedures may leadto drastic enhancement of the tool life, as discussed inthe paper entitled “Characterization of tool wear in high-speed milling of hardened powder metallurgical steels.” Thisis particularly important when processing advanced mate-rials like Ti- or Ni-based alloys. Over the past years, therelated manufacturing procedures have arisen from theirperiod of infancy and gained tremendous importance inseveral industrial sectors, that is, aerospace. It has beensustained that novel heuristic optimization procedures canbe successfully applied during the integration of millingstrategies, for such materials, providing high removal rateswhile maintaining acceptable production costs, as evidencedin the paper entitled “Integrated approach for a knowledge-based process layout for simultaneous 5-axismilling of advancedmaterials.”
Alternative methods, like additive manufacturing, havebeen recently introduced for the production of function-allygraded, high-end materials. Even though this easesthe production of complex geometries, these technologiesproduce components prone to several degeneration scenariosand thus, it is pivotal to consider a variety of productionand application-based parameters, as showen in the paper
2 Advances in Tribology
entitled “Friction induced wear of rapid prototyping generatedmaterials: A review.”
Antifriction-based materials and components arepredominantly developed, based on application-specificrequirements. Powder metallurgy is a key enabling techniquein this direction, facilitating, among others, the productionof self-lubricating components (i.e., bearings). Recentinvestigations on iron-based alloys indicated a strongenslavement of the mechanical and tribotechnical propertiesof the final product to the production parameters, whichmust therefore be carefully considered, as proven in thepapers entitled “Development of new PM iron base materialsfor self-lubricating bearings.” and “Model of fracture, friction,and wear phenomena of porous iron.” Aluminum-basedTiB2-reinforced composites are widely considered as analternative to ferrous antifriction components. Late studiesrevealed that the wear behavior of these composites iscomparable to the one of gray cast iron parts, as exhibiledin the paper entitled “Wear behavior and its correlation withmechanical properties of TiB2 reinforced aluminium-basedcomposites.” The high cost of aluminum composites can bedecreased through recovery procedures of dross, producedin large quantities “A characterization method for Al recoveryfrom dross based on compression at elevated temperatures.”Related procedures have been optimized, and the purity ofthe recovered material is considered as acceptable for theproduction of high-added-value products.
Epilogue
Our sincere hope and wish is that “Advances in Tribology”will continue to address the multidisciplinary phenomenareflected in the wear development of advanced materials,and we commit ourselves to support this effort in our bestcapacity.
Alexander TsouknidasLuca Settineri
Pedro ArrazolaNikolaos Michailidis
Hindawi Publishing CorporationAdvances in TribologyVolume 2011, Article ID 248037, 11 pagesdoi:10.1155/2011/248037
Research Article
Development of New PM Iron-Based Materials forSelf-Lubricating Bearings
Cristina Teisanu and Stefan Gheorghe
Faculty of Mechanics, University of Craiova, 107 Calea Bucuresti, 200512 Craiova, Romania
Correspondence should be addressed to Cristina Teisanu, [email protected]
Received 30 June 2011; Revised 22 September 2011; Accepted 27 September 2011
Academic Editor: Pedro Arrazola
Copyright © 2011 C. Teisanu and S. Gheorghe. This is an open access article distributed under the Creative Commons AttributionLicense, which permits unrestricted use, distribution, and reproduction in any medium, provided the original work is properlycited.
Using PM technologies, new antifriction materials based on iron powder with different addition elements were developed in orderto obtain self-lubricated bearings with improved tribological features. The elemental powder mixtures were blended for 2 hoursin a 3D homogenization device, were compacted at a pressure of 500 MPa, and then sintered in dry hydrogen atmosphere atdifferent temperatures for different maintaining times. The effect of technological parameters on physical properties (density anddimensional changes) was presented in this study. The mechanical and tribological properties (tensile strength, hardness, impactenergy, friction coefficient, and wear rate) related to addition elements were evaluated. The tribological behaviour of the selectediron-based alloys was analysed by pin on disc tests without lubrication. Also, the wear surface scars and the microstructure of thewear surfaces were investigated.
1. Introduction
Self-lubricating bearings represent the oldest industrial ap-plication of the porous materials obtained by PM techniqueas metallic filters and sparking plugs cannot be producedby other technology. In the recent years iron-based sinteredbearings production was considerably increased at the ex-pense of the copper-based ones, due to the low cost and avail-ability of the iron powders as well as their higher strength.The mechanical properties of the parts are strongly relatedto the composition of the material. For tribological applica-tions, the properties of the surface are linked to the differentmetallic and intermetallic phases formed in the material.
Controlled inhomogeneity of the structure by powdermetallurgy processes makes it possible to obtain materialswith special properties, which cannot be manufactured byconventional technologies. Many sintered parts reach suffi-ciently high-strength properties, for example, similar to castiron, already at a porosity of 20–15%. The great advantage ofthe porous materials over the compacted ones obtained byconventional technologies is their porosity, which acts like itsown oil reservoir. Self-lubricating bearings accomplish supe-rior performance when the porosity level is high, so sufficient
oil is accumulated in the pores during inactivity periods andit leaks when the shaft begins rotating in it. Also, the materialdensity plays an important role for self-lubricating bearingsfor exhibiting good load-bearing capacity. Therefore, it is es-sential to know the actual loading conditions of the partand modify the alloying and the treatment conditions of thematerial on the basis of these conditions.
Sintered iron-based antifriction materials were not devel-oped until the last decades because of their poor corrosionresistance and antifriction properties. Considering the lowcost and availability of iron, additions such as copper, graph-ite, manganese, lead, phosphorous, boron, and tin to ironhave been attempted, but improvement in one property wasoffset by a decrease in other properties [1–4]. In order to en-hance antifriction and mechanical properties, the presentpaper focuses on the development of Fe-Cu-Sn-Pb-MoS2
antifriction alloys.As the quality of the material powders and the manufac-
turing processes were improved, powder metallurgy partshad in many cases taken the place of cast and forged pro-ducts. It is very important, in order to avoid subsequent oper-ations such as sizing and machining, to improve the final di-mensional tolerances obtained after sintering. There are

2 Advances in Tribology
Table 1: Composition of the powder mixtures.
AlloyIronwt%
Copperwt%
Tinwt%
Leadwt%
MoS2
wt%
1 Rest 5 1 7.5 1
2 Rest 5 1.5 5 1
3 Rest 5 2.5 2.5 1
Table 2: Experimental conditions.
Sintering conditionsSintering temperature [◦C] 800–900
Holding time [min.] 20, 35, 50
Atmosphere Dry hydrogen
Sintered density [g/cm3] 6.5–6.9
Table 3: Density values of the sintered mixtures.
Sintering temperature Dwell timeDensity
Alloy 1 Alloy 2 Alloy 3
80020 6.81 6.68 6.59
35 6.87 6.72 6.54
50 6.85 6.8 6.71
85020 6.79 6.58 6.56
35 6.84 6.61 6.55
50 6.83 6.67 6.57
90020 6.72 6.54 6.54
35 6.76 6.53 6.52
50 6.73 6.54 6.53
many factors that cause dimensional changes, and their com-bined effect makes it more difficult to forecast and controlthese changes. In the present paper, the experimental resultsof influence the different parameters on the dimensionalchanges of the sintered iron based alloys was reported.
Also, the density of the sintered parts was investigatedand, thus, the effect of the sintering temperature and timeon the density of the iron-based materials for self-lubricatingbearings was studied.
These influences of the sintering parameters on the den-sity and dimensional changes are presented as 3D surfaceplots using Statistica software.
2. Materials and Experimental Procedure
As experimental materials, iron powder produced by DUC-TIL S.A. BUZAU (DP 200-HD), electrolytic copper powder,tin powder, lead powder, and molybdenum disulphidepowder were used. Because of its lamellar structure, MoS2
is one of the most popular and usable solid lubricants. MoS2
is used to reduce the interparticle friction as well as frictionbetween powder particles and die wall during conventionalcold die compaction. Lead exhibits excellent self lubricatingproperty and plays a role of solid lubricant to prevent seizure.In addition, since Pb forms a soft dispersion phase, it hasconformability and allows solid matter to be embeddedtherein. Tin is a key player in antifriction alloys because itcan influence both corrosion resistance and fatigue strength
and friction and wear properties of these materials can alsobe improved.
Elemental powders were weighed to the selected propor-tions and mixed for 2 hours in 3D homogenization device.Then, test pieces were cold compacted at 500 MPa into a rig-id die by applying pressure in a single axial direction througha rigid punch or piston, and cylindrical specimens with10 mm diameter and 7 mm height were obtained and usedfor metallographic examination and measurement of greenand sintered density, porosity, and dimensional change aftersintering.
Green samples were placed in a tubular furnace havinga uniform heating zone and sintered at 800, 850, and 900◦Cfor 20, 35, and 50 minutes. The sintering atmosphere was dryhydrogen with a flow rate of 1 L/min. Samples were then fur-nace-cooled by switching off the power and maintaining thesame flow rate of the hydrogen gas.
Reference densities for the selected compositions werecalculated by the rule of mixtures, and sintered densities wereevaluated gravimetrically using the Archimedes principle.Volumetric dimensional change of the sintered compacts wascalculated, and the total porosity of the specimens was eval-uated from the difference between the reference density andthe measured density.
Experimental conditions and the composition of thepowder mixtures are presented in Tables 1 and 2, and densi-ties of the sintered compacts are shown in Table 3.
Specially shaped specimens were produced by PM tech-nology for testing the tensile strength of the PM parts inconformity with operating standardization.
Hardness test for PM materials was carried out using theVickers method with an indentation load of 50 N.
Impact energy was determined by the Charpy testaccording to SR EN 10045-1-93 using 5 × 10 × 55 mmspecimens without notches.
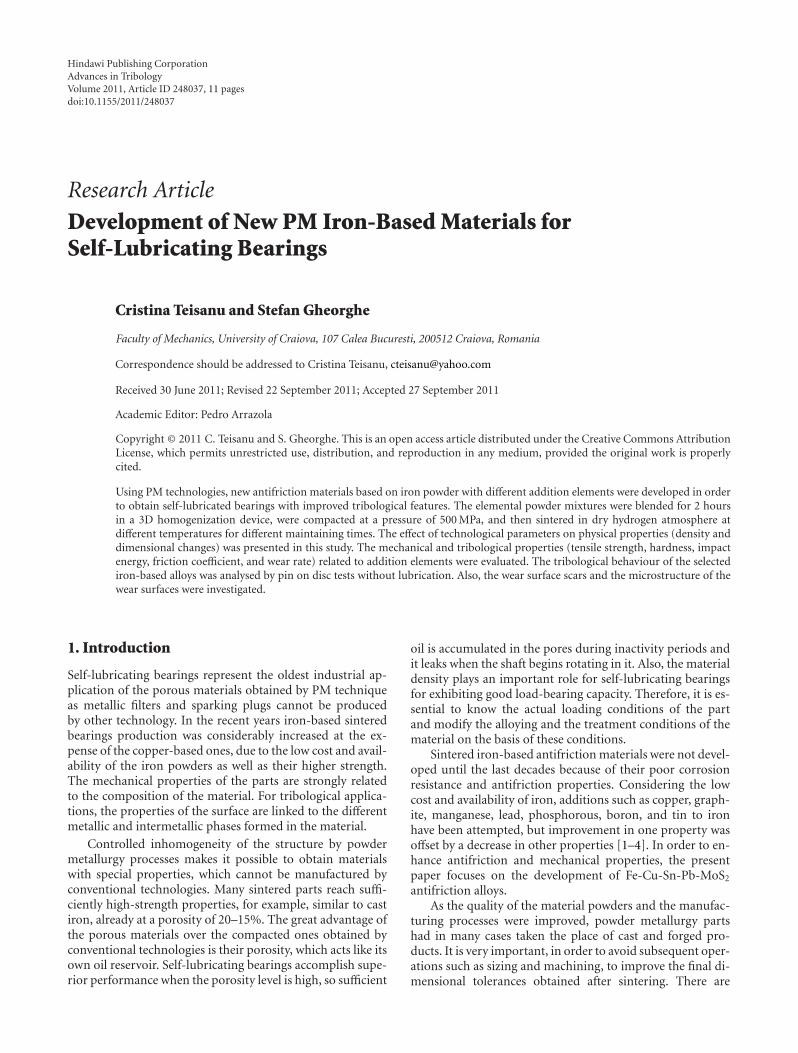
Tribological behaviour of the sintered samples was anal-ysed under dry friction conditions by pin-on-disc test using atesting device for friction coefficient and wear rate measure-ments (Figure 1) at a sliding speed of 0.75 m/s and a specificload of 3.72 MPa giving p × v value of 2.8 MPa m/s. Load-carrying ability is an important tribological behaviour of adry sliding couple. The pv factor or p× v value characterizesthe mechanical input in a sliding bearing as severity of designor the maximum mechanical input that the tribomaterialscan support [5]. Cylindrical specimens of 10.5 mm diameterand 7 mm height were used for wear tests. The mating partwas made from 1C45 (SR EN 10083-1,2) with 235 HB.
The friction coefficient was calculated using relation (1),along the sliding distance of 1360 m:
μ = F f
F, (1)
F f is the friction force and F is the resulting force acting onthe lever.
The wear rate was performed for materials sintered at900◦C for 50 minutes because of their better values of themechanical and physical characteristics compared with thosesintered at 850◦C and 800◦C. The wear rate was evaluatedat p × v = 2.8 MPa m/s and calculated in terms of the worn
Advances in Tribology 3
8
71
2 3 4 5 6 2 41 5
10
99
Figure 1: Testing device for friction coefficient and wear rate measurements: 1: weight; 2: ruler; 3: pin sample; 4: pin sample blocking part;5: mating disc; 6: rigid frame; 7: driving shaft; 8: trapezoidal transmission; 9: elastic lamella; 10: lever.
25 μmCu-Sn
Fe-Mo
FeαPbFe-Sn
Fe-Cu
(a)
25 μmCu-Sn
Feα
Pb
Fe-Sn
Fe-Cu
(b)
25 μm
Feα
Pb Fe-Sn
Fe-MoCu-Sn
(c)
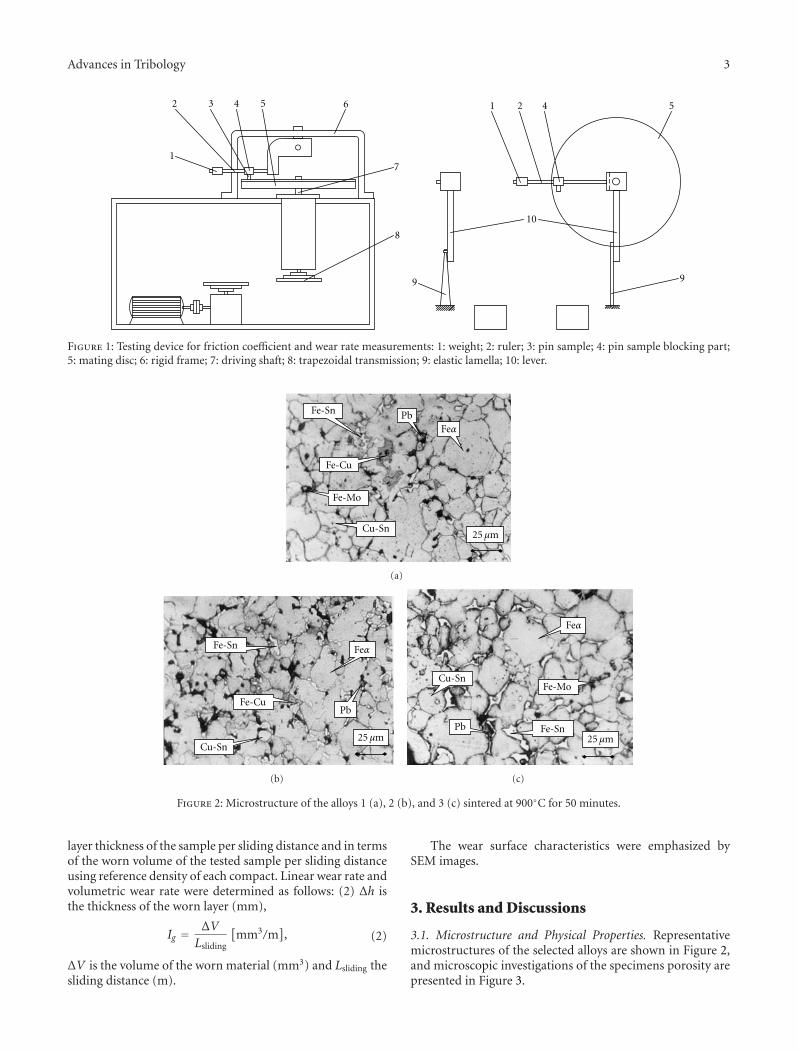
Figure 2: Microstructure of the alloys 1 (a), 2 (b), and 3 (c) sintered at 900◦C for 50 minutes.
layer thickness of the sample per sliding distance and in termsof the worn volume of the tested sample per sliding distanceusing reference density of each compact. Linear wear rate andvolumetric wear rate were determined as follows: (2) Δh isthe thickness of the worn layer (mm),
Ig = ΔV
Lsliding
[mm3/m
], (2)
ΔV is the volume of the worn material (mm3) and Lsliding thesliding distance (m).
The wear surface characteristics were emphasized bySEM images.
3. Results and Discussions
3.1. Microstructure and Physical Properties. Representativemicrostructures of the selected alloys are shown in Figure 2,and microscopic investigations of the specimens porosity arepresented in Figure 3.
4 Advances in Tribology
100 μm
(a)
100 μm
(b)
100 μm
(c)
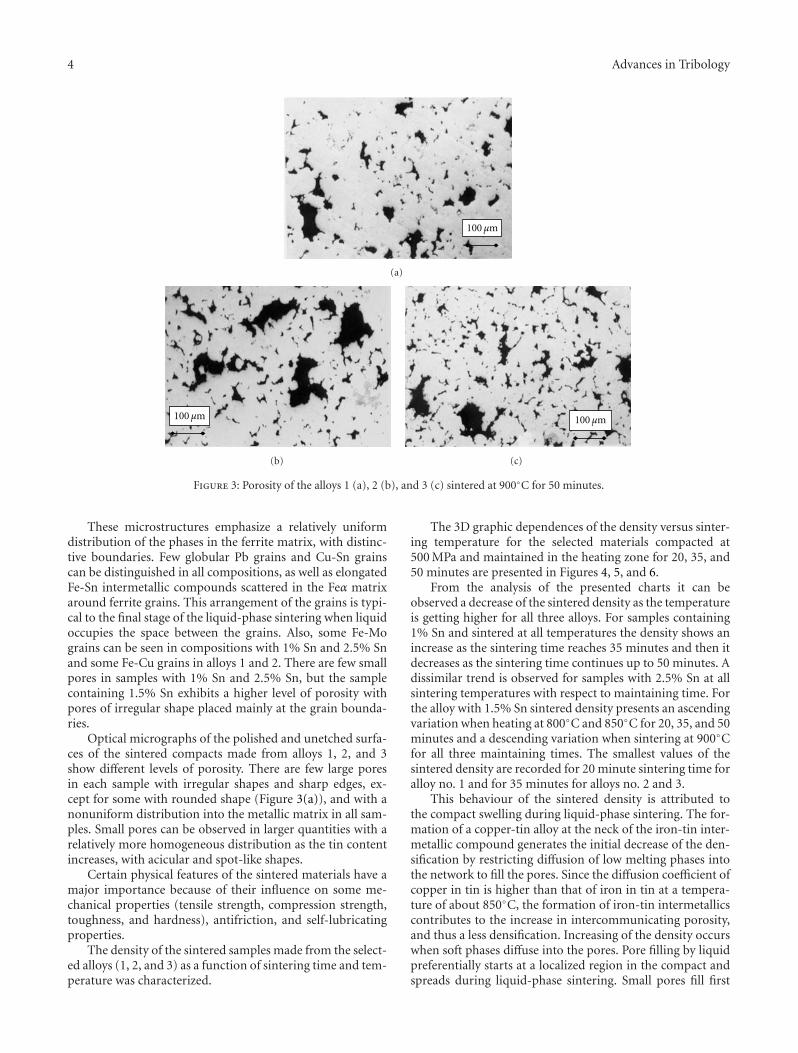
Figure 3: Porosity of the alloys 1 (a), 2 (b), and 3 (c) sintered at 900◦C for 50 minutes.
These microstructures emphasize a relatively uniformdistribution of the phases in the ferrite matrix, with distinc-tive boundaries. Few globular Pb grains and Cu-Sn grainscan be distinguished in all compositions, as well as elongatedFe-Sn intermetallic compounds scattered in the Feα matrixaround ferrite grains. This arrangement of the grains is typi-cal to the final stage of the liquid-phase sintering when liquidoccupies the space between the grains. Also, some Fe-Mograins can be seen in compositions with 1% Sn and 2.5% Snand some Fe-Cu grains in alloys 1 and 2. There are few smallpores in samples with 1% Sn and 2.5% Sn, but the samplecontaining 1.5% Sn exhibits a higher level of porosity withpores of irregular shape placed mainly at the grain bounda-ries.
Optical micrographs of the polished and unetched surfa-ces of the sintered compacts made from alloys 1, 2, and 3show different levels of porosity. There are few large poresin each sample with irregular shapes and sharp edges, ex-cept for some with rounded shape (Figure 3(a)), and with anonuniform distribution into the metallic matrix in all sam-ples. Small pores can be observed in larger quantities with arelatively more homogeneous distribution as the tin contentincreases, with acicular and spot-like shapes.
Certain physical features of the sintered materials have amajor importance because of their influence on some me-chanical properties (tensile strength, compression strength,toughness, and hardness), antifriction, and self-lubricatingproperties.
The density of the sintered samples made from the select-ed alloys (1, 2, and 3) as a function of sintering time and tem-perature was characterized.
The 3D graphic dependences of the density versus sinter-ing temperature for the selected materials compacted at500 MPa and maintained in the heating zone for 20, 35, and50 minutes are presented in Figures 4, 5, and 6.
From the analysis of the presented charts it can beobserved a decrease of the sintered density as the temperatureis getting higher for all three alloys. For samples containing1% Sn and sintered at all temperatures the density shows anincrease as the sintering time reaches 35 minutes and then itdecreases as the sintering time continues up to 50 minutes. Adissimilar trend is observed for samples with 2.5% Sn at allsintering temperatures with respect to maintaining time. Forthe alloy with 1.5% Sn sintered density presents an ascendingvariation when heating at 800◦C and 850◦C for 20, 35, and 50minutes and a descending variation when sintering at 900◦Cfor all three maintaining times. The smallest values of thesintered density are recorded for 20 minute sintering time foralloy no. 1 and for 35 minutes for alloys no. 2 and 3.
This behaviour of the sintered density is attributed tothe compact swelling during liquid-phase sintering. The for-mation of a copper-tin alloy at the neck of the iron-tin inter-metallic compound generates the initial decrease of the den-sification by restricting diffusion of low melting phases intothe network to fill the pores. Since the diffusion coefficient ofcopper in tin is higher than that of iron in tin at a tempera-ture of about 850◦C, the formation of iron-tin intermetallicscontributes to the increase in intercommunicating porosity,and thus a less densification. Increasing of the density occurswhen soft phases diffuse into the pores. Pore filling by liquidpreferentially starts at a localized region in the compact andspreads during liquid-phase sintering. Small pores fill first

Advances in Tribology 5
6.9
6.88
6.86
6.84
6.82
6.8
6.78
6.76
6.74
6.72
22.5
33.5
44.5
58
8.2
8.4
8.6
8.8
9
Den
sity
ρ(g
/cm
3)
>6.87<6.87<6.85
<6.83<6.81<6.79
<6.77<6.75<6.73
Ts /100 ( ◦C/) ts/1
0 (min/10)
Figure 4: The dependence of the density: ρ = f (Ts, ts) is the alloyno. 1.
6.85
6.8
6.75
6.7
6.65
6.6
6.55
22.5
33.5
44.5
58
8.2
8.4
8.6
8.8
9
Den
sity
ρ(g
/cm
3)
>6.78<6.78
<6.75<6.72
<6.69<6.66
<6.63
<6.6<6.57
<6.54
Ts /100 ( ◦C/) ts/1
0 (min/10)
Figure 5: The dependence of the density: ρ = f (Ts, ts) is the alloyno. 2.
since they have the highest capillary attraction for the wettingliquid. High-green-density regions correspond to smallerpores, so pore filling naturally favours the high-green-densityregions [6].
>6.61<6.61<6.6<6.59
<6.58<6.57<6.56
<6.55<6.54<6.53
6.64
6.62
6.6
6.58
6.56
6.54
6.52
6.5
22.5
33.5
44.5
5
8
8.2
8.4
8.6
8.8
9
Den
sity
ρ(g
/cm
3)
Ts /100
( ◦C/)
ts/10 (min/10)
Figure 6: The dependence of the density: ρ = f (Ts, ts) is the alloyno. 3.
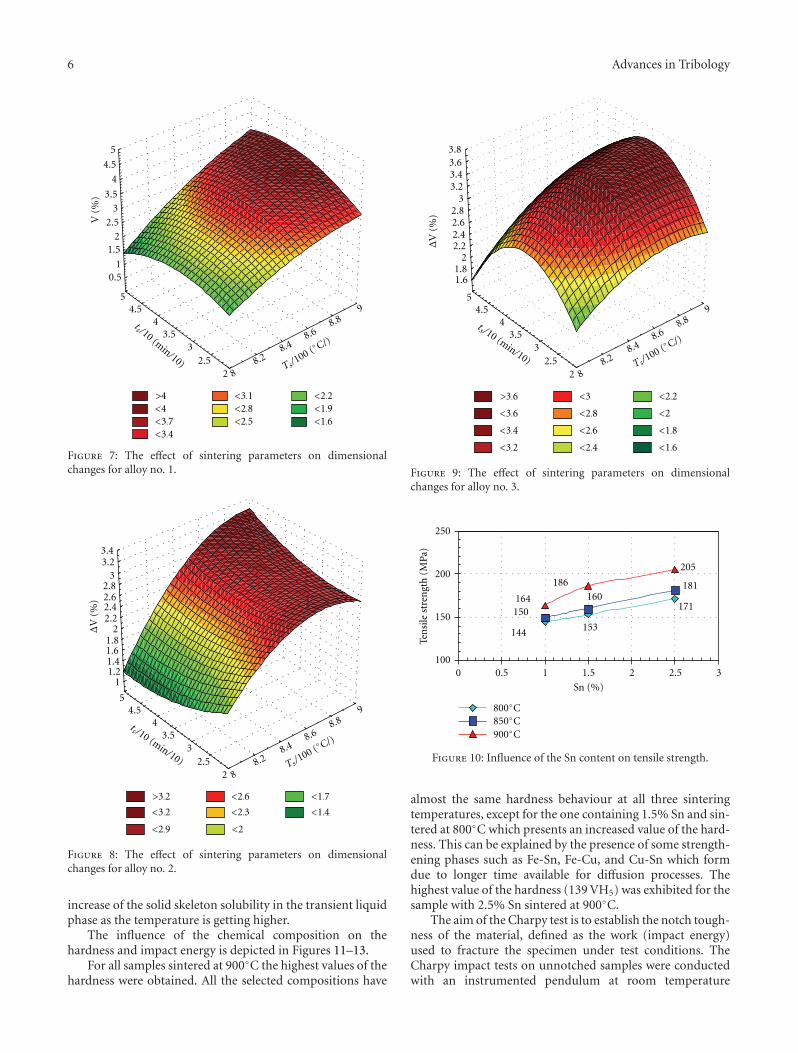
In Figures 7, 8, and 9 the dependence of the dimensionalchanges on sintering parameters (temperature and time) ofthe iron-based sintered samples is shown.
The large expansion of the dimensions observed for allalloys sintered at 900◦C is possible due to liquid penetrationof the grain boundaries which causes grain separation andswelling on liquid formation. This penetration action pushesmore solid particles apart, increasing the distance betweenparticle centres and consequently leading to the growth of thecompacts [7]. This behaviour is attributed probably to theformation of Cu-Sn, Fe-Cu, and Fe-Sn compounds in largeramounts at higher temperatures as the tin content increases.Liquid tin has substantial solubility in the solid iron; thuscompact swelling due to pore formation at prior particle sitesoccurs.
Decreasing the dimensional changes is attributed tothe formation of the Fe-Sn phase at higher temperatures,which has a lower coefficient of thermal expansion thaniron. Another cause of the dimensional growth might beattributed to the trapped hydrogen in the pores as thesintering process was performed in hydrogen atmosphere.
3.2. Mechanical Properties. Tensile strength for shaped spec-imens sintered in the specified conditions is presented inFigure 10 as a function of the tin content.
The tensile strength has the higher values for all composi-tions sintered at 900◦C and decreases with the decrease of theSn content. The same tendency is observed for all sinteringtemperatures. This behaviour may be due possibly to the for-mation at higher temperatures of some strengthening phaseslike Fe-Cu, Fe-Sn, Fe-Mo, and Cu-Sn and to the gradual
6 Advances in Tribology
5
4.5
4
3.53
2.52
1.5
10.5
54.5
43.5
32.5
28.2
8
8.48.6
8.89
V (
%)
>4<4<3.7<3.4
<3.1<2.8<2.5
<2.2<1.9<1.6
Ts/100 (◦ C/)
ts /10 (min/10)
Figure 7: The effect of sintering parameters on dimensionalchanges for alloy no. 1.
>3.2<3.2<2.9
<2.6<2.3<2
<1.7<1.4
3.43.2
32.82.62.42.2
21.81.61.41.2
1
54.5
43.5
32.5
28.2
8
8.48.6
8.89
ΔV
(%
)
Ts/100 (◦ C/)
ts /10 (min/10)
Figure 8: The effect of sintering parameters on dimensionalchanges for alloy no. 2.
increase of the solid skeleton solubility in the transient liquidphase as the temperature is getting higher.
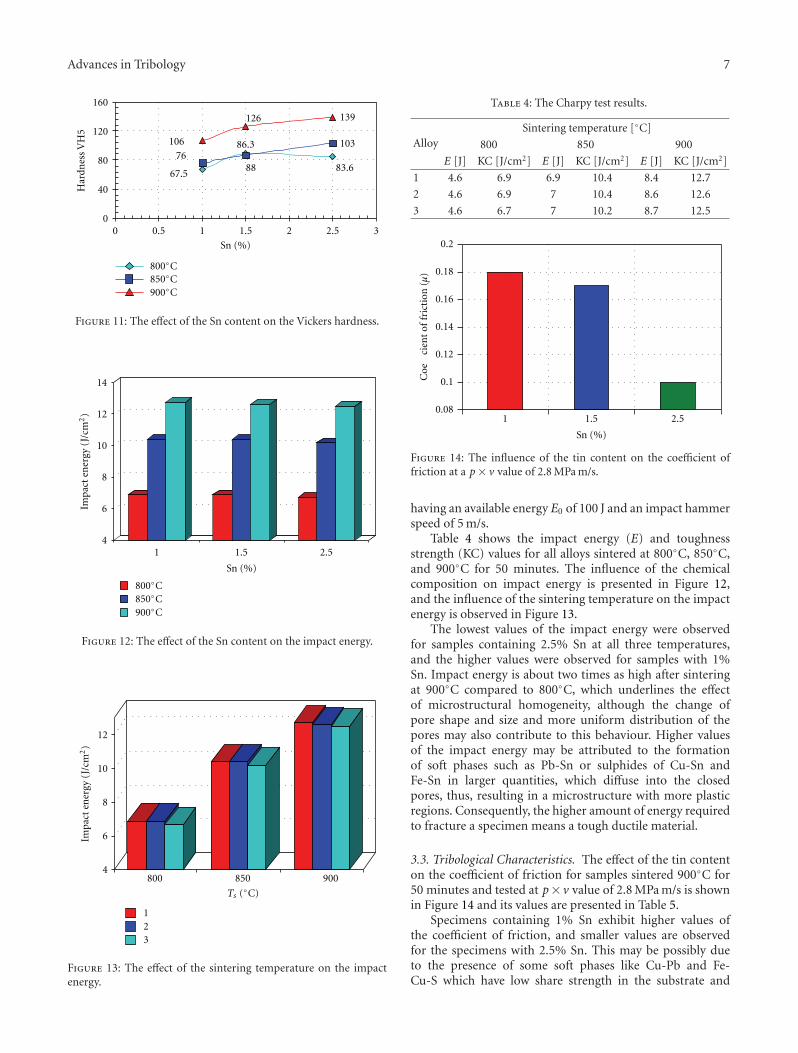
The influence of the chemical composition on thehardness and impact energy is depicted in Figures 11–13.
For all samples sintered at 900◦C the highest values of thehardness were obtained. All the selected compositions have
>3.6<3.6<3.4<3.2
<3
<2.8<2.6<2.4
<2.2<2
<1.8<1.6
3.83.63.43.2
32.82.62.42.2
21.81.6
ΔV
(%
)
Ts/100 (◦ C/)
ts /10 (min/10)
54.5
43.5
32.5
28.2
8
8.48.6
8.89
Figure 9: The effect of sintering parameters on dimensionalchanges for alloy no. 3.
171
153144
181160
150
205
164
186
100
150
200
250
0 0.5 1 1.5 2 2.5
Ten
sile
str
engt
h (
MPa
)
3
Sn (%)
800◦C850◦C900◦C
Figure 10: Influence of the Sn content on tensile strength.
almost the same hardness behaviour at all three sinteringtemperatures, except for the one containing 1.5% Sn and sin-tered at 800◦C which presents an increased value of the hard-ness. This can be explained by the presence of some strength-ening phases such as Fe-Sn, Fe-Cu, and Cu-Sn which formdue to longer time available for diffusion processes. Thehighest value of the hardness (139 VH5) was exhibited for thesample with 2.5% Sn sintered at 900◦C.
The aim of the Charpy test is to establish the notch tough-ness of the material, defined as the work (impact energy)used to fracture the specimen under test conditions. TheCharpy impact tests on unnotched samples were conductedwith an instrumented pendulum at room temperature
Advances in Tribology 7
103
139
83.667.5
8876
86.3106
126
00
40
80
120
160
Har
dnes
s V
H5
0.5 1 1.5 2 2.5 3
Sn (%)
800◦C850◦C900◦C
Figure 11: The effect of the Sn content on the Vickers hardness.
4
6
8
10
12
14
Impa
ct e
ner
gy (
J/cm
2)
1 1.5 2.5
Sn (%)
800◦C850◦C900◦C
Figure 12: The effect of the Sn content on the impact energy.
123
4
6
8
10
12
Impa
ct e
ner
gy (
J/cm
2)
800 850 900
Ts (◦C)
Figure 13: The effect of the sintering temperature on the impactenergy.
Table 4: The Charpy test results.
AlloySintering temperature [◦C]
800 850 900
E [J] KC [J/cm2] E [J] KC [J/cm2] E [J] KC [J/cm2]
1 4.6 6.9 6.9 10.4 8.4 12.7
2 4.6 6.9 7 10.4 8.6 12.6
3 4.6 6.7 7 10.2 8.7 12.5
0.08
0.1
0.12
0.14
0.16
0.18
0.2
2.51.51
Sn (%)C
oeci
ent
of fr
icti
on (μ
)
Figure 14: The influence of the tin content on the coefficient offriction at a p × v value of 2.8 MPa m/s.
having an available energy E0 of 100 J and an impact hammerspeed of 5 m/s.
Table 4 shows the impact energy (E) and toughnessstrength (KC) values for all alloys sintered at 800◦C, 850◦C,and 900◦C for 50 minutes. The influence of the chemicalcomposition on impact energy is presented in Figure 12,and the influence of the sintering temperature on the impactenergy is observed in Figure 13.
The lowest values of the impact energy were observedfor samples containing 2.5% Sn at all three temperatures,and the higher values were observed for samples with 1%Sn. Impact energy is about two times as high after sinteringat 900◦C compared to 800◦C, which underlines the effectof microstructural homogeneity, although the change ofpore shape and size and more uniform distribution of thepores may also contribute to this behaviour. Higher valuesof the impact energy may be attributed to the formationof soft phases such as Pb-Sn or sulphides of Cu-Sn andFe-Sn in larger quantities, which diffuse into the closedpores, thus, resulting in a microstructure with more plasticregions. Consequently, the higher amount of energy requiredto fracture a specimen means a tough ductile material.
3.3. Tribological Characteristics. The effect of the tin contenton the coefficient of friction for samples sintered 900◦C for50 minutes and tested at p× v value of 2.8 MPa m/s is shownin Figure 14 and its values are presented in Table 5.
Specimens containing 1% Sn exhibit higher values ofthe coefficient of friction, and smaller values are observedfor the specimens with 2.5% Sn. This may be possibly dueto the presence of some soft phases like Cu-Pb and Fe-Cu-S which have low share strength in the substrate and

8 Advances in Tribology
Table 5: Friction coefficient values and linear and gravimetric wear rates of the selected materials.
Alloy F [N] F f [N] μ Lslide [m] Δh [mm] Ih × 10−5 [mm/m] ΔV × 103 [mm3] Ig × 10−2 [mm3/m]
1 325 58.7 0.18 1360 0.55 40.4 0.154 11.3
2 325 58.1 0.17 1360 0.34 25 0.148 10.8
3 325 32.5 0.1 1360 0.24 17.6 0.135 9.8
0
5
10
15
20
25
30
35
40
45
2.51.51
Sn (%)
I h×
10−5
(mm
/m)
Figure 15: The influence of the tin content on the linear wear rate.
9
9.5
10
10.5
11
11.5
1 1.5 2.5
Sn (%)
I g×
10−2
(mm
3/m
)
Figure 16: The influence of the tin content on the gravimetric wearrate.
are exposed to sliding due to high load [8]. Generally, thevariation of the coefficient of friction can be explained on thebasis of the hardness variation (Figure 11). The coefficient offriction increases with the decrease of the hardness and theincrease of the share strength of the material, which means adirect proportionality with the hardness and an indirect pro-portionality with the share strength. Besides its great abil-ity to reduce friction between powder particles and bet-ween powder particles and die wall during conventional colddie compaction, MoS2 is used to reduce friction between me-tallic surfaces under certain conditions of application. An-other suitable approach for the application of MoS2 is its in-corporation in a metallic matrix in order to produce self-lu-bricating material [9]. Therefore, the presence of the solid lu-bricant MoS2 contributes to the reduction of the coefficientof friction. The solid lubricant particles get on the containingsurface during the sliding process and reduce the friction[10].
The linear wear rate was determined by measuring the fi-nal height of the samples at the end of the test and extracting
it from the initial height, giving the thickness of the wornlayer (Δh). Similarly, the gravimetric wear rate was foundby weighing the specimens after performing the test andcalculating their volume using reference densities. The finalresults represent the average values of three determinations.
Linear and gravimetric wear rates values are presented inTable 5. Figure 15 shows linear wear rate for samples withdifferent Sn additions sintered in the specified conditions,and Figure 16 shows the gravimetric wear rate as a functionof tin content.
From Figures 15 and 16 it can be observed that thewear rates (linear and gravimetric) of the material containing2.5% Sn and tested at p × v = 2.8 MPa m/s exhibited thelowest value of the wear rate. As for friction coefficient, wearrate exhibits an inverse relationship with hardness and adirect relationship with share strength. In spite of the greateramount of lead in samples with 1% Sn and 1.5% Sn, whichdiffuses to the surface and acts like a solid lubricant, highermass loss was quantified during the wear test indicating alow wear resistance. This behaviour may be possible due tothe higher normal load (p = 3.2 MPa) which increases theadhesive component when the substrate is exposed, and thetransfer of the soft phases (Pb, Sn-Pb, or sulphides) from thesample surface to the disc is enhanced by increasing the sharestress at the surface.
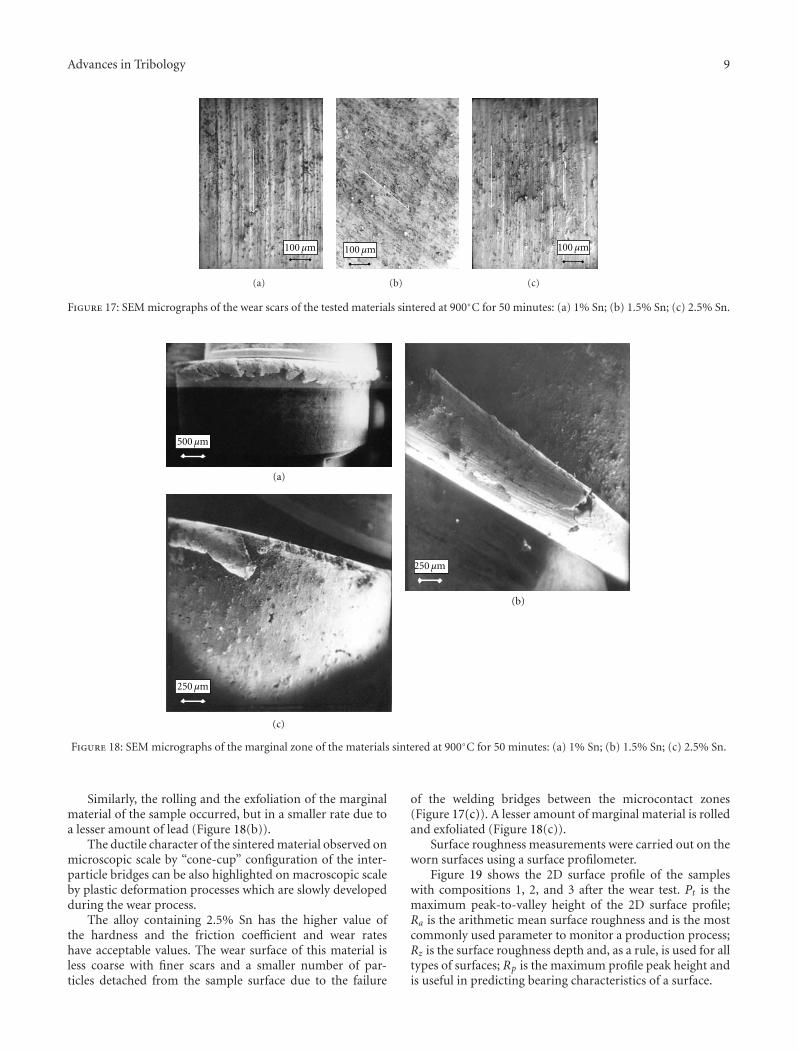
Figure 17 shows representative wear surfaces of the sam-ples sintered at 900◦C for 50 minutes and tested at p × v =2.8 MPa m/s. Also, the marginal zones of the samples high-lighting the material behaviour during wear process can beobserved in Figure 18. In order to study the surface damageworn specimens were examined using scanning electron mi-croscopy (SEM).
The worn surfaces present smeared pores and deeperwear tracks indicating that wear occurred due to combinedaction of adhesive and abrasive mechanisms with transferand microcutting of the tested material in all compositions.
The worn surface of the material containing 1% Snpresents deep scars, which are formed along the sliding di-rection due to the strong adhesion between roughs in contact(Figure 17(a)). The surface layers are modified and the oxidefilms are damaged by plastic deformation, subsequently newlayers being in contact.
Also, during the wear process the rolling or flanging ofthe marginal zone as well as the exfoliation of the materialcan be observed (Figure 18(a)). This behaviour is typical tosoft and ductile materials and may be explained by the greatamount of lead in the material composition.
The wear surface of the sample with 1.5% Sn shows lessdeep scars, but the wear surface is rougher and the detachedwear particles from the sample surface can be observed(Figure 17(b)).
Advances in Tribology 9
100 μm
(a)
100 μm
(b)
100 μm
(c)
Figure 17: SEM micrographs of the wear scars of the tested materials sintered at 900◦C for 50 minutes: (a) 1% Sn; (b) 1.5% Sn; (c) 2.5% Sn.
250 μm
250 μm
500 μm
(a)
(b)
(c)
Figure 18: SEM micrographs of the marginal zone of the materials sintered at 900◦C for 50 minutes: (a) 1% Sn; (b) 1.5% Sn; (c) 2.5% Sn.
Similarly, the rolling and the exfoliation of the marginalmaterial of the sample occurred, but in a smaller rate due toa lesser amount of lead (Figure 18(b)).
The ductile character of the sintered material observed onmicroscopic scale by “cone-cup” configuration of the inter-particle bridges can be also highlighted on macroscopic scaleby plastic deformation processes which are slowly developedduring the wear process.
The alloy containing 2.5% Sn has the higher value ofthe hardness and the friction coefficient and wear rateshave acceptable values. The wear surface of this material isless coarse with finer scars and a smaller number of par-ticles detached from the sample surface due to the failure
of the welding bridges between the microcontact zones(Figure 17(c)). A lesser amount of marginal material is rolledand exfoliated (Figure 18(c)).
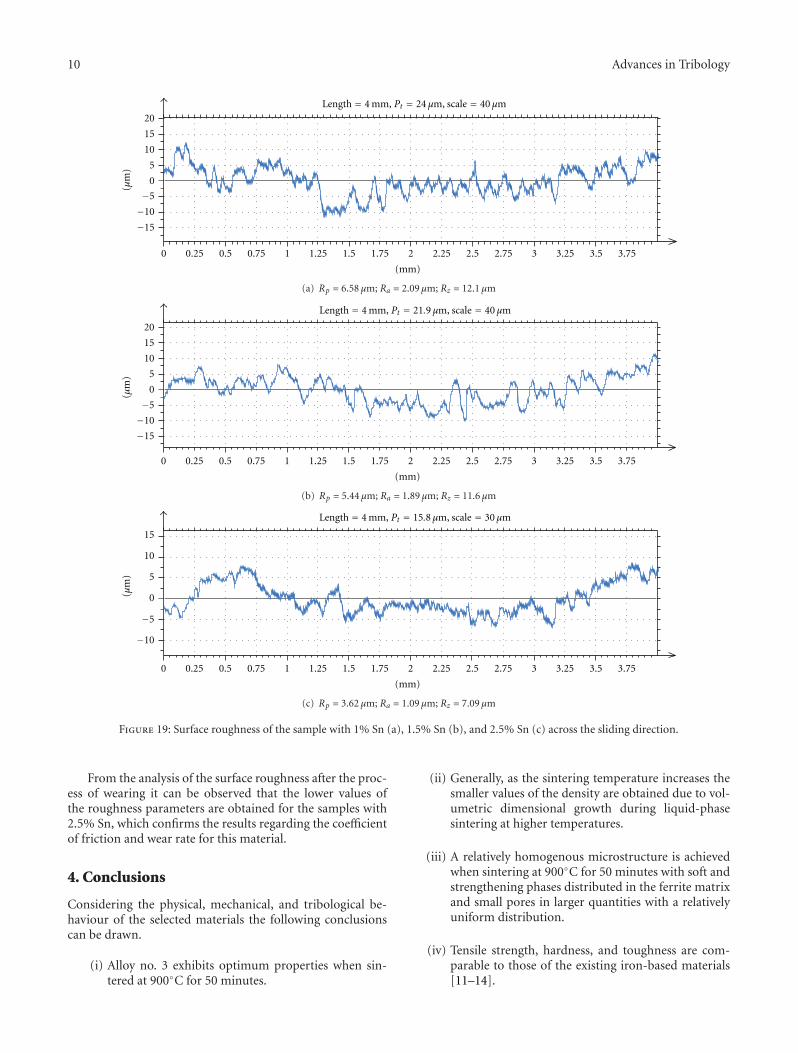
Surface roughness measurements were carried out on theworn surfaces using a surface profilometer.
Figure 19 shows the 2D surface profile of the sampleswith compositions 1, 2, and 3 after the wear test. Pt is themaximum peak-to-valley height of the 2D surface profile;Ra is the arithmetic mean surface roughness and is the mostcommonly used parameter to monitor a production process;Rz is the surface roughness depth and, as a rule, is used for alltypes of surfaces; Rp is the maximum profile peak height andis useful in predicting bearing characteristics of a surface.
10 Advances in Tribology
(mm)
(μm
)20
15
10
5
0
−5
−10
−15
0 0.25 0.5 0.75 1 1.25 1.5 1.75 2 2.25 2.5 2.75 3 3.25 3.5 3.75
Length = 4 mm, Pt = 24 μm, scale = 40 μm
(a) Rp = 6.58 μm; Ra = 2.09 μm; Rz = 12.1 μm
(mm)
(μm
)
20
15
10
5
0
−5
−10
−15
0 0.25 0.5 0.75 1 1.25 1.5 1.75 2 2.25 2.5 2.75 3 3.25 3.5 3.75
Length = 4 mm, Pt = 21.9 μm, scale = 40 μm
(b) Rp = 5.44 μm; Ra = 1.89 μm; Rz = 11.6 μm
Length = 4 mm, Pt = 15.8 μm, scale = 30 μm
0(μm
)
15
5
10
−5
−10
(mm)
0 0.25 0.5 0.75 1 1.25 1.5 1.75 2 2.25 2.5 2.75 3 3.25 3.5 3.75
(c) Rp = 3.62 μm; Ra = 1.09 μm; Rz = 7.09 μm
Figure 19: Surface roughness of the sample with 1% Sn (a), 1.5% Sn (b), and 2.5% Sn (c) across the sliding direction.
From the analysis of the surface roughness after the proc-ess of wearing it can be observed that the lower values ofthe roughness parameters are obtained for the samples with2.5% Sn, which confirms the results regarding the coefficientof friction and wear rate for this material.
4. Conclusions
Considering the physical, mechanical, and tribological be-haviour of the selected materials the following conclusionscan be drawn.
(i) Alloy no. 3 exhibits optimum properties when sin-tered at 900◦C for 50 minutes.
(ii) Generally, as the sintering temperature increases thesmaller values of the density are obtained due to vol-umetric dimensional growth during liquid-phasesintering at higher temperatures.
(iii) A relatively homogenous microstructure is achievedwhen sintering at 900◦C for 50 minutes with soft andstrengthening phases distributed in the ferrite matrixand small pores in larger quantities with a relativelyuniform distribution.
(iv) Tensile strength, hardness, and toughness are com-parable to those of the existing iron-based materials[11–14].
Advances in Tribology 11
(v) Tensile strength of 205 MPa, hardness of 139 VH5,and toughness of 12.5 J/cm2 were obtained for alloyssintered at 900◦C for 50 minutes and containing 2.5%Sn due to the presence of strengthening phases whichform at higher temperatures and longer sinteringtimes.
(vi) At the p × v = 2.8 MPa m/s the friction coefficient isabout 0.1, the linear wear rate has the lowest valueof 17.6 × 10⁻⁵ mm/m, and also the gravimetric wearrate has the lowest value of 9.8× 10⁻² mm3/m. Theseresults are explained on the basis of the presence ofsoft phases in the structure, which have low sharestrength in the substrate and during the high loadtests are exposed to sliding. Also, MoS2 solid lubri-cant additions contribute in the reduction of the coef-ficient of friction. On the other hand, wear rates ex-hibit lower values due to increasing the adhesive com-ponent at higher normal loads and exposure andtransfer of the soft phases from the sample surface tothe mating disc. As a consequence, the share stress atthe sample surface increases.
(vii) Studying the tribological behaviour of the samplesmade from the selected materials and tested in dryfriction condition (without lubricant) it was ob-served the dropping off of the friction coefficient asthe tin content increases. The linear wear rate and thegravimetric wear rate are smaller as the amount of tinis greater.
(viii) Electronic microscopy analysis of the wear surfacesof the samples sintered at 900◦C for 50 minutesand tested at p × v = 2.8 MPa m/s shows deep weartracks indicating that wear occurred due to combinedaction of adhesive and abrasive mechanisms withtransfer and microcutting of the tested material. Also,the marginal regions of the samples with rolled andexfoliated layers highlight the material behaviourduring wear process. Deeper scars along the slidingdirection due to the strong adhesion between roughsin contact exhibit sample with 1% Sn and their aspectcan be observed on the 2D surface profile. The wearsurface of the sample with 2.5% Sn is less coarsewith finer scars and a smaller number of particlesdetached from the sample surface. The differencebetween the scar aspects of the worn surfaces and alsothe difference between wear depths is emphasized on2D surface profiles by pick-to-valley height, Pt, androughness parameters, Ra and Rz, which have thelowest values for the sample with 2.5% Sn.
References
[1] A. G. Kostornov and O. I. Fushchich, “Sintered antifrictionmaterials,” Powder Metallurgy and Metal Ceramics, vol. 46, no.9-10, pp. 503–512, 2007.
[2] A. G. Kostornov, O. I. Fushchich, and T. M. Chevichelova,“Structurization in sintering of antifriction powder materialsbased on iron-copper alloys,” Powder Metallurgy and MetalCeramics, vol. 46, no. 11-12, pp. 589–594, 2007.
[3] Verghese and K. Gopinath, “Influence of antimony additionson sintered iron-copper bearing materials,” Key EngineeringMaterials, vol. 29-31, pp. 457–464, 1989.
[4] Y. M. Vasil’ev, G. A. Shvetsova, V. Y. Berent, and N. A. Bushe,“Antifriction properties of an iron-base material containinga manganese ultraphosphate,” Powder Metallurgy and MetalCeramics, vol. 21, no. 7, pp. 592–594, 1982.
[5] L. M. Berger, C. C. Stahr, S. Saaro, S. Thiele, M. Woydt, andN. Kelling, “Dry sliding up to 7.5 m/s and 800◦C of ther-mally sprayed coatings of the TiO2-Cr2O3 system and(Ti,Mo)(C,N)-Ni(Co),” Wear, vol. 267, no. 5-8, pp. 954–964,2009.
[6] R. M. German, P. Suri, and S. J. Park, “Review: liquid phasesintering,” Journal of Materials Science, vol. 44, no. 1, pp. 1–39,2009.
[7] W.-F. Wang, “Effect of tin addition on the microstructure de-velopment and corrosion resistance of sintered 304L stainlesssteels,” Journal of Materials Engineering and Performance, vol.8, no. 6, pp. 649–652, 1999.
[8] M. Chandrasekaran and P. Singh, “Effect of PB additionson the friction and wear of sintered FE-Cu-SN-MoS2,” Inter-national Journal of Powder Metallurgy, vol. 32, no. 1, pp. 51–58,1996.
[9] B. Sustarsic and L. Kosec, “Engineering properties of Fe-MoS2
powder mixtures,” in Proceedings of the Powder MetallurgyWorld Congress & Exhibition, pp. 316–321, Granada, Spain,1998.
[10] S. Dhanasekaran and R. Gnanamoorthy, “Developmentof self lubricating sintered steels for tribological applica-tions,” in Proceedings of the International Symposium ofResearch Students on Materials Science and Engineering, Chen-nai, India, 2004, http://mme.iitm.ac.in/isrs/isrs04/cd/content/Papers/AIS/OR-AIS-1.pdf.
[11] A. Domsa, Tehnologia Fabricarii Pieselor din Pulberi Metalice,Bucuresti, Romania, 1966.
[12] A. Salak, Ferrous Powder Metallurgy, Cambridge InternationalScience, Cambridge, UK, 1995.
[13] K. Tufekci, C. Kurbanoglu, E. Durak, and R. F. Tunay, “Fric-tion and wear properties of Cu and Fe-based P/M bearingmaterials,” Journal of Mechanical Science and Technology, vol.20, no. 4, pp. 513–521, 2006.
[14] M. Morakotjinda, R. Krataitong, P. Wila et al., “Sintered Fe-Cu-C materials,” Chiang Mai Journal of Science, vol. 35, no. 2,pp. 258–265, 2008.

Hindawi Publishing CorporationAdvances in TribologyVolume 2011, Article ID 395716, 5 pagesdoi:10.1155/2011/395716
Research Article
A Characterization Method for Al Recovery from Dross Basedon Compression at Elevated Temperatures
S. Maropoulos, D. Kountouras, X. Voulgaraki, S. Papanikolaou, and I. Sanaidis
Mechanical Engineering Department, Technical University of Western Macedonia, Koila, 50100 Kozani, Greece
Correspondence should be addressed to S. Maropoulos, [email protected]
Received 15 June 2011; Revised 20 September 2011; Accepted 26 September 2011
Academic Editor: Alexander Tsouknidas
Copyright © 2011 S. Maropoulos et al. This is an open access article distributed under the Creative Commons Attribution License,which permits unrestricted use, distribution, and reproduction in any medium, provided the original work is properly cited.
When aluminum or its alloys are melted, considerable amounts of dross are produced. The alloy type and the method used in theproduction of aluminum products play an important role in the amount of dross that will result as a byproduct. The current needsof the Al industry as well as economic and environmental factors demand the recovery of the pure material that is lost during drossremoval by simple and efficient methods that can be applied within the foundry. Most cases of Al recovery employ methods ofdross compression at high temperatures. This investigation attempts to develop a mathematical model to characterize the efficiencyof the recovery process that can be implemented for any dross collection method or even compression device, facilitating the directcomparison of recovery methods.
1. Introduction
The continuous film formed on the surface of liquid Al, com-monly referred to as dross, is a mixture of gasses, nitrides,carbides, and other substances, thus, partially partitioning tooxides [1, 2]. Due to the high temperatures that are present,the development of the above compounds is favored. As aresult, a percentage of approximately 1.5–2.5% [3] of thetotal amount of molten material is characterized as drossand removed from the liquid prior to casting. However,during the removal of dross, a certain amount of puremetal is trapped within its mass and is consequently wasted.Depending on the way dross is collected and removed fromthe foundry, it may contain up to 30–90% fully recyclable orrecoverable aluminum [4, 5] while remaining Al oxides canbe utilized in a series of other applications [6, 7].
The methods of dross removal in foundries are mainlyempirical, hardly reproducible, and are carried out eithermanually or by automated mechanical methods. The criteriafor implementing a dross collection method vary dependingon economic and technical factors and the means available.Bearing in mind that the collected material is furtherprocessed in a number of ways, it is not an easy task to com-pare methods adapted by different foundries.
Recently there has been a continuously growing demandto recycle novel materials such as Al, not only because ofthe depleting Al-ore reserves but also due to the increasingeffort to minimize the environmental footprint of industrialbyproducts and waste.
The present investigation seeks to introduce a simplesystematic way to compare Al recovery methods from drossbased on compression at elevated temperatures regardless tothe retrieval method or the employed device parameters. Amathematical model is developed, facilitating the characteri-zation of the recovery process in terms of productivity.
2. Experimental Procedure
During dross collection, each lot of material taken may differdepending on a number of parameters such as removalspeed, collection depth, and so forth. Most foundries em-ploy automated [8] or manual collection by means of amechanical ladle mounted on a clark or direct handling ofthe collection device by personnel [9]. In these cases thematerial removal process is not reproducible with regard toits composition since the aforementioned parameters cannotbe kept constant as the surface shear of this procedure isdescribed by rather complex phenomena [10].
2 Advances in Tribology
Liquid Al
DrossOverflow
Ladle
Dross collection
Containerfilled withmolten Al
OverflowAl
Ladle
LiquidAl
Dross
Collectiondepth
Aloxides
Gas
25 cm 50 cm
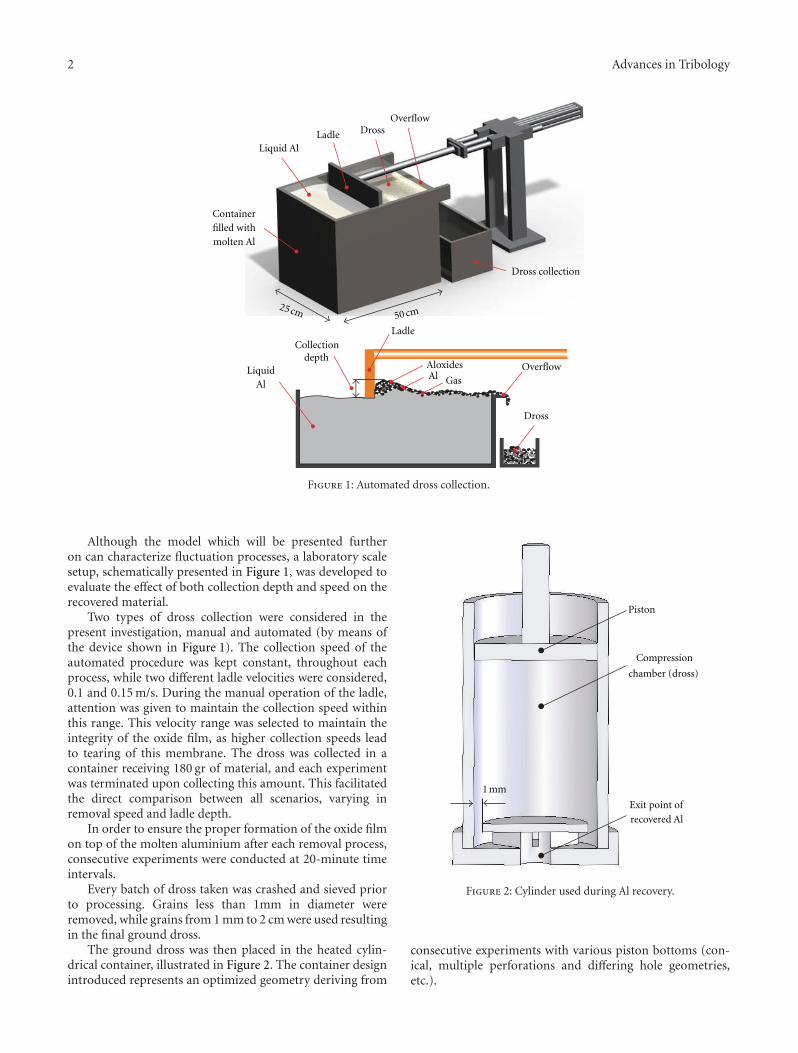
Figure 1: Automated dross collection.
Although the model which will be presented furtheron can characterize fluctuation processes, a laboratory scalesetup, schematically presented in Figure 1, was developed toevaluate the effect of both collection depth and speed on therecovered material.
Two types of dross collection were considered in thepresent investigation, manual and automated (by means ofthe device shown in Figure 1). The collection speed of theautomated procedure was kept constant, throughout eachprocess, while two different ladle velocities were considered,0.1 and 0.15 m/s. During the manual operation of the ladle,attention was given to maintain the collection speed withinthis range. This velocity range was selected to maintain theintegrity of the oxide film, as higher collection speeds leadto tearing of this membrane. The dross was collected in acontainer receiving 180 gr of material, and each experimentwas terminated upon collecting this amount. This facilitatedthe direct comparison between all scenarios, varying inremoval speed and ladle depth.
In order to ensure the proper formation of the oxide filmon top of the molten aluminium after each removal process,consecutive experiments were conducted at 20-minute timeintervals.
Every batch of dross taken was crashed and sieved priorto processing. Grains less than 1mm in diameter wereremoved, while grains from 1 mm to 2 cm were used resultingin the final ground dross.
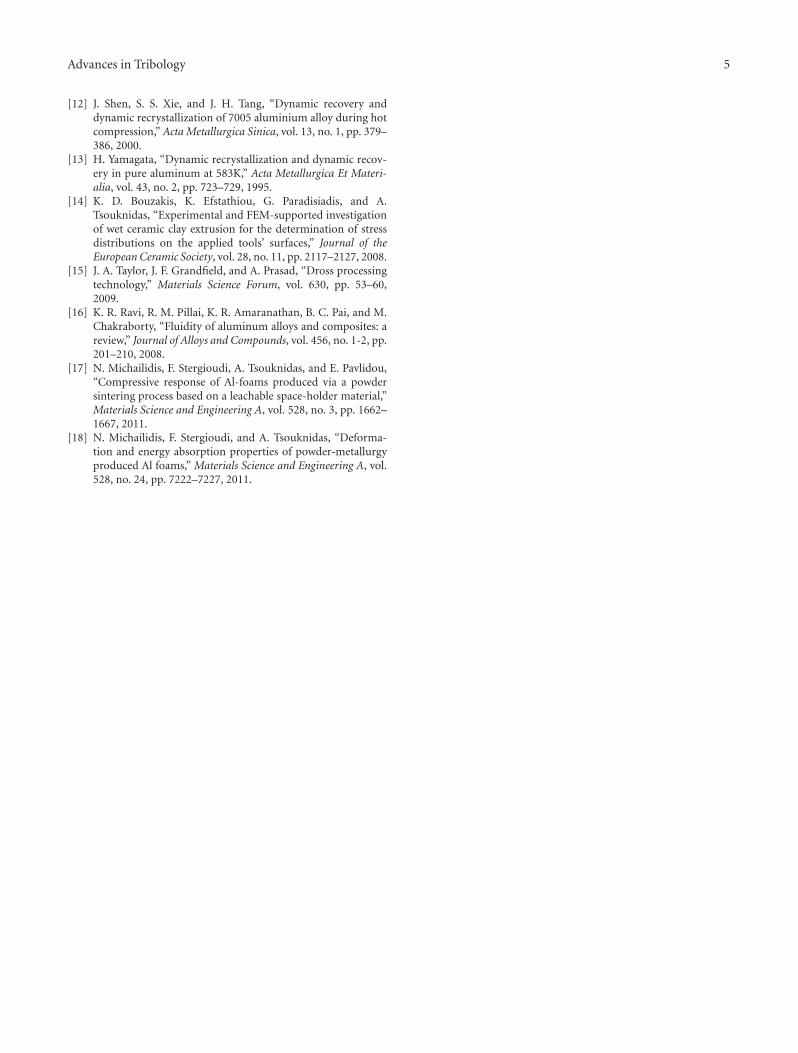
The ground dross was then placed in the heated cylin-drical container, illustrated in Figure 2. The container designintroduced represents an optimized geometry deriving from
Piston
Compression
chamber (dross)
Exit point of
recovered Al
1 mm
Figure 2: Cylinder used during Al recovery.
consecutive experiments with various piston bottoms (con-ical, multiple perforations and differing hole geometries,etc.).

Advances in Tribology 3
The final geometry consists of a 380 mm high cylinderwith a 55 mm diameter and a 1 mm peripheral exit gap el-evated by 3 mm from the cylinder bottom. The extrusionhole was 43 mm in diameter and 5 mm high.
The aforementioned cylinder was heated to 800◦C, priorto the experimental procedure, and the containing alu-minium was compressed by a piston while the temperaturewas kept constant. The aluminum released from the drossflows through the small 1 mm peripheral gap in the bottompart of the device and is collected in a container placedbelow the apparatus. This recovery procedure was chosensince compression of dross is a common practice during Alretrieval [11–13].
During the experiments, the maximum pressure waspredefined based on calculations considering the frictionof a semisolid material within an extrusion container [14].The pressure was applied by the hydraulic parts of theexperimental setup, thus forcing the piston to move. Theexperiment was stopped when there was no change in thepiston movement for the maximum applied pressure. Duringthe whole process, the control unit of the device registeredthe piston displacement versus the resulting forces.
3. Mathematical Model of the Recovery Process
There are a number of methods for the processing of drosswhich have been developed since 1980 [15]. Neverthelessthe collection of dross is based on the same principle, eitherthrough levity overflow or by skimming. Dross is composedof oxides, salts, pores and pure metal, thus, its volume Vtotal
can be described by
Vtotal = Voxide + Vsalt + Vpore + Vmetal, (1)
where Voxide is the volume of the oxides contained, Vsalt
the volume taken up by salt, Vpore the volume of the porescontained in the material which is usually air or foundrygases and finally, and Vmetal the volume of trapped metal.
The mechanical characteristic presenting the highestimpact on the recovery process is the pressure at whichthe metal will drain from the oxides-salts. The morphologyof the dross containing pores, ceramics (oxides), and Alresembles that of metal matrix composite materials.
As this is compressed, Al is removed and its measure ofelasticity is constantly altered. The pores within the drossdecrease, finally resulting in a mixture of oxides and saltwhich constitute the final measure of elasticity. It is worthmentioning that the relationship of the elasticity modulus ofthe composite material depends on the composition in metalpores and conglomerated oxides-salts.
Applying the rule of mixing (ROM) to (1) provides theelasticity modulus of this composite material (E) given by
Etotal = a× Eoxide + b× Esalt + c × Emetal, (2)
where a, b, and c are the volume percentage of oxides, saltand Al, respectively, and Eoxide, Esalt, and Emetal the elasticitymodulus of oxides, salt and Al. The volume percentage takenup by pores and gases is not taken into account in (2) since itdoes not modulate the materials elasticity modulus.
Eutectic alloyAlloy
FluidityIncreasing
+Decreasing−
Pure metal
Figure 3: Fluidity dependency of metals based on composition.
Automated collection 62% Al recovered (mean values based on 4 experiments)
Automated collection 47% Al recovered (mean values based on 4 experiments)
Manual collection 42% Al recovered (characteristic curve of manual collection)
Manual collection 38% Al recovered (characteristic curve of manual collection)
0
300
8642
250
200
150
100
50
Piston displacement (mm)
Rea
ctio
n fo
rce
at t
he
pist
on (
N)
12
1 3 4 2
100
Figure 4: Experimentally determined values for 4 varying caseswith the first method of a single collecting process per sample.
The fluidity of the collected material is a parameterstrongly affecting the recovery process. Increased fluidityeases the procedure and improves the efficiency. The alloycomponents play a particular role in determining the fluidity,as does the temperature. The fluidity dependency of metalsbased on composition can be described by Figure 3 [16].Based on this, the collected dross is additionally heatedover the metal melting point during the recovery process tofurther increase the fluidity of the material.
During the compression of the recovered Al, the reac-tion force of the piston versus its displacement can begraphically presented as shown in Figure 4. Curves 1 and3 represent characteristic manual dross collections selectedfrom 40 experiments in total. They show the typical behaviorexhibited by the experimental procedure. On the other hand,curves 2 and 4 relate to the automated collection and are themean values of 4 experiments for each of the selected processparameters (collection speed, depth, etc.).
The experiments were repeated as there was no repro-ducibility in either collection method, due to the hydrody-namic effect of the subsurface liquid interacting in variousways with the oxide film collected.
The curves presented in Figure 4 show the tendency ofthe elasticity modulus of composite materials [17, 18].
The depths of cleaning in each sample are shown inTable 1.
Figure 5 shows the relationship between the percentageof recovered material and the depth of collection. Byconsidering point A as the ideal process and B as the sloppycleaning process, then AB is considered as the distance

4 Advances in Tribology
Table 1: Cleaning depths of the experiments.
Experiment 1 2 3 4
Depth (mm) 4 12 6 8
0
10
20
30
40
50
60
70
80 100 120 140
Perc
enta
ge o
f re
cove
ry (
%)
Collection depth (mm)
A
B
34.86
y = 0.181x2 + 0.081x + 34.81
0 20 40 60
Figure 5: Percentage of recovery in relation to the depth ofcollection.
Perc
enta
ge o
f re
cove
ry (
%)
Collection speed (m/s)
53.16
4 8 12 16
31.67
12 mm collection depth
4 mm collection depth
0
10
20
30
40
50
60
70
0
Figure 6: The dependence of percentage of recovery on collectionspeed.
between perfection and sloppiness of collection in thespecific experiment.
A double derivative of the equation shown in Figure 5gives the minimum value of the curve which defines theminimum thickness of oxides that could be collected withthe above procedure at 0.36 mm. Submerging the ladle atthis depth during the automated processes results in a 32.1%percentage of Al recovery, which agrees well with the 34.86%corresponding to the theoretical optimum shown by thecurve in Figure 5.
The dependence of percentage of recovery on collectionspeed is shown in Figure 6. As can be seen, the effect of the
collection speed remains constant regardless of the collectiondepth selected.
4. Results and Discussion
A significant increase of collection speed would lead totearing of the continuous film formed on the surface of liquidAl while forcing pure Al to drift along, thus, collecting morepure material rather than dross decreasing the efficiency andincreasing the percentage of Al recovered. Increasing thecollection depth follows the same principle; the deeper theladle enters into the molten Al, the more pure Al is collectedthus rendering the process less productive.
5. Conclusions
The presented approach to Al recovery proves that the per-centage of recovered material is not indicative of the processquality since it may be attributed to overcollecting of pureAl. In order to compare a variety of reclaiming processes, theproductivity of the process has to be considered.
References
[1] Q. Han, W. Simpson, J. Zeh, E. Hatfield, and V. K. Sikka,“Dross formation during remelting of aluminum 5182 remeltsecondary ingot (RSI),” Materials Science and Engineering A,vol. 363, no. 1-2, pp. 9–14, 2003.
[2] O. Manfredi, W. Wuth, and I. Bohlinger, “Characterizing thephysical and chemical properties of aluminum dross,” Journalof Material, vol. 49, no. 11, pp. 48–51, 1997.
[3] J. Mukhopadhyay, Y. V. Ramana, and U. Singh, “Extractionof value added products from Aluminium dross material toachieve zero waste,” Light Metals, pp. 1209–1212, 2005.
[4] V. Kevorkijan, “Evaluating the aluminum content of presseddross,” Journal of Material, vol. 54, no. 2, pp. 34–36, 2002.
[5] S. Wang, H. Hu, Y. l. Chu, and P. Cheng, “Dross recovery ofAluminum alloy 380,” in Proceedings of the CastExpo, Atlanta,Ga, USA, May 2008.
[6] K.-D. Bouzakis, E. Bouzakis, G. Skordaris et al., “Effect ofPVD films wet micro-blasting by various Al2O3 grain sizeson the wear behaviour of coated tools,” Surface and CoatingsTechnology, vol. 205, supplement 2, pp. S128–S132, 2011.
[7] K. -D. Bouzakis, G. Skordaris, E. Bouzakis et al., “Opti-mization of wet micro-blasting on PVD films with variousgrain materials for improving the coated tools’ cutting perfor-mance,” CIRP Annals, vol. 60, no. 1, pp. 587–590, 2011.
[8] “Robotic dross removal melts away labor pain,” ManufacturingEngineering, vol. 124, no. 6, 2000.
[9] M. Ueda, S. Tsukamoto, S. Konda, and T. Ohtsuka, “Recoveryof aluminum from oxide particles in aluminum dross usingAlF 3-NaF-BaCl2 molten salt,” Journal of Applied Electrochem-istry, vol. 35, no. 9, pp. 925–930, 2005.
[10] K. D. Bouzakis, A. Tsouknidas, and G. Maliaris, “A wire cuttingtest to check the temperature distribution in inductivelyheated cylindrical aluminium billets at semi-solid materialstate,” Journal of Materials Processing Technology, vol. 210, no.1, pp. 166–173, 2010.
[11] J. Julliard, L. Tirilly, and P. Vigier, “Apparatus for the recoveryof liquid Aluminium by compression of hot dross,” US Patent4575056, 1986.
Advances in Tribology 5
[12] J. Shen, S. S. Xie, and J. H. Tang, “Dynamic recovery anddynamic recrystallization of 7005 aluminium alloy during hotcompression,” Acta Metallurgica Sinica, vol. 13, no. 1, pp. 379–386, 2000.
[13] H. Yamagata, “Dynamic recrystallization and dynamic recov-ery in pure aluminum at 583K,” Acta Metallurgica Et Materi-alia, vol. 43, no. 2, pp. 723–729, 1995.
[14] K. D. Bouzakis, K. Efstathiou, G. Paradisiadis, and A.Tsouknidas, “Experimental and FEM-supported investigationof wet ceramic clay extrusion for the determination of stressdistributions on the applied tools’ surfaces,” Journal of theEuropean Ceramic Society, vol. 28, no. 11, pp. 2117–2127, 2008.
[15] J. A. Taylor, J. F. Grandfield, and A. Prasad, “Dross processingtechnology,” Materials Science Forum, vol. 630, pp. 53–60,2009.
[16] K. R. Ravi, R. M. Pillai, K. R. Amaranathan, B. C. Pai, and M.Chakraborty, “Fluidity of aluminum alloys and composites: areview,” Journal of Alloys and Compounds, vol. 456, no. 1-2, pp.201–210, 2008.
[17] N. Michailidis, F. Stergioudi, A. Tsouknidas, and E. Pavlidou,“Compressive response of Al-foams produced via a powdersintering process based on a leachable space-holder material,”Materials Science and Engineering A, vol. 528, no. 3, pp. 1662–1667, 2011.
[18] N. Michailidis, F. Stergioudi, and A. Tsouknidas, “Deforma-tion and energy absorption properties of powder-metallurgyproduced Al foams,” Materials Science and Engineering A, vol.528, no. 24, pp. 7222–7227, 2011.
Hindawi Publishing CorporationAdvances in TribologyVolume 2011, Article ID 810254, 16 pagesdoi:10.1155/2011/810254
Review Article
Model of Fracture, Friction, and Wear Phenomena of Porous Iron
A. A. Shatsov, I. V. Ryaposov, and D. M. Larinin
Mechanical Technological Faculty, State National Research Politechnical University of Perm,29 Komsomolskii Avenue, Perm 614990, Russia
Correspondence should be addressed to A. A. Shatsov, [email protected]
Received 16 June 2011; Revised 8 September 2011; Accepted 8 September 2011
Academic Editor: Luca Settineri
Copyright © 2011 A. A. Shatsov et al. This is an open access article distributed under the Creative Commons Attribution License,which permits unrestricted use, distribution, and reproduction in any medium, provided the original work is properly cited.
Mechanical and tribotechnical features of powdered materials are strongly influenced by pore volume, fracture character,impurities, alloying, concentration inhomogeneity, friction conditions, and other factors. Pores also have influence on accelerationof diffusion processes and reduce undercooled austenite resistance. Annealed in hydrogen, ultra pure iron powder was used to studyporous iron features. Toughness fracture and tribotechnical features had nonmonotonic dependence from porosity different fromall known dependences got from technical iron powders. Researches brought out the fact that in process of porosity reductionby pressing and annealing cycles, the average dimension of porous is changed. According to the analysis of porous structure werecreated models of friction, wear, and fracture of pure porous iron.
1. Introduction
The last few decades studies conducted in highly techno-logically developed countries showed that proper choiceof friction pairs from the position of tribology could saveapproximately 1.5% of national income [1]. The usage ofpowdered materials best of all suits to the conditions ofeconomic feasibility, because it allows to replace expensiveand scarce alloys, increase productivity, and vacate produc-tion space. For example, the presence of residual pores inthe structure of the bearing material can increase details’durability from 1.5 to 10 times [2].
There are three groups of the main factors influencing thefriction: technological (structure, mechanical, and physicalproperties), constructive (contact scheme, the macro- andmicrogeometry, surface friction), and operational (specificfriction work, sliding velocity, specific load, temperature,presence of grease, medium).
The friction process causes the formation of surface andsubsurface layers which are conditioned by one or anotherfriction and wear mechanism.
The last years researches were aimed at mechanical char-acteristics determination, including fracture strength and itsconnection with tribotechnical and physical features [3–22].
The aim of this work is to investigate and to model thefriction, wear, and fracture processes of ultrapure iron.
2. Fracture Toughness of Ultrapure Porous Iron
Dependence of fracture toughness KIC and strength on po-rosity P is not always strictly monotonic function [3, 4].Defining this dependence is necessary for both theoreticalconcepts of crack interaction with defects and for specificpractical problems solution, for example, the choice of theporosity of construction products, which can provide thehighest fracture toughness. The main condition for deter-mining reliability of KIC is the proof of the crack propagationin plane strain. This requirement imposes limitations onsample size and crack length. Crack length should be at least2 mm and together with a groove to be 0.45–0.55 height ofthe specimen (GOST 25.506-85). The height of the sampleis usually taken 12 mm. According to the regulations, themost exacting requirements are imposed on the thickness,which should not be less than β(KIC/σ0.2)2, where β = 2.5.However, other factors like the flat fracture and absence ofthinning edges and lips cut, even if the porosity of iron havea few percent, indicate the reliability of the results. Thus,for the iron of high purity factor of proportionality β andthe ratio between the thickness to (KIC/σ0.2)2 was 0.3-0.4 [23]for powder Ni-Mo-Cu steel β = 1.6 [24]; for high-ductilitystainless steel at P = 5%, β = 0.04 [25]; for nickel steelsβ = 1.4 [26].

2 Advances in Tribology
Table 1: The dependence of powder materials fracture toughness on porosity and sample thickness.
Number of thecomposition
CompositionAtmosphere andsintering mode
Porosity, %The sample
thickness, mmFracture toughness,
MN/m3/2
1 15 2.80 9.5
2 134.60 10.0
Sample sizes:40× 18.4× 90 mm
10.0
3 PZh4M2 Vacuum, 1200◦C, 2 h 10 5.50 10.5
4 9 6.45 10.0
5 10 9.75 9.5
6
OSCh 6-2 Hydrogen, 1200◦C, 2 h
3.6 4.30 23.9
7 4.0 7.55 23.8
8 7.3 4.80 19.1
9 7.5 9.10 18.9
Note: The iron grade OSCh 6-2—the average particle size is 5 μm, the carbon content is less than 0.02% in mass, the total concentration of other impuritiesis less than 0.001%.
The correctness of the definition of KIC was examined byvarying the thickness of the samples (Table 1). For samplethickness ranging from 4.3 to 9.1 mm, β varies from 0.2to 5.5. The obtained values are within the limits of themeasurement inaccuracy confidence interval, which givesgrounds to take KQ for KIC . In all cases the sample thicknessof 3 mm provided a satisfactory convergence of the results.
The data (Table 1) prove the invariance of fracturestrength to a sample thickness. However, this does not meanthat KIC is invariant to the sample size for all porous steelsand alloys, therefore, the influence of size ratios on the KQ
should be determined experimentally for different materials.The choice of ultrapure iron is connected to a necessity
to minimize the unanswered effect of impurities. Otherimportant factors determining the fracture toughness arefracture mode, porosity, composition, and heterogeneity ofalloying elements. Most of these factors which influencethe KIC(P) dependence could be eliminated by the selectionof the material and the sample fabrication method. Theeffect of porosity on fracture toughness data cited in theliterature is contradictory. For example, a nonmonotonicdependence of KIC on P at room temperature and at −180◦Cwas determined [27]. A monotonic dependence KIC(P) hasbeen noticed by other authors [23, 25, 26, 28–32].
The authors of [21] do not exclude that the appearanceof nonmonotonic KIC(P) dependence is associated withredistribution of impurities, because the situation of highporosity it is energetically favorable for the impurities tolocate at the free surface of the pores, as well as the seals theymove into the matrix, concentrating at grain boundaries,thus reduce the level of fracture toughness.
Studies have shown [33] that comparing with theporosity, the more significant factor affecting the fracturetoughness is the proportion of interparticle destruction;also a linear correlation between KIC and the proportion oftransgranular cleavage (test temperature minus 196◦C) wasestablished.
Carbonyl iron OSCh 6-2 was annealed 1 hour inhydrogen at 450◦C before pressing to minimize the influence
of impurity atoms. The oxygen content weight in sinteredsamples of the iron did not exceed 0.01%.
For stochastically inhomogeneous bodies fracture tough-ness could be accurately estimated using the effective stressintensity factor KIC [34]. The structure of the sintered ironpowder is a single-phase material containing pores of varioussizes.
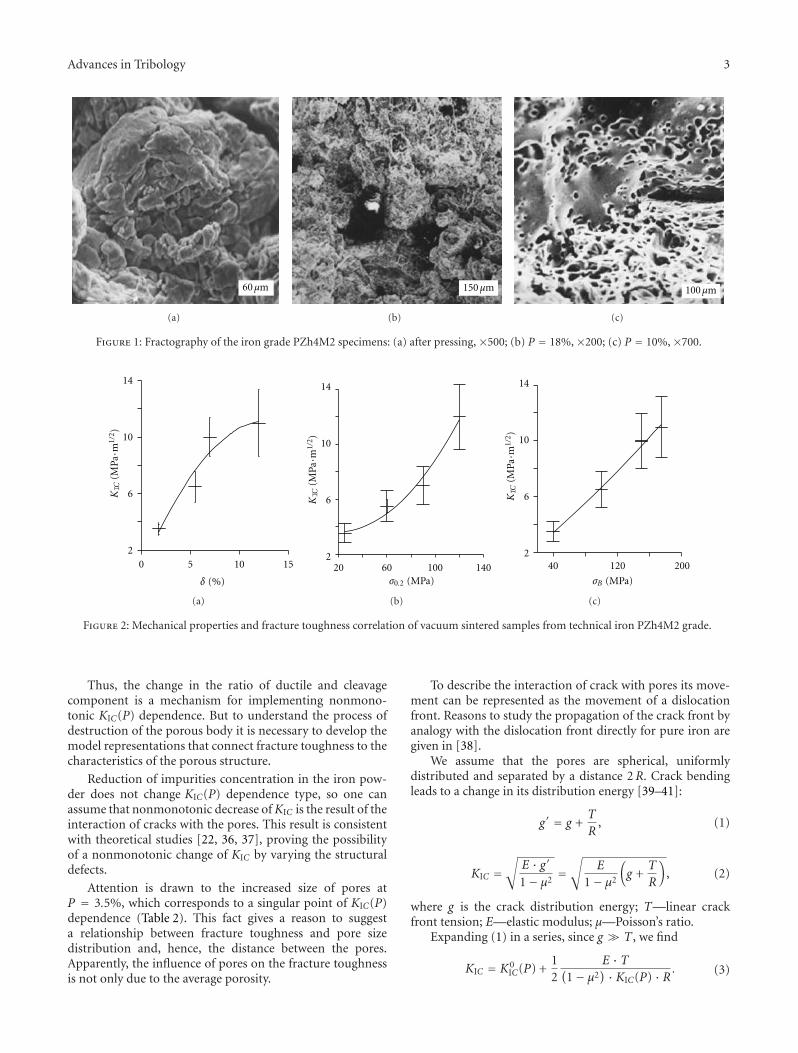
Fracture toughness of iron samples (PZh4M2) withporosity 10–16% practically coincides with that one givenin [33]. The porosity reduction is accompanied by a changefrom interparticle to transgranular ductile fracture mode(Figure 1). Therefore, a monotonic KIC increase is associatedwith a reduction of the proportion of intercrystallite fracturedue to increased interparticle metallic bonds. For the ironsamples, a correlation between KIC and mechanical proper-ties was established (Figure 2).
The relationship between intercrystallite and intragran-ular fracture components depends on the sintering atmo-sphere. Thus, after sintering at 1200◦C, 4 h in vacuum thefracture toughness of the 10% porosity samples was 10-11 MN/m3/2 and fracture mode was intercrystallite. Afterthe same sintering in hydrogen, the fracture toughnessof the same porosity iron samples (PZh4M2) was 20-21 MN/m3/2, and fracture mode was transgranular. Othermechanical properties increased less significantly: σB from180 to 320 MPa, σ0.2 from 100 to 140 MPa, and δ from 10to 16%.
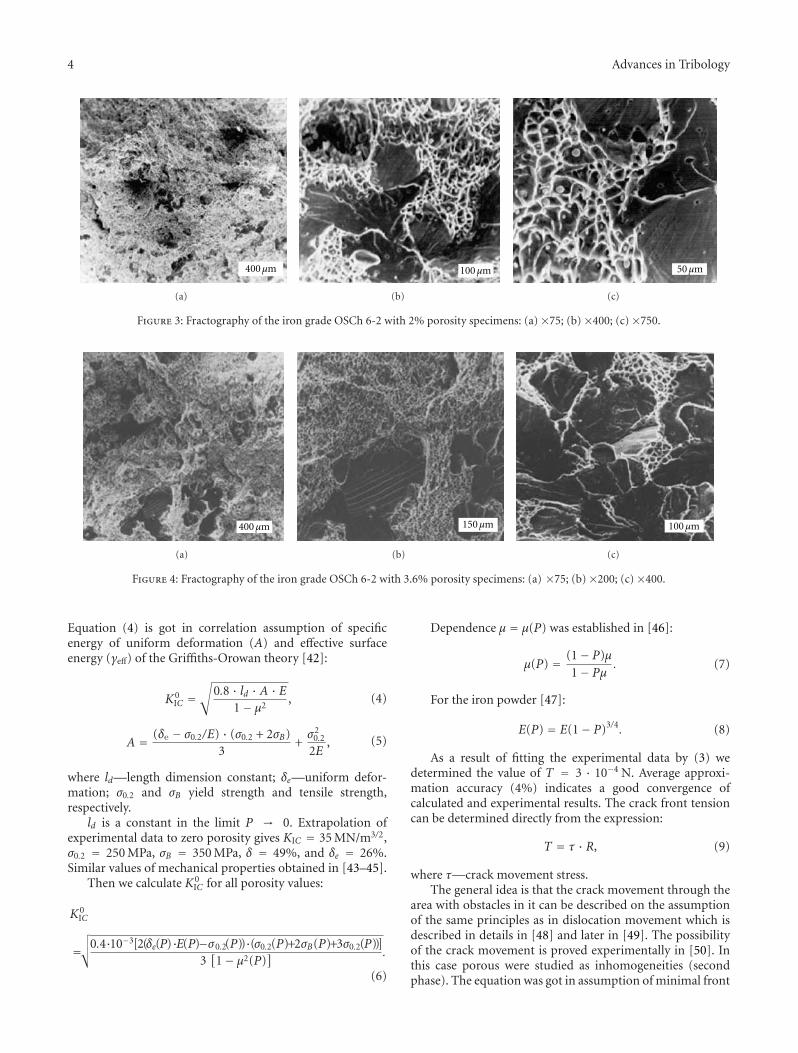
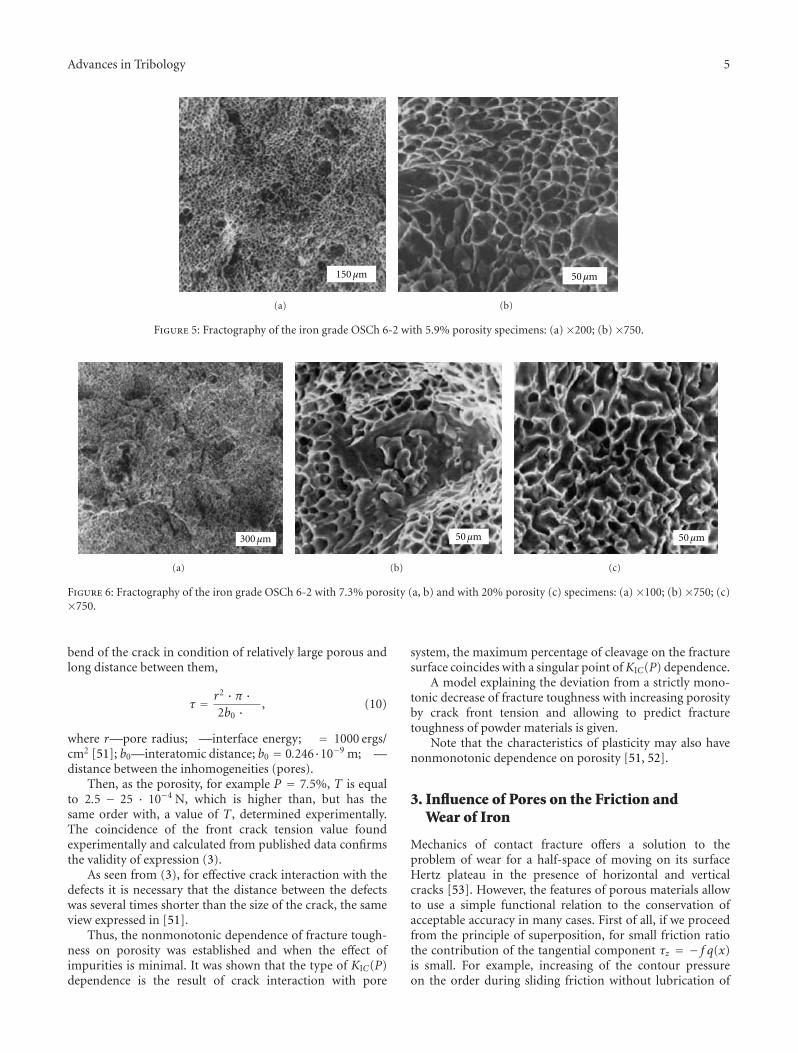
KIC values for samples of iron OSCh 2-6 were higherand the dependence of KIC on P (from 3 to 7%) was non-monotonic. Fracture mode was intragranular regardless ofporosity (Figures 3, 4, 5, and 6). The detailed fractographsstudy revealed that the highest proportion of cleavage on thefracture surface was in the samples with 3.5–4% porosity. Itcorresponds to the inflection point of the fracture toughnesson porosity dependence. The porosity changes leads to anincrease of the ductile component of the fracture surface, andP = 6% of the sites of cleavage fracture were not observed.With increasing porosity, pits were less deep and surfaceresembled a honeycomb fracture [35].
Advances in Tribology 3
60μm
(a)
150μm
(b)
100μm
(c)
Figure 1: Fractography of the iron grade PZh4M2 specimens: (a) after pressing, ×500; (b) P = 18%, ×200; (c) P = 10%, ×700.
14
10
6
20 5 10 15
KIC
()
MPa·m
1/2
δ (%)
(a)
14
10
6
2
KIC
()
MPa·m
1/2
20 60 100 140σ0.2 (MPa)
(b)
14
10
6
2
KIC
()
MPa·m
1/2
40 120 200
σB (MPa)
(c)
Figure 2: Mechanical properties and fracture toughness correlation of vacuum sintered samples from technical iron PZh4M2 grade.
Thus, the change in the ratio of ductile and cleavagecomponent is a mechanism for implementing nonmono-tonic KIC(P) dependence. But to understand the process ofdestruction of the porous body it is necessary to develop themodel representations that connect fracture toughness to thecharacteristics of the porous structure.
Reduction of impurities concentration in the iron pow-der does not change KIC(P) dependence type, so one canassume that nonmonotonic decrease ofKIC is the result of theinteraction of cracks with the pores. This result is consistentwith theoretical studies [22, 36, 37], proving the possibilityof a nonmonotonic change of KIC by varying the structuraldefects.
Attention is drawn to the increased size of pores atP = 3.5%, which corresponds to a singular point of KIC(P)dependence (Table 2). This fact gives a reason to suggesta relationship between fracture toughness and pore sizedistribution and, hence, the distance between the pores.Apparently, the influence of pores on the fracture toughnessis not only due to the average porosity.
To describe the interaction of crack with pores its move-ment can be represented as the movement of a dislocationfront. Reasons to study the propagation of the crack front byanalogy with the dislocation front directly for pure iron aregiven in [38].
We assume that the pores are spherical, uniformlydistributed and separated by a distance 2R. Crack bendingleads to a change in its distribution energy [39–41]:
g′ = g +T
R, (1)
KIC =√
E · g′1− μ2
=√
E
1− μ2
(g +
T
R
), (2)
where g is the crack distribution energy; T—linear crackfront tension; E—elastic modulus; μ—Poisson’s ratio.
Expanding (1) in a series, since g � T , we find
KIC = K0IC(P) +
12
E · T(1− μ2
) · KIC(P) · R . (3)
4 Advances in Tribology
400μm
(a)
100μm
(b)
50μm
(c)
Figure 3: Fractography of the iron grade OSCh 6-2 with 2% porosity specimens: (a) ×75; (b) ×400; (c) ×750.
400μm
(a)
150μm
(b)
100μm
(c)
Figure 4: Fractography of the iron grade OSCh 6-2 with 3.6% porosity specimens: (a) ×75; (b) ×200; (c) ×400.
Equation (4) is got in correlation assumption of specificenergy of uniform deformation (A) and effective surfaceenergy (γeff) of the Griffiths-Orowan theory [42]:
K0IC =
√0.8 · ld · A · E
1− μ2, (4)
A = (δe − σ0.2/E) · (σ0.2 + 2σB)3
+σ2
0.2
2E, (5)
where ld—length dimension constant; δe—uniform defor-mation; σ0.2 and σB yield strength and tensile strength,respectively.
ld is a constant in the limit P → 0. Extrapolation ofexperimental data to zero porosity gives KIC = 35 MN/m3/2,σ0.2 = 250 MPa, σB = 350 MPa, δ = 49%, and δe = 26%.Similar values of mechanical properties obtained in [43–45].
Then we calculate K0IC for all porosity values:
K0IC
=√√√0.4·10−3[2(δe(P)·E(P)−σ0.2(P))·(σ0.2(P)+2σB(P)+3σ0.2(P))]
3[1− μ2(P)
] .
(6)
Dependence μ = μ(P) was established in [46]:
μ(P) = (1− P)μ1− Pμ
. (7)
For the iron powder [47]:
E(P) = E(1− P)3/4. (8)
As a result of fitting the experimental data by (3) wedetermined the value of T = 3 · 10−4 N. Average approxi-mation accuracy (4%) indicates a good convergence ofcalculated and experimental results. The crack front tensioncan be determined directly from the expression:
T = τ · R, (9)
where τ—crack movement stress.The general idea is that the crack movement through the
area with obstacles in it can be described on the assumptionof the same principles as in dislocation movement which isdescribed in details in [48] and later in [49]. The possibilityof the crack movement is proved experimentally in [50]. Inthis case porous were studied as inhomogeneities (secondphase). The equation was got in assumption of minimal front
Advances in Tribology 5
150μm
(a)
50μm
(b)
Figure 5: Fractography of the iron grade OSCh 6-2 with 5.9% porosity specimens: (a) ×200; (b) ×750.
300μm
(a)
50μm
(b)
50μm
(c)
Figure 6: Fractography of the iron grade OSCh 6-2 with 7.3% porosity (a, b) and with 20% porosity (c) specimens: (a) ×100; (b) ×750; (c)×750.
bend of the crack in condition of relatively large porous andlong distance between them,
τ = r2 · π ·2b0 · , (10)
where r—pore radius; —interface energy; = 1000 ergs/cm2 [51]; b0—interatomic distance; b0 = 0.246·10−9 m; —distance between the inhomogeneities (pores).
Then, as the porosity, for example P = 7.5%, T is equalto 2.5 − 25 · 10−4 N, which is higher than, but has thesame order with, a value of T , determined experimentally.The coincidence of the front crack tension value foundexperimentally and calculated from published data confirmsthe validity of expression (3).
As seen from (3), for effective crack interaction with thedefects it is necessary that the distance between the defectswas several times shorter than the size of the crack, the sameview expressed in [51].
Thus, the nonmonotonic dependence of fracture tough-ness on porosity was established and when the effect ofimpurities is minimal. It was shown that the type of KIC(P)dependence is the result of crack interaction with pore
system, the maximum percentage of cleavage on the fracturesurface coincides with a singular point ofKIC(P) dependence.
A model explaining the deviation from a strictly mono-tonic decrease of fracture toughness with increasing porosityby crack front tension and allowing to predict fracturetoughness of powder materials is given.
Note that the characteristics of plasticity may also havenonmonotonic dependence on porosity [51, 52].
3. Influence of Pores on the Friction andWear of Iron
Mechanics of contact fracture offers a solution to theproblem of wear for a half-space of moving on its surfaceHertz plateau in the presence of horizontal and verticalcracks [53]. However, the features of porous materials allowto use a simple functional relation to the conservation ofacceptable accuracy in many cases. First of all, if we proceedfrom the principle of superposition, for small friction ratiothe contribution of the tangential component τz = − f q(x)is small. For example, increasing of the contour pressureon the order during sliding friction without lubrication of

6 Advances in Tribology
Table 2: The dependence of porosity on the mechanical properties of OSCh 6-2 iron.
Porosity, % Average pore diameter, micronsσ0.2 σB δ δe
MPa %
2.7 1.2 215 328 41 18
3.5 2.0 170 301 30 12
6.0 1.4 162 293 29 12
7.5 1.7 130 240 26 10
12.7 — 125 235 25 9.2
20 1.8 71 151 12 4.5
oil-impregnated steel PA-ZhGr1 with 20% porosity resultsin f changes only by 17% and the wear rate—on the order.Secondly, the problem is solved for certain contact surfaces.At the same contact type, changes of f are relatively small(compared to the differences between the friction ratios fordifferent interactions types), and porous materials have thesame trend. Relationship between wear rate and the vari-able parameters (especially pressure) within the proposedsolutions were selected empirically using the coefficients thatindirectly takes into account the contribution of the frictionratio.
Physico-mechanical and antifrictional properties of het-erogeneous powder materials depend on several factorswhich are the chemical composition, heat treatment, vari-ations in the density and distribution of alloying elements,content and distribution of related impurities, and so forth.
Some factors mentioned could be eliminated as a resultof using pure iron [21, 54, 55]. But high content ofimpurities in industrial iron powder, insufficient porousstructure description, and narrow ranges of the test pressurevariation are the reasons of determination impossibility ofthe contribution of each measured parameters with highreliability.
The dependence of friction ratio f and wear rate onthe porosity P and the pressure Pn were studied in wideranges (P = 2–20%, Pn = 0.25–4.2 MPa) for samples ofpure iron (OSCh 6-2). Porosity was decreased by cyclesof repressing and annealing. The size distribution of wearparticles (Figure 7) were studied by microscope “Neophot-21”. Distribution shows that wear fractions are considerablysmaller then porous (Table 2) and can influence on fric-tion conditions, the forming surface geometry, and it caninfluence especially strongly on oil layers appearance duringboundary friction of infiltrated with oil samples.
Friction surface was studied by scanning microscopeSEM-200 (Figure 8). Tribological properties were deter-mined by SMC-2, with hardened steel 45 (GOST 26614-85)as a friction pair. X-ray diffraction analysis was made on aDRON-2 in the λ-Co radiation.
On the friction surfaces, inclusions (presumably oxides)and microcutting traces were found, Figure 8. Such surfacesare typical for powder compacts, working at hard conditions.The friction ratio has a pronounced nonmonotonic depen-dence on the porosity with a maximum about P = 4%, whichcoincides with the minimum of KIC(P) dependence.
50
40
30
20
10
0.2 0.4 0.6 0.8
Part
icle
volu
me
frac
tion
(%)
0
0Particle size (μm)
Figure 7: The size distribution of wear particles.
Since there is a correlation between friction ratio andwear characteristics, and wear resistance is related to pore size[56], it can be assumed that the local extremum of f (P) isalso associated with the peculiarities of the porous structure.
Narrow ranges of friction ratio variation allow to suggestprorated relationship between contour (Pc) and nominalpressure (Pn) [57, 58].
The experimental data was treated as follows. For eachvalue of porosity, friction ratio deformation component fd[59] was calculated (11), suggesting that the conditions of theunsaturated plastic contact would be met. The equation wasgot in assumption of an additive contribution of molecularand deformative component of friction force. Deformativecomponent is caused by the deformation of a less hard bodyby a harder one:
fd = 0.5 1/2(Pc
HB
)0.25
≈(C · Pn
HB
)0.25
, (11)
where —microroughnesses characteristic of a rigid mate-rial of the friction pair, Pc—contour pressure, and HB—hardness, C—constant. The value of was in the range10−1–10−3 [59].

Advances in Tribology 7
400μm
(a)
400μm
(b)
Figure 8: Friction surface of porous iron OSCh 6-2 specimen, ×50: (a) 2% porosity, (b) 20% porosity.
Type of mechanical treatment determines the value ofthe microroughnesses characteristic. The pressure P and thehardness values are shown in Table 3.
In the first approximation, the molecular component offriction ratio fm decreases proportional to (1 − P), since fmis proportional to the area A, where shear stresses τ appear.This is due to the fact that the pore size (several microns)in 1-2 orders of magnitude higher than the arithmetic meandeviation of profile Ra = 0.09 micron, hence, the contactbetween the surfaces in the area of the pores is unlikely. Fora porous material [59], assuming fm decreasing in (1 − P)times and the proportionality of Pn and Pc and subsequentcalculating the β and τ, we can write
fm = (1− P)(β +
τ0
Pn
), (12)
where β and τ0 are friction characteristics depending on thefriction conditions.
Friction characteristics β and τ0 were calculated for eachvalue of porosity, varying only the Pn, and then by the leastsquares method we found expressions for β and τ0 from P:
β(P) = 0.00677 + 0.0103 · P − 0.000394 · P2, (13)
τ0(P) = 0.05(5) + 0.000532 · P2 − 0.0000267 · P3. (14)
The number of regression equations members and theirsignificance was determined by minimizing the residualvariance Sost [60], the model adequacy was tested by theFisher criterion F.
For the significance level 0.25, that is, the probability thatthe hypothesis can be rejected, the tabulated value of F is2.0. The values of F, equal to 2.3 and 7.7, calculated fromexpressions (13) and (14), respectively, exceeded tabularvalues, therefore, the equations are adequate.
Behavior of stressed porous materials has some specialfeatures [61]. Firstly, the pores reduce the range of physicaland mechanical properties of the material, and secondly,pores are obstacles for dislocation motion and crack growth.
Assuming that the separation of the wear particles is dueto crack formation and its subsequent growth, and as thepore was examined as an obstacle for the crack movement
which is similar to the dislocation movement, so stress canbe calculated by the formula [48]:
τm = a ·G · BR
, (15)
where τm—crack movement stress in porous material; a ≈1—coefficient; G—shear modulus; B—Burgers vector; R—the distance between the pores. τm does not act on theentire area, but only in places of contact. The bearing surfacecurve is usually given with tp-ε coordinates. On the basisof theoretical researches, Kragelskii and Demkin proved thatthe Kragelskii-Demkin equation can be used for the top ofthe bearing surface curve [59]:
tp = b · εν, (16)
where tp—relative contact area; b and ν are bearing surfacecurve parameters; ε—relative approach.
The bearing surface curve parameters b = 3.5 and ν =1.8 were taken from [59]. Kragelskii and Mihin establishedduring theoretical and empirical studies that real field ofcontact is proportional to applied load and doesn’t dependon roughness of the surface (during a plastic contact). Itterms of it relative approach can be determined with theformula [59]:
ε =(α1 · C1 · Pnb ·HB
)1/ν
, (17)
where α1—the coefficient depending on the type of contact(it varies from 0.5 to 1) α1 ≈ 0.75; C1—the constant thatrelates the contour and nominal pressure.
Since the relation of tensions acting on contour area (τm ·tp) to contour pressure Pc is analogous to a correspondedforces relation [62], so dependence of inhibition of the crackin the pores on the friction ratio can be determined from theexpression:
f = τmC1 · Pc · tp, (18)
where τm—stress; f —friction ratio change. Therefore, theapproximation value of fm was carried out further in viewof f . Accounting of the possibility of crack inhibition by
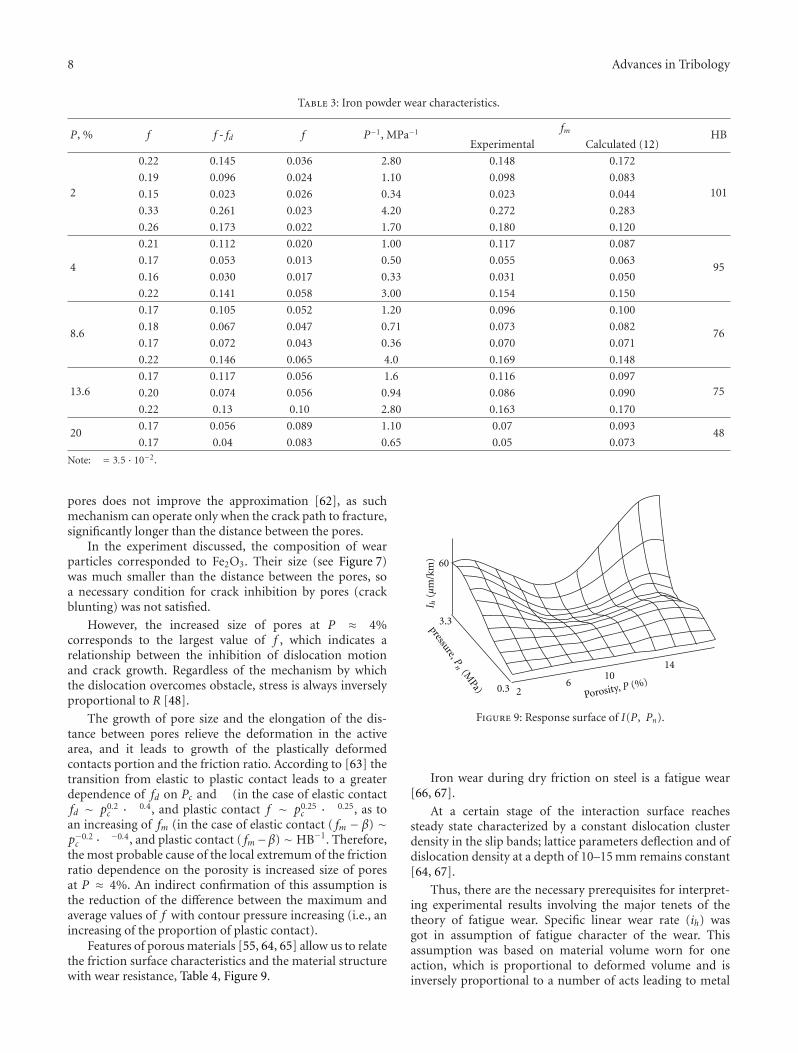
8 Advances in Tribology
Table 3: Iron powder wear characteristics.
P, % f f - fd f P−1, MPa−1 fm HBExperimental Calculated (12)
2
0.22 0.145 0.036 2.80 0.148 0.172
1010.19 0.096 0.024 1.10 0.098 0.083
0.15 0.023 0.026 0.34 0.023 0.044
0.33 0.261 0.023 4.20 0.272 0.283
0.26 0.173 0.022 1.70 0.180 0.120
4
0.21 0.112 0.020 1.00 0.117 0.087
950.17 0.053 0.013 0.50 0.055 0.063
0.16 0.030 0.017 0.33 0.031 0.050
0.22 0.141 0.058 3.00 0.154 0.150
8.6
0.17 0.105 0.052 1.20 0.096 0.100
760.18 0.067 0.047 0.71 0.073 0.082
0.17 0.072 0.043 0.36 0.070 0.071
0.22 0.146 0.065 4.0 0.169 0.148
13.60.17 0.117 0.056 1.6 0.116 0.097
750.20 0.074 0.056 0.94 0.086 0.090
0.22 0.13 0.10 2.80 0.163 0.170
200.17 0.056 0.089 1.10 0.07 0.093
480.17 0.04 0.083 0.65 0.05 0.073
Note: = 3.5 · 10−2.
pores does not improve the approximation [62], as suchmechanism can operate only when the crack path to fracture,significantly longer than the distance between the pores.
In the experiment discussed, the composition of wearparticles corresponded to Fe2O3. Their size (see Figure 7)was much smaller than the distance between the pores, soa necessary condition for crack inhibition by pores (crackblunting) was not satisfied.
However, the increased size of pores at P ≈ 4%corresponds to the largest value of f , which indicates arelationship between the inhibition of dislocation motionand crack growth. Regardless of the mechanism by whichthe dislocation overcomes obstacle, stress is always inverselyproportional to R [48].
The growth of pore size and the elongation of the dis-tance between pores relieve the deformation in the activearea, and it leads to growth of the plastically deformedcontacts portion and the friction ratio. According to [63] thetransition from elastic to plastic contact leads to a greaterdependence of fd on Pc and (in the case of elastic contactfd ∼ p0.2
c · 0.4, and plastic contact f ∼ p0.25c · 0.25, as to
an increasing of fm (in the case of elastic contact ( fm − β) ∼p−0.2c · −0.4, and plastic contact ( fm−β) ∼ HB−1. Therefore,
the most probable cause of the local extremum of the frictionratio dependence on the porosity is increased size of poresat P ≈ 4%. An indirect confirmation of this assumption isthe reduction of the difference between the maximum andaverage values of f with contour pressure increasing (i.e., anincreasing of the proportion of plastic contact).
Features of porous materials [55, 64, 65] allow us to relatethe friction surface characteristics and the material structurewith wear resistance, Table 4, Figure 9.
0.3
3.3
60
26
1014
Porosity, P (%)
pressure,(M
Pa)
I h(μ
m/k
m)
Pn
Figure 9: Response surface of I(P, Pn).
Iron wear during dry friction on steel is a fatigue wear[66, 67].
At a certain stage of the interaction surface reachessteady state characterized by a constant dislocation clusterdensity in the slip bands; lattice parameters deflection and ofdislocation density at a depth of 10–15 mm remains constant[64, 67].
Thus, there are the necessary prerequisites for interpret-ing experimental results involving the major tenets of thetheory of fatigue wear. Specific linear wear rate (ih) wasgot in assumption of fatigue character of the wear. Thisassumption was based on material volume worn for oneaction, which is proportional to deformed volume and isinversely proportional to a number of acts leading to metal

Advances in Tribology 9
Table 4: Iron powder characteristics.
P, %Ih, microns/km
P, MPa KIC , MPa ·m1/2 μ d · 106, m HBExperimental Calculated (27)
2
6.2 3.8 0.35
32.0 0.28 1.14 1019.3 12.2 0.89
24.0 23.7 1.49
66.8 57.6 2.95
4
3.7 2.5 0.24
24.6 0.28 2.02 957.0 8.1 0.60
18.6 15.6 1.00
40.9 38.0 —
60.4 63.9 2.00
8.6
4.6 3.5 0.33
18 0.27 1.78 7610.6 11.4 0.83
20.0 — 1.40
23.3 22.2 2.80
69.8 90.8 4.20
13.6
4.3 3.7 0.25
7511.2 9.0 0.64 17 0.26 1.79
23.2 17.1 1.06
4.6 3.7 0.36
2016.3 11.9 0.90 8 0.25 1.83 48
21.1 22.9 1.50
62.6 57.8 3.10
fracture [63]:
ih =√
ν/42(ν + 1)nkr
·√h/Rcv, (19)
where h—the rapprochement between the friction surfaces;Rcv = 77 microns [68]—the radius of curvature; nkr—thenumber of cycles, leading to the fracture.
Integral linear wear rate Ih, and specific ih wear rate arerelated by [69]:
Ih ≈ ih · tp ≈√
ν/42(ν + 1)nkr
·√h/Rcv · tp. (20)
Rapprochement between the two surfaces when theunsaturated plastic contact takes place [59]:
h = ε · Rmax =(α · Pcb ·HB
)1/ν
· Rmax, (21)
where Rmax—the greatest distance between the bumps andhollows within the gauge length.
Solving (19)–(21), we obtain the basic equation of wear
Ih = 0.0156nkr
·(Pc
HB
)1.28
. (22)
Fatigue wear theory assumes localized damage in asmall volume. As follows from the fracture mechanics, theseparation of particles occurs when the stress concentrationreaches the critical value KIC .
This magnitude of stress concentration corresponds toa critical crack length lc. Dependence of stress intensity
factor K with the crack propagation rate dl/dN in case ofendurance fracture determined by Paris formula:
dl
dN= A( K)n, (23)
where N—number of cycles; A and n—coefficients. Fatiguecrack growth studies have shown that the coefficient Adepending on the strain hardening varies from 1.16 · 10−5
to 6.77 ·10−7; n exponent reduces from 4.0 (for the degree ofcold deformation of 50%) to 2.88 (at baseline) [70].
The stress intensity on the crack top determines stressintensity factor K which is a tension and crack length lfunction. For short cracks (l/ar < 0.03, ar—contact padradius) it is written in the paper [53] like
K = 2σy√l, (24)
where σy—fracture stress; l—crack length. In the case ofHertz contact at the contact area interface [53]:
σy = 1− 2μ2
· Pc. (25)
The contact between the friction surfaces is carried outonly in the microroughnesses contact plane. In this case,a critical crack length which is corresponded to a criticalvolume of stress intensity factor KIC , the real contact areais counted by introducing tp taking into account (16), (17),(24), and (25) can be written like
l =[
KIC · tp(1− 2μ
) · Pc]2
=[
0.75 · KIC
HB(1− 2μ
)]2
. (26)

10 Advances in Tribology
For the initial size of the defect, by analogy with [56] ahalf the diameter of the pores (l0 = d/2) was taken. Thevalues of d, KIC , and μ were taken from [70].
The deformed volume fracture occurs when K reachesa value KIC , which corresponds to the critical defect size l andthe value ofN = nkr . Solving expressions (22), (23), (26), andassuming a linear relationship between Pn and Pc, we have aformula to determine the wear rate.
Fracture of the deformable volume happens when Kreaches KIC value that is corresponded to a critical defectsize l and N = nkp value. Substituting (23), (26) in (22) andignoring the equation got on conditions that half of the porediameter was taken as an initial defect size (l0 = d/2), on theanalogy of paper [56] implying linear connection between Pnand Pc, a formula for wear intensity was gotten
Ih
= 0.156 · (Pn/HB)0.128 · (n/2− 1) · A[(1− 2μ)HB/0.75
]n(d/2)(1−n/2) − (0.75KIC/
(1− 2μ
)HB
)(2−n) ,
(27)
where d—the average pore diameter.KIC , d, and μ values were taken from paper [70]. Thus
linear intensity of wear is determined by load, hardness, crackgrowth resistance, structure characteristic element size-poresize, Poisson ratio, and fatigue fracture parameters.
Fitting the experimental data by expression (27), thevalues of A = 1.38 · 10−7 and n = 2.11 were determined.As seen from Figure 9, the function Ih(P) is nonmonotonicover the entire range of variation of Pn. A similar result forthe constant values of pressure and a wide range of P wasexperimentally obtained in [55]. Good agreement betweenthe values of the coefficients A and n with the published data[71] and a satisfactory approximation of the experimentalresults confirm the correctness of the approach adopted forthe study of porous iron.
4. Lubricated Friction and Wear Processes
Boundary friction conditions of powder materials are typicalfor most parts functioning. This mode is performed duringstartup and shutdown, even if the products are designedfor operation in a hydrodynamic lubrication [72]. The testsdiffered only in that the oil in the friction zone was fedthrough a rotating counterbody dipping into the bowl withthe lubricant, Table 5.
Tables 4 and 5 show that for identical values of porosityand pressure the friction ratio value decreases several timeswith lubrication. It changes the dependence of f on thepressure. Under dry friction an increase in pressure leadsto a decrease in the f value, but under lubricated frictionpressure increasing results in f increase. This form of thefunction f (P) can be explained as follows. During elasticunsaturated contact friction ratio dependence on majorfriction unit characteristics τ0 and β, mechanical features ofless hard material of friction pair (μ,E), contour pressure and
roughness of harder element of friction pair ( ) according to[63] looks like
f = 2.4τ0(1− μ2/E
)4/5
P1/5c · 2/5
+ β + 0.23αgP1/5c
2/5
((1− μ2
)E
)1/5
,
(28)
where αg—coefficient of hysteresis losses under friction.Equation for elastic unsaturated contact has the same
structure and is different only in indexes Pc and , μ, E andconstants values.
The presence of lubricating film dramatically reduces thefrictional bond shear strength τ0, and hence the contributionof the first term of (28). Deformation component of thefriction ratio is proportional to the contour pressure with asmall exponent, as it observed experimentally. Features wereobserved only when P = 8.6% (a transition from open toclosed porosity occurs), and when P = 4% (a local extremumof the pore size detected) [70]. The porous structure affectsthe surface deformation in the active area [56], so that thegreatest value of the friction ratio is connected with theextreme size of the pores [62]. Low friction ratio values forhigh porosity samples can be explained, apparently, by thefact that in this experiment with P > 10% all porosity is open,and it facilitates the circulation of oil and heat removal fromthe friction surfaces. The relatively low surface temperaturemakes it difficult to deform and promote f decreasing.
Expression (28), Table 5, correctly reflects the trends off (P). Numerical processing of experimental data have notperformed as well as the ranges of the friction ratio formost porosity values are small and the accuracy of f at lowpressures, comparable with the difference between the testresults.
The thickness of oil layer was estimated according to theequation [72] which is applied in case of cylinders contact:
h
Rcv= 1.65
((V1 + V2) · αp ·V
2Rn
)0,73
·(
PnE/(1− μ2
))−0.18
,
(29)
where V1iV2—counterbodies’ velocities; V = 8.7·10−8 m2/kg—oil dynamic viscosity; αp = 4.1 · 10−3 kg·s/m2—oilpiezocoefficient; Rn—reduced radius of curvature.
Calculations showed that the porosity has a little influ-ence on the oil layer thickness (Figure 10), which probablyexplains the weak dependence of the friction ratio on P atlow pressures.
The expression (29) tested with the pressure transducerDD-10 as follows. The sample was set and lap it dry. Thesensor readings were calibrated, depending on the bias.Under dry friction the sensor readings were recorded andthen counterbody was dipped into the oil. At a pressure of0.25 MPa the rapprochement h changed to 1.0–1.5 microns;this agrees well with Figure 10. At higher pressures (about1 MPa) the accuracy of determining the change in approachis close to the calculated value of the oil film, at a pressurebelow 0.25 MPa tests were not carried out due to specificmeans for setting the sample.
The microhardness of the structural components of thefriction surface was from 120 to 450 HV0.05 (areas with

Advances in Tribology 11
Table 5: Antifriction properties of iron under limited lubrication.
P, % Hardness, MPa P, MPa fIh, microns/km
d · 106, mExperimental Calculated (39)
2
0.35 0.05 0.6 1.3
1.140.89 0.05 0.9 1.6
1010 1.5 0.07 1.6 2.1
3.0 0.07 2.9 2.8
4.5 0.07 3.3 3.4
4
0.24 0.05 1.7 1.4
2.020.60 0.05 2.3 1.7
950 1.0 0.09 2.9 1.9
2.0 0.12 3.5 2.5
3.0 0.12 3.7 3.0
5.9
0.33 0.05 0.9 1.3
1.360.83 0.05 1.4 1.7
860 1.4 0.06 2.0 2.0
2.8 0.06 2.3 2.7
4.2 0.06 4.0 3.3
8.6
0.33 0.05 1.3 1.5/0.76
1.780.83 0.05 1.6 1.7/1.2
760 1.4 0.09 1.8 2.0/1.5
2.8 0.09 2.3 2.7/2.1
4.2 0.12 3.1 3.5/2.5
13.6
0.25 0.04 0.84 0.88
1.790.64 0.04 1.0 1.0
750 1.06 0.06 1.6 1.3
2.12 0.06 1.7 1.3
3.18 0.07 3.5 2.2
20
0.36 0.05 0.87 1.0
1.830.90 0.05 1.7 1.6
480 1.5 0.06 2.9 2.0
3.0 0.06 3.1 2.9
4.5 0.06 3.3 3.4
high hardness (1000 HV0.05) was not enough). According tothe microhardness studies regardless of porosity, the basicstructural components were sorbite and troostite.
X-ray analysis showed an increase in lattice parameterwith respect to the standard on 0.03–0.06% for all samples.This confirmed the assumption about the carbon saturationof the thin surface layers under friction of iron with limitedlubrication.
Thus, boundary friction could result in contact surfacesheating above the temperatures of phase transformationsand the carburizing of iron. Similar results for the steels arepresented in [73].
As the friction ratio, wear rate is strongly related topore size. The greatest wear (P = 4%) corresponded to theminimum value of KIC . This indicates a relationship betweenpore size (pore size is greatest when P = 4%), fracturetoughness, and wear resistance.
Since the active layer thickness significantly exceeds thethickness of the oxide products of wear and the size andthe depth of diffusion penetration of interstitial elements,
physical and mechanical properties of the material have aneffect on wear resistance. Currently accepted methodologyfor assessing the wear rate based on the determination ofphysical and mechanical properties [63, 74], but have a lowaccuracy of prediction under lubricated friction [74], aresufficient for engineering calculations.
Linear wear rate can be determined from the expression[59]:
Ih =√
ν/42(ν + 1)nkr
·√h/Rcv · b · εν. (30)
Regardless of the contact type:
ε = h
Rmax. (31)
The film thickness, Figure 10, under the boundaryfriction was comparable to the rapprochement between thetwo surfaces, and therefore elastic contact took place.
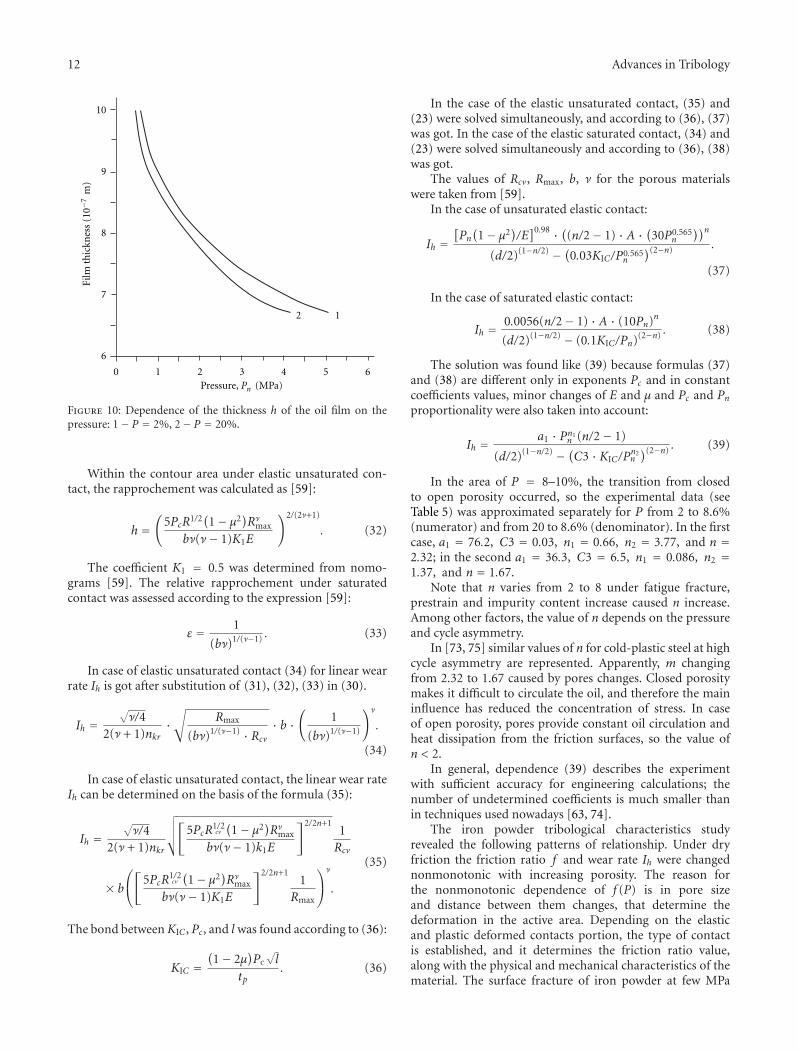
12 Advances in Tribology
0 1 2 3 4 5 6Pressure, Pn (MPa)
6
7
8
9
10
Film
thic
knes
s(1
0−7
m)
2 1
Figure 10: Dependence of the thickness h of the oil film on thepressure: 1− P = 2%, 2− P = 20%.
Within the contour area under elastic unsaturated con-tact, the rapprochement was calculated as [59]:
h =(
5PcR1/2(1− μ2
)Rν
max
bν(ν− 1)K1E
)2/(2ν+1)
. (32)
The coefficient K1 = 0.5 was determined from nomo-grams [59]. The relative rapprochement under saturatedcontact was assessed according to the expression [59]:
ε = 1
(bν)1/(ν−1) . (33)
In case of elastic unsaturated contact (34) for linear wearrate Ih is got after substitution of (31), (32), (33) in (30).
Ih =√
ν/42(ν + 1)nkr
·√
Rmax
(bν)1/(ν−1) · Rcv
· b ·(
1
(bν)1/(ν−1)
)ν
.
(34)
In case of elastic unsaturated contact, the linear wear rateIh can be determined on the basis of the formula (35):
Ih =√
ν/42(ν + 1)nkr
√√√√[5PcR1/2cv
(1− μ2
)Rν
max
bν(ν− 1)k1E
]2/2n+11Rcv
× b
⎛⎝[5PcR
1/2cv
(1− μ2
)Rν
max
bν(ν− 1)K1E
]2/2n+11
Rmax
⎞⎠
ν
.
(35)
The bond between KIC , Pc, and l was found according to (36):
KIC =(1− 2μ
)Ps√l
tp. (36)
In the case of the elastic unsaturated contact, (35) and(23) were solved simultaneously, and according to (36), (37)was got. In the case of the elastic saturated contact, (34) and(23) were solved simultaneously and according to (36), (38)was got.
The values of Rcv, Rmax, b, ν for the porous materialswere taken from [59].
In the case of unsaturated elastic contact:
Ih =[Pn(1− μ2
)/E]0.98 · ((n/2− 1) · A · (30P0.565
n
))n(d/2)(1−n/2) − (0.03KIC/P0.565
n
)(2−n) .
(37)
In the case of saturated elastic contact:
Ih = 0.0056(n/2− 1) · A · (10Pn)n
(d/2)(1−n/2) − (0.1KIC/Pn)(2−n) . (38)
The solution was found like (39) because formulas (37)and (38) are different only in exponents Pc and in constantcoefficients values, minor changes of E and μ and Pc and Pnproportionality were also taken into account:
Ih = a1 · Pn1n (n/2− 1)
(d/2)(1−n/2) − (C3 · KIC/Pn2n)(2−n) . (39)
In the area of P = 8–10%, the transition from closedto open porosity occurred, so the experimental data (seeTable 5) was approximated separately for P from 2 to 8.6%(numerator) and from 20 to 8.6% (denominator). In the firstcase, a1 = 76.2, C3 = 0.03, n1 = 0.66, n2 = 3.77, and n =2.32; in the second a1 = 36.3, C3 = 6.5, n1 = 0.086, n2 =1.37, and n = 1.67.
Note that n varies from 2 to 8 under fatigue fracture,prestrain and impurity content increase caused n increase.Among other factors, the value of n depends on the pressureand cycle asymmetry.
In [73, 75] similar values of n for cold-plastic steel at highcycle asymmetry are represented. Apparently, m changingfrom 2.32 to 1.67 caused by pores changes. Closed porositymakes it difficult to circulate the oil, and therefore the maininfluence has reduced the concentration of stress. In caseof open porosity, pores provide constant oil circulation andheat dissipation from the friction surfaces, so the value ofn < 2.
In general, dependence (39) describes the experimentwith sufficient accuracy for engineering calculations; thenumber of undetermined coefficients is much smaller thanin techniques used nowadays [63, 74].
The iron powder tribological characteristics studyrevealed the following patterns of relationship. Under dryfriction the friction ratio f and wear rate Ih were changednonmonotonic with increasing porosity. The reason forthe nonmonotonic dependence of f (P) is in pore sizeand distance between them changes, that determine thedeformation in the active area. Depending on the elasticand plastic deformed contacts portion, the type of contactis established, and it determines the friction ratio value,along with the physical and mechanical characteristics of thematerial. The surface fracture of iron powder at few MPa

Advances in Tribology 13
pressure is the nature of fatigue. The symbasis of Ih(P) andKIC(P) dependences is determined by the contact surfacefracture localization in a small volume, and the materialseparation occurs only when the critical value of stressconcentration is reached.
Limited lubricated friction under the same pressuresprovides elastic contact and very little shear strength offrictional bond. The surface of the porous iron is saturatedwith carbon. The porosity of 8–10% (carbonyl iron) providesa transition from the closed to open porosity, which naturallyaffects the value of the friction ratio and wear rate.
As in the case of dry friction in boundary friction,f (P) and Ih(P) functions are nonmonotonic. With sufficientaccuracy for engineering calculations the wear rate underboundary friction can be calculated on the assumption ofelastic contact.
The developed model predicted the values of fracturetoughness, friction ratio, and integral linear wear rate ofporous steel and bronze [74–84].
5. Conclusion
Pores’ structure changes during the consolidation process,that provides blunting and bend of the crack while movingbetween pores, is the reason for non-monotonic dependenceKIC(P). During the dry sliding and during the boundaryfriction f (P)iIh(P) functions are nonmonotonic. Local f (P)and Ih(P) extremum appearance is caused by differentreasons (pore sizes and structure penetrability), but is mainlythe consequence of pore structure transformation.
List of Symbols
KIC : Fracture toughness, MN/m3/2
KQ: Estimated fracture toughness, MN/m3/2
P: Porosity, %σ0.2: Yield strength, MPag: Crack distribution energyT : Linear crack front tension, NE: Elastic modulus, MPaμ: Poisson’s ratioA: Specific energy of uniform deformationγeff: Effective surface energy of the
Griffiths-Orowan theoryld: Length dimension constantδe: Uniform Deformation, %σB: Tensile Strength, MPaτ: Crack movement stress, MPar: Pore radius, m
: Interface energy, J/m2
b0: Interatomic distance, m: Distance between the inhomogeneities
(pores), mf : Friction ratioPn: Nominal pressure, MPaPc: Contour pressure, MPafd: Friction ratio deformation component
: Microroughnesses characteristic of a rigidmaterial of the friction pair
HB: Hardnessfm: Molecular component of friction ratioRa: Arithmetic mean deviation of profile, mβ and τ0: Friction characteristicsSost: Residual varianceF: Fisher criterionτm: Crack movement stress in porous material, MPaa: CoefficientG: Shear modulus, MPaB: Burgers vector, mR: Distance between the pores, mb and ν: Bearing surface curve parametersε: Relative approachtp: Relative contact areaα1: The coefficient depending on the type of contactC1: The constant that relates the contour and
nominal pressuref : Friction ratio change
ih: Specific linear wear rateh: Rapprochement between the friction surfaces, mRcv: Radius of curvaturenkr : Number of cycles, leading to the fractureIh: Integral linear wear rateRmax: The greatest distance between the bumps and
hollows within the gauge lengthK : Stress intensity factor change (Paris formula),
MN/m3/2
N : Number of cycles (Paris formula)A and n: Coefficients (Paris formula)K : Stress intensity factor, MN/m3/2
l: Crack length, mar : Radius of contact area, mσy : Fracture stress, MPad: Average pore diameter, mαg : Coefficient of hysteresis losses under frictionV1iV2: Counterbodies’ velocities, m/sV : Oil dynamic viscosity, m2/kgαp: Oil piezocoefficient, kg·s/m2
Rn: Reduced radius of curvature, mK1: CoefficientC3: Coefficient.
References
[1] H. P. Dzhoy, “The past and the future of tribology,” Journal ofFriction and Wear, vol. 11, no. 1, pp. 149–159, 1990 (Russian).
[2] A. A. Kuklin, E. S. Michkova, and V. Y. Bulanov, Technologyand Economics of Powder Metallurgy, Nauka, Moscow, Russia,1989.
[3] H. Danninger, C. Gierl, G. Muhlbauer, M. S. Gonzalez,J. Schmidt, and E. Specht, “Thermophysical properties ofsintered steels: effect of porosity,” International Journal ofPowder Metallurgy, vol. 47, no. 3, pp. 31–41, 2011.
[4] C. Sohar, A. Betzwar-Kotas, C. Gierl, H. Danninger, and B.Weiss, “Gigacycle fatigue response of tool steels produced bypowder metallurgy compared to ingot metallurgy tool steels,”International Journal of Materials Research, vol. 101, no. 9, pp.1140–1150, 2010.
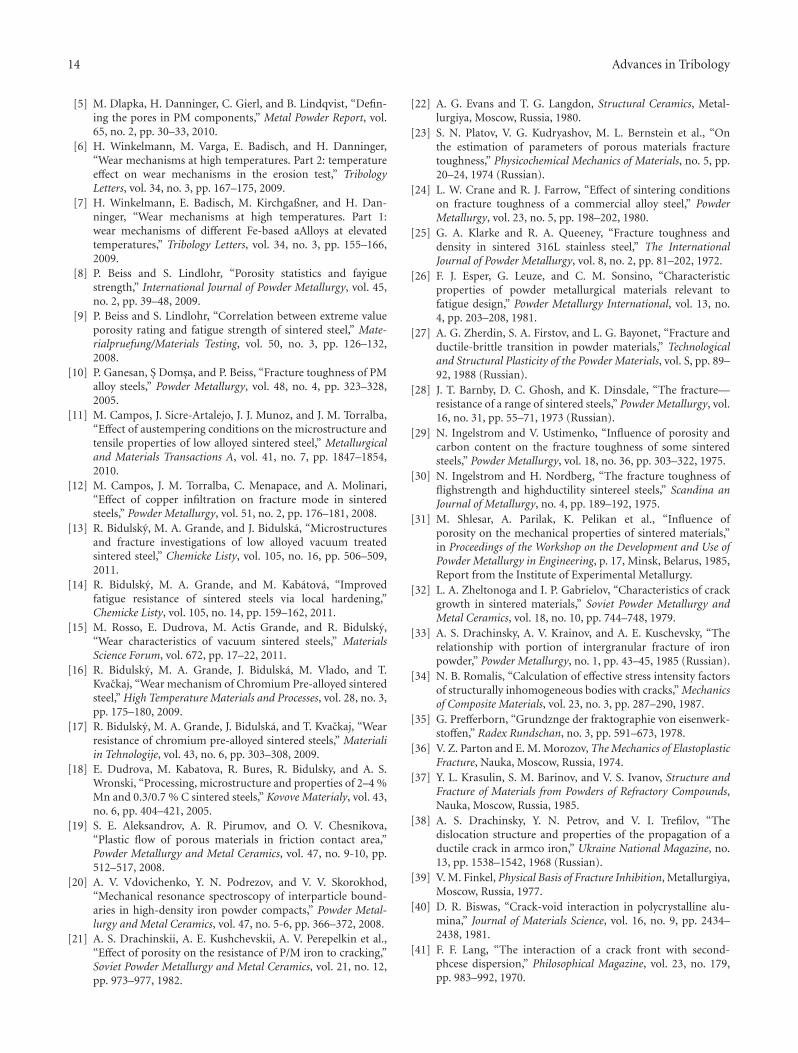
14 Advances in Tribology
[5] M. Dlapka, H. Danninger, C. Gierl, and B. Lindqvist, “Defin-ing the pores in PM components,” Metal Powder Report, vol.65, no. 2, pp. 30–33, 2010.
[6] H. Winkelmann, M. Varga, E. Badisch, and H. Danninger,“Wear mechanisms at high temperatures. Part 2: temperatureeffect on wear mechanisms in the erosion test,” TribologyLetters, vol. 34, no. 3, pp. 167–175, 2009.
[7] H. Winkelmann, E. Badisch, M. Kirchgaßner, and H. Dan-ninger, “Wear mechanisms at high temperatures. Part 1:wear mechanisms of different Fe-based aAlloys at elevatedtemperatures,” Tribology Letters, vol. 34, no. 3, pp. 155–166,2009.
[8] P. Beiss and S. Lindlohr, “Porosity statistics and fayiguestrength,” International Journal of Powder Metallurgy, vol. 45,no. 2, pp. 39–48, 2009.
[9] P. Beiss and S. Lindlohr, “Correlation between extreme valueporosity rating and fatigue strength of sintered steel,” Mate-rialpruefung/Materials Testing, vol. 50, no. 3, pp. 126–132,2008.
[10] P. Ganesan, S Domsa, and P. Beiss, “Fracture toughness of PMalloy steels,” Powder Metallurgy, vol. 48, no. 4, pp. 323–328,2005.
[11] M. Campos, J. Sicre-Artalejo, J. J. Munoz, and J. M. Torralba,“Effect of austempering conditions on the microstructure andtensile properties of low alloyed sintered steel,” Metallurgicaland Materials Transactions A, vol. 41, no. 7, pp. 1847–1854,2010.
[12] M. Campos, J. M. Torralba, C. Menapace, and A. Molinari,“Effect of copper infiltration on fracture mode in sinteredsteels,” Powder Metallurgy, vol. 51, no. 2, pp. 176–181, 2008.
[13] R. Bidulsky, M. A. Grande, and J. Bidulska, “Microstructuresand fracture investigations of low alloyed vacuum treatedsintered steel,” Chemicke Listy, vol. 105, no. 16, pp. 506–509,2011.
[14] R. Bidulsky, M. A. Grande, and M. Kabatova, “Improvedfatigue resistance of sintered steels via local hardening,”Chemicke Listy, vol. 105, no. 14, pp. 159–162, 2011.
[15] M. Rosso, E. Dudrova, M. Actis Grande, and R. Bidulsky,“Wear characteristics of vacuum sintered steels,” MaterialsScience Forum, vol. 672, pp. 17–22, 2011.
[16] R. Bidulsky, M. A. Grande, J. Bidulska, M. Vlado, and T.Kvackaj, “Wear mechanism of Chromium Pre-alloyed sinteredsteel,” High Temperature Materials and Processes, vol. 28, no. 3,pp. 175–180, 2009.
[17] R. Bidulsky, M. A. Grande, J. Bidulska, and T. Kvackaj, “Wearresistance of chromium pre-alloyed sintered steels,” Materialiin Tehnologije, vol. 43, no. 6, pp. 303–308, 2009.
[18] E. Dudrova, M. Kabatova, R. Bures, R. Bidulsky, and A. S.Wronski, “Processing, microstructure and properties of 2–4 %Mn and 0.3/0.7 % C sintered steels,” Kovove Materialy, vol. 43,no. 6, pp. 404–421, 2005.
[19] S. E. Aleksandrov, A. R. Pirumov, and O. V. Chesnikova,“Plastic flow of porous materials in friction contact area,”Powder Metallurgy and Metal Ceramics, vol. 47, no. 9-10, pp.512–517, 2008.
[20] A. V. Vdovichenko, Y. N. Podrezov, and V. V. Skorokhod,“Mechanical resonance spectroscopy of interparticle bound-aries in high-density iron powder compacts,” Powder Metal-lurgy and Metal Ceramics, vol. 47, no. 5-6, pp. 366–372, 2008.
[21] A. S. Drachinskii, A. E. Kushchevskii, A. V. Perepelkin et al.,“Effect of porosity on the resistance of P/M iron to cracking,”Soviet Powder Metallurgy and Metal Ceramics, vol. 21, no. 12,pp. 973–977, 1982.
[22] A. G. Evans and T. G. Langdon, Structural Ceramics, Metal-lurgiya, Moscow, Russia, 1980.
[23] S. N. Platov, V. G. Kudryashov, M. L. Bernstein et al., “Onthe estimation of parameters of porous materials fracturetoughness,” Physicochemical Mechanics of Materials, no. 5, pp.20–24, 1974 (Russian).
[24] L. W. Crane and R. J. Farrow, “Effect of sintering conditionson fracture toughness of a commercial alloy steel,” PowderMetallurgy, vol. 23, no. 5, pp. 198–202, 1980.
[25] G. A. Klarke and R. A. Queeney, “Fracture toughness anddensity in sintered 316L stainless steel,” The InternationalJournal of Powder Metallurgy, vol. 8, no. 2, pp. 81–202, 1972.
[26] F. J. Esper, G. Leuze, and C. M. Sonsino, “Characteristicproperties of powder metallurgical materials relevant tofatigue design,” Powder Metallurgy International, vol. 13, no.4, pp. 203–208, 1981.
[27] A. G. Zherdin, S. A. Firstov, and L. G. Bayonet, “Fracture andductile-brittle transition in powder materials,” Technologicaland Structural Plasticity of the Powder Materials, vol. S, pp. 89–92, 1988 (Russian).
[28] J. T. Barnby, D. C. Ghosh, and K. Dinsdale, “The fracture—resistance of a range of sintered steels,” Powder Metallurgy, vol.16, no. 31, pp. 55–71, 1973 (Russian).
[29] N. Ingelstrom and V. Ustimenko, “Influence of porosity andcarbon content on the fracture toughness of some sinteredsteels,” Powder Metallurgy, vol. 18, no. 36, pp. 303–322, 1975.
[30] N. Ingelstrom and H. Nordberg, “The fracture toughness offlighstrength and highductility sintereel steels,” Scandina anJournal of Metallurgy, no. 4, pp. 189–192, 1975.
[31] M. Shlesar, A. Parilak, K. Pelikan et al., “Influence ofporosity on the mechanical properties of sintered materials,”in Proceedings of the Workshop on the Development and Use ofPowder Metallurgy in Engineering, p. 17, Minsk, Belarus, 1985,Report from the Institute of Experimental Metallurgy.
[32] L. A. Zheltonoga and I. P. Gabrielov, “Characteristics of crackgrowth in sintered materials,” Soviet Powder Metallurgy andMetal Ceramics, vol. 18, no. 10, pp. 744–748, 1979.
[33] A. S. Drachinsky, A. V. Krainov, and A. E. Kuschevsky, “Therelationship with portion of intergranular fracture of ironpowder,” Powder Metallurgy, no. 1, pp. 43–45, 1985 (Russian).
[34] N. B. Romalis, “Calculation of effective stress intensity factorsof structurally inhomogeneous bodies with cracks,” Mechanicsof Composite Materials, vol. 23, no. 3, pp. 287–290, 1987.
[35] G. Prefferborn, “Grundznge der fraktographie von eisenwerk-stoffen,” Radex Rundschan, no. 3, pp. 591–673, 1978.
[36] V. Z. Parton and E. M. Morozov, The Mechanics of ElastoplasticFracture, Nauka, Moscow, Russia, 1974.
[37] Y. L. Krasulin, S. M. Barinov, and V. S. Ivanov, Structure andFracture of Materials from Powders of Refractory Compounds,Nauka, Moscow, Russia, 1985.
[38] A. S. Drachinsky, Y. N. Petrov, and V. I. Trefilov, “Thedislocation structure and properties of the propagation of aductile crack in armco iron,” Ukraine National Magazine, no.13, pp. 1538–1542, 1968 (Russian).
[39] V. M. Finkel, Physical Basis of Fracture Inhibition, Metallurgiya,Moscow, Russia, 1977.
[40] D. R. Biswas, “Crack-void interaction in polycrystalline alu-mina,” Journal of Materials Science, vol. 16, no. 9, pp. 2434–2438, 1981.
[41] F. F. Lang, “The interaction of a crack front with second-phcese dispersion,” Philosophical Magazine, vol. 23, no. 179,pp. 983–992, 1970.
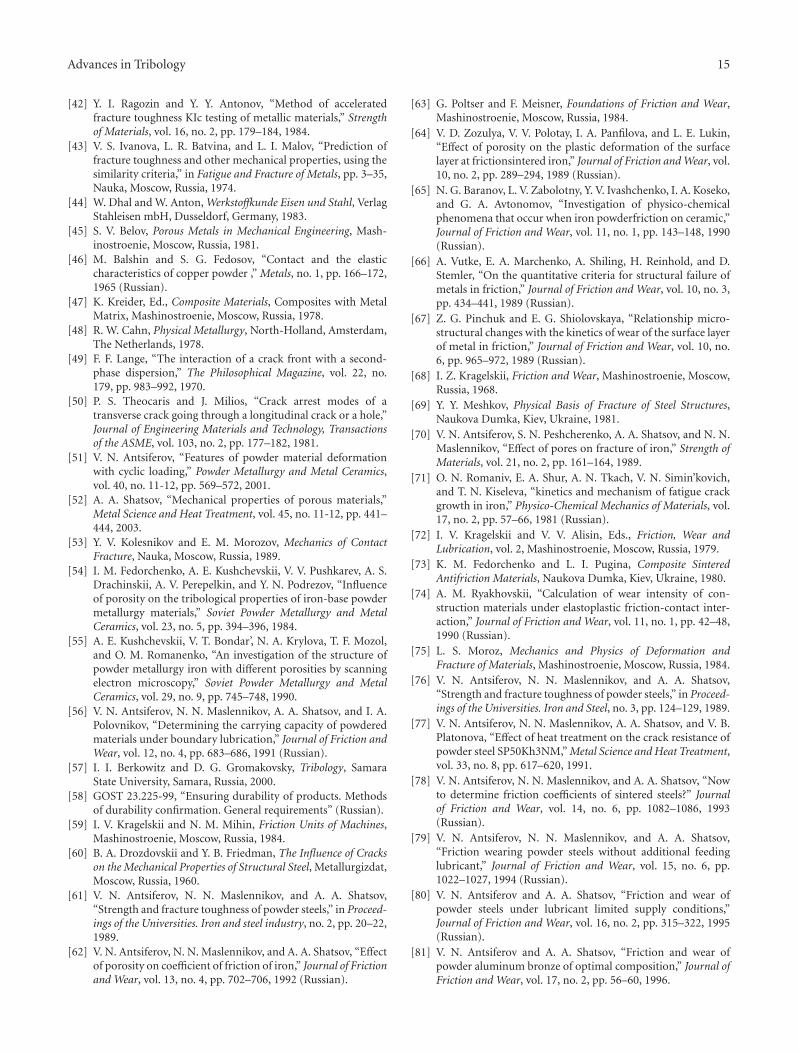
Advances in Tribology 15
[42] Y. I. Ragozin and Y. Y. Antonov, “Method of acceleratedfracture toughness KIc testing of metallic materials,” Strengthof Materials, vol. 16, no. 2, pp. 179–184, 1984.
[43] V. S. Ivanova, L. R. Batvina, and L. I. Malov, “Prediction offracture toughness and other mechanical properties, using thesimilarity criteria,” in Fatigue and Fracture of Metals, pp. 3–35,Nauka, Moscow, Russia, 1974.
[44] W. Dhal and W. Anton, Werkstoffkunde Eisen und Stahl, VerlagStahleisen mbH, Dusseldorf, Germany, 1983.
[45] S. V. Belov, Porous Metals in Mechanical Engineering, Mash-inostroenie, Moscow, Russia, 1981.
[46] M. Balshin and S. G. Fedosov, “Contact and the elasticcharacteristics of copper powder ,” Metals, no. 1, pp. 166–172,1965 (Russian).
[47] K. Kreider, Ed., Composite Materials, Composites with MetalMatrix, Mashinostroenie, Moscow, Russia, 1978.
[48] R. W. Cahn, Physical Metallurgy, North-Holland, Amsterdam,The Netherlands, 1978.
[49] F. F. Lange, “The interaction of a crack front with a second-phase dispersion,” The Philosophical Magazine, vol. 22, no.179, pp. 983–992, 1970.
[50] P. S. Theocaris and J. Milios, “Crack arrest modes of atransverse crack going through a longitudinal crack or a hole,”Journal of Engineering Materials and Technology, Transactionsof the ASME, vol. 103, no. 2, pp. 177–182, 1981.
[51] V. N. Antsiferov, “Features of powder material deformationwith cyclic loading,” Powder Metallurgy and Metal Ceramics,vol. 40, no. 11-12, pp. 569–572, 2001.
[52] A. A. Shatsov, “Mechanical properties of porous materials,”Metal Science and Heat Treatment, vol. 45, no. 11-12, pp. 441–444, 2003.
[53] Y. V. Kolesnikov and E. M. Morozov, Mechanics of ContactFracture, Nauka, Moscow, Russia, 1989.
[54] I. M. Fedorchenko, A. E. Kushchevskii, V. V. Pushkarev, A. S.Drachinskii, A. V. Perepelkin, and Y. N. Podrezov, “Influenceof porosity on the tribological properties of iron-base powdermetallurgy materials,” Soviet Powder Metallurgy and MetalCeramics, vol. 23, no. 5, pp. 394–396, 1984.
[55] A. E. Kushchevskii, V. T. Bondar’, N. A. Krylova, T. F. Mozol,and O. M. Romanenko, “An investigation of the structure ofpowder metallurgy iron with different porosities by scanningelectron microscopy,” Soviet Powder Metallurgy and MetalCeramics, vol. 29, no. 9, pp. 745–748, 1990.
[56] V. N. Antsiferov, N. N. Maslennikov, A. A. Shatsov, and I. A.Polovnikov, “Determining the carrying capacity of powderedmaterials under boundary lubrication,” Journal of Friction andWear, vol. 12, no. 4, pp. 683–686, 1991 (Russian).
[57] I. I. Berkowitz and D. G. Gromakovsky, Tribology, SamaraState University, Samara, Russia, 2000.
[58] GOST 23.225-99, “Ensuring durability of products. Methodsof durability confirmation. General requirements” (Russian).
[59] I. V. Kragelskii and N. M. Mihin, Friction Units of Machines,Mashinostroenie, Moscow, Russia, 1984.
[60] B. A. Drozdovskii and Y. B. Friedman, The Influence of Crackson the Mechanical Properties of Structural Steel, Metallurgizdat,Moscow, Russia, 1960.
[61] V. N. Antsiferov, N. N. Maslennikov, and A. A. Shatsov,“Strength and fracture toughness of powder steels,” in Proceed-ings of the Universities. Iron and steel industry, no. 2, pp. 20–22,1989.
[62] V. N. Antsiferov, N. N. Maslennikov, and A. A. Shatsov, “Effectof porosity on coefficient of friction of iron,” Journal of Frictionand Wear, vol. 13, no. 4, pp. 702–706, 1992 (Russian).
[63] G. Poltser and F. Meisner, Foundations of Friction and Wear,Mashinostroenie, Moscow, Russia, 1984.
[64] V. D. Zozulya, V. V. Polotay, I. A. Panfilova, and L. E. Lukin,“Effect of porosity on the plastic deformation of the surfacelayer at frictionsintered iron,” Journal of Friction and Wear, vol.10, no. 2, pp. 289–294, 1989 (Russian).
[65] N. G. Baranov, L. V. Zabolotny, Y. V. Ivashchenko, I. A. Koseko,and G. A. Avtonomov, “Investigation of physico-chemicalphenomena that occur when iron powderfriction on ceramic,”Journal of Friction and Wear, vol. 11, no. 1, pp. 143–148, 1990(Russian).
[66] A. Vutke, E. A. Marchenko, A. Shiling, H. Reinhold, and D.Stemler, “On the quantitative criteria for structural failure ofmetals in friction,” Journal of Friction and Wear, vol. 10, no. 3,pp. 434–441, 1989 (Russian).
[67] Z. G. Pinchuk and E. G. Shiolovskaya, “Relationship micro-structural changes with the kinetics of wear of the surface layerof metal in friction,” Journal of Friction and Wear, vol. 10, no.6, pp. 965–972, 1989 (Russian).
[68] I. Z. Kragelskii, Friction and Wear, Mashinostroenie, Moscow,Russia, 1968.
[69] Y. Y. Meshkov, Physical Basis of Fracture of Steel Structures,Naukova Dumka, Kiev, Ukraine, 1981.
[70] V. N. Antsiferov, S. N. Peshcherenko, A. A. Shatsov, and N. N.Maslennikov, “Effect of pores on fracture of iron,” Strength ofMaterials, vol. 21, no. 2, pp. 161–164, 1989.
[71] O. N. Romaniv, E. A. Shur, A. N. Tkach, V. N. Simin’kovich,and T. N. Kiseleva, “kinetics and mechanism of fatigue crackgrowth in iron,” Physico-Chemical Mechanics of Materials, vol.17, no. 2, pp. 57–66, 1981 (Russian).
[72] I. V. Kragelskii and V. V. Alisin, Eds., Friction, Wear andLubrication, vol. 2, Mashinostroenie, Moscow, Russia, 1979.
[73] K. M. Fedorchenko and L. I. Pugina, Composite SinteredAntifriction Materials, Naukova Dumka, Kiev, Ukraine, 1980.
[74] A. M. Ryakhovskii, “Calculation of wear intensity of con-struction materials under elastoplastic friction-contact inter-action,” Journal of Friction and Wear, vol. 11, no. 1, pp. 42–48,1990 (Russian).
[75] L. S. Moroz, Mechanics and Physics of Deformation andFracture of Materials, Mashinostroenie, Moscow, Russia, 1984.
[76] V. N. Antsiferov, N. N. Maslennikov, and A. A. Shatsov,“Strength and fracture toughness of powder steels,” in Proceed-ings of the Universities. Iron and Steel, no. 3, pp. 124–129, 1989.
[77] V. N. Antsiferov, N. N. Maslennikov, A. A. Shatsov, and V. B.Platonova, “Effect of heat treatment on the crack resistance ofpowder steel SP50Kh3NM,” Metal Science and Heat Treatment,vol. 33, no. 8, pp. 617–620, 1991.
[78] V. N. Antsiferov, N. N. Maslennikov, and A. A. Shatsov, “Nowto determine friction coefficients of sintered steels?” Journalof Friction and Wear, vol. 14, no. 6, pp. 1082–1086, 1993(Russian).
[79] V. N. Antsiferov, N. N. Maslennikov, and A. A. Shatsov,“Friction wearing powder steels without additional feedinglubricant,” Journal of Friction and Wear, vol. 15, no. 6, pp.1022–1027, 1994 (Russian).
[80] V. N. Antsiferov and A. A. Shatsov, “Friction and wear ofpowder steels under lubricant limited supply conditions,”Journal of Friction and Wear, vol. 16, no. 2, pp. 315–322, 1995(Russian).
[81] V. N. Antsiferov and A. A. Shatsov, “Friction and wear ofpowder aluminum bronze of optimal composition,” Journal ofFriction and Wear, vol. 17, no. 2, pp. 56–60, 1996.

16 Advances in Tribology
[82] V. N. Antsiferov, T. V. Smyshlyaeva, and A. A. Shatsov, “Self-lubricating copper-based pseudoalloy for antifriction andconstructional products,” Journal of Friction and Wear, vol. 17,no. 4, pp. 497–502, 1996 (Russian).
[83] A. A. Shatsov, “Tribological characteristics of powder steelsunder boundary friction,” Advanced Materials, no. 2, pp. 69–73, 2001 (Russian).
[84] A. A. Shatsov, “Prediction of tribological characteristics ofpowder steels under dry friction,” Advanced Materials, no. 5,pp. 71–77, 2000.

Hindawi Publishing CorporationAdvances in TribologyVolume 2011, Article ID 906481, 13 pagesdoi:10.1155/2011/906481
Research Article
Characterization of Tool Wear in High-Speed Milling ofHardened Powder Metallurgical Steels
Fritz Klocke, Kristian Arntz, Gustavo Francisco Cabral, Martin Stolorz, and Marc Busch
Fraunhofer Institute for Production Technology IPT, Steinbachstraße 17, 52074 Aachen, Germany
Correspondence should be addressed to Marc Busch, [email protected]
Received 30 June 2011; Accepted 29 August 2011
Academic Editor: Alexander Tsouknidas
Copyright © 2011 Fritz Klocke et al. This is an open access article distributed under the Creative Commons Attribution License,which permits unrestricted use, distribution, and reproduction in any medium, provided the original work is properly cited.
In this experimental study, the cutting performance of ball-end mills in high-speed dry-hard milling of powder metallurgical steelswas investigated. The cutting performance of the milling tools was mainly evaluated in terms of cutting length, tool wear, andcutting forces. Two different types of hardened steels were machined, the cold working steel HS 4-2-4 PM (K490 Microclean/66HRC) and the high speed steel HS 6-5-3 PM (S790 Microclean/64 HRC). The milling tests were performed at effective cuttingspeeds of 225, 300, and 400 m/min with a four fluted solid carbide ball-end mill (D0 = 6, TiAlN coating). It was observed thatby means of analytically optimised chipping parameters and increased cutting speed, the tool life can be drastically enhanced.Further, in machining the harder material HS 4-2-4 PM, the tool life is up to three times in regard to the less harder material HS6-5-3 PM. Thus, it can be assumed that not only the hardness of the material to be machined plays a vital role for the high-speeddry-hard cutting performance, but also the microstructure and thermal characteristics of the investigated powder metallurgicalsteels in their hardened state.
1. Introduction and Motivation
1.1. Applications. In the economically efficient large batchproduction of complex functional and structural compo-nents, the moulding and forming technologies are of crucialimportance. The performance of these technologies is signif-icantly defined by the material, the surface conditions, andthe subsurface integrity of the manufactured tools, dies, andmoulds. Conventional tool steels are increasingly reachingtheir limits and, therefore, restrain a further developmentin the large-scale production techniques, considering highereconomic efficiency and process stability. Alternatively, high-performance materials like powder metallurgically producedsteels [1] can be applied. Compared to conventionallyproduced tool steels, they verifiably reach a multiplicativelyenhanced life of the manufactured tools, dies, and moulds.However, the machining of these superhard steels by multi-axis milling represents a major challenge and is, therefore, anissue of highest interest, both for the scientific research andthe industrial production [2–5]. Due to their sophisticatedmaterial properties, such as their high hardness, ductility,and pressure strength [4], they can be loaded up to high
mechanical stresses. This represents a central requirement forhigh-value parts and components, as they occur in differentareas of application in the tool and die making; see Figure 1.
Due to its efficiency, flexibility, and precision, the com-plete machining by means of hard milling is one of the keytechnologies in the tool, die, and mould-making industry.For instance, 5-axis milling enables the manufacture of high-value parts of highest complexity in one clamping, providingparts and components of excellent surface quality and henceincreasing the potential of substituting grinding processeswhich are often downstreamed to milling. The downsideto the geometric flexibility of multiaxis hard milling arethe continuously changing chipping conditions, resultingin favourable and unfavourable engagement conditionsbetween the workpiece and the milling tool. In general,second lead to increased loads on the milling tool and henceto reduced tool life time accompanied by a surface damage aswell as by a formation of microcracks and structural changesto the subsurface area of the manufactured parts.
However, even along with the highest material require-ments and most complex geometries, the simultaneous 5-axis hard milling enables optimal process conditions in

2 Advances in Tribology
Extrusion die
(a)
Deep drawing tool
(b)
Figure 1: Tool and die making as a representative area of application for 5-axis-milling of superhard steels; (a) Heading tool; (b) Deepdrawing tool.
a narrow process tolerance field by a suitable parameterselection and innovative machining strategies. Currently,the state of knowledge on the suitable selection of optimalcomponent- and production-orientated process parametersfor the simultaneous 5-axis hard milling of the addressedmaterials is limited. Therefore, a reliable and efficientproduction of highly stressed tools, dies, and moulds is notgranted, and the potential of high-performance materials israrely exploited [6].
1.2. Metallurgical Fundamentals. Powder metallurgical (PM)compounded steels, mainly applied in the tool and die mak-ing, allow the generation of a homogeneous and isotropicmaterial microstructure. They are characterized by a highhardness, ductility, and pressure strength and possess a gooddimensional stability during their heat treatment. Dependingon the specific alloy composition and the heat treatment,the hardness can be varied between 50 and 70 HRC. Thehigh hardness of these materials can be reached by carbideprecipitation and martensitic transformation [4]. Precipita-tion hardening, for instance, leads to an improvement ofthe stability of the workpieces under static and especiallypulsatory loads. This leads to a considerably enhancedproperty profile compared to conventional die materials.Hence, the lifetime of forming tools can be improveddrastically.
Furthermore, powder metallurgical steels can be cus-tomized referring to the specific area of application withregard to their hardness, heat, and wear resistance or duc-tility. For instance, the method of spray-compacting permitsthe adjustment of an extreme wear resistant microstructuredue to the high amount of embedded carbides [7–9].
1.3. High-Speed Milling of Superhard Materials. A recentlyconducted survey of the Fraunhofer IPT exhibits that high-speed milling of superhard steels will probably develop from
a core-technology to the most important technology in thearea of tool and die making. The reason for this is the com-bination of highest productivity and flexibility compared toother competing production techniques. However, regardingto small diameters of milling tools as well as superhardmaterials, there still exists a great demand for further processoptimization in order to realize long tool endurances, shortlead times and short time-to-markets.
Inter alia, in milling of superhard steels, the occurringforces in the chipping zone are substantially influenced bythree circumstances:
(i) the hardness and microstructure of the material to bemachined [4, 10],
(ii) the geometry of the uncut chip [11],
(iii) the process parameter [12, 13].
The microstructure leads to the fact that during milling,the rake and the clearance face of the tools are loadedwith high abrasive wear due to the fine-particle distributedcarbides. Furthermore, hard milling of PM steels tends tothe formation of build up edges (BUE). BUE develop if partsof the machined material are cemented at the tools’ cuttingedge. Here, they form a superhard layer due to the materialcharacteristics and take over the function of the cutting edge.According to the cutting conditions, small particles of theBUE are separated and slide away between the clearanceand cutting area. As a consequence, the flank wear increasesdramatically, and the surface properties of the machinedparts are deteriorated significantly [14].
Furthermore, Kochy et al. and Okada et al. assumethat along with an increasing material hardness, the wearof the milling tool increases significantly and that themicrostructure of the component material also has a greatimpact on the progressive wear behaviour of the milling tool[15, 16].
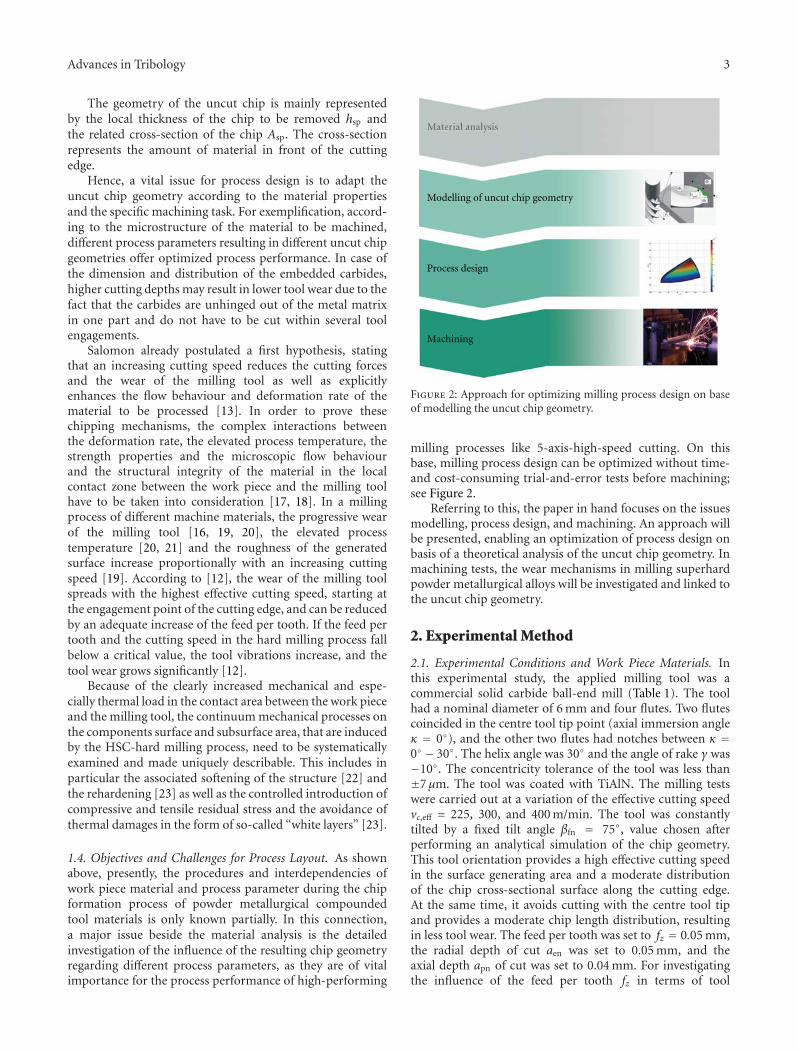
Advances in Tribology 3
The geometry of the uncut chip is mainly representedby the local thickness of the chip to be removed hsp andthe related cross-section of the chip Asp. The cross-sectionrepresents the amount of material in front of the cuttingedge.
Hence, a vital issue for process design is to adapt theuncut chip geometry according to the material propertiesand the specific machining task. For exemplification, accord-ing to the microstructure of the material to be machined,different process parameters resulting in different uncut chipgeometries offer optimized process performance. In case ofthe dimension and distribution of the embedded carbides,higher cutting depths may result in lower tool wear due to thefact that the carbides are unhinged out of the metal matrixin one part and do not have to be cut within several toolengagements.
Salomon already postulated a first hypothesis, statingthat an increasing cutting speed reduces the cutting forcesand the wear of the milling tool as well as explicitlyenhances the flow behaviour and deformation rate of thematerial to be processed [13]. In order to prove thesechipping mechanisms, the complex interactions betweenthe deformation rate, the elevated process temperature, thestrength properties and the microscopic flow behaviourand the structural integrity of the material in the localcontact zone between the work piece and the milling toolhave to be taken into consideration [17, 18]. In a millingprocess of different machine materials, the progressive wearof the milling tool [16, 19, 20], the elevated processtemperature [20, 21] and the roughness of the generatedsurface increase proportionally with an increasing cuttingspeed [19]. According to [12], the wear of the milling toolspreads with the highest effective cutting speed, starting atthe engagement point of the cutting edge, and can be reducedby an adequate increase of the feed per tooth. If the feed pertooth and the cutting speed in the hard milling process fallbelow a critical value, the tool vibrations increase, and thetool wear grows significantly [12].
Because of the clearly increased mechanical and espe-cially thermal load in the contact area between the work pieceand the milling tool, the continuum mechanical processes onthe components surface and subsurface area, that are inducedby the HSC-hard milling process, need to be systematicallyexamined and made uniquely describable. This includes inparticular the associated softening of the structure [22] andthe rehardening [23] as well as the controlled introduction ofcompressive and tensile residual stress and the avoidance ofthermal damages in the form of so-called “white layers” [23].
1.4. Objectives and Challenges for Process Layout. As shownabove, presently, the procedures and interdependencies ofwork piece material and process parameter during the chipformation process of powder metallurgical compoundedtool materials is only known partially. In this connection,a major issue beside the material analysis is the detailedinvestigation of the influence of the resulting chip geometryregarding different process parameters, as they are of vitalimportance for the process performance of high-performing
MMaatteerriiaall aannaallyyssiiss
Modelling of uncut chip geometry
Process design
Machining
Figure 2: Approach for optimizing milling process design on baseof modelling the uncut chip geometry.
milling processes like 5-axis-high-speed cutting. On thisbase, milling process design can be optimized without time-and cost-consuming trial-and-error tests before machining;see Figure 2.
Referring to this, the paper in hand focuses on the issuesmodelling, process design, and machining. An approach willbe presented, enabling an optimization of process design onbasis of a theoretical analysis of the uncut chip geometry. Inmachining tests, the wear mechanisms in milling superhardpowder metallurgical alloys will be investigated and linked tothe uncut chip geometry.
2. Experimental Method
2.1. Experimental Conditions and Work Piece Materials. Inthis experimental study, the applied milling tool was acommercial solid carbide ball-end mill (Table 1). The toolhad a nominal diameter of 6 mm and four flutes. Two flutescoincided in the centre tool tip point (axial immersion angleκ = 0◦), and the other two flutes had notches between κ =0◦ − 30◦. The helix angle was 30◦ and the angle of rake γ was−10◦. The concentricity tolerance of the tool was less than±7 μm. The tool was coated with TiAlN. The milling testswere carried out at a variation of the effective cutting speedvc,eff = 225, 300, and 400 m/min. The tool was constantlytilted by a fixed tilt angle βfn = 75◦, value chosen afterperforming an analytical simulation of the chip geometry.This tool orientation provides a high effective cutting speedin the surface generating area and a moderate distributionof the chip cross-sectional surface along the cutting edge.At the same time, it avoids cutting with the centre tool tipand provides a moderate chip length distribution, resultingin less tool wear. The feed per tooth was set to fz = 0.05 mm,the radial depth of cut aen was set to 0.05 mm, and theaxial depth apn of cut was set to 0.04 mm. For investigatingthe influence of the feed per tooth fz in terms of tool
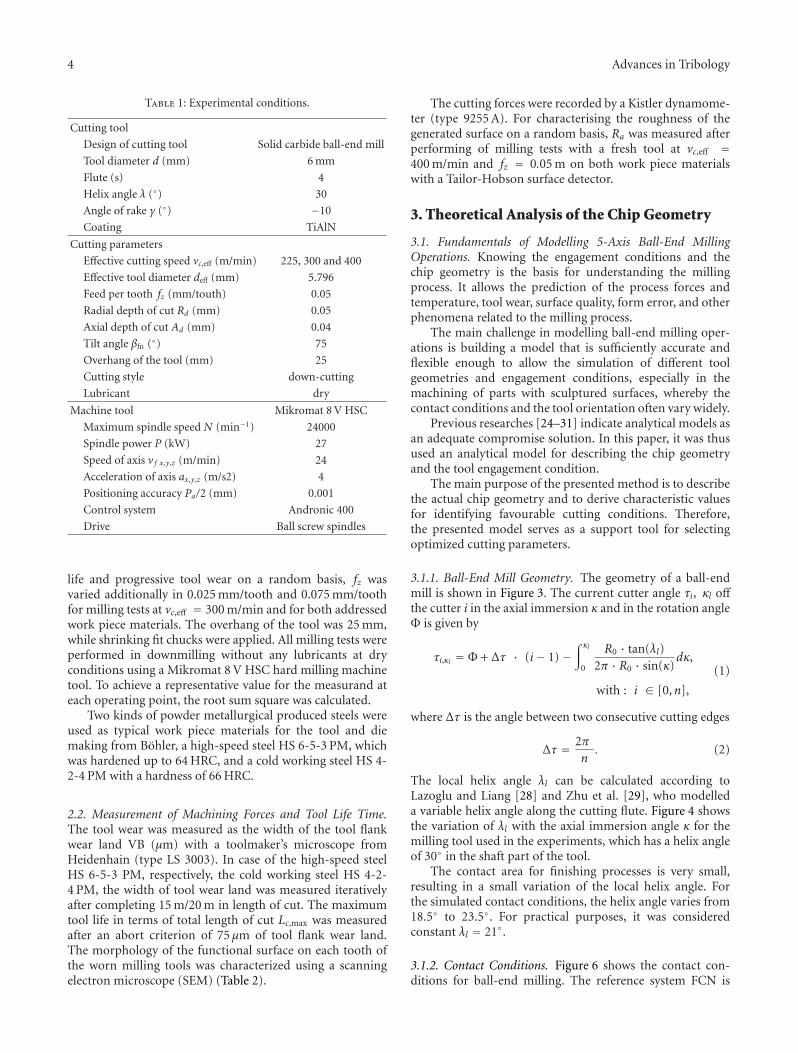
4 Advances in Tribology
Table 1: Experimental conditions.
Cutting tool
Design of cutting tool Solid carbide ball-end mill
Tool diameter d (mm) 6 mm
Flute (s) 4
Helix angle λ (◦) 30
Angle of rake γ (◦) −10
Coating TiAlN
Cutting parameters
Effective cutting speed vc,eff (m/min) 225, 300 and 400
Effective tool diameter deff (mm) 5.796
Feed per tooth fz (mm/touth) 0.05
Radial depth of cut Rd (mm) 0.05
Axial depth of cut Ad (mm) 0.04
Tilt angle βfn (◦) 75
Overhang of the tool (mm) 25
Cutting style down-cutting
Lubricant dry
Machine tool Mikromat 8 V HSC
Maximum spindle speed N (min−1) 24000
Spindle power P (kW) 27
Speed of axis v f x,y,z (m/min) 24
Acceleration of axis ax,y,z (m/s2) 4
Positioning accuracy Pa/2 (mm) 0.001
Control system Andronic 400
Drive Ball screw spindles
life and progressive tool wear on a random basis, fz wasvaried additionally in 0.025 mm/tooth and 0.075 mm/toothfor milling tests at vc,eff = 300 m/min and for both addressedwork piece materials. The overhang of the tool was 25 mm,while shrinking fit chucks were applied. All milling tests wereperformed in downmilling without any lubricants at dryconditions using a Mikromat 8 V HSC hard milling machinetool. To achieve a representative value for the measurand ateach operating point, the root sum square was calculated.
Two kinds of powder metallurgical produced steels wereused as typical work piece materials for the tool and diemaking from Bohler, a high-speed steel HS 6-5-3 PM, whichwas hardened up to 64 HRC, and a cold working steel HS 4-2-4 PM with a hardness of 66 HRC.
2.2. Measurement of Machining Forces and Tool Life Time.The tool wear was measured as the width of the tool flankwear land VB (μm) with a toolmaker’s microscope fromHeidenhain (type LS 3003). In case of the high-speed steelHS 6-5-3 PM, respectively, the cold working steel HS 4-2-4 PM, the width of tool wear land was measured iterativelyafter completing 15 m/20 m in length of cut. The maximumtool life in terms of total length of cut Lc,max was measuredafter an abort criterion of 75 μm of tool flank wear land.The morphology of the functional surface on each tooth ofthe worn milling tools was characterized using a scanningelectron microscope (SEM) (Table 2).
The cutting forces were recorded by a Kistler dynamome-ter (type 9255 A). For characterising the roughness of thegenerated surface on a random basis, Ra was measured afterperforming of milling tests with a fresh tool at vc,eff =400 m/min and fz = 0.05 m on both work piece materialswith a Tailor-Hobson surface detector.
3. Theoretical Analysis of the Chip Geometry
3.1. Fundamentals of Modelling 5-Axis Ball-End MillingOperations. Knowing the engagement conditions and thechip geometry is the basis for understanding the millingprocess. It allows the prediction of the process forces andtemperature, tool wear, surface quality, form error, and otherphenomena related to the milling process.
The main challenge in modelling ball-end milling oper-ations is building a model that is sufficiently accurate andflexible enough to allow the simulation of different toolgeometries and engagement conditions, especially in themachining of parts with sculptured surfaces, whereby thecontact conditions and the tool orientation often vary widely.
Previous researches [24–31] indicate analytical models asan adequate compromise solution. In this paper, it was thusused an analytical model for describing the chip geometryand the tool engagement condition.
The main purpose of the presented method is to describethe actual chip geometry and to derive characteristic valuesfor identifying favourable cutting conditions. Therefore,the presented model serves as a support tool for selectingoptimized cutting parameters.
3.1.1. Ball-End Mill Geometry. The geometry of a ball-endmill is shown in Figure 3. The current cutter angle τi, κl offthe cutter i in the axial immersion κ and in the rotation angleΦ is given by
τi,κl = Φ + Δτ · (i− 1)−∫ κl
0
R0 · tan(λl)2π · R0 · sin(κ)
dκ,
with : i ∈ [0,n],
(1)
where Δτ is the angle between two consecutive cutting edges
Δτ = 2πn
. (2)
The local helix angle λl can be calculated according toLazoglu and Liang [28] and Zhu et al. [29], who modelleda variable helix angle along the cutting flute. Figure 4 showsthe variation of λl with the axial immersion angle κ for themilling tool used in the experiments, which has a helix angleof 30◦ in the shaft part of the tool.
The contact area for finishing processes is very small,resulting in a small variation of the local helix angle. Forthe simulated contact conditions, the helix angle varies from18.5◦ to 23.5◦. For practical purposes, it was consideredconstant λl = 21◦.
3.1.2. Contact Conditions. Figure 6 shows the contact con-ditions for ball-end milling. The reference system FCN is

Advances in Tribology 5
Table 2: Work piece materials.
Powder metallurgical steels
Term Cold work steel HS 4-2-4 PM High-speed steel 6-5-3 PM
Hardness (HRC) 66 64
Binder C Cr Mo V W C Si Mn Cr Mo V W
Modulus of elasticity E (GPa) 223 230
Density ρ (kg/dm3) 7.79 8.0
Thermal conductivity k (W/mk) 19.6 24.0
Thermal expansion coefficient α (10−6/K) (at 100/200/300/600◦C) 10.6/11.1/11.6/12.6 11.5/11.7/12.2/13.0
Specific heat capacity c (W/mK) 450 420
zy
x
τ
ϕ
κ
Rl
λ
λl
R0
Zi+2
Zi+1
Zi
Figure 3: Geometry of a ball-end mill.
30
20
10
0 30 60 90
κ (◦)
κ = 75.4◦
λ = 23.5◦
κ = 64.5◦
λ = 18.5◦λl
(◦)
Figure 4: Variation of the local helix angle λl with the axialimmersion angle κ.
defined according to Ozturk and Budak [30]. F is the feedaxis, N the surface normal axis, and C the cross-feed axis. aen
is the row width, and apn is the cutting depth. C+ indicatesthat the next row is towards the positive side of the C-axis,and C− is the opposite case; that is, the next row is in thenegative direction of the C-axis. fz is the feed per tooth.
3.1.3. Simulation Approach. The simulation workflow isshown in Figure 5. First, it is necessary to specify the sim-ulation input, which are the process parameters apn, aen, fz,C+/C−, the tool orientation and the cutting speed vc. It wasused a discrete model for the simulation, so the discretization
parameters, that is, the Φ and κ angle increments, are alsoinputs for the simulation.
A similar approach was also used by Urban [31] andOzturk and Budak [30]. Urban implemented a model whichtakes into consideration the scallops in the feed directionbut does not consider the helix angle. Ozturk calculatedthe boundary curves without considering the scallops andconsidered just the area 3 in the modelling (see Figure 8),which can result in an error of up to 40% in the resultingcontact angle for finishing processes, since the areas 2 and 3are relative larger for small values of apn and aen.
Secondly, the boundary curves are calculated, definingthe position of the uncut chip in the FCN coordinatesystem. On the basis of the chip spatial position informationand on the input parameters, the detailed uncut chipgeometry is determined. The geometry is used for derivingother parameters, for example, chip volume, chipping time,effective cutting speed, impact ratio, and surface generatingarea, which are used for evaluating the previously settledengagement conditions. Finally, the calculated values areplotted and visualized with a dedicated tool implemented inMatlab (Figure 7).
3.1.4. Calculation of the Boundary Curves. The typical chipform for ball-end milling, for the positive cross-axis caseC+, is depicted in Figure 8. This model was obtained byusing a CSG model (constructive solid geometry) in thecommercial CAD software Siemens NX. This approach is
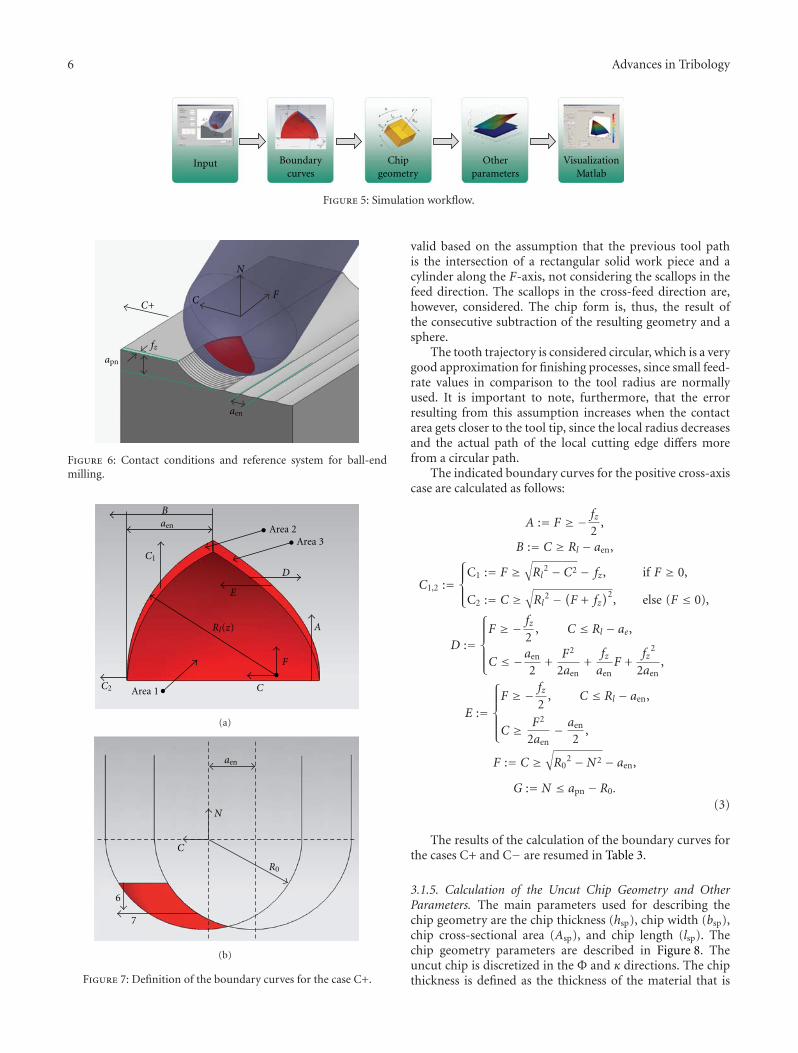
6 Advances in Tribology
Input Chipgeometry
Otherparameters
VisualizationMatlab
Boundarycurves
Figure 5: Simulation workflow.
C+
fz
apn
aen
C
N
F
Figure 6: Contact conditions and reference system for ball-endmilling.
B
C1
Area 1
Area 2Area 3
D
E
A
C2
F
C
Rl(z)
aen
(a)
N
C
6
7
R0
aen
(b)
Figure 7: Definition of the boundary curves for the case C+.
valid based on the assumption that the previous tool pathis the intersection of a rectangular solid work piece and acylinder along the F-axis, not considering the scallops in thefeed direction. The scallops in the cross-feed direction are,however, considered. The chip form is, thus, the result ofthe consecutive subtraction of the resulting geometry and asphere.
The tooth trajectory is considered circular, which is a verygood approximation for finishing processes, since small feed-rate values in comparison to the tool radius are normallyused. It is important to note, furthermore, that the errorresulting from this assumption increases when the contactarea gets closer to the tool tip, since the local radius decreasesand the actual path of the local cutting edge differs morefrom a circular path.
The indicated boundary curves for the positive cross-axiscase are calculated as follows:
A := F ≥ − fz2
,
B := C ≥ Rl − aen,
C1,2 :=⎧⎪⎨⎪⎩
C1 := F ≥√Rl
2 − C2 − fz, if F ≥ 0,
C2 := C ≥√Rl
2 − (F + fz)2, else (F ≤ 0),
D :=
⎧⎪⎪⎪⎨⎪⎪⎪⎩F ≥ − fz
2, C ≤ Rl − ae,
C ≤ −aen
2+
F2
2aen+
fzaen
F +fz
2
2aen,
E :=
⎧⎪⎪⎪⎨⎪⎪⎪⎩F ≥ − fz
2, C ≤ Rl − aen,
C ≥ F2
2aen− aen
2,
F := C ≥√R0
2 −N2 − aen,
G := N ≤ apn − R0.
(3)
The results of the calculation of the boundary curves forthe cases C+ and C− are resumed in Table 3.
3.1.5. Calculation of the Uncut Chip Geometry and OtherParameters. The main parameters used for describing thechip geometry are the chip thickness (hsp), chip width (bsp),chip cross-sectional area (Asp), and chip length (lsp). Thechip geometry parameters are described in Figure 8. Theuncut chip is discretized in the Φ and κ directions. The chipthickness is defined as the thickness of the material that is
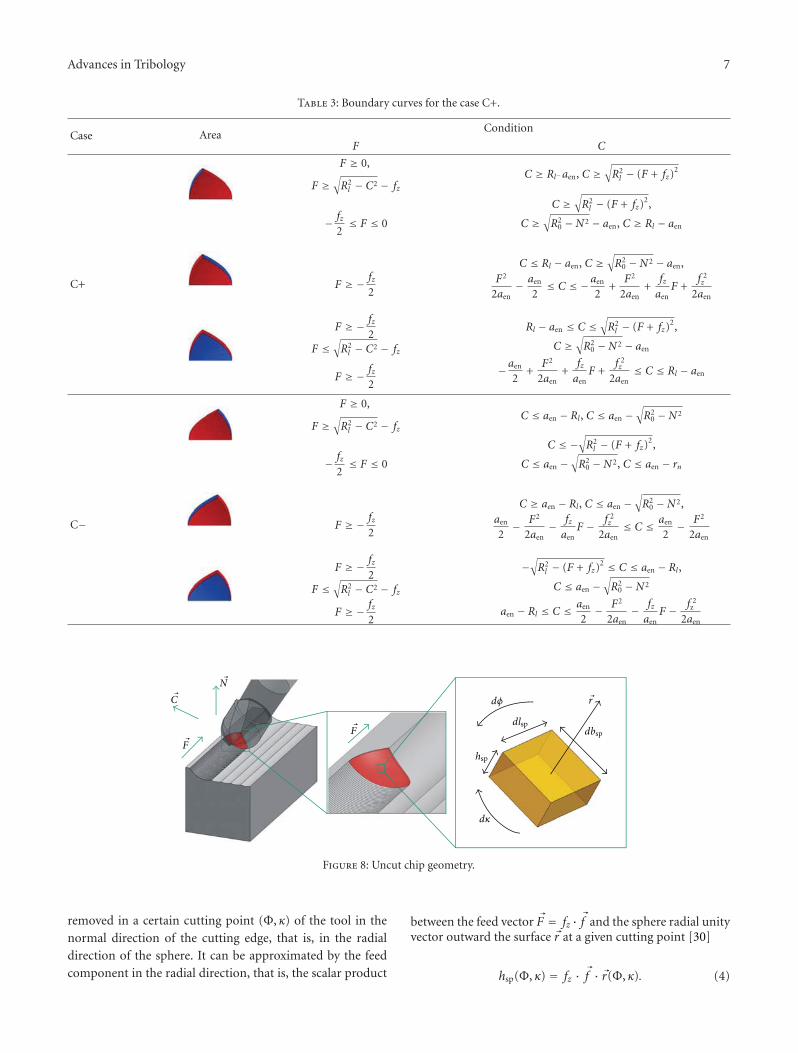
Advances in Tribology 7
Table 3: Boundary curves for the case C+.
Case AreaCondition
F C
F ≥ 0,
F ≥√R2l − C2 − fz
C ≥ Rl−aen, C ≥√R2l − (F + fz)
2
− fz2≤ F ≤ 0
C ≥√R2l − (F + fz)
2,
C ≥√R2
0 −N2 − aen, C ≥ Rl − aen
C+ F ≥ − fz2
C ≤ Rl − aen, C ≥√R2
0 −N2 − aen,F2
2aen− aen
2≤ C ≤ −aen
2+
F2
2aen+
fzaen
F +f 2z
2aen
F ≥ − fz2
F ≤√R2l − C2 − fz
Rl − aen ≤ C ≤√R2l − (F + fz)
2,
C ≥√R2
0 −N2 − aen
F ≥ − fz2
−aen
2+
F2
2aen+
fzaen
F +f 2z
2aen≤ C ≤ Rl − aen
F ≥ 0,
F ≥√R2l − C2 − fz
C ≤ aen − Rl , C ≤ aen −√R2
0 −N2
− fz2≤ F ≤ 0
C ≤ −√R2l − (F + fz)
2,
C ≤ aen −√R2
0 −N2, C ≤ aen − rn
C− F ≥ − fz2
C ≥ aen − Rl, C ≤ aen −√R2
0 −N2,aen
2− F2
2aen− fz
aenF − f 2
z
2aen≤ C ≤ aen
2− F2
2aen
F ≥ − fz2
F ≤√R2l − C2 − fz
−√R2l − (F + fz)
2 ≤ C ≤ aen − Rl,
C ≤ aen −√R2
0 −N2
F ≥ − fz2
aen − Rl ≤ C ≤ aen
2− F2
2aen− fz
aenF − f 2
z
2aen
dφ
dκ
N
�C
�F
�r
hsp
�
�Fdlsp
dbsp
Figure 8: Uncut chip geometry.
removed in a certain cutting point (Φ, κ) of the tool in thenormal direction of the cutting edge, that is, in the radialdirection of the sphere. It can be approximated by the feedcomponent in the radial direction, that is, the scalar product
between the feed vector �F = fz · �f and the sphere radial unityvector outward the surface �r at a given cutting point [30]
hsp(Φ, κ) = fz · �f ·�r(Φ, κ). (4)

8 Advances in Tribology
76
72
68
64104 108 112 116
κ(◦
)
φ (◦)
fz = 0.025 mm
(a)
76
72
68
104 108 112 116
κ(◦
)
φ (◦)
64
fz = 0.050 mm
(b)
76
72
68
104 108 112 116
κ(◦
)
φ (◦)
64
4
3
2
1 hsp×
10−3
fz = 0.075 mm
0
(c)
Figure 9: Influence of the feed-rate on the contact diagram.
F
N
CSurfacegenerating area
Figure 10: Chip position on ball-end mill for the simulation parameters.
The chip width is calculated along the κ direction of thecutting tool and represents the actual contact width of thecutting edge and is given by
dbsp(κ) = R0
cos(λl(κ))dκ
=⇒ bsp(Φ) =∫ κe(Φ)
κs(Φ)
R0
cos(λl(κ))dκ,
(5)
where κs and κe are, respectively, the starting and ending axialimmersion angle κ for a given rotation angle Φ.
The chip cross-sectional represents the contact area oneach cutting edge for each rotation angle and for each andcan be calculated as follows:
dAsp(Φ, κ) = hsp(Φ, κ) · dbsp(Φ)
=⇒ Asp(Φ) =∫ κe(Φ)
κs(Φ)hsp(Φ, κ) · R0
cos(λl(κ))dκ.
(6)
The chip length is defined as the contact length for aconstant axial tool immersion, that is, the engagement lengthof each tool slice
dlsp(κ) = Rl(κ) · dΦ =⇒ lsp(κ) =∫ Φe(κ)
Φs(κ)Rl(κ)dΦ, (7)
where the chip volume is the volume removed by one flute inone tool revolution
dVsp(Φ, κ) = hsp(Φ, κ) · dbsp(κ) · dlsp
=⇒ Vsp =∫ κeg
κsg
∫ Φeg
Φsg
hsp(Φ, κ) · R0
cos(λl(κ))Rl(κ)dΦdκ,
(8)
where κsg, κeg are, respectively, the global starting and endingaxial immersion angle and Φsg, Φeg are the global startingand ending rotation angle. For the points outside theboundary conditions, hsp(Φ, κ) = 0.
3.2. Simulation Results. Table 4 resumes the input data forthe simulation: the cutting speed varies along the tool axis,due to the variation of the local tool radius Rl. The closerto the tool tip the smaller the cutting speed and vice versa.The effective cutting speed was calculated on the surfacegenerating area of the chip, which is the area where theactual cut generates a final surface which is not recut in thefollowing tool engagement.
The chip position on the tool and the FCN coordinatesystem are shown in Figure 10. The position and orientationof the chip varies according to the tool orientation and cut-ting parameters. It should be noticed that for the simulationparameters, the surface generating area is on the top part of

Advances in Tribology 9
64 67 70 73 76
0.25
0.188
0.125
0.0625
0
κ (◦)
fz = 0.025 mm
fz = 0.05 mm
fz = 0.075 mm
fz = 0.025 mmfz = 0.05 mmfz = 0.075 mm
l sp
(mm
)
(a)
104 107 110 113 116
0.4
0.3
0.2
0.1
0
φ (◦)
fz = 0.025 mmfz = 0.05 mmfz = 0.075 mm
fz = 0.025 mm
fz = 0.05 mm
fz = 0.075 mm
bsp
(mm
)
(b)
4.5× 10⁻³
3.38
2.25
1.13
0104 107 110 113 116
φ (◦)
fz = 0.025 mmfz = 0.05 mmfz = 0.075 mm
fz = 0.025 mm
fz = 0.05 mm
fz = 0.075 mm
hsp
max
(mm
)
(c)
8× 10⁻⁴
6
4
2
0104 107 110 113 116
φ (◦)
fz = 0.025 mmfz = 0.05 mmfz = 0.075 mm
fz = 0.025 mm
fz = 0.05 mm
fz = 0.075 mmA
sp(m
m2)
(d)
Figure 11: Influence of the feed-rate on the chip geometry.
the chip. This means that the end surface was generated byusing the highest cutting speed of the entire removed volume.
Figure 9 shows the contact diagram for a feed variation.This diagram can be used for assessing the engagement con-dition and choose optimized parameters. It was introducedby Urban [31], however, without the colour information.The abscissa is the rotation angle Φ and the ordinate the axialimmersion angle κ. The colours represent the chip thickness.
The cutting speed varies continuously along the ordinate,with a variation of κ. This means that the bottom part of thechip in this diagram is machined at a lower cutting speedthan the upper part. The tool rotates in the positive directionofΦ, which means that the left part of the chip in the diagramis removed earlier than the right part. The feed variation doesnot affect the contact region substantially, implying just in alight increase of the chip in the Φ direction what can also beobserved in the Figures 11(a) and 11(b).
Nevertheless, the feed-rate has a high impact on the chipthickness and consequently on the chip cross-section area,
which are shown, respectively, in Figures 11(c) and 11(d).These two parameters are very important for the predictionof the process forces and of the load collective on the cuttingedge.
Higher forces are expected for higher feed-rate values.This effect can, however, be compensated by changing thetool orientation. A more longitudinal chip (see contactdiagram) would result in a smaller chip cross-sectionalarea and consequently smaller processes forces. This wouldtheoretically decrease the tool wear and, thus, increase thetool life.
Nevertheless, a more longitudinal chip also results in ahigher chip length, which is directly related to the tool wear,since an increase of the contact length between the cuttingedge and the workpiece also increases the abrasion andadhesion effects. A good balance between these two effectsis a diagonal chip geometry, as used in this paper, whichreduces the chip cross-sectional area and simultaneouslykeeps the chipping length in a moderate range.

10 Advances in Tribology
HS 6-5-3 PM
HS 4-2-4 PM
1.25 mm 50 μm 50 μm 50 μm
50 μm50 μm50 μm1.25 mm
Ac,eff Ac,eff Ac,eff
Ac,eff Ac,eff Ac,eff
Material
225 m/min 300 m/min 400 m/min
225 m/min 300 m/min 400 m/min
Material
Figure 12: Tool wear qualification.
Table 4: Simulation input data.
Cutting tool
Tool diameter D0 (mm) 6
Number of Flutes n 4
Helix angle λ (◦) 30
Local helix angle λl (◦) 21
Cutting parameters
Effective cutting speed vc,eff (m/min) 225, 300, and 400
Cutting speed at shaft vc (m/min) 233, 311, and 414
Feed per tooth fz (mm) 0.025, 0.05, and 0.075
Row width aen (mm) 0.05
Cutting depth apn (mm) 0.04
Tilt angle βfn (◦) 75
Workpiece position C+
Simulation parameters
Discretization along the rotation angle dΦ (◦) 0.05
Discretization along the axial 0.02
immersion angle dκ (◦)
4. Experimental Results and Discussion
4.1. Qualification and Quantification of the Milling Tool Wear.Figure 12 exposes the qualified tool flank wear land (VB)morphology after reaching an abort criterion of 75 μm interms of varying the work piece material and the effectivecutting speed vc,eff.
While increasing vc,eff in machining both materialsthe characteristic abrasion of the tool flank developedprogressively homogenous without any hinds of cutting-edgefracture, cracking, and shell-shaped spalling of the TiAlN-coating on the flank of the rake face. While increasing vc,eff inmachining of HS 4-2-4 PM a noticeable increase in adhesionrelated tool flank wear was observed.
In the case of the high-speed steel HS 6-5-3 PM (64 HRC)the tool flank wear land VB evolved nearly linear with aprogressing cutting length Lc at each parameter setting; seeFigure 13. In the beginning of machining, a characteristicinitial abrasive wear evolved until reaching a Lc of nearly25 m, where the wear development curve slightly flatteneduntil Lc,max was reached.
Conversely to Elbestawi et al. [12], the introduced,however not proved, hypothesis of Salomon [13] is con-firmed, stating that for an increase of vc,eff from 225 m/minup to 300 m/min the maximum cutting length Lc,max isimproved by 33%. After performing of milling tests at vc,eff =400 m/min a further tool life improvement in respect to avc,eff of 300 m/min was detected.
Although the cold working steel HS 4-2-4 PM (66 HRC)is slightly harder than HS 6-5-3 PM (64 HRC), a Lc,max betterthan 200 m was proofed.
After reaching 60 m in cutting length, the wear evolutioncurve significantly flattened for each cutting speed settingand rose linearly until Lc,max. The abort criterion of 75 μmin VB was first detected after 220 m of cutting length at anvc,eff of 225 m/min. Lc increased nearly linear with increasingvc,eff.
Additionally, in Figure 14, for clarifying the influence offeed per tooth fz regarding the wear evolution of the millingtool on a random basis, fz was varied in terms of 0.025, 0.05,and 0.075 mm/tooth at a vc,eff of 300 m/min for both workpiece materials.
It was found out that depending on the material charac-teristics of HS 4-2-4 PM in a narrow cutting parameter rangea decreasing feedrate negatively influenced Lc,max. Increasingfz from 0.05 mm/tooth (Lc = 240 m) up to 0.075 mm/toothaccompanied with an significant improvement in cuttinglength up to 320 m. Hence, on the other hand, increasingfz increases the cusp to valley which accompanies withan increased surface roughness. At first appearance, this
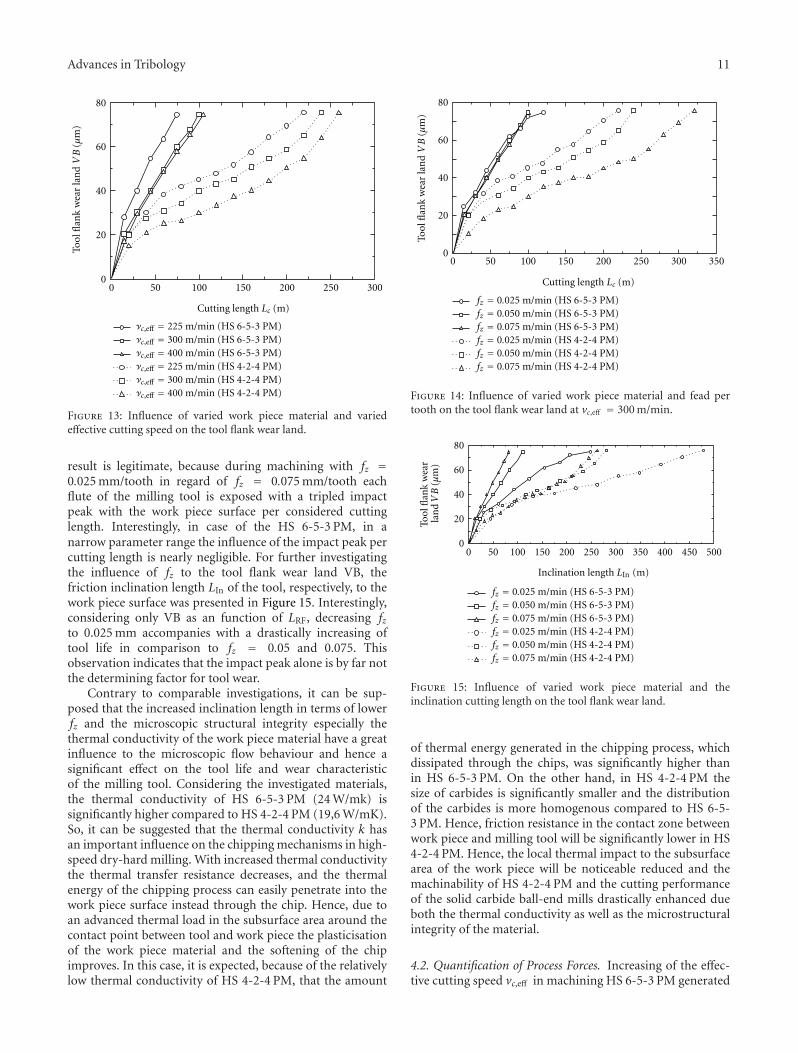
Advances in Tribology 11
0 50 100 150 200 250 300
80
60
40
20
0
Cutting length Lc (m)
Ac,eff = 225 m/min (HS 6-5-3 PM)Ac,eff = 300 m/min (HS 6-5-3 PM)Ac,eff = 400 m/min (HS 6-5-3 PM)Ac,eff = 225 m/min (HS 4-2-4 PM)Ac,eff = 300 m/min (HS 4-2-4 PM)Ac,eff = 400 m/min (HS 4-2-4 PM)
Tool
flan
kw
ear
lan
dVB
(μm
)
Figure 13: Influence of varied work piece material and variedeffective cutting speed on the tool flank wear land.
result is legitimate, because during machining with fz =0.025 mm/tooth in regard of fz = 0.075 mm/tooth eachflute of the milling tool is exposed with a tripled impactpeak with the work piece surface per considered cuttinglength. Interestingly, in case of the HS 6-5-3 PM, in anarrow parameter range the influence of the impact peak percutting length is nearly negligible. For further investigatingthe influence of fz to the tool flank wear land VB, thefriction inclination length LIn of the tool, respectively, to thework piece surface was presented in Figure 15. Interestingly,considering only VB as an function of LRF, decreasing fzto 0.025 mm accompanies with a drastically increasing oftool life in comparison to fz = 0.05 and 0.075. Thisobservation indicates that the impact peak alone is by far notthe determining factor for tool wear.
Contrary to comparable investigations, it can be sup-posed that the increased inclination length in terms of lowerfz and the microscopic structural integrity especially thethermal conductivity of the work piece material have a greatinfluence to the microscopic flow behaviour and hence asignificant effect on the tool life and wear characteristicof the milling tool. Considering the investigated materials,the thermal conductivity of HS 6-5-3 PM (24 W/mk) issignificantly higher compared to HS 4-2-4 PM (19,6 W/mK).So, it can be suggested that the thermal conductivity k hasan important influence on the chipping mechanisms in high-speed dry-hard milling. With increased thermal conductivitythe thermal transfer resistance decreases, and the thermalenergy of the chipping process can easily penetrate into thework piece surface instead through the chip. Hence, due toan advanced thermal load in the subsurface area around thecontact point between tool and work piece the plasticisationof the work piece material and the softening of the chipimproves. In this case, it is expected, because of the relativelylow thermal conductivity of HS 4-2-4 PM, that the amount
0 50 100 150 200 250 300 350
80
60
40
20
0
Cutting length Lc (m)
Tool
flan
kw
ear
lan
dVB
(μm
)
fz = 0.025 m/min (HS 6-5-3 PM)fz = 0.050 m/min (HS 6-5-3 PM)fz = 0.075 m/min (HS 6-5-3 PM)fz = 0.025 m/min (HS 4-2-4 PM)fz = 0.050 m/min (HS 4-2-4 PM)fz = 0.075 m/min (HS 4-2-4 PM)
Figure 14: Influence of varied work piece material and fead pertooth on the tool flank wear land at vc,eff = 300 m/min.
80
60
40
20
00 50 100 150 200 250 300 350 400 450 500
Tool
flan
kw
ear
lan
d
fz = 0.025 m/min (HS 6-5-3 PM)fz = 0.050 m/min (HS 6-5-3 PM)fz = 0.075 m/min (HS 6-5-3 PM)fz = 0.025 m/min (HS 4-2-4 PM)fz = 0.050 m/min (HS 4-2-4 PM)fz = 0.075 m/min (HS 4-2-4 PM)
Inclination length LIn (m)
VB
(μm
)
Figure 15: Influence of varied work piece material and theinclination cutting length on the tool flank wear land.
of thermal energy generated in the chipping process, whichdissipated through the chips, was significantly higher thanin HS 6-5-3 PM. On the other hand, in HS 4-2-4 PM thesize of carbides is significantly smaller and the distributionof the carbides is more homogenous compared to HS 6-5-3 PM. Hence, friction resistance in the contact zone betweenwork piece and milling tool will be significantly lower in HS4-2-4 PM. Hence, the local thermal impact to the subsurfacearea of the work piece will be noticeable reduced and themachinability of HS 4-2-4 PM and the cutting performanceof the solid carbide ball-end mills drastically enhanced dueboth the thermal conductivity as well as the microstructuralintegrity of the material.
4.2. Quantification of Process Forces. Increasing of the effec-tive cutting speed vc,eff in machining HS 6-5-3 PM generated

12 Advances in Tribology
0 20 40 60 80
50
40
30
20
10
0
Ac,eff = 225 m/min (HS 6-5-3 PM)Ac,eff = 300 m/min (HS 6-5-3 PM)Ac,eff = 400 m/min (HS 6-5-3 PM)Ac,eff = 225 m/min (HS 4-2-4 PM)Ac,eff = 300 m/min (HS 4-2-4 PM)Ac,eff = 400 m/min (HS 4-2-4 PM)
Tool flank wear land VB (μm)
Feed
forc
eFf
(N)
Figure 16: Influence of varied work piece material and progressingtool flank wear land on the resulting feed force.
elevated process temperatures, hence the plasticisation of thework piece material enhanced and process force, especiallythe feed force F f (Figure 16), significantly decreased.
F f increased proportionally with progressive tool flankwear land VB. With advanced vc,eff the curve of the F f
with progressing VB significantly flattened. Machining withvc,eff = 400 m/min considering 225 m/min, resulted inreduction of F f by nearly 50%. In machining HS 4-2-4 PM,the F f curve increased more sharply with advanced cuttingspeeds. Interestingly, while machining with a fresh tool at VB∼20 μm, for each vc,eff F f evolved from nearly a range of 9to 14 N. After reaching the abort criterion of 75 μm in termsof VB, a maximum feed force F f ,max of 39 N for 225 m/min,30 N for 300 m/min, and 43 N for 400 m/min in effectivecutting speed were quantified.
After performing of milling tests on both work piecematerials with fresh tools at vc,eff of 400 m/min and fz of0.05 mm a roughness of Ra < 0.12μm was measured.
5. Conclusion
In order to characterise the cutting force related wear pro-gression and cutting performance of solid carbide ball-end
mills in high-speed dry-hard milling of hardened powdermetallurgical steels, the tool wear flank land, the cuttinglength, and the process forces were investigated.
(1) While increasing the effective cutting speed inmachining of two powder metallurgical producedsteels, HS 6-5-3 PM (64 HRC) and a HS 4-2-4 PM(66 HRC), a characteristic abrasion of the usedsolid carbide ball-end mills developed progressivelyhomogenous.
(2) An iterative increase in effective cutting speedresulted in a significantly enhanced tool life.
(3) Depending on the material characteristics of theinvestigated work piece materials, in a narrow cuttingparameter range an increased federate was accompa-nied by an enhanced tool life.
(4) Increasing of the effective cutting speed vc,eff inmachining HS 6-5-3 PM resulted in a significantlydecreased feed force and enhanced tool life.
(5) In machining HS 4-2-4 PM the feed force increasedmore sharply with advanced cutting speeds while toollife was tripled in regard to HS 6-5-3 PM.
(6) It was supposed that with decreased thermal con-ductivity of the considered work piece material thethermal transfer resistance increases, and hence, thelocal thermal impact to the subsurface area of thework piece will be noticeable reduced as well as thecutting performance of the solid carbide ball-endmills drastically enhanced.
References
[1] I. Jung, “Moderne Hochleistungsstahle fur den Formen-und Werkzeugbau, Tagungsunterlagen,” in Proceedings of theSeminar fur Werkzeugtechnik, 2002.
[2] D. Biermann, A. Baschin, E. Krebs, and J. Schlenker, “Man-ufacturing of dies from hardened tool steels by 3-axismicromilling,” Production Engineering, Research and Develop-ment, vol. 5, no. 2, pp. 209–217, 2011.
[3] B. Denkena, D. Boehnke, and R. Meyer, “Reduction of wearinduced surface zone effects during hard turning by meansof new tool geometries,” Production Engineering, Research andDevelopment, vol. 2, no. 2, pp. 123–132, 2008.
[4] H. K. Tonshoff, C. Arendt, and R. Ben Amor, “Cutting ofhardened steel,” Annals of the CIRP, vol. 49, no. 2, pp. 547–566, 2000.
[5] F. Klocke, S. Knodt, S. Altmuller, and A. Bilsing,“Frasverfahren stellen hohe anspruche an werkzeug undmaschine,” Werkstattstechnik Wt, vol. 89, no. 10, pp. 451–455,1999.
[6] F. Klocke, V. Zinkann, and K. Gerschwiler, “Hochleis-tungswerkstoffe erfordern angepasste Bearbeitungstechnolo-gien,” VDI-Z, vol. 139, no. 6, pp. 18–24, 1997.
[7] R. Piotrowiak, V. Schuler, I. Schruff, and C. Spiegelhauer,“Spruhkompaktierte Hochleistungs-Werkzeugstahle,” HTMZeitschrift fur Werkstoffe, Warmebehandlung und Fertigung,vol. 59, no. 6, pp. 423–431, 2004.
[8] A. Schulz, E. Matthaei-Schulz, S. Spangel, R. Tinscher, H.Vetters, and P. Mayr, “Das primargefuge spruhkompaktierter

Advances in Tribology 13
stahle,” HTM Zeitschrift fur Werkstoffe, Warmebehandlung undFertigung, vol. 56, no. 2, pp. 104–109, 2001.
[9] A. Schulz, V. Uhlenwinkel, C. Escher et al., “Spruhkompak-tierte hochlegierte werkzeugstahle—herstellung und eigen-schaften,” HTM Zeitschrift fur Werkstoffe, Warmebehandlungund Fertigung, vol. 60, no. 2, pp. 87–95, 2005.
[10] Y. Matsumoto, M. M. Barash, and C. R. Liu, “Cuttingmechanisms during machining of hardened steels,” MaterialsScience and Technology, vol. 3, no. 4, pp. 299–305, 1987.
[11] J. Kohler, Berechnung der zerspankrafte bei variierendenspanungsquerschnittsformen, Doctoral thesis, Hannover, Ger-many, 2010.
[12] M. A. Elbestawi, L. Chen, C. E. Becze, and T. I. El-Wardany,“High-speed milling of dies and molds in their hardenedstate,” Annals of the CIRP, vol. 46, no. 1, pp. 57–62, 1997.
[13] C. Salomon, “Verfahren zur bearbeitung von metallen oder beieiner bearbeitung durch schneidende werkzeuge sich ahnlichverhaltende werkstoffe,” Deutsches Patent Nr. 523594, 931, 4,1931.
[14] F. Klocke and W. Konig, Fertigungsverfahren Drehen, Frasen,Bohren, vol. 8, Springer, Berlin, Germany, 2008.
[15] P. Koshy, R. C. Dewes, and D. K. Aspinwall, “High speed endmilling of hardened AISI D2 tool steel (∼58 HRC),” Journal ofMaterials Processing Technology, vol. 127, no. 2, pp. 266–273,2002.
[16] M. Okada, A. Hosokawa, R. Tanaka, and T. Ueda, “Cut-ting performance of PVD-coated carbide and CBN toolsin hardmilling,” International Journal of Machine Tools andManufacture, vol. 51, no. 2, pp. 127–132, 2011.
[17] F. Klocke and V. Zinkann, “Hochgeschwindigkeitsbearbeitungandert die Spanbildung,” VDI-Z, vol. 141, no. 3-4, pp. 30–34,1999.
[18] E. El-Magd and C. Treppmann, “Mechanical behaviour ofmaterials at high strain rates,” Scientific Fundamentals of HSC,pp. 113–136, 2001.
[19] S. Knodt, Hartfrasen pulvermetallurgisch erzeugter ledeburitis-cher Werkzeugstahle, Doctoral thesis, Aachen, Germany, 2004.
[20] M. Sokovic, J. Kopac, L. A. Dobrzanski, and M. Adamiak,“Wear of PVD-coated solid carbide end mills in dry high-speed cutting,” Journal of Materials Processing Technology, vol.157-158, pp. 422–426, 2004.
[21] Y. S. Liao and H. M. Lin, “Mechanism of minimum quantitylubrication in high-speed milling of hardened steel,” Interna-tional Journal of Machine Tools and Manufacture, vol. 47, no.11, pp. 1660–1666, 2007.
[22] R. Ben Amor, Thermomechanische Wirkmechanismen undSpanbildung bei der Hochgeschwindigkeitszerspanung, Doctoralthesis, Hannover, Germany, 2003.
[23] M. Elbestawi, M. Dumitrescu, T. I. El-Wardany, and J. Bohner,“Effect of carbide tool grades and cutting edge geometry ontool life during high speed machining of hardened tool steel,”in Proceedings of the 2nd International Conference on HighSpeed Machining, pp. 37–46, 1999.
[24] Y. Altintas and P. Lee, “Mechanics and dynamics of ball endmilling,” Journal of Manufacturing Science and Engineering,Transactions of the ASME, vol. 120, no. 4, pp. 684–692, 1998.
[25] Y. Altintas, Manufacturing Automation, Metal Cutting Mechan-ics, Machine Tool Vibrations, and CNC Design, CambridgeUniversity Press, New York, NY, USA, 2000.
[26] A. Zabel, Prozesssimulation in der zerspanung—modellierungvon dreh und frasprozessen, Habilitation thesis, Dortmund,Germany, 2010.
[27] C. A. van Luttervelt, T. H. C. Childs, I. S. Jawahir etal., “Present situation and future trends in modelling of
machining operations progress report of the CIRP workinggroup “modelling of machining operations,” CIRP Annals-Manufacturing Technology, vol. 47, no. 2, pp. 587–624, 1998.
[28] I. Lazoglu and S. Y. Liang, “Modeling of ball-end milling forceswith cutter axis inclination,” Journal of Manufacturing Scienceand Engineering, vol. 122, no. 1, pp. 3–11, 2000.
[29] R. Zhu, S. G. Kapoor, and R. E. DeVor, “Mechanistic modelingof the ball end milling process for multi-axis machiningof free-form surfaces,” Journal of Manufacturing Science andEngineering, vol. 123, no. 3, pp. 369–379, 2001.
[30] E. Ozturk and E. Budak, “Modeling of 5-axis milling pro-cesses,” Machining Science and Technology, vol. 11, no. 3, pp.287–311, 2007.
[31] B. Urban, Kinematische und mechanische wirkungen deskugelkopffrasens, Doctoral thesis, Hannover, Germany, 2009.

Hindawi Publishing CorporationAdvances in TribologyVolume 2011, Article ID 837469, 8 pagesdoi:10.1155/2011/837469
Research Article
Wear Behavior and Its Correlation with Mechanical Propertiesof TiB2 Reinforced Aluminium-Based Composites
N. B. Dhokey and K. K. Rane
Department of Metallurgy and Material Science, Government College of Engineering, Pune 411005, India
Correspondence should be addressed to N. B. Dhokey, [email protected]
Received 3 July 2011; Revised 1 August 2011; Accepted 22 August 2011
Academic Editor: Luca Settineri
Copyright © 2011 N. B. Dhokey and K. K. Rane. This is an open access article distributed under the Creative CommonsAttribution License, which permits unrestricted use, distribution, and reproduction in any medium, provided the original work isproperly cited.
Aluminium-based TiB2 reinforced composite is a promising material to be used as brake drum material, and it may emergeas substitute for conventional gray cast iron. Aluminium-based composites containing 2% by wt copper reinforced with 2.5and 5 wt% TiB2 composites were made in induction furnace by in situ synthesis process using simultaneous addition of halidefluxes (K2TiF6 and KBF4). These cast composites were evaluated for microstructures, hardness, flow curve properties, and tensileproperties. It was observed that overall wear behavior gave reasonably good correlation with mechanical properties of compositesas compared to gray cast iron.
1. Introduction
Metal matrix composite containing ceramic particulatestends to improve mechanical properties as well as wearproperties by way of creating restriction to deformation ofmaterial during mechanical working. Metal matrix compos-ites (especially aluminium and titanium based) are used inaerospace and automobile industries due to their enhancedproperties such as modulus, hardness, tensile strength, andwear resistance combined with significant weight saving [1,2]. Aluminium with ceramic reinforcements such as Al2O3,SiC, TiC, and TiB2 are used for structural applications, fortheir good toughness and wear resistance [3]. Modulus ofcomposite increases with TiC- and TiB2-particle additionsand it is greater than that for composite with Al2O3 andSiC. Also, interfacial bonding is enhanced in the TiC- andTiB2-added composites [4]. There are different techniquesof forming TiB2 in the matrix such as powder metallurgymethod, spray, deposition and several casting methods suchas rheocasting, squeeze casting, stir-casting and compocasting [5, 6]. Different systems are used for synthesis ofthis composite such as TiO2-Al-B, TiO2-Al-B-CuO, TiO2-Al-B2O3, NaBH4, and TiCl4 and Ti-containing and B-containing salts are added to the melt resulting in a series ofchemical reactions which produce submicron TiB2 particles
within the melt [3, 7, 8]. The addition of reinforcementproduces increase in strength and stiffness over the base alloyat the expense of ductility as compared to cast aluminium[4, 9]. The wear rate of the composites improves significantlywith the TiB2 content. The friction coefficient also decreasedwith increasing TiB2 content, which indicates decrease inwear rate and hence the improvement in the wear resistanceof the composite [10, 11]. Wear and mechanical propertiesof commercially used grades of cast irons (GI250, GIHC,GI 250Ti, and CGI) suggest that compact graphite cast ironexhibits higher mechanical strength among all grades, but ithas less wear resistance than other grades of cast irons [12].
It is well known that application of Al-MMC in auto-motive components can reduce the weight of the vehicle byone third over gray cast iron. The aim of the present work isto establish a correlation of wear behavior with mechanicalproperties of the Al-TiB2 composites as compared to graycast iron.
2. Materials and Experimental Methods
2.1. Materials and Processing. Commercially pure (CP) alu-minium was taken as matrix material. In situ flux assessed
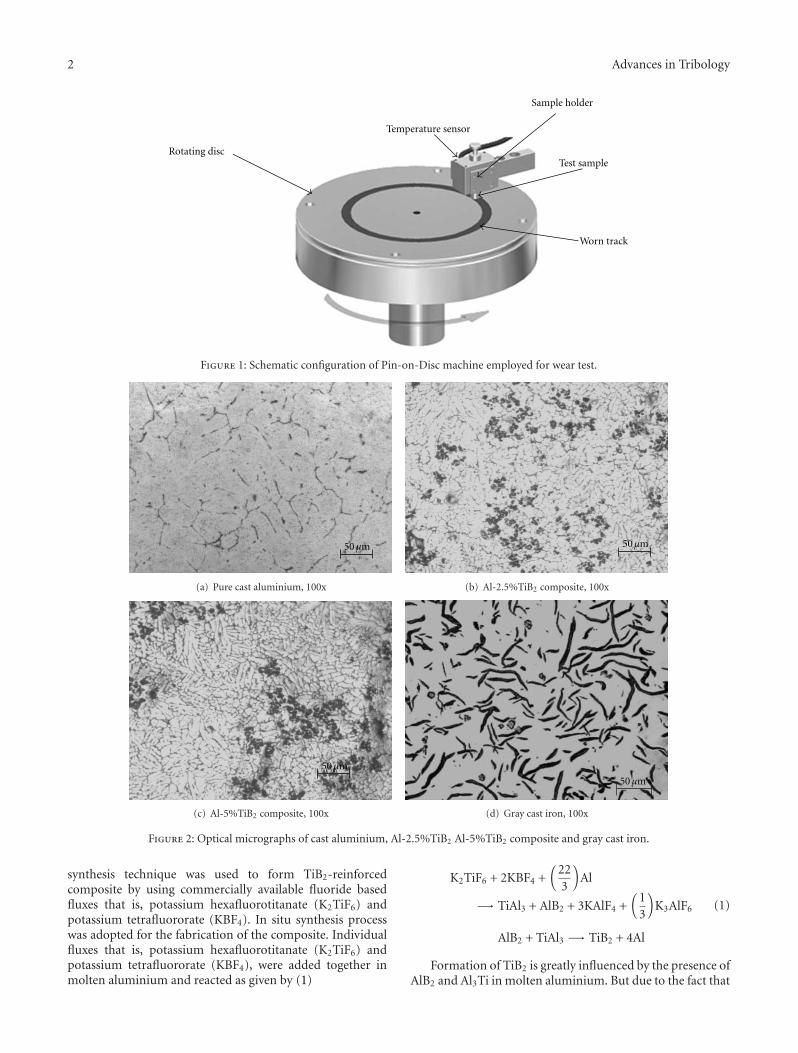
2 Advances in Tribology
Rotating disc
Sample holder
Test sample
Worn track
Temperature sensor
Figure 1: Schematic configuration of Pin-on-Disc machine employed for wear test.
50μm
(a) Pure cast aluminium, 100x
50μm
(b) Al-2.5%TiB2 composite, 100x
50μm
(c) Al-5%TiB2 composite, 100x
50μm
(d) Gray cast iron, 100x
Figure 2: Optical micrographs of cast aluminium, Al-2.5%TiB2 Al-5%TiB2 composite and gray cast iron.
synthesis technique was used to form TiB2-reinforcedcomposite by using commercially available fluoride basedfluxes that is, potassium hexafluorotitanate (K2TiF6) andpotassium tetrafluororate (KBF4). In situ synthesis processwas adopted for the fabrication of the composite. Individualfluxes that is, potassium hexafluorotitanate (K2TiF6) andpotassium tetrafluororate (KBF4), were added together inmolten aluminium and reacted as given by (1)
K2TiF6 + 2KBF4 +(
223
)Al
−→ TiAl3 + AlB2 + 3KAlF4 +(
13
)K3AlF6
AlB2 + TiAl3 −→ TiB2 + 4Al
(1)
Formation of TiB2 is greatly influenced by the presence ofAlB2 and Al3Ti in molten aluminium. But due to the fact that

Advances in Tribology 3
TiB2 precipitates
Figure 3: SEM micrograph shows magnified image of segregatedpockets of TiB2 in aluminium matrix at 5000x.
Gibbs free energy for formation of Al3Ti is higher than AlB2,the recovery of boron is lower [13]. Hence 20% extra KBF4
addition compared to stoichiometric amount was made toreduce the presence of allied products and complete thereaction to produce TiB2 reinforcement [14]. The propertiesof synthesized composites were compared with gray castiron used for brake drum of automotive applications and itconsists of 3.54% C, 2.15% Si and 0.51% Mn (by wt).
Induction furnace (25 KW, Make Autocontrol, Mumbai)was used for making the composites with controlled argonshrouding and as well as for gray cast iron as the referencematerial. After sufficient holding time and degasing of melt,the molten composite was poured into preheated mould(200◦C) to get cast specimens of dimensions 150 mm lengthand 20 mm diameter for material charaterisation.
2.2. Material Characterization. Reinforcement phases wereobserved in scanning electron microscope (make-JOEL,Japan). Samples for SEM analysis were polished by usingelectrolytic polishing machine (Eletropol Metatech) witha flow of electrolyte solution (Methanol-730 mL, ButylCellosolve-98 mL, Perchloric acid-78 mL and Distilled water-100 mL). Additionally, for revealing grain boundaries ofmatrix and reinforcement distribution, the etching wascarried out using Villella reagent (20 mL Hydrofluoric acid,10 mL Nitric acid, 30 mL Glycerin).
The hardness of composite was measured by using microhardness machine (FM-700, Future-tech). The load appliedwas 100 gram with dwell time of 15 seconds. An average ofsix readings was reported.
Tensile test specimens were made as per ASTM A 370standard and tested in a Universal Testing Machine (Capacity10 Tons). The average data values of three samples obtainedfrom tensile test were used. In the same machine, com-pression testing was carried on specimen having L/D =1 (D = 20 mm). The specimen was gradually pressed incompression in steps of 1000 Kg, and its instantaneous height
and diameter were recorded to get true stress verses truestrain plot, using an average of three test specimens. Thecorresponding flow curve equation was derived for eachcomposite studied
σ = k × εn, (2)
where σ = true stress in MPa, ε = true strain, and n = strainhardening exponent.
Pin-on-Disc wear test machine (M/s Magnum Engineers,Bangalore) was used for wear analysis. Pin specimen (Ø10 mm) was kept stationary perpendicular to disc, while thecircular disc (SAE 52100 steel, 61 HRC, 0.3 μRA, and discdiameter 165 mm) was rotated as shown in Figure 1. A loadof 60 N and sliding velocity 1.8 m/s was employed for wearrate evaluation. An average wear rate was reported based onthree samples of same composition. In order to find out therise in temperature during wear test, temperature sensor waspositioned in 1 mm diameter drilled hole at 15 mm distancefrom sliding end of the specimen.
3. Results and Discussion
3.1. Microstructural Analysis. Optical microstructure of Al-TiB2 composites with different reinforcement content areshown in Figure 2. As compared to pure aluminium, averagegrain size of phase in composite is relatively small.
3.2. SEM Microstructure. Figure 3 shows microstructure ofAl-5% TiB2 composite segregated spot of TiB2 (Figure 3) inthe aluminium matrix. Typically, TiB2 particles are present inthe segregated manner due to high interfacial energy.
3.3. SEM-EDS Analysis with Elemental Distribution. SEM-EDS analysis was used to ascertain approximate chemicalcomposition of reinforcement and also that of matrix.Figure 4 indicate spectrum of Al-5% TiB2 composite withpeaks of aluminium and titanium. EDS elemental analysisindicated in Figure 5 confirms the presence of TiB2 precipi-tates. Figure 6 shows elemental distribution that confirms thepresence of boron, aluminium, and titanium.
3.4. Microhardness Analysis. The hardness of composite withdifferent reinforcement content was compared with graycast iron as reference material. Figure 7 shows variation ofAl-MMC for varying reinforcement content of TiB2. Al-based composite containing 2.5 wt% TiB2 indicate 47%improvement in hardness and this goes up with increasingTiB2 content. It is noticed that hardness of 5% TiB2 is in-creased by almost twice than that of pure aluminium butmuch less than that of gray cast iron.
3.5. Mechanical Properties
3.5.1. Tensile Properties. It is evident from Table 1 that thecomposite exhibited higher UTS and higher fracture strengththan aluminium with reduced ductility. The significantimprovement in the mechanical properties of the composite

4 Advances in Tribology
— — —
Element
B
Al 1.486 97.67 98.67
Ti 4.508 2.33 1.33
Total 100 100
0 1 2 3 4 5 6 7 8 9 10
0.3 mm
Mass (%) At (%)
BK
a CK
aT
iLa
TiK
a
AlK
a
TiK
b
(keV)
(keV)
Figure 4: EDX spectrum and elemental mapping of Al-5%TiB2 composite.
Element Mass (%) At (%)
B 0.183 42.45 70.26
Al 1.486 28.47 18.88
Ti 4.508 29.08 10.86
Total 100 100
0 1 32 4 5 6 7 8 9 100
153045607590
105120135150165180
Cou
nts
1μm IMG1
BK
a TiL
a
TiK
a
AlK
a
TiK
b
(keV)
(keV)
Figure 5: EDX spectrum and elemental mapping on TiB2 particle.
Table 1: Data of tensile test conducted on cast Al, Al-MMCs and gray cast iron.
Sr. no. Properties Pure aluminium Al-2.5%TiB2 Al-5%TiB2 Gray cast iron
1 Y.S (MPa) 74 93 96 —
2 UTS (MPa) 121 157 180 284
3 Fracture strength (MPa) 70 78 150 284
5 %Reduction in area 22.53 16.84 9.38 3.19
6 %Elongation 8 6.5 6 3

Advances in Tribology 5
1μm 1μm
1μm 1μm
IMG1 B K
Al K Ti K
Figure 6: Elemental distribution of boron, aluminium, titanium nearby TiB2 clusters.
Table 2: Flow curve properties of composite materials.
Sr. no. Properties Pure aluminium Al-2.5%TiB2 Al-5%TiB2
1 K (MPa) 137 138 141
2 n 0.412 0.375 0.324
3 Gross increase in area (along radial direction) 56.25% 45.56% 42.12%
4 Gross reduction in height (along longitudinal direction) 34.5% 31.5% 28.5%
0
50
100
150
200
250
300
350
Har
dnes
s(H
V)
Materials
Pure Al Gray cast ironAl-2.5% TiB2 Al-5% TiB2
Figure 7: Hardness variation of cast aluminium, Al-TiB2 compos-ites, and gray cast iron.
as compared with the aluminium can be attributed to TiB2
particles in the matrix. Similar trend of increasing tensile
properties is reported by previous researchers in case of Al-12% by wt. TiB2 and Al-4.5% Cu-3% C-15%TiB2 composites[15, 16]. The fractured surfaces as depicted in Figure 8shows a shift in fracture behavior from ductile to brittle;for example, pure aluminium indicates cup and cone typeductile fracture, Al-5% TiB2 reveals mixed mode ductile-brittle transition, and gray cast iron shows brittle fracture.
3.5.2. Flow Curve Properties. Compression test results areplotted in the form of flow curve, and the correspondingproperties derived from flow curve equation are given inTable 2. It can be observed that strength coefficient (K)increases with increase in reinforcements, whereas strainhardening decreases with increased TiB2 content. Overall,higher TiB2 content shows higher strain hardening rate (n).It means that composite exhibits appreciable deformationbehavior which can be seen from gross deformation both intransverse as well as in longitudinal direction.

6 Advances in Tribology
(a) Pure cast aluminium (b) Al-5%TiB2 composite
(c) Gray cast iron, 100x
Figure 8: Stereomicrographs of tensile fractured surfaces of (a) Cast aluminium, (b) Al-5%TiB2 composite and (c) Gray cast iron.
Materials
Pure Al Gray cast ironAl-2.5% TiB2 Al-5% TiB2
0
0.005
0.01
0.015
0.02
Wea
rra
te(m
m3/m
) (L = 60 N, v = 1.8 m/s)
Figure 9: Wear rate variation of sliding pins made out of differentmaterials.
3.6. Sliding Wear Analysis. Figure 9 shows the variation ofwear rate with composition for MMCs. Apparently, purealuminium exhibits the highest wear loss whereas gray castiron shows the lowest wear loss, for the given set of appliedload and sliding speed employed. Al-based composite showsa decrease in wear rate with increasing content of TiB2
reinforcement which acts as obstacle to shear deformation,while material is getting slid on the counterface. However,wear rate is much higher than gray cast iron. Also, TiB2 actsas load-bearing element in the matrix. This supports the
Materials
Pure Al Gray cast ironAl-2.5% TiB2 Al-5% TiB2
0
10
20
30
40
50
60
Tem
pera
ture
rise
(◦C
)
(L = 60 N, v = 1.8 m/s)
Figure 10: Temperature rise variation of sliding pins made out ofdifferent materials.
work reported elsewhere in TiB2-reinforced Al-7%Si alloy[17]. Figure 10 shows that temperature rise during slidingis more for pure aluminium and its composites than thatof gray cast iron. It is well known that aluminum exhibitshigh thermal conductivity (237 W/m·K), and it reduces withincreasing addition of TiB, while gray cast iron has relativelylow thermal conductivity (70 W/m·K). It can be noted that
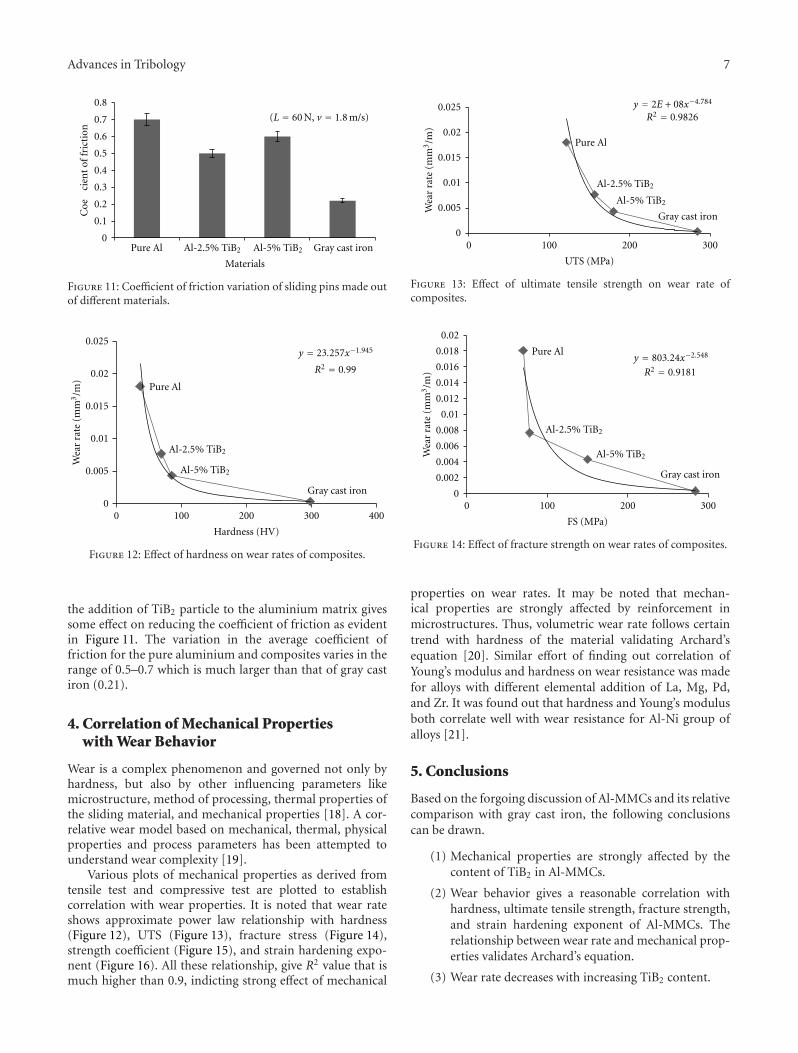
Advances in Tribology 7
Materials
Pure Al Gray cast ironAl-2.5% TiB2 Al-5% TiB2
0
0.1
0.2
0.3
0.4
0.5
0.6
0.7
0.8
Coe
cien
tof
fric
tion
(L = 60 N, v = 1.8 m/s)
Figure 11: Coefficient of friction variation of sliding pins made outof different materials.
y = 23.257x−1.945
R2 = 0.99
0
0.005
0.01
0.015
0.02
0.025
0 100 200 300 400
Wea
rra
te(m
m3/m
)
Hardness (HV)
Gray cast iron
Pure Al
Al-2.5% TiB2
Al-5% TiB2
Figure 12: Effect of hardness on wear rates of composites.
the addition of TiB2 particle to the aluminium matrix givessome effect on reducing the coefficient of friction as evidentin Figure 11. The variation in the average coefficient offriction for the pure aluminium and composites varies in therange of 0.5–0.7 which is much larger than that of gray castiron (0.21).
4. Correlation of Mechanical Propertieswith Wear Behavior
Wear is a complex phenomenon and governed not only byhardness, but also by other influencing parameters likemicrostructure, method of processing, thermal properties ofthe sliding material, and mechanical properties [18]. A cor-relative wear model based on mechanical, thermal, physicalproperties and process parameters has been attempted tounderstand wear complexity [19].
Various plots of mechanical properties as derived fromtensile test and compressive test are plotted to establishcorrelation with wear properties. It is noted that wear rateshows approximate power law relationship with hardness(Figure 12), UTS (Figure 13), fracture stress (Figure 14),strength coefficient (Figure 15), and strain hardening expo-nent (Figure 16). All these relationship, give R2 value that ismuch higher than 0.9, indicting strong effect of mechanical
Pure Al
Gray cast iron
Al-2.5% TiB2
Al-5% TiB2
y = 2E + 08x−4.784
R2 = 0.9826
0
0.005
0.01
0.015
0.02
0.025
0 100 200 300
Wea
rra
te(m
m3/m
)
UTS (MPa)
Figure 13: Effect of ultimate tensile strength on wear rate ofcomposites.
Pure Al
Gray cast iron
Al-2.5% TiB2
Al-5% TiB2
0 100 200 300
Wea
rra
te(m
m3/m
)
y = 803.24x−2.548
0
0.002
0.004
0.006
0.008
0.01
0.012
0.014
0.016
0.018
0.02
FS (MPa)
R2 = 0.9181
Figure 14: Effect of fracture strength on wear rates of composites.
properties on wear rates. It may be noted that mechan-ical properties are strongly affected by reinforcement inmicrostructures. Thus, volumetric wear rate follows certaintrend with hardness of the material validating Archard’sequation [20]. Similar effort of finding out correlation ofYoung’s modulus and hardness on wear resistance was madefor alloys with different elemental addition of La, Mg, Pd,and Zr. It was found out that hardness and Young’s modulusboth correlate well with wear resistance for Al-Ni group ofalloys [21].
5. Conclusions
Based on the forgoing discussion of Al-MMCs and its relativecomparison with gray cast iron, the following conclusionscan be drawn.
(1) Mechanical properties are strongly affected by thecontent of TiB2 in Al-MMCs.
(2) Wear behavior gives a reasonable correlation withhardness, ultimate tensile strength, fracture strength,and strain hardening exponent of Al-MMCs. Therelationship between wear rate and mechanical prop-erties validates Archard’s equation.
(3) Wear rate decreases with increasing TiB2 content.

8 Advances in Tribology
00.0020.0040.0060.008
0.010.0120.0140.0160.018
0.02
136 137 138 139 140 141 142
Wea
rra
te(m
m3/m
)
Pure Al
Al-2.5% TiB2
Al-5% TiB2
K (MPa)
Figure 15: Effect of strengthening coefficient on wear rate ofcomposites.
Pure Al
Gray cast iron
Al-2.5% TiB2
Al-5% TiB2
y = 0.0878x2.4121
R2 = 0.9314
0
0.005
0.01
0.015
0.02
0 0.1 0.2 0.3 0.4 0.5
Wea
rra
te(m
m3/m
)
Strain hardening exponent (n)
Figure 16: Effect of strain hardening exponent on wear rate ofcomposites.
Acknowledgments
The authors thank the University Grant Commission, Indiafor providing financial support for this research. Thanks andappreciations are also extended to the Director, College ofEngineering, Pune, and VNIT Nagpur for providing SEMfacility.
References
[1] T. Zeuner, P. Stojanov, P. R. Sahm, H. Ruppert, and A.Engels, “Developing trends in disc brake technology for railapplication,” Materials Science and Technology, vol. 14, no. 9-10, pp. 857–863, 1998.
[2] R. Dwivedi, “Development of advanced reinforced aluminumbrake rotors,” SAE Technical Paper Series, vol. 104, no. 5, pp.159–166, 1995.
[3] S. C. Tjong, S. Q. Wu, and H. G. Zhu, “Wear behaviorof in situ TiB2·Al2O3/Al and TiB2·Al2O3/Al-Cu composites,”Composites Science and Technology, vol. 59, no. 9, pp. 1341–1347, 1999.
[4] A. R. Kennedy, A. E. Karantzalis, and S. M. Wyatt, “Themicrostructure and mechanical properties of TiC and TiB2-reinforced cast metal matrix composites,” Journal of MaterialsScience, vol. 34, no. 5, pp. 933–940, 1999.
[5] Y. Han, X. Liu, and X. Bian, “In situ TiB2 particulate reinforcednear eutectic Al-Si alloy composites,” Composites—Part A, vol.33, no. 3, pp. 439–444, 2002.
[6] M. J. Koczak and M. K. Premkumar, “Emerging technologiesfor the in-situ production of MMCs,” JOM, vol. 45, no. 1, pp.44–48, 1993.
[7] L. Shi, Y. Gu, L. Chen, Z. Yang, J. Ma, and Y. Qian, “A con-venient solid-state reaction route to nanocrystalline TiB2,”Composites, vol. 36, no. 2, pp. 1177–1187, 2005.
[8] F. C. Wang, Z. H. Zhang, J. Luo, C. C. Huang, and S. K. Lee,“A novel rapid route for in situ synthesizing TiB-TiB2 com-posites,” Composites Science and Technology, vol. 69, no. 15-16,pp. 2682–2687, 2009.
[9] D. G. Zhao, X. F. Liu, Y. C. Pan, X. F. Bian, and X. J. Liu,“Microstructure and mechanical properties of in situ synthe-sized (TiB2 + Al2O3)/Al-Cu composites,” Journal of MaterialsProcessing Technology, vol. 189, no. 1–3, pp. 237–241, 2007.
[10] A. Mandal, B. S. Murty, and M. Chakraborty, “Sliding wearbehaviour of T6 treated A356-TiB2 in-situ composites,” Wear,vol. 266, no. 7-8, pp. 865–872, 2009.
[11] S. Natarajan, R. Narayanasamy, S. P. Kumaresh Babu, G. Di-nesh, B. Anil Kumar, and K. Sivaprasad, “Sliding wear be-haviour of Al 6063/TiB2 in situ composites at elevated tem-peratures,” Materials and Design, vol. 30, no. 7, pp. 2521–2531,2009.
[12] G. Cueva, A. Sinatora, W. L. Guesser, and A. P. Tschiptschin,“Wear resistance of cast irons used in brake disc rotors,” Wear,vol. 255, no. 7–12, pp. 1256–1260, 2003.
[13] L. Lu, M. O. Lai, Y. Su, H. L. Teo, and C. F. Feng, “In situ TiB2
reinforced Al alloy composites,” Scripta Materialia, vol. 45, no.9, pp. 1017–1023, 2001.
[14] N. B. Dhokey, S. Ghule, K. Rane, and R.S. Ranade, “Effectof KBF4 and K2TiF6 on precipitation kinetics of TiB2 inaluminium matrix composite,” Journal of Advance MaterialLetters, vol. 2, no. 3, pp. 210–216, 2011.
[15] K. L. Tee, L. Lu, and M. O. Lai, “Improvement in mechanicalproperties of in-situ Al-TiB2 composite by incorporation ofcarbon,” Materials Science and Engineering A, vol. 339, no. 1-2,pp. 227–231, 2003.
[16] T. V. Christy, N. Murugan, and S. Kumar, “A comparativestudy on the microstructures and mechanical properties of Al6061 Alloy and the MMC Al 6061/TiB2,” Journal of Minerals& Materials Characterization & Engineering, vol. 9, no. 1, pp.57–65, 2010.
[17] S. Kumar, M. Chakraborty, V. Subramanya Sarma, and B. S.Murty, “Tensile and wear behaviour of in situ Al-7Si/TiB2
particulate composites,” Wear, vol. 265, no. 1-2, pp. 134–142,2008.
[18] S. C. Lim and M. F. Ashby, “Overview no. 55 Wear-Mechanismmaps,” Acta Metallurgica, vol. 35, no. 1, pp. 1–24, 1987.
[19] N. B. Dhokey and R. K. Paretkar, “Study of wear mechanismsin copper-based SiCp (20% by volume) reinforced composite,”Wear, vol. 265, no. 1-2, pp. 117–133, 2008.
[20] J. F. Archard, “Contact and rubbing of flat surfaces,” Journal ofApplied Physics, vol. 24, no. 8, pp. 981–988, 1953.
[21] A. L. Greer, K. L. Rutherford, and I. M. Hutchings, “Wear resis-tance of amorphous alloys and related materials,” InternationalMaterials Reviews, vol. 47, no. 2, pp. 87–112, 2002.
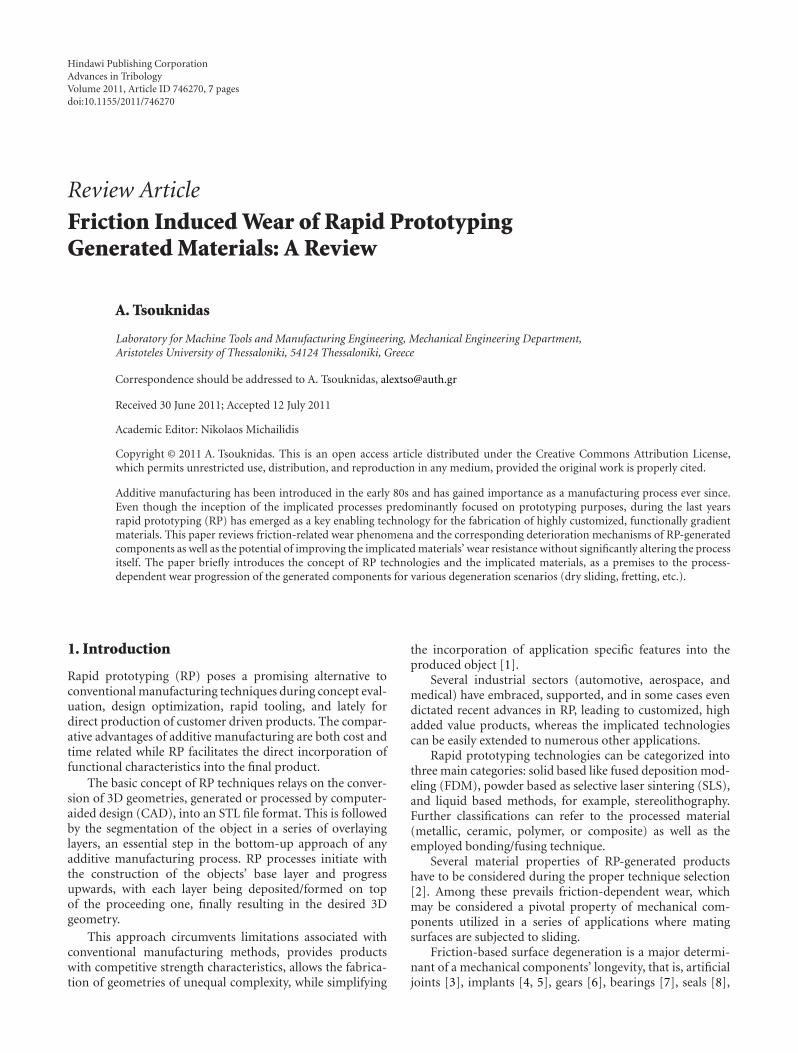
Hindawi Publishing CorporationAdvances in TribologyVolume 2011, Article ID 746270, 7 pagesdoi:10.1155/2011/746270
Review Article
Friction Induced Wear of Rapid PrototypingGenerated Materials: A Review
A. Tsouknidas
Laboratory for Machine Tools and Manufacturing Engineering, Mechanical Engineering Department,Aristoteles University of Thessaloniki, 54124 Thessaloniki, Greece
Correspondence should be addressed to A. Tsouknidas, [email protected]
Received 30 June 2011; Accepted 12 July 2011
Academic Editor: Nikolaos Michailidis
Copyright © 2011 A. Tsouknidas. This is an open access article distributed under the Creative Commons Attribution License,which permits unrestricted use, distribution, and reproduction in any medium, provided the original work is properly cited.
Additive manufacturing has been introduced in the early 80s and has gained importance as a manufacturing process ever since.Even though the inception of the implicated processes predominantly focused on prototyping purposes, during the last yearsrapid prototyping (RP) has emerged as a key enabling technology for the fabrication of highly customized, functionally gradientmaterials. This paper reviews friction-related wear phenomena and the corresponding deterioration mechanisms of RP-generatedcomponents as well as the potential of improving the implicated materials’ wear resistance without significantly altering the processitself. The paper briefly introduces the concept of RP technologies and the implicated materials, as a premises to the process-dependent wear progression of the generated components for various degeneration scenarios (dry sliding, fretting, etc.).
1. Introduction
Rapid prototyping (RP) poses a promising alternative toconventional manufacturing techniques during concept eval-uation, design optimization, rapid tooling, and lately fordirect production of customer driven products. The compar-ative advantages of additive manufacturing are both cost andtime related while RP facilitates the direct incorporation offunctional characteristics into the final product.
The basic concept of RP techniques relays on the conver-sion of 3D geometries, generated or processed by computer-aided design (CAD), into an STL file format. This is followedby the segmentation of the object in a series of overlayinglayers, an essential step in the bottom-up approach of anyadditive manufacturing process. RP processes initiate withthe construction of the objects’ base layer and progressupwards, with each layer being deposited/formed on topof the proceeding one, finally resulting in the desired 3Dgeometry.
This approach circumvents limitations associated withconventional manufacturing methods, provides productswith competitive strength characteristics, allows the fabrica-tion of geometries of unequal complexity, while simplifying
the incorporation of application specific features into theproduced object [1].
Several industrial sectors (automotive, aerospace, andmedical) have embraced, supported, and in some cases evendictated recent advances in RP, leading to customized, highadded value products, whereas the implicated technologiescan be easily extended to numerous other applications.
Rapid prototyping technologies can be categorized intothree main categories: solid based like fused deposition mod-eling (FDM), powder based as selective laser sintering (SLS),and liquid based methods, for example, stereolithography.Further classifications can refer to the processed material(metallic, ceramic, polymer, or composite) as well as theemployed bonding/fusing technique.
Several material properties of RP-generated productshave to be considered during the proper technique selection[2]. Among these prevails friction-dependent wear, whichmay be considered a pivotal property of mechanical com-ponents utilized in a series of applications where matingsurfaces are subjected to sliding.
Friction-based surface degeneration is a major determi-nant of a mechanical components’ longevity, that is, artificialjoints [3], implants [4, 5], gears [6], bearings [7], seals [8],

2 Advances in Tribology
and so forth, are primarily wear dependent, while their wearresistance is also strongly associated with the parts’ periodicalservice requirements.
Hitherto substantial contributions have been made onthe current state-of-the art rapid prototyping, manufactur-ing, and tooling techniques [9–12]. The tribological aspects;however, of RP-produced components have, to the best of theauthor’s knowledge, never been extensively documented.
2. Methods and Materials
2.1. RP Technologies. Friction-induced failure is consideredan important aspect during the material/process selectionof a suiting RP methodology. Furthermore, RP techniquesare extensively employed in clean room environments andthe medical sector where the release of wear particles andions is considered a significant sterility problem [13]. Recentadvances in RP technologies not only allow the fabricationof components able to withstand conventional sterilizationprocesses but also incorporate gamma-ray sterilization andsimilar techniques into their systems, allowing the directcommercial production of FDA-approved implants. Therelease of particles due to friction, during the componentsfunction, may arise this issues nonetheless, thus the wearresistance of these techniques has to be thoroughly consid-ered.
There exist a variety of more than 40 different RPtechnologies, which do, however, bare similar characteristicsand are alike in concept. Selective laser sintering (SLS)is an RP technique utilizing a laser beam to fuse smallmaterial particles into a 3-dimensional shape. The laserscans a predefined contour on the surface of a powder bed,which is consecutively lowered by a one-layer thickness, onlyto be covered by the powdered material, which is reap-plied on top of the sintered cross-section, as schematicallypresented in Figure 1. This process is repeated until thecomplete fabrication of the desired 3D geometry. Virtuallyany material that can be powdered, plastic, polymer, ceramic,metals or even composites can be fused, employing SLStechnologies [14, 15]. The limitations of the method areassociated with the thermal properties of the commissionedpowder, which must maintain its integrity and not com-pletely decompose once the laser is applied. Selective lasermelting (SLM) is a recent alterative to the SLS process,which relies on the complete melting of the powderedmaterials.
Fused deposition modeling (FDM) is another widelyapplied RP process [10, 16] based on materials exhibitinga low melting point even though harder materials can alsobe employed [17]. In this context polymers or plasticsare utilized as the main material matrix, which can bereinforced, by metallic fibers or ceramic fillers. The finalthermosoftening powder is guided through a heated nozzleand deposited through the extrusion head as a partiallyliquefied (semisolid) wire, as demonstrated in Figure 2. TheCNC-controlled nozzle follows the desired tool-path, definedby a specific slice of the CAD file, gradually structuring thedesired object.
Powder bed
Build platform
Refilling powder
Proceduredetail
Laserbeam
Scannedarea
Sinteredvolume
Scanning system
Laser beam
Figure 1: Selective laser sintering process.
This review will focus on the wear development and therelated wear mechanisms of FDM-produced polymeric andbinary polymer-ceramic composites [18, 19] as well as SLS-and SLM-fabricated metallic parts ranging from stainless andtool steels to Ti and Co alloys [15, 20].
2.2. Fretting Wear Test. Fretting wear, refers to the friction-based interfacial damage of a component pressed againsta repetitive tangential vibrating countersurface. This oscil-latory motion is usually defined by small displacementamplitudes [21, 22], during which the specimen is fixedand the counter-surface is subjected to a linearly vibratingmotion (see Figure 3), or vice versa.
The concept of fretting replicates the friction-based wearof a series of RP applications, accurately mimicking theirmechanical behavior. Artificial joints, hip implants, andseveral other RP-fabricated components are especially proneto friction fatigue, drastically reducing their life expectancy[23, 24].
Even though fretting results in complex wear mecha-nisms, there is a consensus throughout literature concerningthe existence of three major fretting modes: fretting wear[25, 26], fretting fatigue, and fretting corrosion [27].
A dominating phenomenon in fretting is the so-called“third body effect” exerted by the entrapment of materialdebris within the sliding interface due to the minute relativedisplacements of the two counterbodies [28]. This materialresponse, provides composites with their exceptional wearproperties, as their coefficient of friction drastically altersdue to this in situ lubricant effect, exerted by the formation

Advances in Tribology 3
Produced part
Extrusionnozzle
Heated extrusion head
Thermoplastic material
Buildplatform
Figure 2: Fused deposition modeling process.
Counterbody
Specimen
Agglomerated debrisF
Figure 3: Fretting concept—third body effect.
of an inhomogeneous transfer layer mainly consisting ofparticles with higher wear resistance [29, 30].
2.3. Tribometer Friction Tests. The determination of amaterials dry sliding wear characteristics is conventionallyconducted by means of pin-on-disc (POD) arrangements, asillustrated in Figure 4, and in correspondence to the ASTMG99-04 [31] standard. POD tests are based on a simplifiedsliding concept, were the accumulation of wear debris israther insignificant and thermal degeneration less likely toaffect the wear progression when compared to fretting.
During POD experiments, a pin-like specimen is pressedagainst a sliding counter-surface by the application of adead weight. The counter-surface is usually composed of ametallic disc rotating at a constant velocity and possessing aspecific roughness value (Ra), which is considered a criticalfactor [32, 33]. The examined specimens must be polishedthoroughly (by grit emery paper) to ensure the uniformand axial contact of their surface to the disc and reduce
Counterbody
F1
F2
F3
F
Pin
F1 < F2 < F3
Breakin phase
Wei
ght
loss
(mg)
Sliding distance (m)
Figure 4: Pin-on-disc concept—break in phase.
the so called “break in phase,” encountered during the initialsliding period, were foreign materials are removed from thecontacting surfaces and a complete contact of the counter-bodies is established [18].
3. Friction and Wear Behavior
3.1. Effect of the Materials’ Strength Properties. Although itwould be anticipated that the material strength propertiesexert a vital role on the wear behavior of the RP-fabricatedmaterials, existing research states otherwise, as presentedin Figure 5. It has been documented that Ti and Co-alloysexhibit increased (by more than two magnitudes) wear ratesduring fretting when compared to stainless steels, whichare far more ductile [15]. The same tendency is observedwhen comparing SLS/SLM iron-based materials with milledtool steels, which possess higher strength properties, para-doxically the SLS/SLM materials demonstrate superior wearcharacteristics [15]. Laser sintered Mo-WC MMC’s have alsobeen reported to exhibited better abrasive wear resistancewhen compared to the base metal [34]. Even when comparedto conventional sintering, SLS is capable of producingiron-graphite components with substantially different wearproperties [35].
A similar material response has been observed in FDM-produced materials, where hardness cannot be considered asan indicator of wear resistance [18].
3.2. Effect of Reinforcement. Even though the materialstrength properties cannot be directly correlated to the wearresistance of RP-produced components, the enslavement ofthe materials’ wear progression to the presence of a reinforce-ment phase has been well documented (see Figure 5).
The dispersion of hard particles like silicon carbidewithin a laser sintered iron matrix has a clear effect on theresulting composite’s wear rates during dry sliding, as thisresults in an increased coefficient of friction. Wear volumes,however, tend to decrease drastically with an augmentationof the w/w% silicon carbide content [36]. This behavior canbe attributed to onset adhesive processes such as scuffing [37]while improving the components wear and seizure resistance.
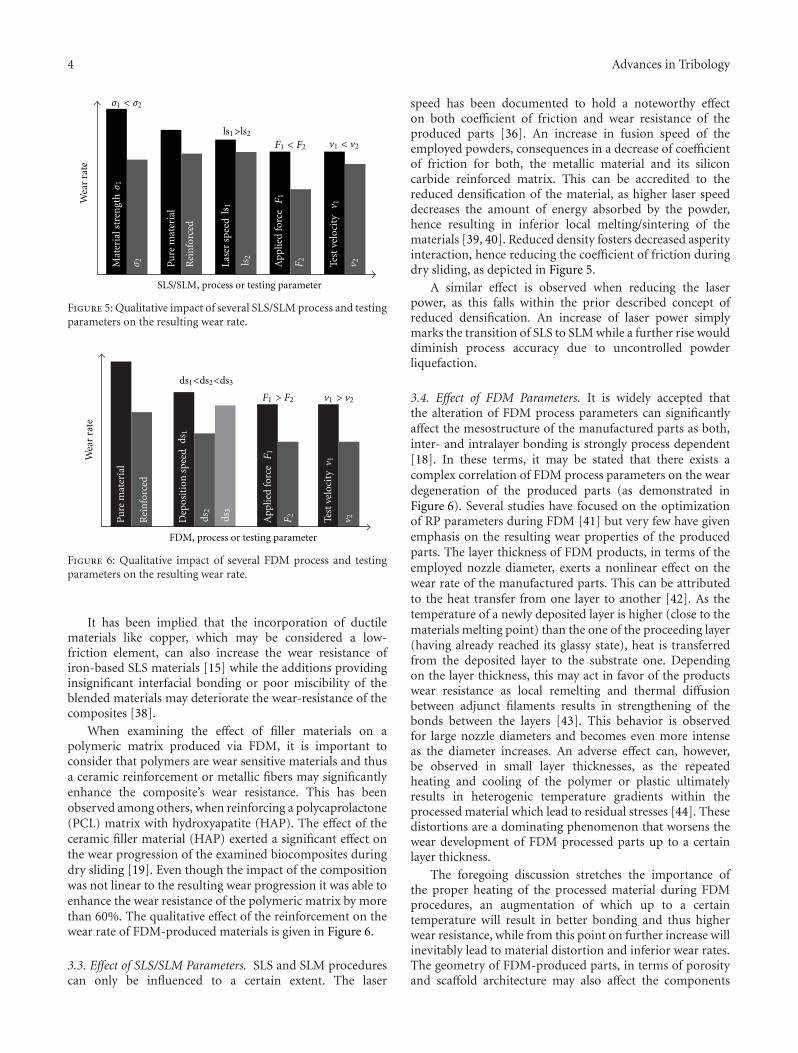
4 Advances in Tribology
Wea
rra
te
SLS/SLM, process or testing parameterA
pplie
dfo
rce
F1
Test
velo
city
v 1
Rei
nfo
rced
Pu
rem
ater
ial
σ 2Mat
eria
lstr
engt
hσ 1
v 2
σ1 < σ2
F1 < F2 v1 < v2
F2Las
ersp
eed
ls1>ls2
ls1
ls2
Figure 5: Qualitative impact of several SLS/SLM process and testingparameters on the resulting wear rate.
Wea
rra
te
FDM, process or testing parameter
Rei
nfo
rced
Pu
rem
ater
ial
Dep
osit
ion
spee
d
F1 > F2 v1 > v2
App
lied
forc
eF
1
Test
velo
city
v 1
v 2F2
ds1<ds2<ds3
ds1
ds2
ds3
Figure 6: Qualitative impact of several FDM process and testingparameters on the resulting wear rate.
It has been implied that the incorporation of ductilematerials like copper, which may be considered a low-friction element, can also increase the wear resistance ofiron-based SLS materials [15] while the additions providinginsignificant interfacial bonding or poor miscibility of theblended materials may deteriorate the wear-resistance of thecomposites [38].
When examining the effect of filler materials on apolymeric matrix produced via FDM, it is important toconsider that polymers are wear sensitive materials and thusa ceramic reinforcement or metallic fibers may significantlyenhance the composite’s wear resistance. This has beenobserved among others, when reinforcing a polycaprolactone(PCL) matrix with hydroxyapatite (HAP). The effect of theceramic filler material (HAP) exerted a significant effect onthe wear progression of the examined biocomposites duringdry sliding [19]. Even though the impact of the compositionwas not linear to the resulting wear progression it was able toenhance the wear resistance of the polymeric matrix by morethan 60%. The qualitative effect of the reinforcement on thewear rate of FDM-produced materials is given in Figure 6.
3.3. Effect of SLS/SLM Parameters. SLS and SLM procedurescan only be influenced to a certain extent. The laser
speed has been documented to hold a noteworthy effecton both coefficient of friction and wear resistance of theproduced parts [36]. An increase in fusion speed of theemployed powders, consequences in a decrease of coefficientof friction for both, the metallic material and its siliconcarbide reinforced matrix. This can be accredited to thereduced densification of the material, as higher laser speeddecreases the amount of energy absorbed by the powder,hence resulting in inferior local melting/sintering of thematerials [39, 40]. Reduced density fosters decreased asperityinteraction, hence reducing the coefficient of friction duringdry sliding, as depicted in Figure 5.
A similar effect is observed when reducing the laserpower, as this falls within the prior described concept ofreduced densification. An increase of laser power simplymarks the transition of SLS to SLM while a further rise woulddiminish process accuracy due to uncontrolled powderliquefaction.
3.4. Effect of FDM Parameters. It is widely accepted thatthe alteration of FDM process parameters can significantlyaffect the mesostructure of the manufactured parts as both,inter- and intralayer bonding is strongly process dependent[18]. In these terms, it may be stated that there exists acomplex correlation of FDM process parameters on the weardegeneration of the produced parts (as demonstrated inFigure 6). Several studies have focused on the optimizationof RP parameters during FDM [41] but very few have givenemphasis on the resulting wear properties of the producedparts. The layer thickness of FDM products, in terms of theemployed nozzle diameter, exerts a nonlinear effect on thewear rate of the manufactured parts. This can be attributedto the heat transfer from one layer to another [42]. As thetemperature of a newly deposited layer is higher (close to thematerials melting point) than the one of the proceeding layer(having already reached its glassy state), heat is transferredfrom the deposited layer to the substrate one. Dependingon the layer thickness, this may act in favor of the productswear resistance as local remelting and thermal diffusionbetween adjunct filaments results in strengthening of thebonds between the layers [43]. This behavior is observedfor large nozzle diameters and becomes even more intenseas the diameter increases. An adverse effect can, however,be observed in small layer thicknesses, as the repeatedheating and cooling of the polymer or plastic ultimatelyresults in heterogenic temperature gradients within theprocessed material which lead to residual stresses [44]. Thesedistortions are a dominating phenomenon that worsens thewear development of FDM processed parts up to a certainlayer thickness.
The foregoing discussion stretches the importance ofthe proper heating of the processed material during FDMprocedures, an augmentation of which up to a certaintemperature will result in better bonding and thus higherwear resistance, while from this point on further increase willinevitably lead to material distortion and inferior wear rates.The geometry of FDM-produced parts, in terms of porosityand scaffold architecture may also affect the components
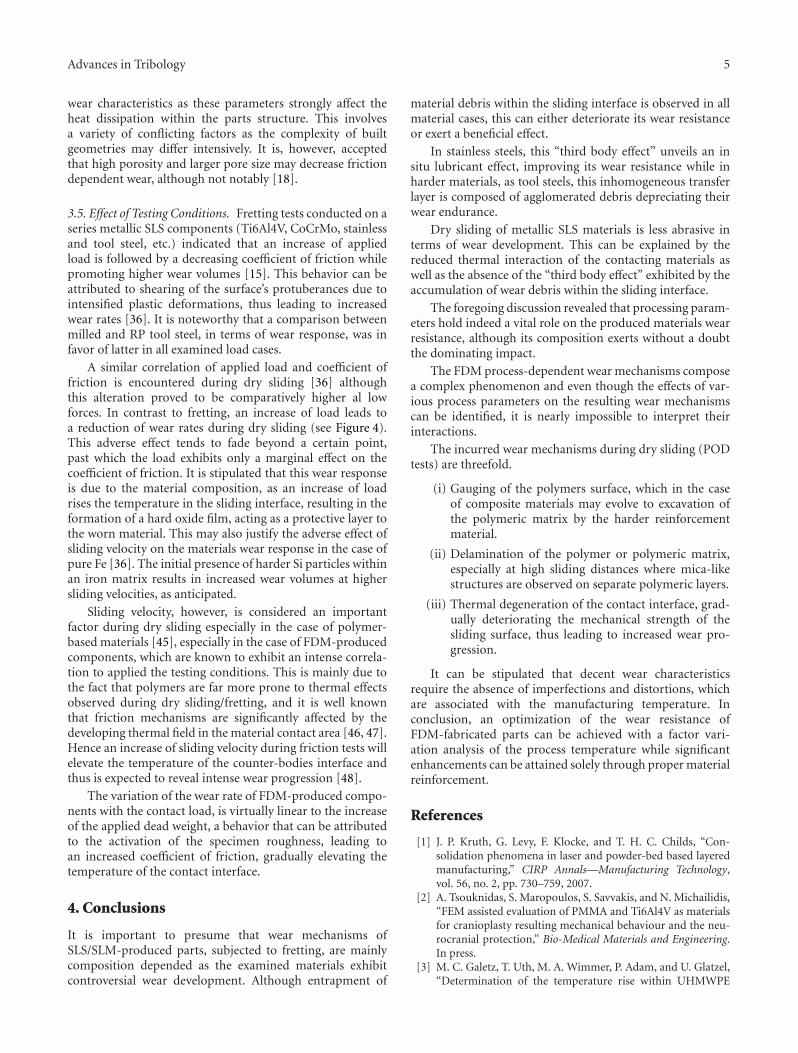
Advances in Tribology 5
wear characteristics as these parameters strongly affect theheat dissipation within the parts structure. This involvesa variety of conflicting factors as the complexity of builtgeometries may differ intensively. It is, however, acceptedthat high porosity and larger pore size may decrease frictiondependent wear, although not notably [18].
3.5. Effect of Testing Conditions. Fretting tests conducted on aseries metallic SLS components (Ti6Al4V, CoCrMo, stainlessand tool steel, etc.) indicated that an increase of appliedload is followed by a decreasing coefficient of friction whilepromoting higher wear volumes [15]. This behavior can beattributed to shearing of the surface’s protuberances due tointensified plastic deformations, thus leading to increasedwear rates [36]. It is noteworthy that a comparison betweenmilled and RP tool steel, in terms of wear response, was infavor of latter in all examined load cases.
A similar correlation of applied load and coefficient offriction is encountered during dry sliding [36] althoughthis alteration proved to be comparatively higher al lowforces. In contrast to fretting, an increase of load leads toa reduction of wear rates during dry sliding (see Figure 4).This adverse effect tends to fade beyond a certain point,past which the load exhibits only a marginal effect on thecoefficient of friction. It is stipulated that this wear responseis due to the material composition, as an increase of loadrises the temperature in the sliding interface, resulting in theformation of a hard oxide film, acting as a protective layer tothe worn material. This may also justify the adverse effect ofsliding velocity on the materials wear response in the case ofpure Fe [36]. The initial presence of harder Si particles withinan iron matrix results in increased wear volumes at highersliding velocities, as anticipated.
Sliding velocity, however, is considered an importantfactor during dry sliding especially in the case of polymer-based materials [45], especially in the case of FDM-producedcomponents, which are known to exhibit an intense correla-tion to applied the testing conditions. This is mainly due tothe fact that polymers are far more prone to thermal effectsobserved during dry sliding/fretting, and it is well knownthat friction mechanisms are significantly affected by thedeveloping thermal field in the material contact area [46, 47].Hence an increase of sliding velocity during friction tests willelevate the temperature of the counter-bodies interface andthus is expected to reveal intense wear progression [48].
The variation of the wear rate of FDM-produced compo-nents with the contact load, is virtually linear to the increaseof the applied dead weight, a behavior that can be attributedto the activation of the specimen roughness, leading toan increased coefficient of friction, gradually elevating thetemperature of the contact interface.
4. Conclusions
It is important to presume that wear mechanisms ofSLS/SLM-produced parts, subjected to fretting, are mainlycomposition depended as the examined materials exhibitcontroversial wear development. Although entrapment of
material debris within the sliding interface is observed in allmaterial cases, this can either deteriorate its wear resistanceor exert a beneficial effect.
In stainless steels, this “third body effect” unveils an insitu lubricant effect, improving its wear resistance while inharder materials, as tool steels, this inhomogeneous transferlayer is composed of agglomerated debris depreciating theirwear endurance.
Dry sliding of metallic SLS materials is less abrasive interms of wear development. This can be explained by thereduced thermal interaction of the contacting materials aswell as the absence of the “third body effect” exhibited by theaccumulation of wear debris within the sliding interface.
The foregoing discussion revealed that processing param-eters hold indeed a vital role on the produced materials wearresistance, although its composition exerts without a doubtthe dominating impact.
The FDM process-dependent wear mechanisms composea complex phenomenon and even though the effects of var-ious process parameters on the resulting wear mechanismscan be identified, it is nearly impossible to interpret theirinteractions.
The incurred wear mechanisms during dry sliding (PODtests) are threefold.
(i) Gauging of the polymers surface, which in the caseof composite materials may evolve to excavation ofthe polymeric matrix by the harder reinforcementmaterial.
(ii) Delamination of the polymer or polymeric matrix,especially at high sliding distances where mica-likestructures are observed on separate polymeric layers.
(iii) Thermal degeneration of the contact interface, grad-ually deteriorating the mechanical strength of thesliding surface, thus leading to increased wear pro-gression.
It can be stipulated that decent wear characteristicsrequire the absence of imperfections and distortions, whichare associated with the manufacturing temperature. Inconclusion, an optimization of the wear resistance ofFDM-fabricated parts can be achieved with a factor vari-ation analysis of the process temperature while significantenhancements can be attained solely through proper materialreinforcement.
References
[1] J. P. Kruth, G. Levy, F. Klocke, and T. H. C. Childs, “Con-solidation phenomena in laser and powder-bed based layeredmanufacturing,” CIRP Annals—Manufacturing Technology,vol. 56, no. 2, pp. 730–759, 2007.
[2] A. Tsouknidas, S. Maropoulos, S. Savvakis, and N. Michailidis,“FEM assisted evaluation of PMMA and Ti6Al4V as materialsfor cranioplasty resulting mechanical behaviour and the neu-rocranial protection,” Bio-Medical Materials and Engineering.In press.
[3] M. C. Galetz, T. Uth, M. A. Wimmer, P. Adam, and U. Glatzel,“Determination of the temperature rise within UHMWPE
6 Advances in Tribology
tibial components during tribological loading,” Acta Bioma-terialia, vol. 6, no. 2, pp. 552–562, 2010.
[4] G. Bergmann, F. Graichen, A. Rohlmann, N. Verdonschot, andG. H. van Lenthe, “Frictional heating of total hip implants,part 1: measurements in patients,” Journal of Biomechanics,vol. 34, no. 4, pp. 421–428, 2001.
[5] G. Bergmann, F. Graichen, A. Rohlmann, N. Verdonschot, andG. H. van Lenthe, “Frictional heating of total hip implants.Part 2: finite element study,” Journal of Biomechanics, vol. 34,no. 4, pp. 429–435, 2001.
[6] S. He, S. Cho, and R. Singh, “Prediction of dynamic frictionforces in spur gears using alternate sliding friction formula-tions,” Journal of Sound and Vibration, vol. 309, no. 3–5, pp.843–851, 2008.
[7] T. Cousseau, B. Graca, A. Campos, and J. Seabra, “Frictiontorque in grease lubricated thrust ball bearings,” TribologyInternational, vol. 44, no. 5, pp. 523–531, 2011.
[8] X. Q. Yu, S. He, and R. L. Cai, “Frictional characteristics ofmechanical seals with a laser-textured seal face,” Journal ofMaterials Processing Technology, vol. 129, no. 1–3, pp. 463–466,2002.
[9] C. M. Cheah, C. K. Chua, C. W. Lee, C. Feng, and K.Totong, “Rapid prototyping and tooling techniques: a reviewof applications for rapid investment casting,” InternationalJournal of Advanced Manufacturing Technology, vol. 25, no. 3-4, pp. 308–320, 2005.
[10] G. N. Levy, R. Schindel, and J. P. Kruth, “Rapid manufacturingand rapid tooling with layer manufacturing (LM) technolo-gies, state of the art and future perspectives,” CIRP Annals—Manufacturing Technology, vol. 52, no. 2, pp. 589–609, 2003.
[11] S. M. Peltola, F. P. W. Melchels, D. W. Grijpma, and M.Kellomaki, “A review of rapid prototyping techniques fortissue engineering purposes,” Annals of Medicine, vol. 40, no.4, pp. 268–280, 2008.
[12] J. Winder and R. Bibb, “Medical rapid prototyping technolo-gies: state of the art and current limitations for application inoral and maxillofacial surgery,” Journal of Oral and Maxillofa-cial Surgery, vol. 63, no. 7, pp. 1006–1015, 2005.
[13] E. Sachlos and J. T. Czernuszka, “Making tissue engineeringscaffolds work. Review on the application ofsolid freeformfabrication technology to the production of tissue engineeringscaffolds,” European Cells and Materials, vol. 5, pp. 29–40,2003.
[14] J. M. Williams, A. Adewunmi, R. M. Schek et al., “Bonetissue engineering using polycaprolactone scaffolds fabricatedvia selective laser sintering,” Biomaterials, vol. 26, no. 23, pp.4817–4827, 2005.
[15] S. Kumar and J. P. Kruth, “Wear performance of SLS/SLMmaterials,” Advanced Engineering Materials, vol. 10, no. 8, pp.1–4, 2008.
[16] A. Rosochowski and A. Matuszak, “Rapid tooling: the state ofthe art,” Journal of Materials Processing Technology, vol. 106,no. 1–3, pp. 191–198, 2000.
[17] J. P. Li, J. R. de Wijn, C. A. van Blitterswijk, and K. de Groot,“The effect of scaffold architecture on properties of direct 3Dfiber deposition of porous Ti6Al4V for orthopedic implants,”Journal of Biomedical Materials Research—Part A, vol. 92, no.1, pp. 33–42, 2010.
[18] A. Equbal, A. K. Sood, V. Toppo, R. K. Ohdar, and S. S. Maha-patra, “Prediction and analysis of sliding wear performanceof fused deposition modelling-processed ABS plastic parts,”Proceedings of the Institution of Mechanical Engineers Part J, vol.224, no. 12, pp. 1261–1271, 2010.
[19] A. Tsouknidas, D. Kountouras, S. Maropoulos, N. Kiratzis,and N. Michalilidis, “Tribological, mechanical and physi-cal characterization of hydroxyapatite/polycarpolactone bio-composites,” Journal of the Balkan Tribological Association. Inpress.
[20] S. Kumar, J. P. Kurth, J. van Humbeeck, and A. Voet, “A studyof degeneration of laser sintered moulds using wear tests,”Rapid Prototyping Journal, vol. 15, no. 2, pp. 104–110, 2009.
[21] R. C. Bill, “Review of factors that influence fretting wear,” inMaterials Evaluation Under Fretting Conditions, ASTM STP780, S. R. Brown, Ed., pp. 165–181, ASTM, Philadelphia, Pa,USA, 1982.
[22] R. B. Waterhouse, “Fretting fatigue,” International Journal ofFatigue, vol. 37, no. 2, pp. 77–97, 1992.
[23] M. Niinomi, “Mechanical biocompatibilities of titanium alloysfor biomedical applications,” Journal of the Mechanical Behav-ior of Biomedical Materials, vol. 1, no. 1, pp. 30–42, 2008.
[24] P. Schaaff, “The role of fretting damage in total hip arthro-plasty with modular design hip joints -evaluation of retrievalstudies and experimental simulation methods,” Journal ofApplied Biomaterials & Biomechanics, vol. 2, no. 3, pp. 121–135, 2004.
[25] Y. Berthier, L. Vincent, and M. Godet, “Fretting fatigue andfretting wear,” Tribology International, vol. 22, no. 4, pp. 235–242, 1989.
[26] S. Fouvry, P. Kapsa, and L. Vincent, “Fretting-wear andfretting-fatigue: relation through a mapping concept,” inFretting Fatigue: Current Technology and Practices, ASTM STP1367, D. W. Hoeppner, V. Chandrasekaran, and C. B. Elliott,Eds., pp. 49–64, ASTM, West Conshohocken, Pa, USA, 2000.
[27] V. Chandrasekaran, W. L. Sauer, A. M. Taylor, and D. W.Hoeppner, “Evaluation of the fretting corrosion behavior ofthe proximal pad taper of a modular hip design,” Wear, vol.231, no. 1, pp. 54–64, 1999.
[28] M. Varenberg, G. Halperin, and I. Etsion, “Different aspectsof the role of wear debris in fretting wear,” Wear, vol. 252, no.11-12, pp. 902–910, 2002.
[29] E. Rabinowicz, Compatibility Criteria for Sliding Metals inFriction and Lubrication in Metal Processing, ASME, New York,NY, USA, 1996.
[30] F. P. Bowden and D. Tabor, “The influence of surface finishon the friction and deformation of surfaces in properties ofmetallic surfaces,” Journal Institute of Metals, pp. 197–212,1953.
[31] ASTM G99-04: Standard Test Method for Wear Testing with aPin-on-Disk Apparatus, ASTM International.
[32] T. C. Ovaert and H. S. Cheng, “Counterface topograph-ical effects on the wear of polyetheretherketone and apolyetheretherketone-carbon fiber composite,” Wear, vol. 150,no. 1-2, pp. 275–287, 1991.
[33] D. Dowson, S. Taheri, and N. C. Wallbridge, “The role ofcounterface imperfections in the wear of polyethylene,” Wear,vol. 119, no. 3, pp. 277–293, 1987.
[34] P. H. Chong, H. C. Man, and T. M. Yue, “Microstructureand wear properties of laser surface-cladded Mo-WC MMCon AA6061 aluminum alloy,” Surface and Coatings Technology,vol. 145, no. 1–3, pp. 51–59, 2001.
[35] K. Murali, A. N. Chatterjee, P. Saha et al., “Direct selectivelaser sintering of iron-graphite powder mixture,” Journal ofMaterials Processing Technology, vol. 136, no. 1–3, pp. 179–185,2003.
[36] C. S. Ramesh and C. K. Srinivas, “Friction and wear behaviorof laser-sintered iron-silicon carbide composites,” Journal of

Advances in Tribology 7
Materials Processing Technology, vol. 209, no. 14, pp. 5429–5436, 2009.
[37] C. S. Ramesh, S. K. Seshadri, and K. J. L. Iyer, “A survey ofaspects of wear of metals,” Indian Journal of Technology, vol.29, no. 4, pp. 179–185, 1991.
[38] N. Saka and D. P. Karalekas, “Friction and wear of particlereinforced metal ceramic composites,” in Proceedings of theConference on Wear of Materials, pp. 784–793, ASME, NewYork, NY, USA, 1985.
[39] A. Simchi, F. Petzoldt, and H. Pohl, “Direct metal lasersintering: material considerations and mechanisms of particlebonding,” International Journal of Powder Metallurgy, vol. 37,no. 2, pp. 49–61, 2001.
[40] A. Simchi and H. Pohl, “Effects of laser sintering processingparameters on the microstructure and densification of ironpowder,” Materials Science and Engineering A, vol. 359, no. 1-2,pp. 119–128, 2003.
[41] B. H. Lee, J. Abdullah, and Z. A. Khan, “Optimization of rapidprototyping parameters for production of flexible ABS object,”Journal of Materials Processing Technology, vol. 169, no. 1, pp.54–61, 2005.
[42] A. K. Sood, R. K. Ohdar, and S. S. Mahapatra, “Parametricappraisal of fused deposition modelling process using the greyTaguchi method,” Proceedings of the Institution of MechanicalEngineers Part J, vol. 224, no. B1, pp. 135–145, 2010.
[43] Q. Sun, G. M. Rizvi, C. T. Bellehumeur, and P. Gu, “Effect ofprocessing conditions on the bonding quality of FDM polymerfilaments,” Rapid Prototyping Journal, vol. 14, no. 2, pp. 72–80,2008.
[44] A. K. Sood, R. K. Ohdar, and S. S. Mahapatra, “Parametricappraisal of mechanical property of fused deposition mod-elling processed parts,” Materials and Design, vol. 31, no. 1,pp. 287–295, 2010.
[45] K. Friedrich, Z. Zhang, and P. Klein, “Wear of polymercomposites,” Wear Material Mechanisms and Practice, pp. 269–287, 2005.
[46] G. Wrobel and M. Szymiczek, “Influence of temperature onfriction coefficient of low density polyethylene,” Journal ofAchievements in Materials and Manufacturing Engineering, vol.28, no. 1, pp. 31–34, 2008.
[47] D. Shakhvorostov, K. Pohlmann, and M. Scherge, “An ener-getic approach to friction, wear and temperature,” Wear, vol.257, no. 1-2, pp. 124–130, 2004.
[48] T. Nakahara, S. Momozono, and A. O. Rui, “Effect of surfacetemperature rise on friction characteristics for sliding speedunder unlubricated condition,” Proceedings of the Institution ofMechanical Engineers Part J, vol. 224, no. 3, pp. 271–278, 2010.
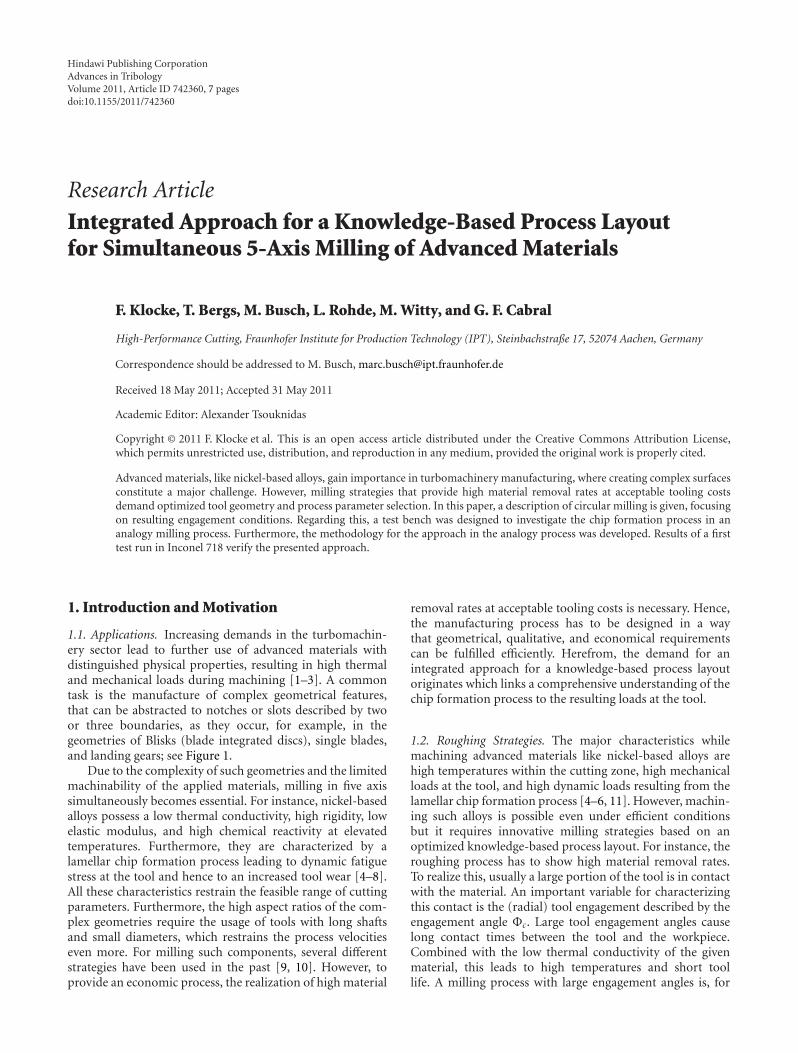
Hindawi Publishing CorporationAdvances in TribologyVolume 2011, Article ID 742360, 7 pagesdoi:10.1155/2011/742360
Research Article
Integrated Approach for a Knowledge-Based Process Layoutfor Simultaneous 5-Axis Milling of Advanced Materials
F. Klocke, T. Bergs, M. Busch, L. Rohde, M. Witty, and G. F. Cabral
High-Performance Cutting, Fraunhofer Institute for Production Technology (IPT), Steinbachstraße 17, 52074 Aachen, Germany
Correspondence should be addressed to M. Busch, [email protected]
Received 18 May 2011; Accepted 31 May 2011
Academic Editor: Alexander Tsouknidas
Copyright © 2011 F. Klocke et al. This is an open access article distributed under the Creative Commons Attribution License,which permits unrestricted use, distribution, and reproduction in any medium, provided the original work is properly cited.
Advanced materials, like nickel-based alloys, gain importance in turbomachinery manufacturing, where creating complex surfacesconstitute a major challenge. However, milling strategies that provide high material removal rates at acceptable tooling costsdemand optimized tool geometry and process parameter selection. In this paper, a description of circular milling is given, focusingon resulting engagement conditions. Regarding this, a test bench was designed to investigate the chip formation process in ananalogy milling process. Furthermore, the methodology for the approach in the analogy process was developed. Results of a firsttest run in Inconel 718 verify the presented approach.
1. Introduction and Motivation
1.1. Applications. Increasing demands in the turbomachin-ery sector lead to further use of advanced materials withdistinguished physical properties, resulting in high thermaland mechanical loads during machining [1–3]. A commontask is the manufacture of complex geometrical features,that can be abstracted to notches or slots described by twoor three boundaries, as they occur, for example, in thegeometries of Blisks (blade integrated discs), single blades,and landing gears; see Figure 1.
Due to the complexity of such geometries and the limitedmachinability of the applied materials, milling in five axissimultaneously becomes essential. For instance, nickel-basedalloys possess a low thermal conductivity, high rigidity, lowelastic modulus, and high chemical reactivity at elevatedtemperatures. Furthermore, they are characterized by alamellar chip formation process leading to dynamic fatiguestress at the tool and hence to an increased tool wear [4–8].All these characteristics restrain the feasible range of cuttingparameters. Furthermore, the high aspect ratios of the com-plex geometries require the usage of tools with long shaftsand small diameters, which restrains the process velocitieseven more. For milling such components, several differentstrategies have been used in the past [9, 10]. However, toprovide an economic process, the realization of high material
removal rates at acceptable tooling costs is necessary. Hence,the manufacturing process has to be designed in a waythat geometrical, qualitative, and economical requirementscan be fulfilled efficiently. Herefrom, the demand for anintegrated approach for a knowledge-based process layoutoriginates which links a comprehensive understanding of thechip formation process to the resulting loads at the tool.
1.2. Roughing Strategies. The major characteristics whilemachining advanced materials like nickel-based alloys arehigh temperatures within the cutting zone, high mechanicalloads at the tool, and high dynamic loads resulting from thelamellar chip formation process [4–6, 11]. However, machin-ing such alloys is possible even under efficient conditionsbut it requires innovative milling strategies based on anoptimized knowledge-based process layout. For instance, theroughing process has to show high material removal rates.To realize this, usually a large portion of the tool is in contactwith the material. An important variable for characterizingthis contact is the (radial) tool engagement described by theengagement angle Φc. Large tool engagement angles causelong contact times between the tool and the workpiece.Combined with the low thermal conductivity of the givenmaterial, this leads to high temperatures and short toollife. A milling process with large engagement angles is, for
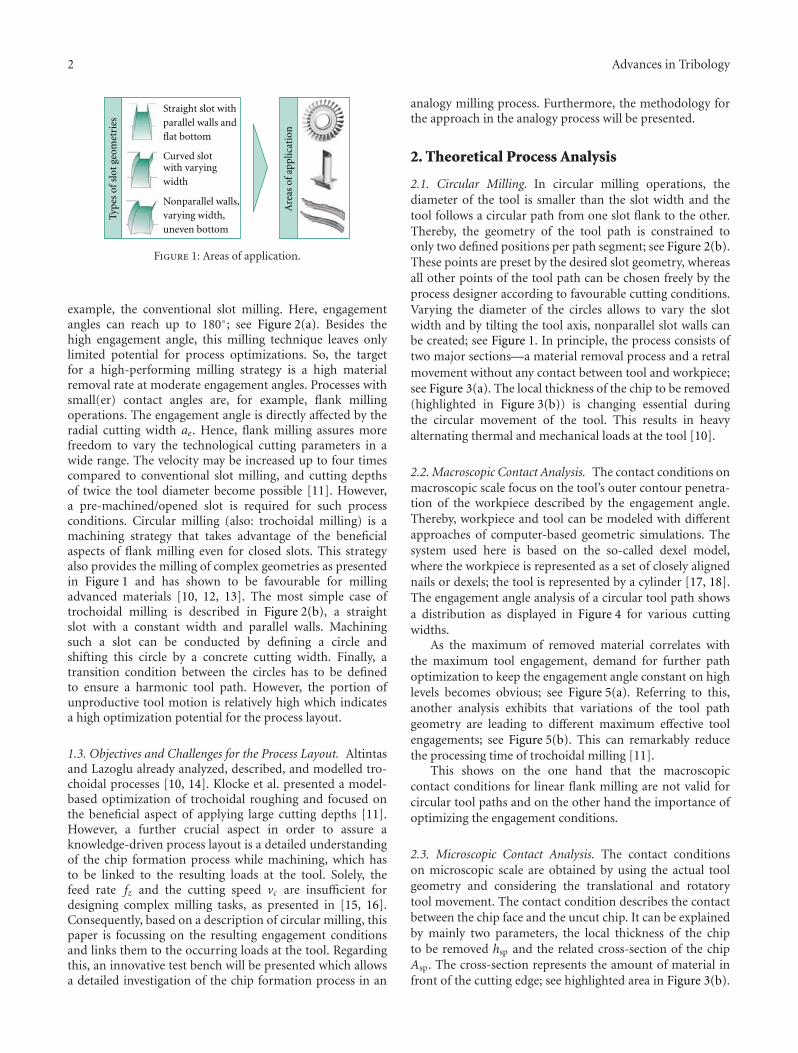
2 Advances in Tribology
Straight slot withparallel walls andflat bottom
Nonparallel walls,varying width,uneven bottom
Curved slotwith varyingwidth
Are
asof
appl
icat
ion
Type
sof
slot
geom
etri
es
Figure 1: Areas of application.
example, the conventional slot milling. Here, engagementangles can reach up to 180◦; see Figure 2(a). Besides thehigh engagement angle, this milling technique leaves onlylimited potential for process optimizations. So, the targetfor a high-performing milling strategy is a high materialremoval rate at moderate engagement angles. Processes withsmall(er) contact angles are, for example, flank millingoperations. The engagement angle is directly affected by theradial cutting width ae. Hence, flank milling assures morefreedom to vary the technological cutting parameters in awide range. The velocity may be increased up to four timescompared to conventional slot milling, and cutting depthsof twice the tool diameter become possible [11]. However,a pre-machined/opened slot is required for such processconditions. Circular milling (also: trochoidal milling) is amachining strategy that takes advantage of the beneficialaspects of flank milling even for closed slots. This strategyalso provides the milling of complex geometries as presentedin Figure 1 and has shown to be favourable for millingadvanced materials [10, 12, 13]. The most simple case oftrochoidal milling is described in Figure 2(b), a straightslot with a constant width and parallel walls. Machiningsuch a slot can be conducted by defining a circle andshifting this circle by a concrete cutting width. Finally, atransition condition between the circles has to be definedto ensure a harmonic tool path. However, the portion ofunproductive tool motion is relatively high which indicatesa high optimization potential for the process layout.
1.3. Objectives and Challenges for the Process Layout. Altintasand Lazoglu already analyzed, described, and modelled tro-choidal processes [10, 14]. Klocke et al. presented a model-based optimization of trochoidal roughing and focused onthe beneficial aspect of applying large cutting depths [11].However, a further crucial aspect in order to assure aknowledge-driven process layout is a detailed understandingof the chip formation process while machining, which hasto be linked to the resulting loads at the tool. Solely, thefeed rate fz and the cutting speed vc are insufficient fordesigning complex milling tasks, as presented in [15, 16].Consequently, based on a description of circular milling, thispaper is focussing on the resulting engagement conditionsand links them to the occurring loads at the tool. Regardingthis, an innovative test bench will be presented which allowsa detailed investigation of the chip formation process in an
analogy milling process. Furthermore, the methodology forthe approach in the analogy process will be presented.
2. Theoretical Process Analysis
2.1. Circular Milling. In circular milling operations, thediameter of the tool is smaller than the slot width and thetool follows a circular path from one slot flank to the other.Thereby, the geometry of the tool path is constrained toonly two defined positions per path segment; see Figure 2(b).These points are preset by the desired slot geometry, whereasall other points of the tool path can be chosen freely by theprocess designer according to favourable cutting conditions.Varying the diameter of the circles allows to vary the slotwidth and by tilting the tool axis, nonparallel slot walls canbe created; see Figure 1. In principle, the process consists oftwo major sections—a material removal process and a retralmovement without any contact between tool and workpiece;see Figure 3(a). The local thickness of the chip to be removed(highlighted in Figure 3(b)) is changing essential duringthe circular movement of the tool. This results in heavyalternating thermal and mechanical loads at the tool [10].
2.2. Macroscopic Contact Analysis. The contact conditions onmacroscopic scale focus on the tool’s outer contour penetra-tion of the workpiece described by the engagement angle.Thereby, workpiece and tool can be modeled with differentapproaches of computer-based geometric simulations. Thesystem used here is based on the so-called dexel model,where the workpiece is represented as a set of closely alignednails or dexels; the tool is represented by a cylinder [17, 18].The engagement angle analysis of a circular tool path showsa distribution as displayed in Figure 4 for various cuttingwidths.
As the maximum of removed material correlates withthe maximum tool engagement, demand for further pathoptimization to keep the engagement angle constant on highlevels becomes obvious; see Figure 5(a). Referring to this,another analysis exhibits that variations of the tool pathgeometry are leading to different maximum effective toolengagements; see Figure 5(b). This can remarkably reducethe processing time of trochoidal milling [11].
This shows on the one hand that the macroscopiccontact conditions for linear flank milling are not valid forcircular tool paths and on the other hand the importance ofoptimizing the engagement conditions.
2.3. Microscopic Contact Analysis. The contact conditionson microscopic scale are obtained by using the actual toolgeometry and considering the translational and rotatorytool movement. The contact condition describes the contactbetween the chip face and the uncut chip. It can be explainedby mainly two parameters, the local thickness of the chipto be removed hsp and the related cross-section of the chipAsp. The cross-section represents the amount of material infront of the cutting edge; see highlighted area in Figure 3(b).
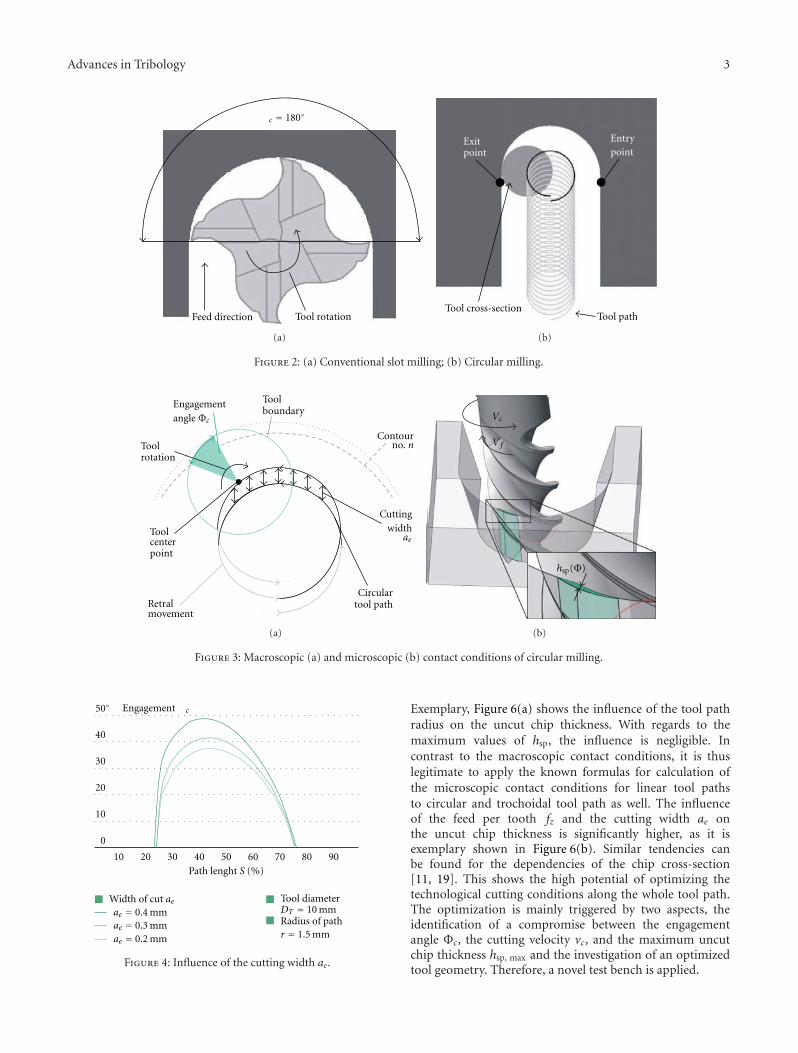
Advances in Tribology 3
Feed direction Tool rotation
c 180
(a)
Tool path
Entrypoint
Exitpoint
Tool cross-section
(b)
Figure 2: (a) Conventional slot milling; (b) Circular milling.
Retralmovement
Circulartool path
Toolboundary
Toolcenterpoint
Engagementangle Φc
Cuttingwidth
ae
Contourno. nTool
rotation
(a)
Vc
V f
hsp(Φ)
(b)
Figure 3: Macroscopic (a) and microscopic (b) contact conditions of circular milling.
0
10
20
30
40
50
10 20 30 40 50 60 70 80 90
Radius of pathr 1.5 mm
Width of cut aeae 0.4 mmae 0.3 mmae 0.2 mm
Engagement c
Path lenght S (%)
Tool diameterDT 10 mm
Figure 4: Influence of the cutting width ae.
Exemplary, Figure 6(a) shows the influence of the tool pathradius on the uncut chip thickness. With regards to themaximum values of hsp, the influence is negligible. Incontrast to the macroscopic contact conditions, it is thuslegitimate to apply the known formulas for calculation ofthe microscopic contact conditions for linear tool pathsto circular and trochoidal tool path as well. The influenceof the feed per tooth fz and the cutting width ae onthe uncut chip thickness is significantly higher, as it isexemplary shown in Figure 6(b). Similar tendencies canbe found for the dependencies of the chip cross-section[11, 19]. This shows the high potential of optimizing thetechnological cutting conditions along the whole tool path.The optimization is mainly triggered by two aspects, theidentification of a compromise between the engagementangle Φc, the cutting velocity vc, and the maximum uncutchip thickness hsp, max and the investigation of an optimizedtool geometry. Therefore, a novel test bench is applied.
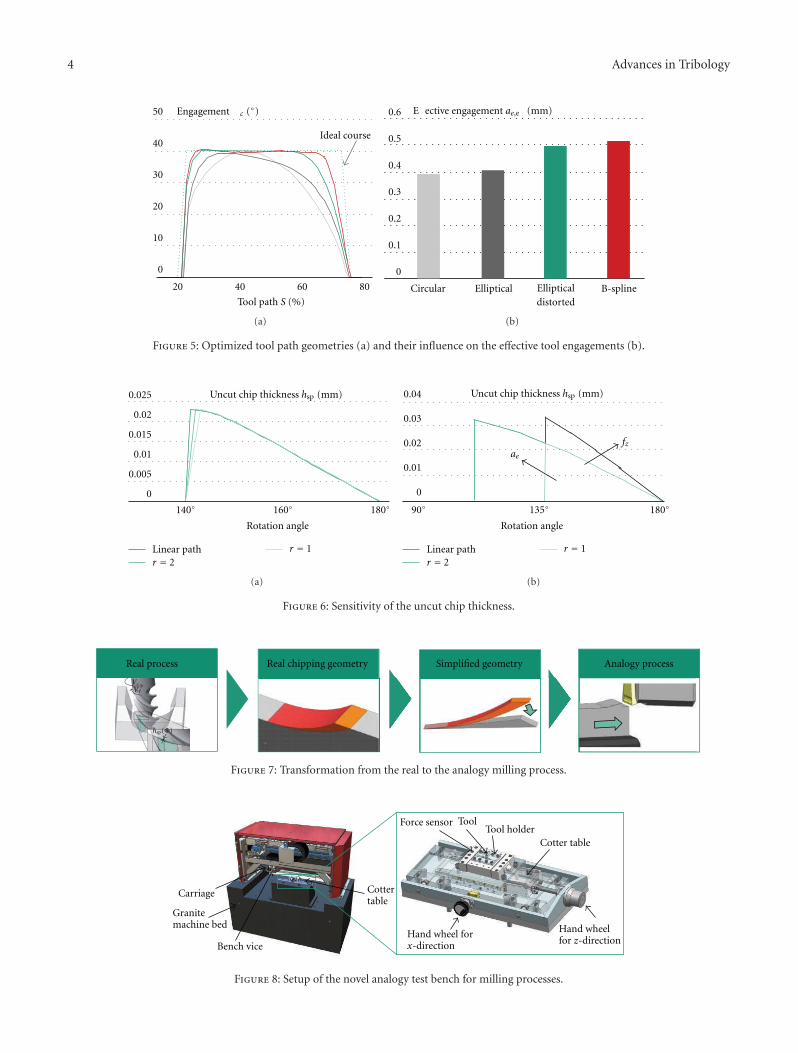
4 Advances in Tribology
50
40
30
20
10
0
20 40 60 80
Ideal course
Engagement c ( )
Tool path S (%)
(a)
0
0.1
0.2
0.3
0.4
0.5
0.6
Circular Elliptical B-splineEllipticaldistorted
E ective engagement ae,e (mm)
(b)
Figure 5: Optimized tool path geometries (a) and their influence on the effective tool engagements (b).
r 1Linear pathr 2
Uncut chip thickness hsp (mm)
Rotation angle
0
0.005
0.01
0.015
0.02
0.025
140 160 180
(a)
Uncut chip thickness hsp (mm)
Rotation angle
0
0.01
0.02
0.03
0.04
r 1Linear pathr 2
90◦ 135◦ 180◦
ae
fz
(b)
Figure 6: Sensitivity of the uncut chip thickness.
Real process Simplified geometry Analogy process
Vc
Vf
hsp(Φ)
Real chipping geometry
Figure 7: Transformation from the real to the analogy milling process.
Cottertable
Bench vice
Granitemachine bed
Carriage
Force sensor ToolTool holder
Cotter table
Hand wheelfor z-direction
Hand wheel forx-direction
Figure 8: Setup of the novel analogy test bench for milling processes.
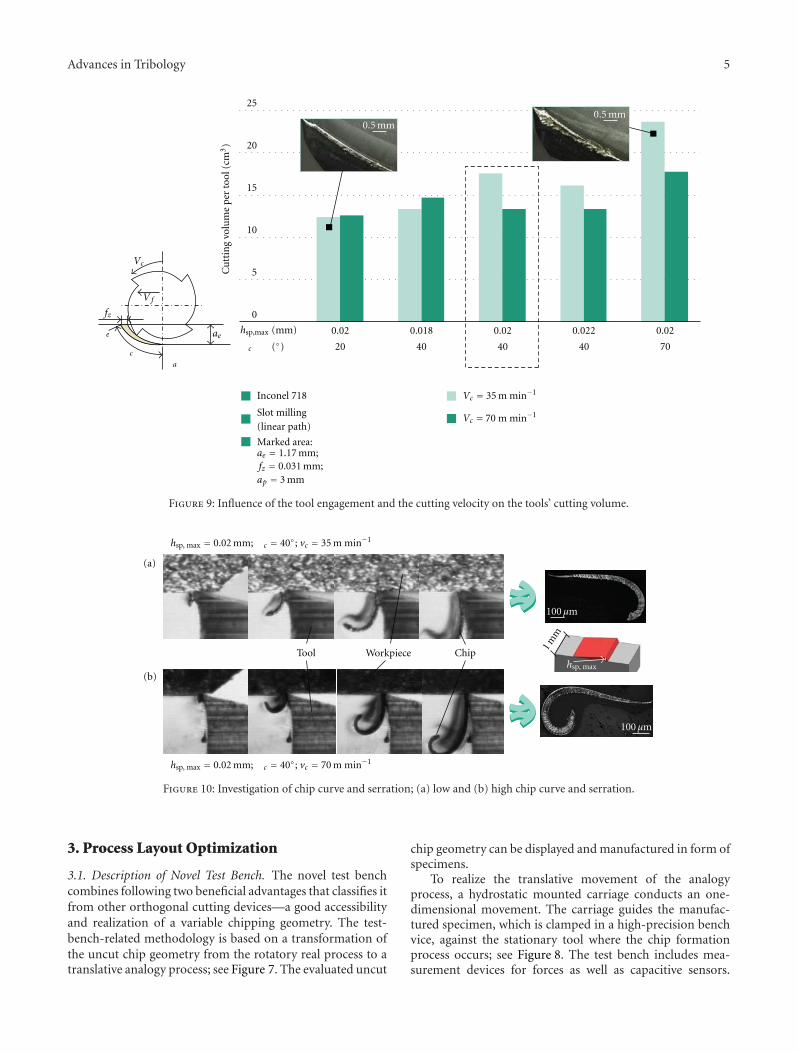
Advances in Tribology 5
a
e
c
0.5 mm
fz
V f
Vc
ae
0.5 mm
Marked area:ae 1.17 mm;fz 0.031 mm;ap 3 mm
Inconel 718
Slot milling(linear path)
Vc 35 m min−1
Vc 70 m min−1
0.02 0.018 0.02 0.022 0.02
20 40 40 40 70
hsp,max (mm)
c
0
5
10
15
20
25
Cu
ttin
gvo
lum
epe
rto
ol(c
m3)
( )
Figure 9: Influence of the tool engagement and the cutting velocity on the tools’ cutting volume.
(a)
(b)
Tool Chip
hsp, max 0.02 mm; c 40 ; vc 35 m min−1
hsp, max 0.02 mm; c 40 ; vc 70 m min−1
hsp, max
1mm
100 μm
100 μm
Workpiece
Figure 10: Investigation of chip curve and serration; (a) low and (b) high chip curve and serration.
3. Process Layout Optimization
3.1. Description of Novel Test Bench. The novel test benchcombines following two beneficial advantages that classifies itfrom other orthogonal cutting devices—a good accessibilityand realization of a variable chipping geometry. The test-bench-related methodology is based on a transformation ofthe uncut chip geometry from the rotatory real process to atranslative analogy process; see Figure 7. The evaluated uncut
chip geometry can be displayed and manufactured in form ofspecimens.
To realize the translative movement of the analogyprocess, a hydrostatic mounted carriage conducts an one-dimensional movement. The carriage guides the manufac-tured specimen, which is clamped in a high-precision benchvice, against the stationary tool where the chip formationprocess occurs; see Figure 8. The test bench includes mea-surement devices for forces as well as capacitive sensors.

6 Advances in Tribology
Table 1: Summary of cutting parameters.
Cutting velocity (m min−1) 35–70
Max. uncut chip thickness (mm) 0,018–0,02–0,022
Engagement angle (◦) 20–40–70
Material Inconel 718
Process Real analogy
The force measurement is provided by a three-componentdynamometer Kistler9129AA and occurs tool sided. Further-more, the good accessibility allows the implementation of ahigh-velocity camera as well as a thermography camera.
3.2. Experimental Setup. Based on real milling processes,which were conducted in form of slot cutting operations onthe machine tool Heller MC25, analogy milling operationsvia the novel test bench were performed. To investigatethe influence of the tool engagement angle on the cuttingperformance, this parameter was varied according to Table 1.Moreover, the maximum uncut chip thickness hsp, max wasvaried by keeping the engagement angle constant. The lastparameter to be varied was the cutting velocity, between35 m min−1 and 70 m min−1. All processes were performed inthe nickel-based alloy Inconel 718 at forged state, indicatingno significance in regard to the orientation of the grainstructure. The applied carbide milling tools from Seco JabroTools were coated with a TiAlN layer and provided a diameterof 10 mm, a cutting edge radius of 12 μm and four teeth. Toinvestigate and compare the real and analogy milling processsufficiently, multiple data was acquired, such as force andmetallographic chip analysis as well as pictures using a high-velocity camera.
3.3. Results. To investigate the overall process performanceof the applied milling tools within the shown parameterfield, slot cutting operations were performed. The experi-mentations exhibit that the tool engagement angle Φc andthe cutting velocity vc influence the achieved cutting volumesignificantly. Over the complete parameter set, a rapid wearprogression could be found which, for higher cutting veloci-ties and tool engagements, resulted in cutting edge chipping;see Figure 9. In this connection, it has to be pointed out thata land wear of 0,2 mm or cutting edge chipping constitutedthe abort criterion of the tests. Moreover, the chip serrationsignificantly increased with the cutting velocity, whereas anenlargement of the engagement angle led to a degradationof the surface quality as well as to a burr formation at themachined workpieces resulting in a stronger abrasive toolwear. In order to relate these findings to proper actionsfor a systematic and efficient optimization of the millingprocess, fundamental and detailed knowledge regarding thechip formation process displays an indispensible must.
For this aim, analogy milling tests using the novel testbench were performed for the benefit of a fast, effective,and reproducible investigation of potential parameters forprocess optimization. The measured forces in the analogytests conformed to the forces detected in the real milling
tests. Thus, an assessment of the occurring forces duringmachining becomes possible by using the novel test bench.Similar to the slot milling tests, the analogy tests showed thatthe cutting force Fc increased with the cutting velocity andthe tool engagement, while the passive force Fp decreasedwith the cutting velocity. This could be seen as an evidencefor a decrease of deformation labour to be expended forthe cutting process at elevated cutting velocities leading toa lower tool displacement and hence to consistent surfaceproperties. This characteristic is confirmed by the analysisof the chip compression λsp which is defined as the relationof the covered cutting distance and the length of the chip.Here, a decrease of chip compression could be revealed fora raise of cutting velocity. Furthermore, the analysis of thechip serration, mainly depending on the grain structure ofthe machined workpiece material [8], showed a progressionwith the cutting velocity leading to higher fatigue stresses atthe tools and hence to shorter tool life. In the frame of theanalysis, it also was detected and visualized that higher chipcurves lead to shorter contact length between the formingchip and the tool. This obviously results in higher surfacepressures on the tools’ rake face induced by the chip andhence to further wear progression. As it can be seen inFigure 10 for hsp, max = 0, 02 mm and Φc = 40◦, the chipcurve varies with the cutting speed, (a) vc = 35 m min−1 and(b) vc = 70 m min−1, which can be visualized and analyzedvia high-velocity camera and light microscope pictures.
The multiple data gained by using the novel analogymilling test bench illustrates the chip formation process indetail and therefore gives unprecedented hints for furtheroptimizing the process parameter frame as well as the tooldesign for ambitious milling tasks.
4. Conclusions
In this paper, an integrated approach for a knowledge-basedprocess layout for simultaneous 5-axis milling of advancedmaterials was introduced. Besides the optimization of thetool path itself, the high potential of optimizing the cuttingparameters as well as the tool geometry was presented.Referring to this, an innovative test bench for a detailedanalysis of the chip formation process was established.
Acknowledgments
The authors would like to thank the Fraunhofer Gesellschaft(FhG) for promoting this research within the projectHybridHPC accomplished in the Fraunhofer ChallengeProgramme and the FhG-Innovation-Cluster “TurPro.” G. F.Cabral is a Scholarship Holder of the Brazilian CAPES.
References
[1] R. Schafrik and R. Sprague, “Superalloy technology—a per-spective on critical innovations for turbine engines,” KeyEngineering Materials, vol. 380, pp. 113–134, 2008.
[2] M. Balazinski, V. Songmene, and L. Kops, “Improvement oftool life through variable feed milling of inconel 600,” CIRPAnnals, vol. 44, no. 1, pp. 55–58, 1995.

Advances in Tribology 7
[3] K. Weinert, D. Biermann, and S. Bergmann, “Machining ofhigh strength light weight alloys for engine applications,” CIRPAnnals, vol. 56, no. 1, pp. 105–108, 2007.
[4] N. Narutaki, Y. Yamane, K. Hayashi, T. Kitagawa, and K.Uehara, “High-speed Machining of Inconel 718 with CeramicTools,” CIRP Annals, vol. 42, no. 1, pp. 103–106, 1993.
[5] M. Alauddin, M. A. El Baradie, and M. S. J. Hashmi, “End-milling machinability of inconel 718,” Journal of EngineeringManufacture, vol. 210, no. 1, pp. 11–23, 1996.
[6] E. O. Ezugwu, Z. M. Wang, and A. R. Machado, “Themachinability of nickel-based alloys: a review,” Journal ofMaterials Processing Technology, vol. 86, no. 1–3, pp. 1–16,1998.
[7] G. Byrne, D. Dornfeld, and B. Denkena, “Advancing cuttingtechnology,” CIRP Annals—Manufacturing Technology, vol.52, no. 2, pp. 483–507, 2003.
[8] L. Markworth, Funfachsige schlichtfrasbearbeitung vonstromungsflachen aus nickelbasislegierungen, Doctoral thesis,Aachen, Germany, 2005.
[9] G. Lebkuchner, “Innovative frasstrategien fur die bliskbear-beitung,” in Proceedings of the Neue Technologien fur die Luft-und Raumfahrt, Hannover, Germany, 2004.
[10] M. Otkur and I. Lazoglu, “Trochoidal milling,” InternationalJournal of Machine Tools & Manufacture, vol. 47, no. 9, pp.1324–1332, 2007.
[11] F. Klocke, T. Bergs, M. Meinecke et al., “Model based optimiza-tion of trochoidal roughing of titanium,” in Proceedings of the12th CIRP Conference on Modeling of Machining Operations,Gaithersburg, Md, USA, 2008.
[12] S. Altmuller, Simultanes Funfachsiges Frasen von Freiformfla-chen aus Titan, Berichte aus der Produktionstechnik, 2001.
[13] F. Klocke and W. Konig, Fertigungsverfahren Drehen, Frasen,Bohren, Springer, New York, NY, USA, 2008.
[14] N. Kardes and Y. Altintas, “Prediction of cutting forcesin circular milling,” in Proceedings of the 3rd InternationalConference and Exhibition on Design and Production of Diesand Molds, pp. 1–5, Bursa, Turkey, 2004.
[15] M. Meinecke, Prozessauslegung zum funfachsigen zirkularenschruppfrasen von titanlegierungen, Doctoral thesis, Aachen,Germany, 2009.
[16] J. Kohler, Berechnung der zerspankrafte bei variierenden span-ungsquerschnittsformen, Doctoral thesis, Hannover, Germany,2010.
[17] K. C. Hui, “Solid sweeping in image space-application in NCsimulation,” The Visual Computer, vol. 10, no. 6, pp. 306–316,1994.
[18] M. Stautner, Simulation und optimierung der mehrachsigenfrasbearbeitung, Doctoral thesis, Essen, Germany, 2005.
[19] E. Kose, A. Kurt, and U. Seker, “The effects of the feed rateon the cutting tool stresses in machining of Inconel 718,”Journal of Materials Processing Technology, vol. 196, no. 1–3,pp. 165–173, 2008.