Water Supply Update - dallascounty.org of Dallas Water Utilities Fact Sheet . How Water is Used in...
31
Long Range Water Supply Plan Forney Dam at Lake Ray Hubbard Society of American Military Engineers’ Dallas Post December 4, 2014 UT Arlington – E. H. Hereford University Center
-
Upload
truongmien -
Category
Documents
-
view
214 -
download
0
Transcript of Water Supply Update - dallascounty.org of Dallas Water Utilities Fact Sheet . How Water is Used in...

Long Range Water Supply Plan
Forney Dam at Lake Ray Hubbard
Society of American Military Engineers’ Dallas Post December 4, 2014
UT Arlington – E. H. Hereford University Center

• Background • Water Supply Planning • Long Range Water Supply Plan
– Projected Demands – Current Supplies – Projected Needs
• LRWSP Preferred Water Management Strategies
Outline
Lake Ray Roberts 2
Background
Lewisville Lake and Dam 3

4
Change in Water Utilities Operations
1850s-1950 1950 to 2010 2010 to 2070 and Beyond- Population grew from 430 to 400,000 in 100 yrs
- Service population grew from 400,000 to 2.4 million in 60 yrs
- Service population to grow to over 4.5 million
- Surface water and wells used for water supply
- Only surface water used for water supply
- Increased reliance on conservation/reuse
- 2 small lakes (Lake Dallas and White Rock Lake)
- 7 lakes for water supply; 6 connected, 1 currently unconnected
- 9 lakes possible for water supply
- Declining block rate used - Aggressive water conservation measures implemented
- Increasing block rate used
- Increasing block rate used
Turtle Creek Pump Station (1909-1930)

5
• The water department was founded in 1881
• The water department is funded from water and wastewater revenues, and does not receive tax dollars
• Approximately 1,500 employees • Population served
~1.2 million - Dallas ~1.2 million in 27 wholesale customer cities ~2.4 million total
• 699 square mile service area • 300,000+ retail customer accounts • 4,925 miles of water mains • 4,018 miles of wastewater mains • Treated 135 BG of water in FY14 meeting
all regulatory guidelines • Treated 55 BG of wastewater in FY14
City of Dallas Water Utilities Fact Sheet

How Water is Used in Dallas Fiscal Years 2009 – 2013
6
46.7%
38.3%
5.2%
9.8%
Retail Wholesale Unbilled Authorized Water Loss

7
Dallas Water Utilities Service Area
DALLAS
COLLIN
ROCKWALL
KAUFMAN
DALLAS
ELLIS
DENTON
TARRANT
TREATED WATERCUSTOMER
UNTREATED WATERCUSTOMER
TREATED & UNTREATEDWATER CUSTOMER
L E G E N D
DALLASRETAILSERVICEAREA
WHOLESALECUSTOMERS
21april10

Water Supply Planning
Lewisville Lake and Dam

9
Planning Guidelines • Dallas plans to have enough reservoir firm yield to meet water demands
equivalent to the 1950s drought of record • Dallas’ ranking for planned new water supply sources has been based on:
– Costs – capital construction and power – Efficiency – Environmental impact – Likelihood for development
• Water located closer to the City is generally less expensive – Lower infrastructure costs due to shorter pipelines – Lower pumping (energy) costs – a recurring, annual expense
• Working with other area water providers to achieve greater economies of scale and thus reduce costs
Lake Ray Hubbard, Muddy Creek Branch 2014

Dallas’ Water Supply Planning
• Dallas’ 1959 Long Range Water Supply Plan was updated in 1975, 1989, 2000 and 2005 – The 1959 study recommended that Dallas
supply water to surrounding cities
• As a result of the City’s planning processes, the following lakes were constructed: • Lake Grapevine (1952) • Lake Lewisville (1955) • Lake Tawakoni (1964) • Lake Palestine (1971) • Lake Ray Hubbard (1973) • Lake Fork (1980) • Lake Ray Roberts (1989)
10
• Later studies encouraged Dallas to develop aggressive water conservation and reuse plans, connect existing reservoirs to Dallas’ system and revise Dallas Water Utilities' water supply planning area—actions that have been implemented or are ongoing

Regional Water Planning
11
• The passage of Senate Bill 1 in 1997 changed water supply planning throughout the State
– Regional water planning groups established
– Regional and State water plans required every five years
– Local plans provided to the Regional Water Planning Group for consideration in the Regional Water Plan
• State Water Plan due to Governor and Legislature in 2017 to meet the State Water Plan Schedule – Council approved water management
strategies due to Region C January 2015 – Region C Water Plan is due to Texas Water
Development Board November 2015

The Long Range Water Supply Plan (LRWSP)
• Since the 2005 Update to the Long Range
Water Supply Plan various 2005 planning assumptions have changed – The 2010 Census was released, water conservation
plan success, the loss of Lake Fastrill reservoir site and Oklahoma water and the adoption of environmental flow standards by the State
• Began work in Fall 2012 to update LRWSP – To develop population and water demand
projections, evaluate existing supplies, and identify and recommend supply strategies to meet needs through 2070
– Draft report is currently under review and anticipated to be published in early 2015
12

Additional Studies in Support of LRWSP
• Sulphur River Basin Wide Study – Partnership with Sulphur River Basin Authority and four
other regional partners – Identified combined water supply needs of partners – Recommendations considered in LRWSP multi level
screening process
• Upper Neches River Water Supply Project (Fastrill Replacement Project)
– Run-of-River diversions from the Neches River near the Fastrill dam site with delivery to the Integrated Pipeline (IPL) pump station at Lake Palestine
– Recommendations considered in LRWSP multi level screening process
13
White Rock Pumphouse

Long Range Water Supply Plan Demand, Supply and Needs
14

Dallas’ Regional System Current Water Supply
15
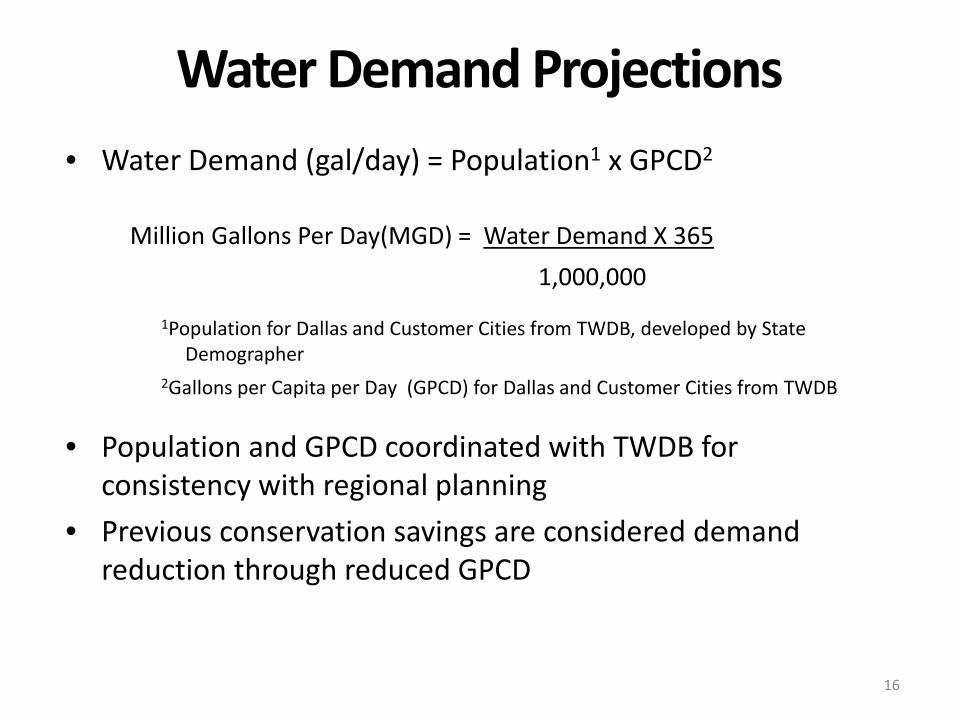
Water Demand Projections • Water Demand (gal/day) = Population1 x GPCD2
Million Gallons Per Day(MGD) = Water Demand X 365 1,000,000
1Population for Dallas and Customer Cities from TWDB, developed by State Demographer
2Gallons per Capita per Day (GPCD) for Dallas and Customer Cities from TWDB
• Population and GPCD coordinated with TWDB for consistency with regional planning
• Previous conservation savings are considered demand reduction through reduced GPCD
16
0
100
200
300
400
500
600
700
800
900
1000
2010 2020 2030 2040 2050 2060 2070
Wat
er D
eman
d (M
GD)
Decade
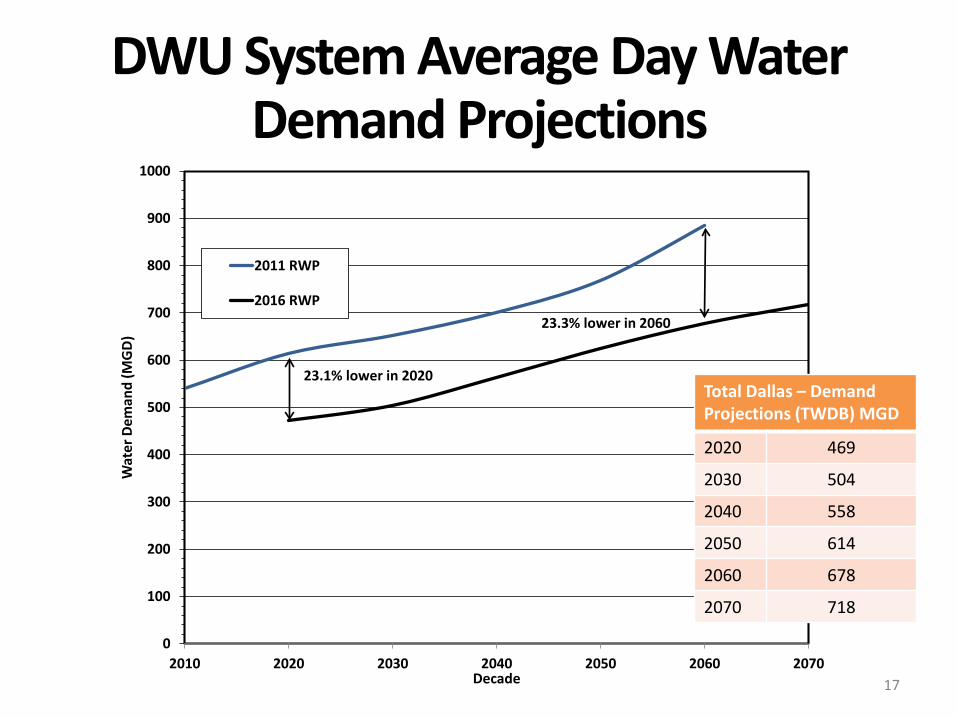
2011 RWP
2016 RWP23.3% lower in 2060
23.1% lower in 2020Total Dallas – Demand Projections (TWDB) MGD
2020 469
2030 504
2040 558
2050 614
2060 678
2070 718
DWU System Average Day Water Demand Projections
17

Dallas’ Regional Water Supply System with Losses
18
• Climate Change Assumption - Increase in temperature of 2°F in 2020 and increasing to 7°F in 2070
• Sedimentation Assumption – Combined average 0.093% reduction per year based on historic sedimentation identified in sediment surveys

Demands / Supplies / Needs
19

Future Water Needs Dallas’ Regional System
• Buffer Supply – Connected supply in surplus of current demands
– Drought worse that the drought of record – Growth rate greater than projected – Emergency Demands
• Water Supply deficit (i.e. loss of reserve) begins in 2027
• By 2070 the DWU Regional System needs an additional 258 MGD
20
Connected Supply Buffer Supply and Shortages

LRWSP Water Management Strategy Preferred Options
21

Water Management Strategy Multi Level Screening Process
22
Identification of all possible strategies
Basic Analysis
Fatal Flaw Analysis
Scoring and Ranking
Detailed Analysis
Recommendations

Multi Level Screening Process • Identification of all possible strategies
– 312 strategies identified – 3 Classes of strategies
• Previously studied – updated costs • Previously studied- updated with new information • New strategies
• Performed Basic/Fatal Flaw Analysis • Out of Date / Duplicate • Not a Dallas Strategy (project identified for another entity) • Fatal flaw or potential fatal flaw reducing the likelihood a project
could be permitted or constructed (e.g. Lake Fastrill)
• 41 Potentially Feasible Strategies for further consideration and detailed analysis
23

Scoring and Ranking Criteria
24
• Supply Available • Total Project Cost • Unit Cost • Annual O&M Cost
Basic Criteria
• Environmental Impacts • Confidence /
Permitting / Legal • Flexibility / Phasing • Water Quality
Concerns
Advanced Criteria
High Ranked Strategies
Medium Ranked Strategies
Low Ranked Strategies
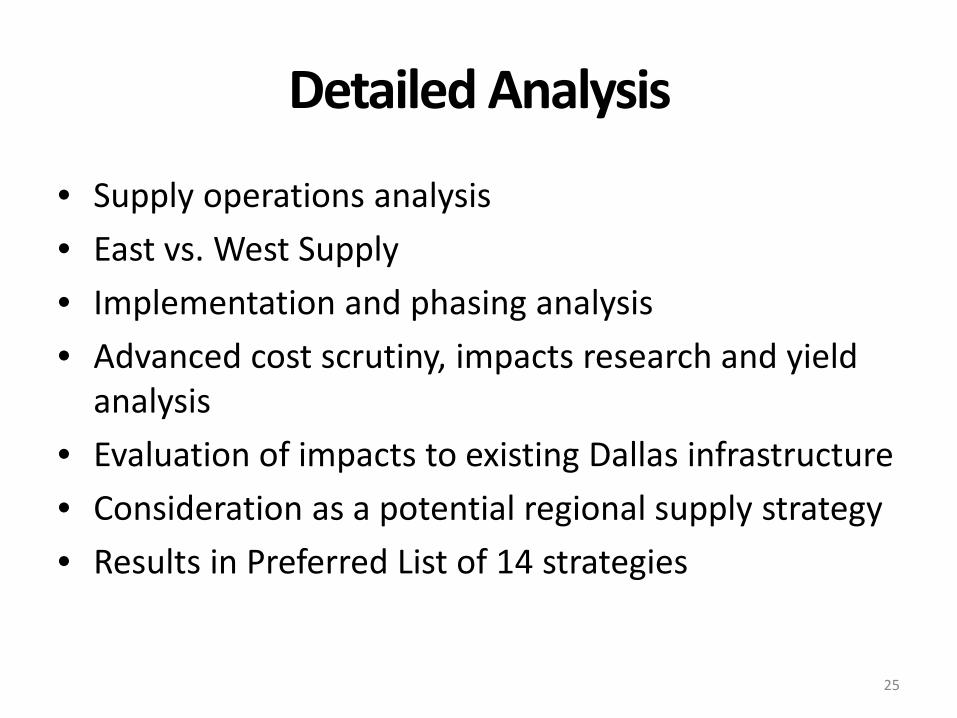
Detailed Analysis
• Supply operations analysis • East vs. West Supply • Implementation and phasing analysis • Advanced cost scrutiny, impacts research and yield
analysis • Evaluation of impacts to existing Dallas infrastructure • Consideration as a potential regional supply strategy • Results in Preferred List of 14 strategies
25

Preferred Strategies
26

Demand, Supply and Recommended Strategies
27

Alternate Strategies
28
Note: Strategy E-1 and H are mutually exclusive (i.e. the Carrizo Wilcox groundwater in Strategy E-1 is the same groundwater in Strategy H).

Recommended Strategies 2020 - 2070
29
Summary • System average day water demands reduced by 23% or on average approximately
151 MGD • Connected firm yield reduced over time due to sedimentation and increased
evaporation from higher temperatures • Projected supply and demand deficit beginning in 2027
– 15 MGD deficit in 2030 – 258 MGD deficit by 2070
• Recommended strategies identified to address deficit: – Additional conservation – Indirect Reuse Implementation
• Main Stem Pump Station (NTMWD Swap Agreement) • Main Stem Balancing Reservoir
– Lake Palestine (Integrated Pipeline Project) – Neches Run-of-River – Lake Columbia
• October 8 2014 Dallas City Council approved recommended strategies to submit to Region C by January 2015
30
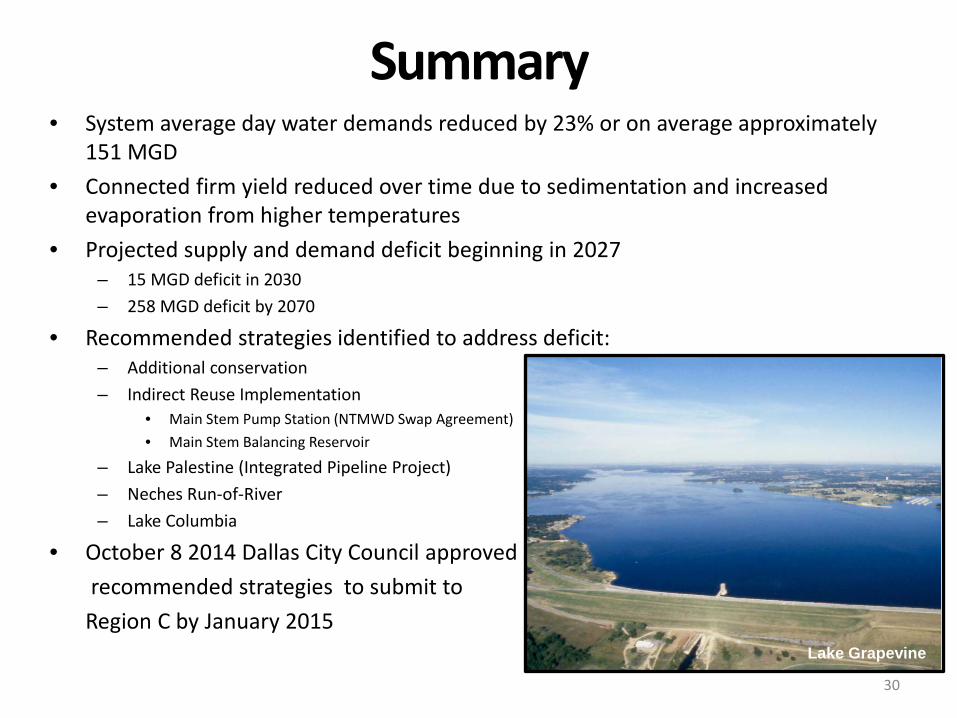
Lake Grapevine

31
Questions?
Lake Fork