
WATER QUALITY MONITORING SYSTEM AND … · AND RIVER MANAGEMENT INFORMATION SYSTEM (MIS) ... •...
45
1
Transcript of WATER QUALITY MONITORING SYSTEM AND … · AND RIVER MANAGEMENT INFORMATION SYSTEM (MIS) ... •...

1

2
WATER QUALITY MONITORING SYSTEMAND RIVER MANAGEMENT INFORMATION SYSTEM (MIS) IN BRANTAS RIVER BASIN
JASA TIRTA I PUBLIC CORPORATIONJASA TIRTA I PUBLIC CORPORATIONJl. Surabaya 2A, Malang – 65115
Phone. 62-341-551971, Fax. 62-341-551976E-mail: [email protected]://www.jasatirta1.go.id

3
East Java
East Java
Description of Brantas River Basin Description of Brantas River Basin
•• Basin AreaBasin Area :: 11,800 km11,800 km2 2 (25% of E. Java) (25% of E. Java)
•• Population (2003)Population (2003) :: 15.5 million (43% of E. Java)15.5 million (43% of E. Java)
•• Average RainfallAverage Rainfall :: 2,000 mm/year2,000 mm/year
•• Water PotentialsWater Potentials :: 12 billion m12 billion m33/year/year
•• River LengthRiver Length :: 320 km 320 km
• Active volcanoes:Mt. Kelud & Mt. Semeru
• Land Use (2004) : - paddy field 39.0%
- dry land 12.0%
- plantation 22.0%
- forest 11.0%
- settlements 12.0%
- others 4.0%
Indonesia
Brantas River Basin
East Java
Brantas River Basin

4
MAIN TASK AND BASIC PRINCIPLEES OF COMPANY
MAIN TASK• Operation and maintenance of water resources infrastructures,• Dealing with water and water resources,• River basin management such as conservation, development and
utilization of water as well as water • Rehabilitation of water resources infrastructuresBASIC PRICIPLES1. Water resources management covers the development, conservation,
utilization and control.2. Based on the principles of conservation, utilization, fairness, self
sufficiency and accountability.3. Planned and implemented interestedly, comprehensively, sustainable,
based on environmental considerations with the river basin as the management unit.
4. The management scope: - Watershed Management,- Water Quantity Management,- Water Quality Management,- Flood Control Management,- River Environment Management,- Water Resources Infrastructure Management.

5
β
β
ββ
HINDIA OCEAN
STRAIT
MADURA
∆
∆ ∆
∆
∆
∆MT. WILIS
MT. KELUD
MT. KAWI
MT. ARJUNA
MT. SEMERU
N
• MALANG
•SURABAYA
SURAKARTA •
•BLITAR
• KEDIRI
BRANTAS RIVER BASIN
BENGAWAN SOLO RIVER BASINBR
ANTAS
RIVER
BENGAWAN SOLORIVER
MADIU
NRIV
ER
BENGAWAN SOLO
RIVER
PORONG RIVER
BRANTA
SRIV
ER
WORKING AREA OF JASA TIRTA I PUBLIC CORPORATION
Floodway Sedayulawas
Gunungsari Barrage
New Lengkong Barrage
Menturus Rubber Dam
Jatimlerek Rubber Dam
Selorejo DamSengguruh DamLahor DamSutami DamWlingi BarrageLodoyo Barrage
Mrican Barrage
Wonogiri Dam
Colo Barrage
Jati Rubber Dam
Bening Dam
Wonorejo Dam T.Agung Coastal Hydro Electric Power

6
•• One of the largest river systems in IndonesiaOne of the largest river systems in Indonesia•• Functions as the most important source of water Functions as the most important source of water
supply in East Java Provincesupply in East Java Province•• Support regional and national development Support regional and national development
benefits: benefits: GRDP Brantas Rp. 150,630 billion GRDP Brantas Rp. 150,630 billion ––approx. US$ 17.66 billion approx. US$ 17.66 billion –– 59% GRDP E. Java 59% GRDP E. Java ––8% GRDP National8% GRDP National
Facts about Brantas River Basin

7
Water Resources Management Scope of Work
Precipitation
Flood Control
Surface Water
Water Resources Development
Biodiversity
Land Use
Watershed Management
Flood Control Management Water Quality Management
Evaporation
River Environment Management
Land Conservation
Water Quality Control Waste Water Treatment
River Basin Management
River and Sea Drainage
Water Conservation
Recreation
Ground Water
River Environment
Waste Water
Water UsageDomesticIrrigationFisheryIndustryRiver-
Maintenance
Water Quantity ManagementSedimentation Control
Land Slideand Erotion
Water Resources Development

8
Background (main problems)a. The growth of population and economic development
increases pollution, and causes water quality degradation.The main source of pollution are :- Industry ;- Domestic (households) ;- Agriculture.
b. Less of environmental awareness by :- Industries : waste water treatment plant not func-
tioning correctly, industries have no treatment plant,- Domestic : disposing of waste water and rubbish
directly to the river,- Agriculture : excessive consumptions of fertilizer and
pesticide,

9
Background (main problems)
c. In effective institutional arrangement for water quality management :- Less of coordination between concernedagencies,
- Lack of funding.
d. Incomplete regulations and ineffective of law enforcement :- Comment and control approach treats pollu-ters as objects,
- Sanction which have been applied have notbeen effective.

10
Relevant Technical Issues in the Basin
– pollution from domestic, industrial and agricultural sources haspolluted the river and the reservoir⇒ creates a span with the designated standards
Waste discharge
River polluted
Reservoir Eutrophication
Died FishWaste industries
Waste domestic

11
Zones of Poor Water Quality in Brantas BasinZones of Poor Water Quality in Brantas Basin
Downstream of Malang
Lower Brantas and Surabaya Area

12
WATER QUALITY MANAGEMENT
Jasa Tirta I Public Corporation participates in seeking to create the Brantas River water quality condition as it should be by carrying out water quality monitoring and licensing waste water disposal, cooperating with the agencies concerned.
As one of the pollution control efforts, Jasa Tirta I Public Corporation cooperates with the Indonesian Science Institute in constructing a telemetry system for water quality monitoring in the Brantas River basin and a Water Quality Laboratory in Malang, and improving the Water Quality Laboratory in Mojokerto.

13
The activities of the Water Quality Managementof Jasa Tirta I Public Corporation are as follow :1. Real time water quality monitoring taken
from 23 Water Quality Monitoring stations.2. Routine monitoring:
a. Monitoring of river water body of the Brantas River and its tributaries at 60 locations.
b. Monitoring of industrial waste water quality at 57 locations.
c. Monitoring of hospital waste water quality at 11 locations.
3. Public Service.

14
Monitoring System - ManualMonitoring location :
Routinely quality monitoring activity in body river executed in 51 dot location watch with period 2 weekly in 5 location, monthly in 29
location and 3 monthly in 17 location.
For monitoring waste industries and waste domestic executed in 3 period per month at 56 location monitoring point waste industries and 11 location monitoring point waste domestic (5 hospitals, 4 hotels, 2
locations at public sanitation canal).
Purpose and Objective:the Monitoring activity intended to get quality picture or information of Brantas river totally. Pursuant to conditions rule arranged withGovernor Decision and from the monitoring result hence can be evaluated its quality eligibility storey level so that can be searched bythe operation effort which require to be executed by a Government Province of East Java and Regency Government and/ Town with On duty/ Related/Relevant Institution. With this effort is expected will create clean water source environment and make healthy.

15
Brantas River Basin
Water Quality Monitoring Infrastructures and Equipment (Manual)
LKA Mojokerto
Mobile Laboratories
Intake Pengambilan Air PDAM Karangpilang

16

17

18
WATER QUALITY MONITORINGANNUAL DO (Dissolved Oxygen)
ALONG BRANTAS, SURABAYA & MAS RIVER
0
1
2
3
4
5
6
7
8
9
0 20 40 60 80 100 120 140 160 180 200 220 240 260 280 300 320
Jarak pemantauan (km)
mg/
l
Location Standart Min. Year : 1999 Year : 2000 Year : 2001 Year : 2002 Year : 2003
Brantas Surabaya Mas
Kab.MalangIK.MalangI Kab.Malang I Kab. Blitar I Kab. Tulungagung I Kt. Kediri I Kab.Nganjuk I Kab.Jbg. I Kab/Kt.M.kerto I Kb.Gresik I Kt.Surabaya
Distance

19
WATER QUALITY MONITORINGANNUAL BOD (Biological Oxygen Demand)
ALONG BRANTAS, SURABAYA & MAS RIVER
0
3
6
9
12
15
18
21
0 20 40 60 80 100 120 140 160 180 200 220 240 260 280 300 320
Jarak pemantauan (km)
mg/
l
Location Standart Max. Year : 1999 Year : 2000 Year : 2001 Year : 2002 Year : 2003
Brantas Surabaya Mas
Kab.MalangIK.MalangI Kab.Malang I Kab. Blitar I Kab. Tulungagung I Kt. Kediri I Kab.Nganjuk I Kab.Jbg. I Kab/Kt.M.kerto I Kb.Gresik I Kt.Surabaya
Distance

20
0035
3 W
d. S
utam
i ten
gah
0500
Pak
el
0090
Pen
dem
0160
Kd.
Ped
arin
gan
0290
Wd.
Sen
ggur
uh03
00 J
. Sen
ggur
uh
0995
B. L
engk
ong
0351
Wd.
Sut
ami h
ulu
0355
Wd.
Sut
ami h
ilir
0380
J. K
alip
are
0390
Kes
ambe
n
0440
D/S
Wd.
Wlin
gi
0460
D/S
Wd.
Lod
oyo
0725
B. M
rican
0730
Ker
toso
no07
80 N
grom
bot
0940
J. P
loso
1000
Can
ggu
1020
Per
ning
1030
Jre
beng
1035
Can
gkir
1040
Bam
be10
45 K
aran
gpila
ng10
50 S
epan
jang
1060
B. G
unun
gsar
i
1200
Pet
ekan
1100
Nga
gel/J
agir
0
6
12
18
24
30
36
0 10 20 30 40 50 60 70 80 90 100
110
120
130
140
150
160
170
180
190
200
210
220
230
240
250
260
270
280
290
300
310
320
Standar Maks. Minimum Rata-rata Maksimum
===
> B
OD
(mg/
l)
Jarak pemantauan (km)
Water Quality Monitoring Result Along Brantas River, Surabaya River & Mas River
Periode : Tahun 2004Biochemical Oxygen Demand (BOD)
K. Brantas K. Surabaya
DistanceAverage
Year

21
0035
3 W
d. S
utam
i ten
gah
0500
Pak
el
0090
Pen
dem
0160
Kd.
Ped
arin
gan
0290
Wd.
Sen
ggur
uh03
00 J
. Sen
ggur
uh
0995
B. L
engk
ong
0351
Wd.
Sut
ami h
ulu
0355
Wd.
Sut
ami h
ilir
0380
J. K
alip
are
0390
Kes
ambe
n
0440
D/S
Wd.
Wlin
gi
0460
D/S
Wd.
Lod
oyo
0725
B. M
rican
0730
Ker
toso
no07
80 N
grom
bot
0940
J. P
loso
1000
Can
ggu
1020
Per
ning
1030
Jre
beng
1035
Can
gkir
1040
Bam
b e10
45 K
aran
gpila
ng10
50 S
epan
jang
1060
B. G
unun
gsar
i
1200
Pet
ekan
1100
Nga
gel/J
agir
0
10
20
30
40
50
60
70
80
90
100
0 10 20 30 40 50 60 70 80 90 100
110
120
130
140
150
160
170
180
190
200
210
220
230
240
250
260
270
280
290
300
310
320
Standar Maks. Minimum Rata-rata Maksimum
===
> C
OD
(mg/
l)
Jarak pemantauan (km)
Water Quality Monitoring Result Along Brantas River, Surabaya River & Mas River
Periode : Tahun 2004Chemical Oxygen Demand (COD)
K. Brantas K. Mas
K. Surabaya
DistanceAverage
Year

22
1100
Nga
gel/J
agir
1200
Pet
ekan
1060
B. G
unun
gsar
i10
50 S
epan
jang
1045
Kar
angp
ilang
1040
Bam
be10
35 C
angk
ir
1030
Jre
beng
1020
Per
ning
1000
Can
ggu
0940
J. P
loso
0780
Ngr
ombo
t07
30 K
erto
sono
0725
B. M
rican
0460
D/S
Wd.
Lod
oyo
0440
D/S
Wd.
Wlin
gi
0390
Kes
ambe
n
0380
J. K
alip
are
0355
Wd.
Sut
ami h
ilir
0351
Wd.
Sut
ami h
ulu
0995
B. L
engk
ong
0300
J. S
engg
uruh
0290
Wd.
Sen
ggur
uh01
60 K
d. P
edar
inga
n
0090
Pen
dem
0500
Pak
el
035
3 W
d. S
utam
i ten
gah
0
1
2
3
4
5
6
7
8
9
10
11
12
13
14
15
16
0 10 20 30 40 50 60 70 80 90 100
110
120
130
140
150
160
170
180
190
200
210
220
230
240
250
260
270
280
290
300
310
320
Standar Min. Minimum Rata-rata Maksimum
===
> D
O (m
g/l)
Distance (km)
Water Quality Monitoring Result Along Brantas River, Surabaya River & Mas River
Periode : Tahun 2004Dissolved Oxygen
K. Brantas K. Surabaya
Average
Year

23
Brantas River Water Quality and Pollution Management System( BRWQPMS )
Purpose:1. Water Quality Monitoring implementation directly,
2. Implementation of Pilot of installation of liquid waste processing,
3. New water quality Laboratory development and existing and to upgrade water quality laboratory ( water quality monitoring implementation by off-line/ manual,
4. Additional implementation of equipments for the amount monitoring water quantity ( rainfall condition and high water level) directly
5. Development of data processing system for decision making ( decision support system/ DSS)
6. Program training to operation and maintenance.
Monitoring System – On line
24
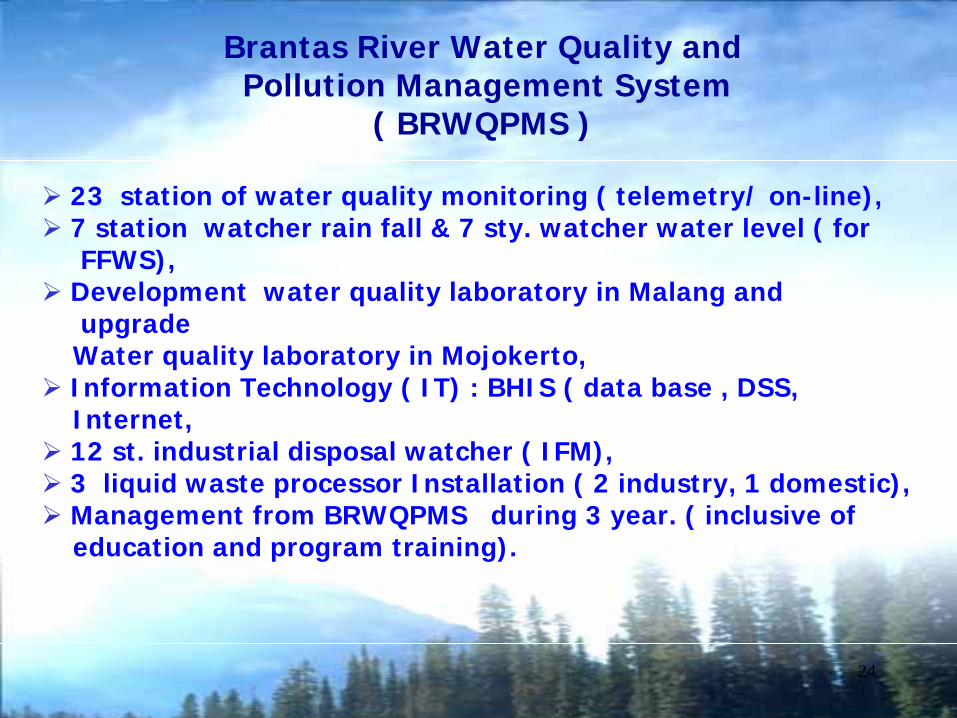
Brantas River Water Quality andPollution Management System
( BRWQPMS )
23 station of water quality monitoring ( telemetry/ on-line),7 station watcher rain fall & 7 sty. watcher water level ( forFFWS),
Development water quality laboratory in Malang andupgrade
Water quality laboratory in Mojokerto,Information Technology ( IT) : BHIS ( data base , DSS,Internet,12 st. industrial disposal watcher ( IFM),3 liquid waste processor Installation ( 2 industry, 1 domestic),Management from BRWQPMS during 3 year. ( inclusive ofeducation and program training).

25
LEGEND• Location of real time water quality monitoring stations (23 stations)♠ Location of automatic industrial flow meter (13 Stations)
Madura Strait
Indonesian Ocean
♠♠♠
♠
♠♠
♠
♠
♠♠
♠♠
♠
Kali Widas 3 Kali Porong 3
Kali Brantas 11
Kali Brantas 1
Kali Brantas 15
Tambangan Canggu
PDAM Krikilan
Downstream Jembatan Jrebeng
Karanglo (downstream outlet Miwon)
PDAM Karangpilang
WQ-19 PDAM Ngagel
WQ-18 PDAM Kayoon
Kertosono Bridge
Downstream outlet Cheil Jedang
Kedung Bacok Gate (d/s Dam Porong Canal)
Downstream Mangetan Gate
Downstream outlet Ajinomoto
Dam Lodoyo
Tambangan Pakel
Downstream Jembatan Kendalpayak
Upstream Jembatan Pendem
Upstream Jembatan Ngujang
Upstream Mrican BarrageDam Selorejo
Dam Wlingi
Dam Sengguruh
Dam SutamiJembatan Tawangrejeni
IFM-9 Miwon, PTIFM-8 Surabaya Mekabox, PT
IFM-12 Adiprima Suraprinta, PT
IFM-5 Ajinomoto, PT
IFM-13 Surya Agung Kertas, PT
IFM-6 Pakerin, PT
IFM-7 Eureka Aba Paper, PT
IFM-1 Jaya Kertas, PT
IFM-11 Aneka Kimia Nusantara, PT
IFM-4 Setia Kawan, PT
IFM-2 Surya Pamenang, PT
IFM-3 Surya Zig Zag
IFM- 10 Eka Mas Fortuna, PT (Ayuwangi)
WQ01-
WQ02-
WQ03-
WQ23-WQ04-
WQ05-
WQ06-
WQ07-
WQ08-
WQ09-
WQ10-
WQ21-
WQ11-
WQ13-
WQ12-
WQ22-
WQ20-
WQ14-
- WQ16
- WQ17WQ15 -
LOCATION OF ONLINE WATER QUALITY MONITORING STATIONS AND AUTOMATIC INDUSTRIAL FLOW METER
Equipment

26
RCCU
PC1Quality
Quantity
PC2Back-up
HIS
23Water Quality
Monitoring Stations
Public Telephone Network
!!
6 RepeaterStations
14Water Quantity
Monitoring Stations
RadioTransmission
Intranet
RCCU
PC1Quality
Quantity
PC2Back-up
HIS
23Water Quality
Monitoring Stations
Public Telephone Network
!!
6 RepeaterStations
14Water Quantity
Monitoring Stations
RadioTransmission
Intranet
3
RCCU Remote Central Control Unit
HIS Hydrological Information System
Water Quality and Quantity Station(Data Real-Time transfer to RCCU via Radio and / or Thelephone Transmition)

27Indonesian Ocean
Madura Island
Madura Strait

28
Brantas River Basin
Station of water quality monitor (on-Line)
Malang LaboratoryMojokerto Laboratory
Laboratorium Mobile
Water Quality Monitoring Infrastructures and Equipment (On line)

29
Ortho-Phosphate
Microfiltration (10 nm)(WaterLevel)
Filtrate
On-SiteData Storage
Data Transmission to Malang Master Station &
Telephone / HP (Warning / Alarm)
ALARM (System Failure, Thresholds)
Automatic Water Sampler (24 h / 4°C)
Effluent
Turbidity Ammonium
Data
pHTemperatureEl. ConductivityDissolved Oxygen
Water Quality Monitoring Station (Lay out)
Pre Filtered Sample Water
Riv
er W
ater

30
Pump
Turbidity
WaterTank
Auto SamplerRefrigerator
WashBasin
NH4Analyzer
Cont
inuo
us F
lowc
ell
PO4Analyzer
Subm
ersib
le Pu
mp
Control Unit(CU300)
Monitor
Pre FilterManometerKlepTransmitterFlowmeterContoh AirAir BuanganpH, DO, Cond., Temp.Sensors
FLOW SYSTEM OF SAMPLE
Microfiltration Unit

31
EQUIPMENT SYSTEM OF WATER QUALITY MONITORING
PH, TEMPERATURE, CONDUCTIVITY, DISSOLVED OXYGEN
PH&
TEMP
DO
CONDUCTIVITY
FLOW CELL
AMMONIA DAN ORTHOPHOSPHATE (NUTRIENS)
MICRO FILTRASI
NH4
PO4
TURBIDITY METER
SAMPEL OTOMATIS (AUTOSAMPLER)

32
Water waste processor Installation & Industrial Flow Metering
Treatment Plan of Domestic waste (Tlogo Mas) Treatment plan of Domestic waste
Treatment Plan of Industries waste (PT. Kasin)
Industrial Flow Metering (IFM)

330
2
4
6
8
10
03/08 04/08 05/08 06/08 07/08 08/08 09/08 10/08 11/08 12/08 13/08
Date
DO
(mg
l-1) /
pH
375
400
425
450
475
500
EC (
S c
m-1
)
DO
pH
EC
1
6
0
2
4
6
8
10
03/08 04/08 05/08 06/08 07/08 08/08 09/08 10/08 11/08 12/08 13/08
Date
DO
(mg
O2 l
-1)
Mrican
Kertosono
Tambangan
Molasses Propagation2
Molasses Accident August 2003
Sharp drop of dissolved-oxygen concentration (DO) and pHSharp rise of el. conductivity (EC)
1
Sharp drop of dissolved-oxygen levels at three consecutive monitoring stations
2
Initial Molasses Detection
Water Quality Monitoring (Release of Industry Effluent into Brantas River)

34
Water quality condition in Surabaya river at Station Karangpilang( holliday periode, December 2004)
Before week end and/ or holliday result meassurementwas not excelent and satisfaction
After weekend and / or holliday result meassurement was excelent and satisfaction

357
0
2
4
6
8
10
12
14
16
18
20
21/06 22/06 23/06 24/06 25/06 26/06 27/06 28/06 29/06 30/06 01/07
Date
DO
(mg
l-1)
0
2
4
6
8
10
12
14
16
18
20
Rainfall (m
m)
Sutami Dam June 2001
0
2
4
6
8
10
12
14
16
18
20
03/02 04/02 05/02 06/02 07/02 08/02 09/02 10/02 11/02 12/02 13/02 14/02 15/02
Date
DO
(mg
l-1)
0
2
4
6
8
10
12
14
16
18
20
Rainfall (m
m)
Sutami Dam Feb.2002
Dissolved Oxygen (DO) and Rainfall at a Station Located at a Dam
Dry Season1
At water temperatures between 28 and 32°C DO concentrations in the dry season exhibit very high variations with differences of more than 10mg/l during the day. Excessive algae oxygen production leads to over-saturation of more than 200% in the afternoon, whereas in the night even anoxic conditions occur. In the rainy season maximum variations of DO at water temperatures between 27 and 29°C usually are less pronounced than in the dry season.
1
2
Rainy Season2
During the dry season a much higher amplitude for diurnal pattern in DO can be observed, which is caused by autotrophic organisms.
Sutami Dam Water Quality Characteristic

36
Problems in maintenance equipments
location pump- station dirty water mud sediment
Equipments full of mudmud sediment- eq.timeworn

37
Problems in maintenance equipments
Equipments timewornmaintenace equipments
Runed spare part Replacement of spare part

38
HUB2x(2x6) Ports
PLN
Generator75kwh - 380V
ServerHD : 5 level, 27GB
Mojokerto
InkjetPrinter
Sub Master
InkjetPrinter
Lab.
LaserPrinter
Sub Master
ClientWorkstationR. Div. IV/2
ClientWorkstation
Lab.
ClientWorkstationSub Master
AutomaticControl
Panel5 sec.
Netw
ork Cable (U
TP 5 CA
T)
Mojokerto Sub Master
Station
Intranet
Router ISDN V.35,56Kbps/2Mbps
Div. IV/2 Lab
Plug Network
NEW SYSTEM
Lab. Offline Data/Lab. Mobile
PERUSAHAAN UMUM JASA TIRTA INFORMATION OF TECHNOLOGY DIAGRAM
(MANAGEMENT INFORMATION SYSTEM)
Dot Matrix A3 PrinterW. Quantity
Dot Matrix A3Printer
W. Quality
Remote CentralControl Unit #2
W. Quality
Remote CentralControl Unit #1W. Quantity
Web Workstation&
FirewallMaster
ClientWorkstation
Lab.
ClientWorkstationW. Quality
ClientWorkstationW. Quantity
ClientWorkstation
Litbang
DSSWorkstation
Litbang
DSSWorkstation
Master
GIS DSSWorkstation
Master
Equipment of FFWSincl. interface
7 Rainfall & 7 W. LevelOnline MonitoringStation (BRWQM)
(Radio Transmission)
23 W. QualityOnline MonitoringStation (BRWQM)
(Telephone Modem)
Switches2 Ports 100Mbit2X12 Ports 10Mbit
LaptopPresentation
Master
PLN
UPS, 15 minutesIncl. : SAT, AVR, CVCF
UPS, 15 minutes, Incl. :SAT : Surge Absorb
TransformerAVR : Automatic Voltage
RegulatorCVCF : Constant Voltage
Constant Freq.
LaserPrinterMaster
Plotter A0PrinterMaster
InkjetPrinterMaster
InkjetPrinterLitbang
InkjetPrinter
W. Quantity
LaserPrinter
Lab.
R. Sidang 1 R. Sidang 2 R. RapatDireksi
R. DirekturUtama
R. DirekturTeknik
R. DirekturAdm. & Keu.
R. TamuDireksi
R. DirekturPengelolaan
R. Litbang R. Master& W. Qy & W. Qn
Plug Network
Scanner A3
Network Cable (UTP 5 CAT)
R. Lab
Modem#156Kbps
15 min./30min./Hourly/Daily
Dial UpDaily/Hourly/
Weekly
MalangMaster StationIntranet
RS 232
Offline data :Sgr, K.Kates
Wlingi, T. AgungKediri, Bening
S.baya
Modem#156Kbps
21 W. Level &10 Outflow Setting PanelOnline MonitoringStation (FFWS)
26 RainfallOnline Monitoring
Station (FFWS)
SwitchRCCU
DisplayPanelExisting FFWS
FFWS
d:\lely\dtpower\it.ppt [syam]
Dial UpWeekly/Monthly
SQL Net
Server LAN ASGLCentral Database
HD : 10GBMaster
Client ASGL WorkstationB.Keu, SDM, UMM, BPU, BP2
DSS ASGL WorkstationB.Keu, Master
ManagerialIntranet
Dot Matrix A3 Printer FFWS TerminalMonitor
EXISTING SYSTEM
NEW SYSTEMInterface
Modem56Kbps
www.jasatirta.go.idwww.kbw.go.idwww.pu.go.id
Internet(Public Connection)Semi Static HTML
Internet
InternetService Provider
(ISP)
Lab. Offline Data/Lab. Mobile
6 Repeater Station(Radio Transmission)
15min./30mi
n./Hourl
y
5 Repeater Station(Radio Transmission)
Switches2 Ports 100Mbit
2X12 Ports 10Mbit
EXISTINGSYSTEM
Modem56Kbps
Router Integrated Service Digital Network
(ISDN)V.35, 56Kbps/2Mbps
Automatic ControlPanel 5 sec.
Generator75KwH380V
SQL Net/PlusDial UpHourly/Daily/Weekly
DinamycHTML
Server CentralHD : 5 level, 50GB
PLNGenerator
75KwH380V
UPS, 15 minutesIncl. : SAT, AVR, CVCF
Automatic ControlPanel 5 sec.
DisplayPanelW. Quality
FloodSimulationComputer

39
Software :a. Operating System
- Windows NT 4 Server- Windows BackOffice Server- Windows 2000 Server
b. Programmer Language- Ms. Access Visual Basic BHIS, TimeSeriesServer- Delphi Borland Hydras, Logotronic, Mermaid
c. Programme System- Fontpage Pembuatan Web Page- Microsoft Office Dokumentasi- Norton Utilities Keamanan Virus- Microsoft Exchange Mail Server- GeoMedia Professional Sistem Geografi- Read Win Industrial Flow Meter- Oracle Manajemen Database- Structure Query Language Pemrograman Database
d. Decision Support System- Hydrology Remote Access System Pemantauan Kualitas Air- Logotronic Pemantauan Banjir- Brantas Hydrology Information System Pusat Database- HEC HMS Simulasi Banjir- Nopolu Simulasi Polusi Kualitas Air- Dam Safety Pemantauan Keamanan Tubuh Bendungan- TimeSeriesServer Interface FFWS & BHIS- Profile Sedimen Pemantauan Sedimen Sungai & Waduk- Flood Forecasting Warning System (FFWS) Pemantauan Banjir- Climate Data Simulasi Klimatology- Bio Assesment Pemantauan Microbiology- Water Resources Management Model (WRMM) Pemantauan Alokasi Air Sungai- Mermaid Pemantauan Kualitas Air Kali Surabaya
MANAGEMENT INFORMASI SYSTEM (MIS)

404
Management of all chemical, physical, biological, hydraulic as well as environment and climate-related data for a comprehensive assessment of water quality and quantity in the river basin.
Central Database
Online Monitoring Systems
Simulation Applications
1
2
General User Interface for Data of ...
Water Quality Laboratories 3
Decision Supporting Applications4
Offline Monitoring Systems5
Geographical Information System6
GIS
Laboratories
ModelsFF
WRMPP
GUI
GUI
GUI
Online Monitoring
QualityQuantity
DecisionSupporting
Applications
Offline Monitoring
QualityQuantity
DSS
DSS
DSS
DSS
DSS
DSS
GUI
GU
I GU
IHIS
GIS
Laboratories
ModelsFF
WRMPP
GUI
GUI
GUI
Online Monitoring
QualityQuantity
DecisionSupporting
Applications
Offline Monitoring
QualityQuantity
DSS
DSS
DSS
DSS
DSS
DSS
GUI
GU
I GU
IHIS
GUI General User Interface
DSS Decision Support System
FF Flood Forecasting WRM Water Resource
ManagementPP Pollution
Propagation GIS Geographical
Information System
The Brantas HIS Forms a Powerful Decision Support SystemThe Brantas HIS Forms a Powerful Decision Support System
Information Technology(The Online-Monitoring Data Integrates with the Brantas Hydrological Information System / BHIS
Based on a Central Database)

41
LOGOTRONIC
HYDRAS
FFWS
MERMAID
READ WIN
ZA32
H32ORACLE
TIMESERIESSERVER
MERMAID2BHIS
IMPORTEXPORT
IMPORTEXPORT
IMPORTEXPORT
BHIS
16 STATION3 PARAMETER
23 STATION7 PARAMETER
44 STATION3 PARAMETER
1 STATION12 PARAMETER
12 STATION1 PARAMETER
DATA COMUNICATION SCEME
OtomaticManual

42
BRANTAS HYDROLOGICAL INFORMATION SYSTEM
Figure 1. Schematic overview HW Equipment Master Submaster Station
G IS
W A S
F F W S
W R M M
N o p o lu
B H IS
G U I
G U I
G U I
G U I
G U I
G U I
D B
D B
D B
D B
D B
D B
Figure 2. Stand-alone Solution: Each Application communicates to the others through a complex, deregulated Data Transfer Network
Figure 3. Integration Concept
DATA# DATA_PK* TIMEo DEPTH* VALUE
PARAMETER# PARAMETER_PK* NAMEo UNITo TYPE
STATION# STATION_PK* NAMEo GDO_GID
STATION_PARAMETER# STATION_PARAMETER_P
Figure 4. Example of Tables and their Relations

43
BRANTAS HYDROLOGICAL INFORMATION SYSTEM
Figure 9 Schematic Brantas Home Page Intranet/Internet Brantas Home Page - Main Page
Brantas Home Page – Water Quality On-Line ViewingBrantas Home Page – Water Quantity On-Line Viewing
44
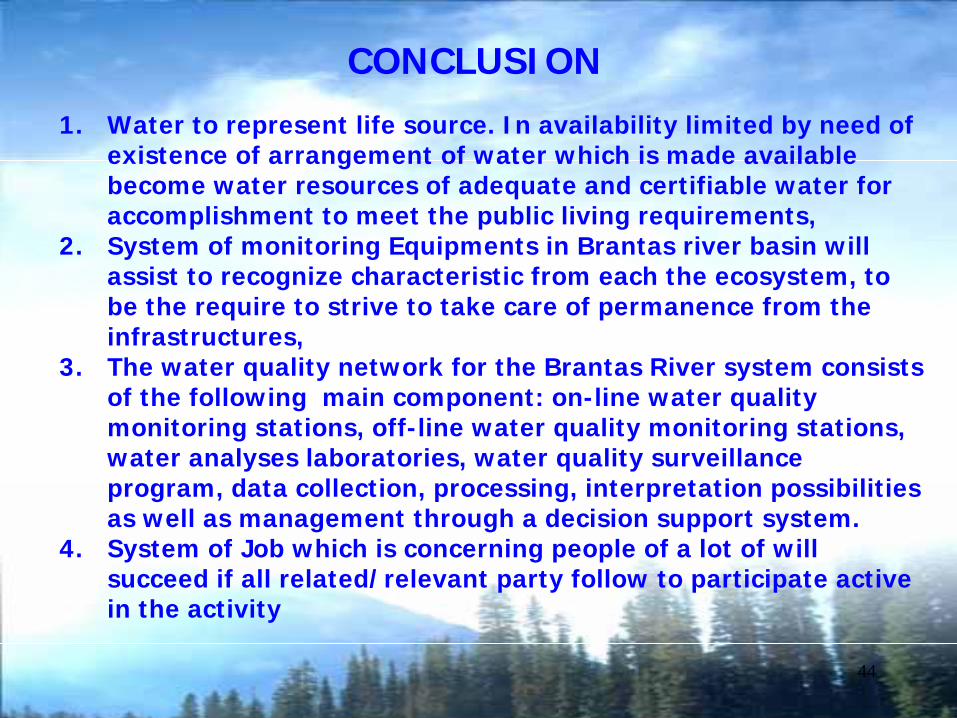
1. Water to represent life source. In availability limited by need of existence of arrangement of water which is made available become water resources of adequate and certifiable water for accomplishment to meet the public living requirements,
2. System of monitoring Equipments in Brantas river basin will assist to recognize characteristic from each the ecosystem, to be the require to strive to take care of permanence from the infrastructures,
3. The water quality network for the Brantas River system consists of the following main component: on-line water quality monitoring stations, off-line water quality monitoring stations, water analyses laboratories, water quality surveillance program, data collection, processing, interpretation possibilities as well as management through a decision support system.
4. System of Job which is concerning people of a lot of will succeed if all related/relevant party follow to participate active in the activity
CONCLUSION

45
Thank you very much


