Water Pollution Graphing - Utah State University...
21
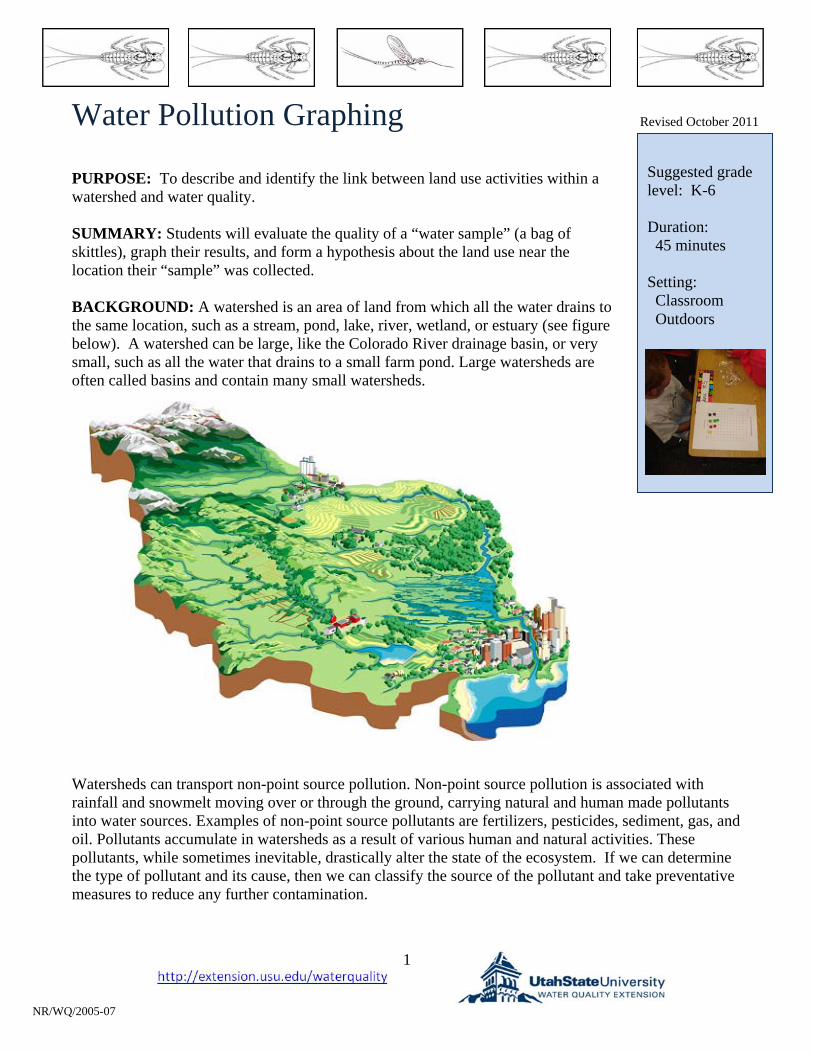
1 NR/WQ/2005-07 Water Pollution Graphing PURPOSE: To describe and identify the link between land use activities within a watershed and water quality. SUMMARY: Students will evaluate the quality of a “water sample” (a bag of skittles), graph their results, and form a hypothesis about the land use near the location their “sample” was collected. BACKGROUND: A watershed is an area of land from which all the water drains to the same location, such as a stream, pond, lake, river, wetland, or estuary (see figure below). A watershed can be large, like the Colorado River drainage basin, or very small, such as all the water that drains to a small farm pond. Large watersheds are often called basins and contain many small watersheds. Watersheds can transport non-point source pollution. Non-point source pollution is associated with rainfall and snowmelt moving over or through the ground, carrying natural and human made pollutants into water sources. Examples of non-point source pollutants are fertilizers, pesticides, sediment, gas, and oil. Pollutants accumulate in watersheds as a result of various human and natural activities. These pollutants, while sometimes inevitable, drastically alter the state of the ecosystem. If we can determine the type of pollutant and its cause, then we can classify the source of the pollutant and take preventative measures to reduce any further contamination. Revised October 2011 Suggested grade level: K-6 Duration: 45 minutes Setting: Classroom Outdoors
-
Upload
trinhduong -
Category
Documents
-
view
217 -
download
0
Transcript of Water Pollution Graphing - Utah State University...
1
NR/WQ/2005-07
Water Pollution Graphing PURPOSE: To describe and identify the link between land use activities within a watershed and water quality. SUMMARY: Students will evaluate the quality of a “water sample” (a bag of skittles), graph their results, and form a hypothesis about the land use near the location their “sample” was collected. BACKGROUND: A watershed is an area of land from which all the water drains to the same location, such as a stream, pond, lake, river, wetland, or estuary (see figure below). A watershed can be large, like the Colorado River drainage basin, or very small, such as all the water that drains to a small farm pond. Large watersheds are often called basins and contain many small watersheds.
Watersheds can transport non-point source pollution. Non-point source pollution is associated with rainfall and snowmelt moving over or through the ground, carrying natural and human made pollutants into water sources. Examples of non-point source pollutants are fertilizers, pesticides, sediment, gas, and oil. Pollutants accumulate in watersheds as a result of various human and natural activities. These pollutants, while sometimes inevitable, drastically alter the state of the ecosystem. If we can determine the type of pollutant and its cause, then we can classify the source of the pollutant and take preventative measures to reduce any further contamination.
Revised October 2011
Suggested grade level: K-6 Duration: 45 minutes Setting: Classroom Outdoors
2
NR/WQ/2005-07
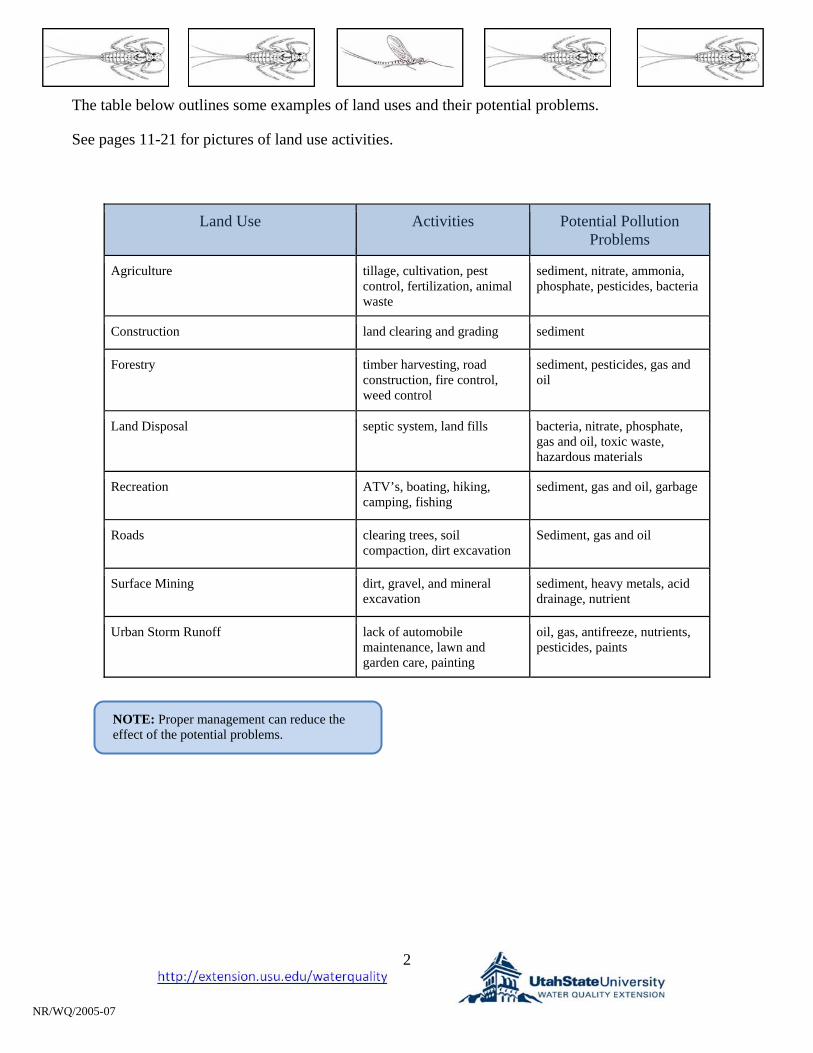
The table below outlines some examples of land uses and their potential problems.
See pages 11-21 for pictures of land use activities.
Land Use Activities Potential Pollution Problems
Agriculture tillage, cultivation, pest control, fertilization, animal waste
sediment, nitrate, ammonia, phosphate, pesticides, bacteria
Construction land clearing and grading sediment
Forestry timber harvesting, road construction, fire control, weed control
sediment, pesticides, gas and oil
Land Disposal septic system, land fills bacteria, nitrate, phosphate, gas and oil, toxic waste, hazardous materials
Recreation ATV’s, boating, hiking, camping, fishing
sediment, gas and oil, garbage
Roads clearing trees, soil compaction, dirt excavation
Sediment, gas and oil
Surface Mining dirt, gravel, and mineral excavation
sediment, heavy metals, acid drainage, nutrient
Urban Storm Runoff lack of automobile maintenance, lawn and garden care, painting
oil, gas, antifreeze, nutrients, pesticides, paints
NOTE: Proper management can reduce the effect of the potential problems.
3
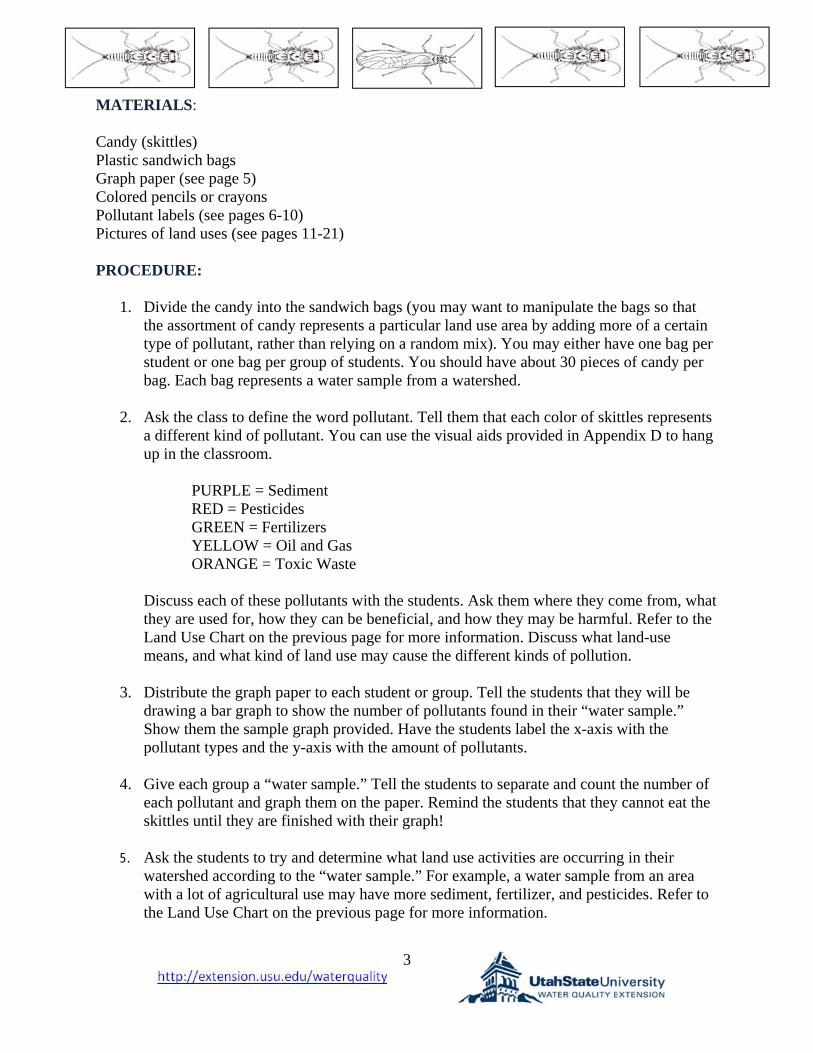
MATERIALS: Candy (skittles) Plastic sandwich bags Graph paper (see page 5) Colored pencils or crayons Pollutant labels (see pages 6-10) Pictures of land uses (see pages 11-21) PROCEDURE:
1. Divide the candy into the sandwich bags (you may want to manipulate the bags so that the assortment of candy represents a particular land use area by adding more of a certain type of pollutant, rather than relying on a random mix). You may either have one bag per student or one bag per group of students. You should have about 30 pieces of candy per bag. Each bag represents a water sample from a watershed.
2. Ask the class to define the word pollutant. Tell them that each color of skittles represents
a different kind of pollutant. You can use the visual aids provided in Appendix D to hang up in the classroom.
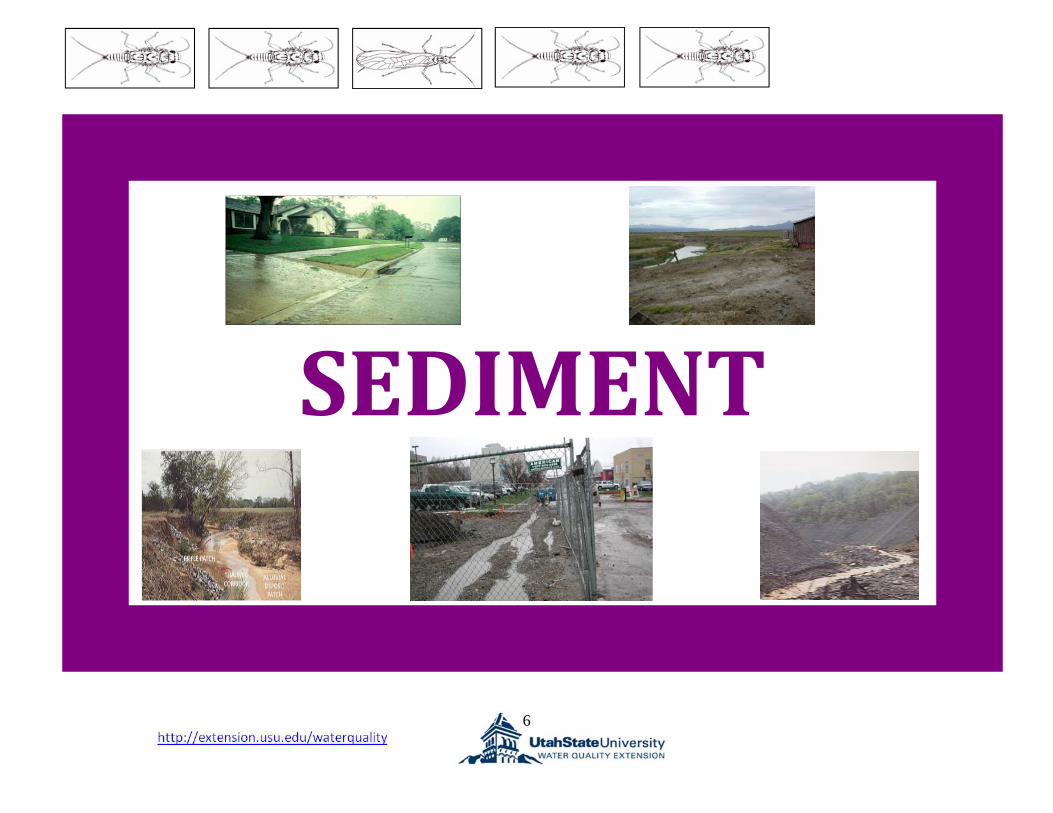
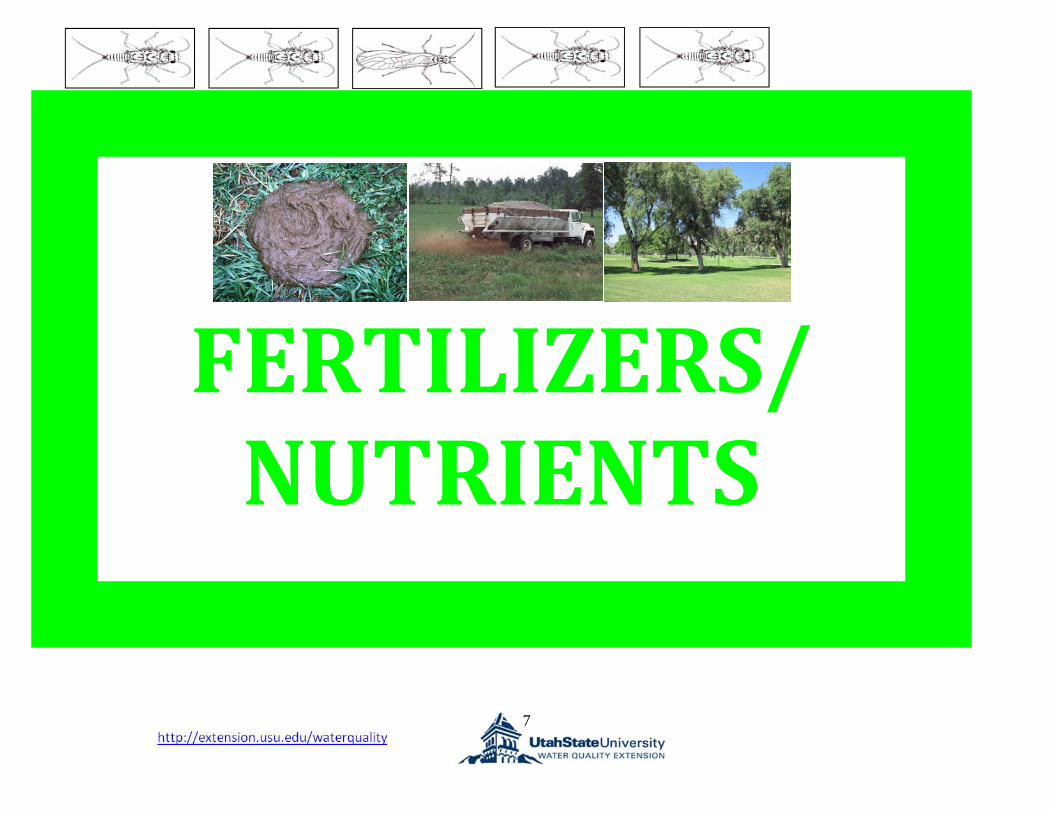
PURPLE = Sediment RED = Pesticides GREEN = Fertilizers YELLOW = Oil and Gas ORANGE = Toxic Waste
Discuss each of these pollutants with the students. Ask them where they come from, what they are used for, how they can be beneficial, and how they may be harmful. Refer to the Land Use Chart on the previous page for more information. Discuss what land-use means, and what kind of land use may cause the different kinds of pollution.
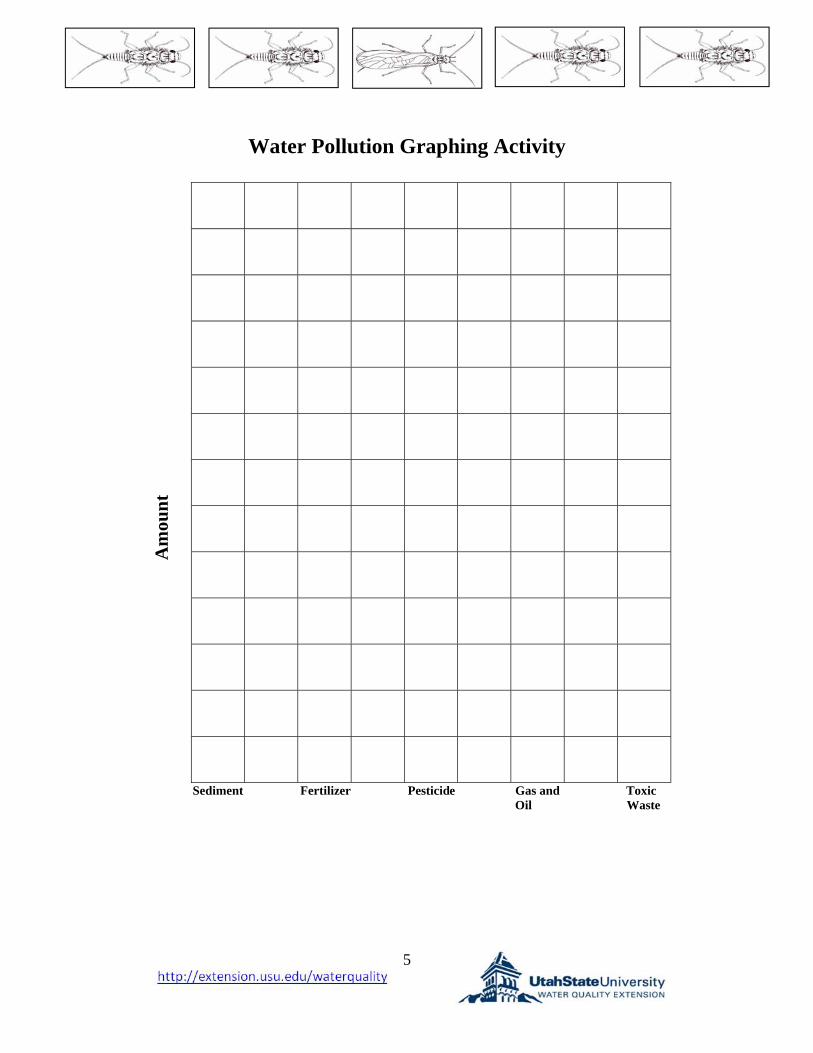
3. Distribute the graph paper to each student or group. Tell the students that they will be drawing a bar graph to show the number of pollutants found in their “water sample.” Show them the sample graph provided. Have the students label the x-axis with the pollutant types and the y-axis with the amount of pollutants.
4. Give each group a “water sample.” Tell the students to separate and count the number of
each pollutant and graph them on the paper. Remind the students that they cannot eat the skittles until they are finished with their graph!
5. Ask the students to try and determine what land use activities are occurring in their
watershed according to the “water sample.” For example, a water sample from an area with a lot of agricultural use may have more sediment, fertilizer, and pesticides. Refer to the Land Use Chart on the previous page for more information.
4
6. Discuss how each water sample is different. While some samples might contain an
abundance of one type of pollution, almost all types of pollutants can be found in every sample (even if they are small amounts). Discuss strategies to reduce pollution. How can the students do this on a large scale (in their community) or small scale (in their own home)? In the community:
Encourage friends and neighbors to recycle Plan a science fair project about water quality and reducing pollution Talk to friends and neighbors about what they have learned Pick up trash in your neighborhood
In the home
Encourage parents to fix leaky cars Talk to parents about using less fertilizers and pesticides Recycle items at home Do not dump oil, gas, or other pollutants in the storm drains
Utah State University is an affirmative action/equal opportunity institution.
NR/WQ/2005-07
NOTE: Be sure the students understand that the factors (materials) we consider non-point source pollutants only become a problem when they are used incorrectly. For example, oil and gas become a problem when they are leaking onto the ground and washing into a water body. Fertilizers and pesticides become a problem when too many are applied and they run off into a water body.
5
Water Pollution Graphing Activity
Am
oun
t
Sediment Fertilizer Pesticide Gas and Toxic Oil Waste
6
SEDIMENT
7
FERTILIZERS/ NUTRIENTS
8
PESTICIDES
9
OIL AND GAS
10
TOXIC WASTE
11
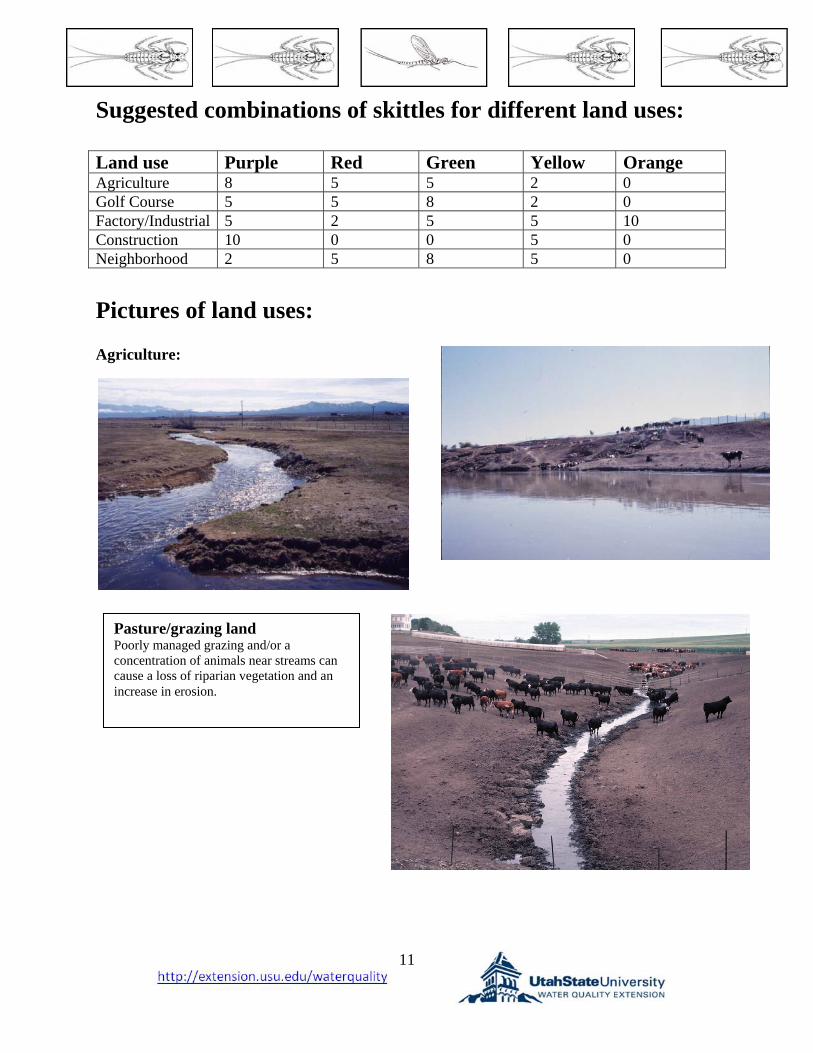
Suggested combinations of skittles for different land uses: Land use Purple Red Green Yellow Orange Agriculture 8 5 5 2 0 Golf Course 5 5 8 2 0 Factory/Industrial 5 2 5 5 10 Construction 10 0 0 5 0 Neighborhood 2 5 8 5 0
Pictures of land uses: Agriculture:
Pasture/grazing land Poorly managed grazing and/or a concentration of animals near streams can cause a loss of riparian vegetation and an increase in erosion.
12
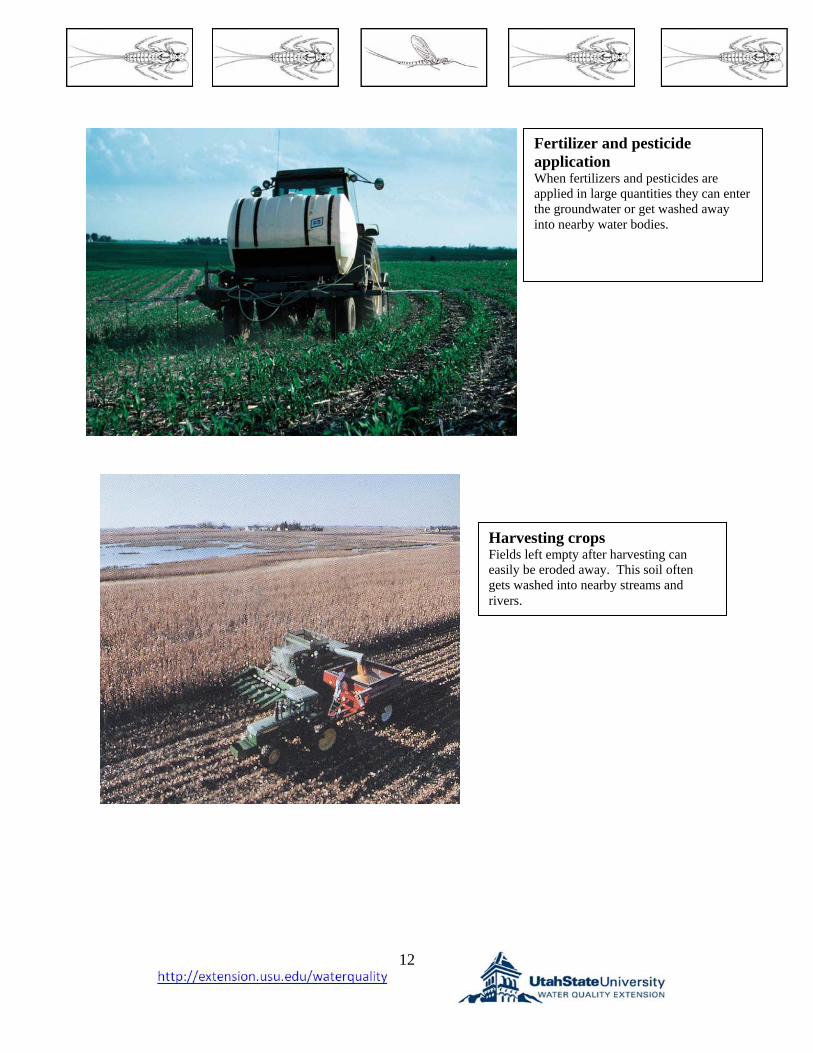
Fertilizer and pesticide application When fertilizers and pesticides are applied in large quantities they can enter the groundwater or get washed away into nearby water bodies.
Harvesting crops Fields left empty after harvesting can easily be eroded away. This soil often gets washed into nearby streams and rivers.
13
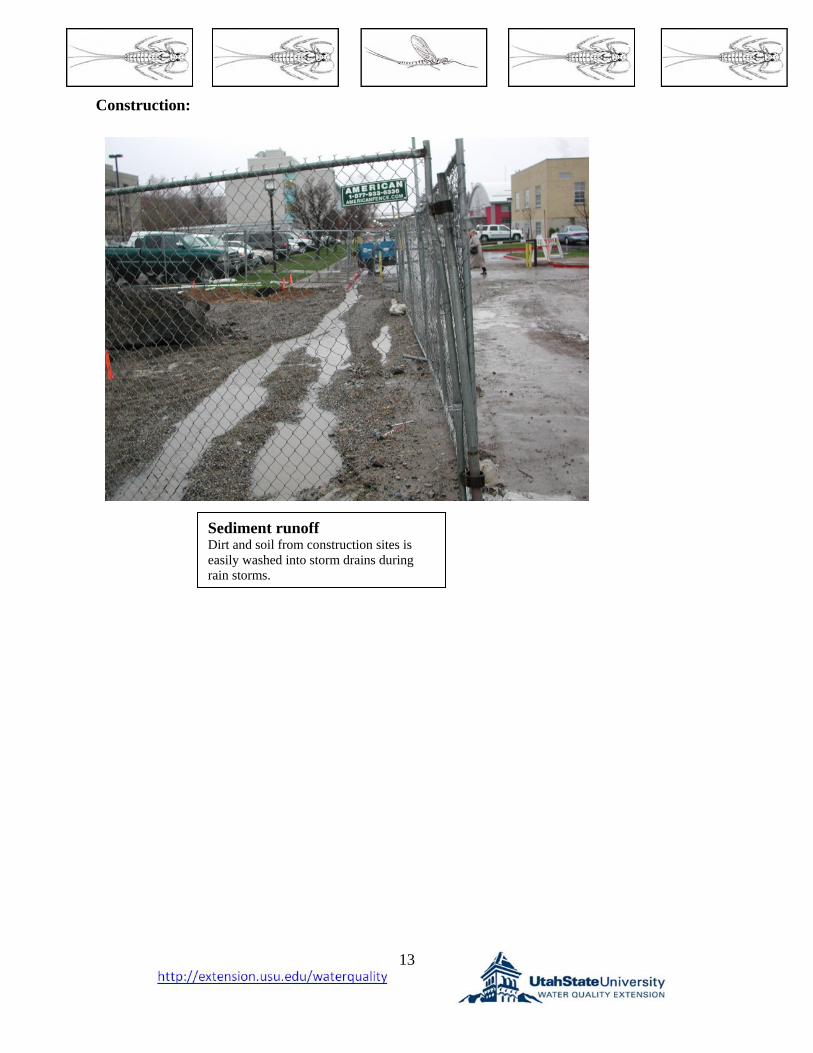
Construction:
Sediment runoff Dirt and soil from construction sites is easily washed into storm drains during rain storms.
14
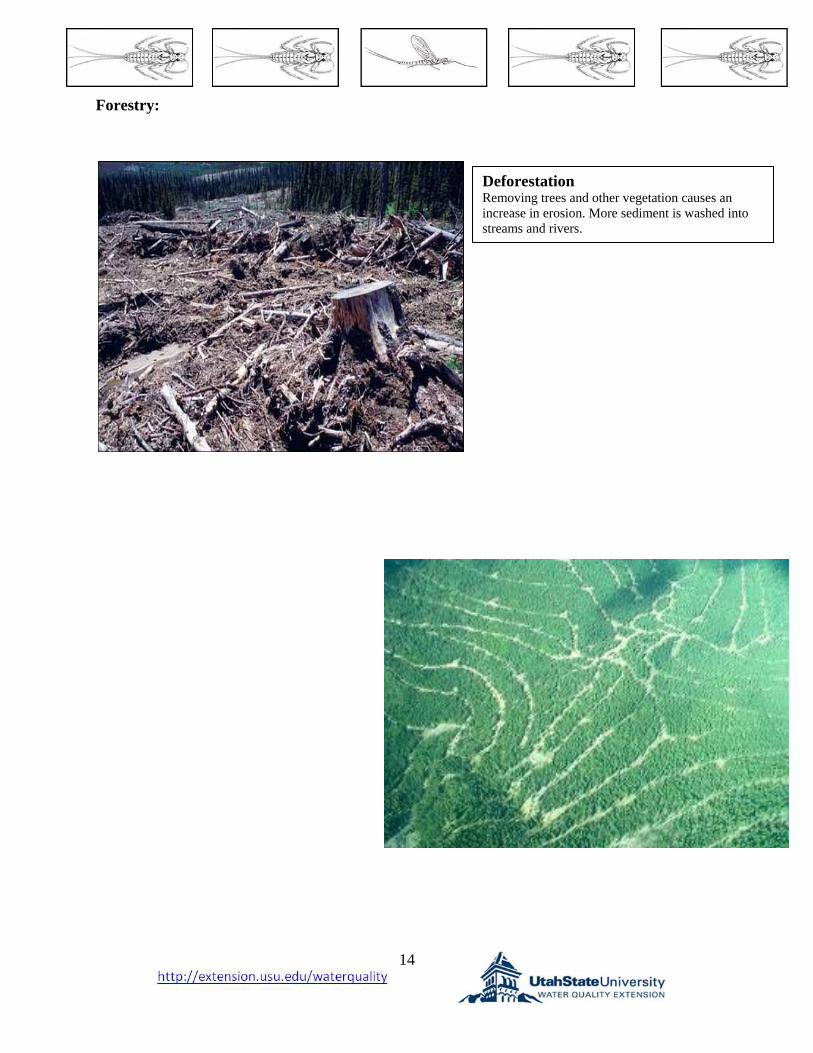
Forestry:
Deforestation Removing trees and other vegetation causes an increase in erosion. More sediment is washed into streams and rivers.
15
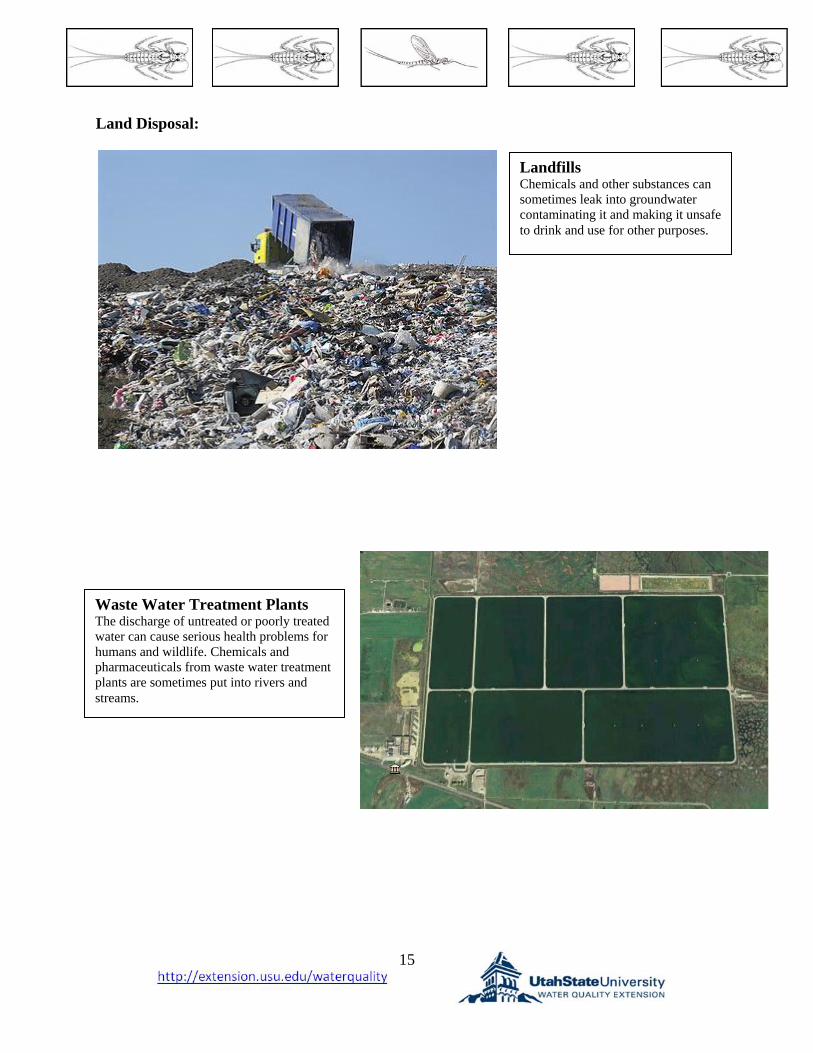
Land Disposal:
Landfills Chemicals and other substances can sometimes leak into groundwater contaminating it and making it unsafe to drink and use for other purposes.
Waste Water Treatment Plants The discharge of untreated or poorly treated water can cause serious health problems for humans and wildlife. Chemicals and pharmaceuticals from waste water treatment plants are sometimes put into rivers and streams.
16
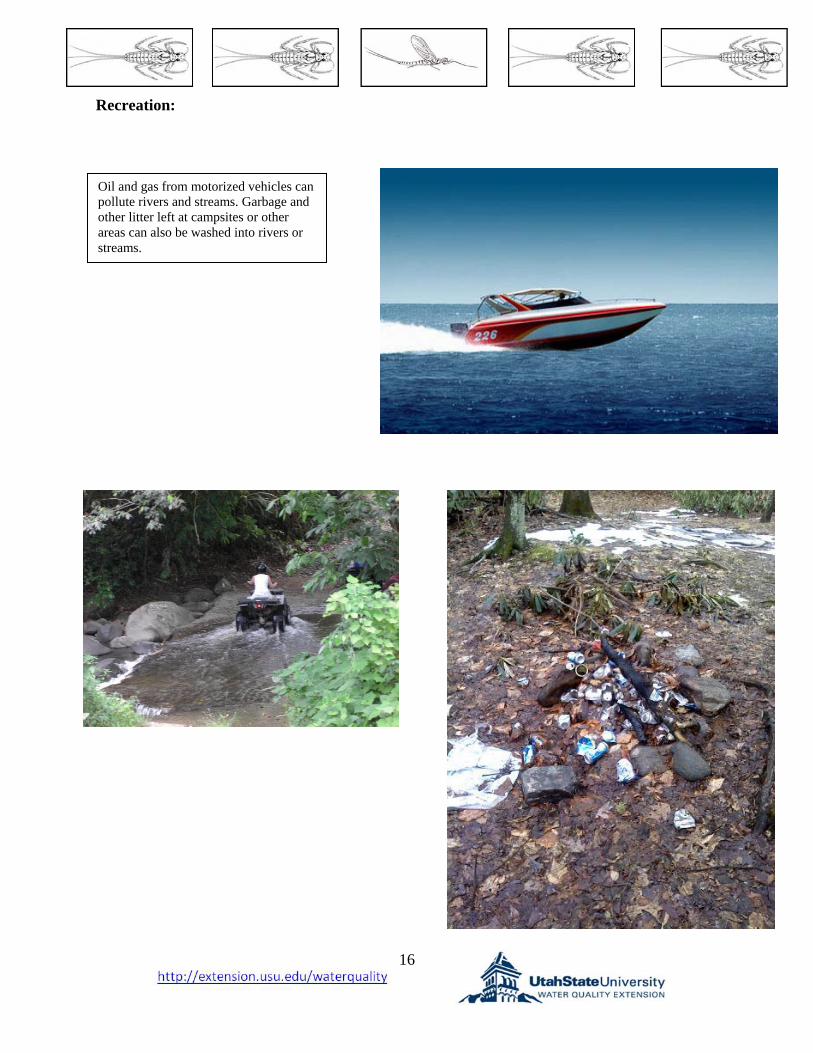
Recreation:
Oil and gas from motorized vehicles can pollute rivers and streams. Garbage and other litter left at campsites or other areas can also be washed into rivers or streams.
17
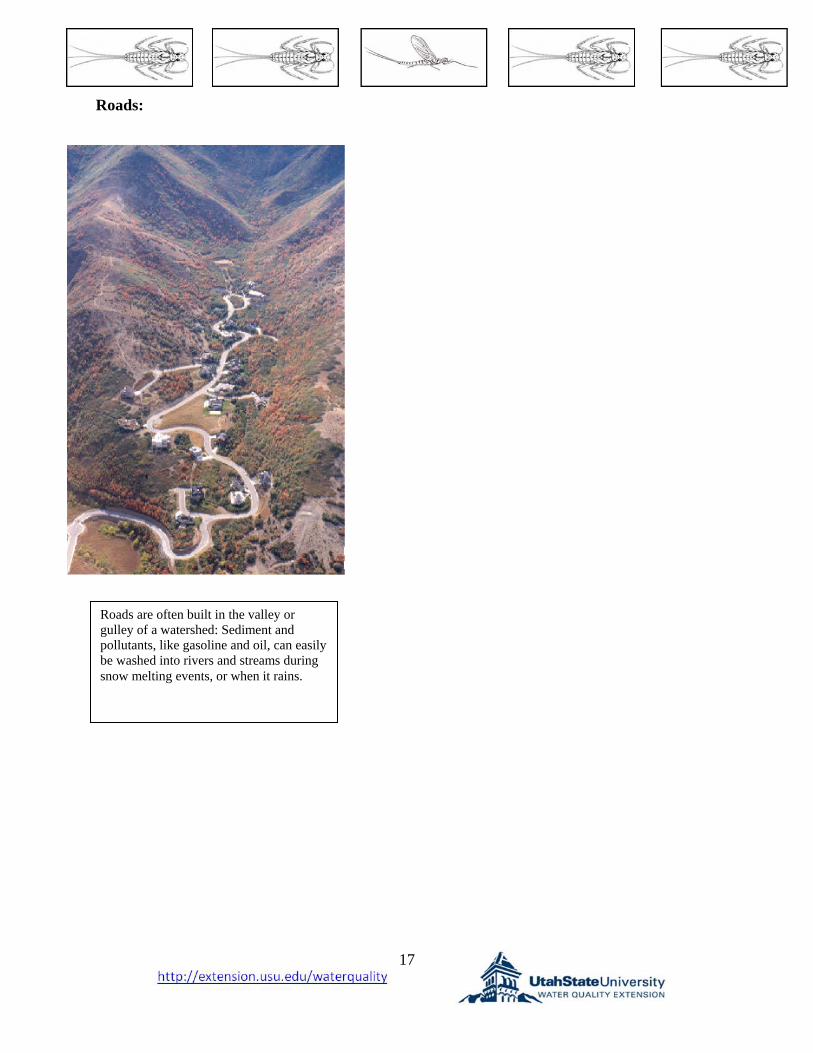
Roads:
Roads are often built in the valley or gulley of a watershed: Sediment and pollutants, like gasoline and oil, can easily be washed into rivers and streams during snow melting events, or when it rains.
18
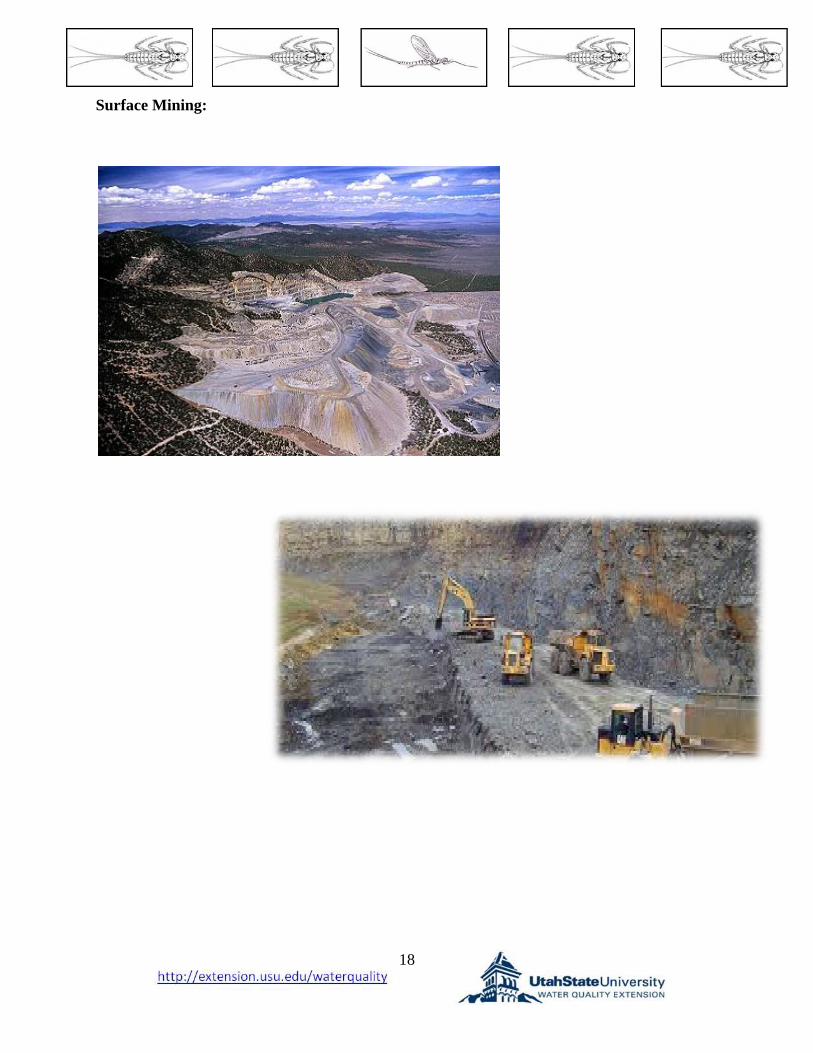
Surface Mining:
19
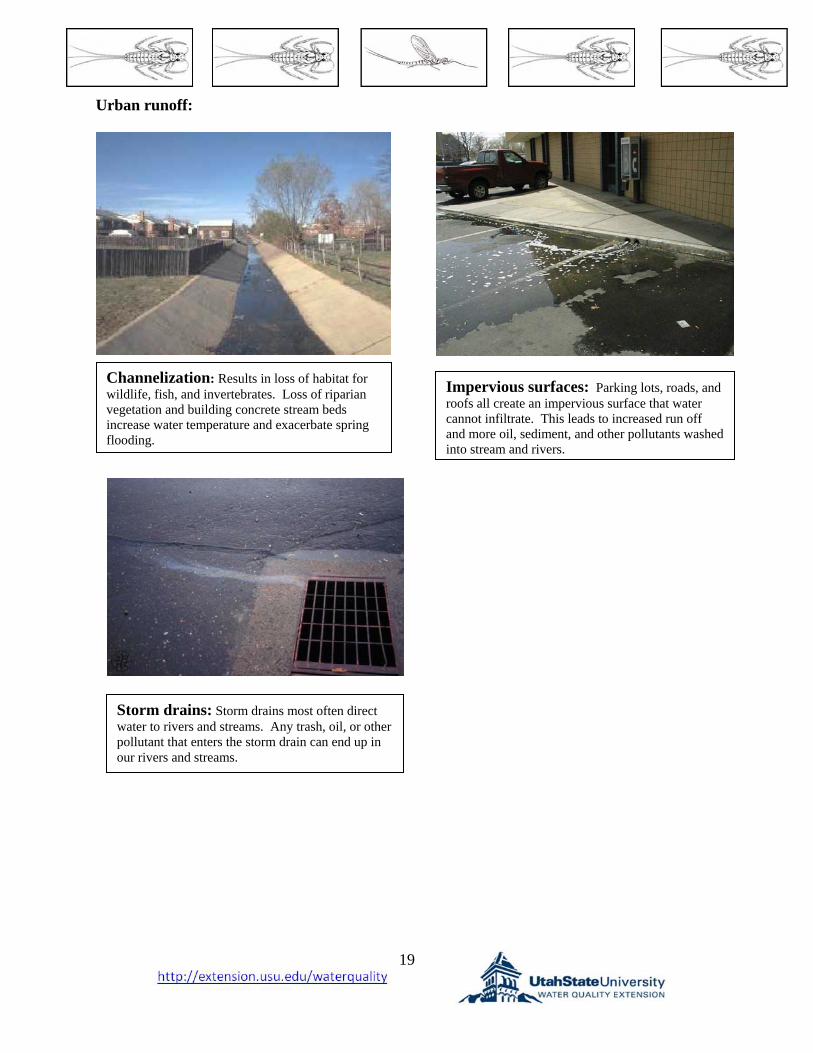
Urban runoff:
Channelization: Results in loss of habitat for wildlife, fish, and invertebrates. Loss of riparian vegetation and building concrete stream beds increase water temperature and exacerbate spring flooding.
Impervious surfaces: Parking lots, roads, and roofs all create an impervious surface that water cannot infiltrate. This leads to increased run off and more oil, sediment, and other pollutants washed into stream and rivers.
Storm drains: Storm drains most often direct water to rivers and streams. Any trash, oil, or other pollutant that enters the storm drain can end up in our rivers and streams.
20
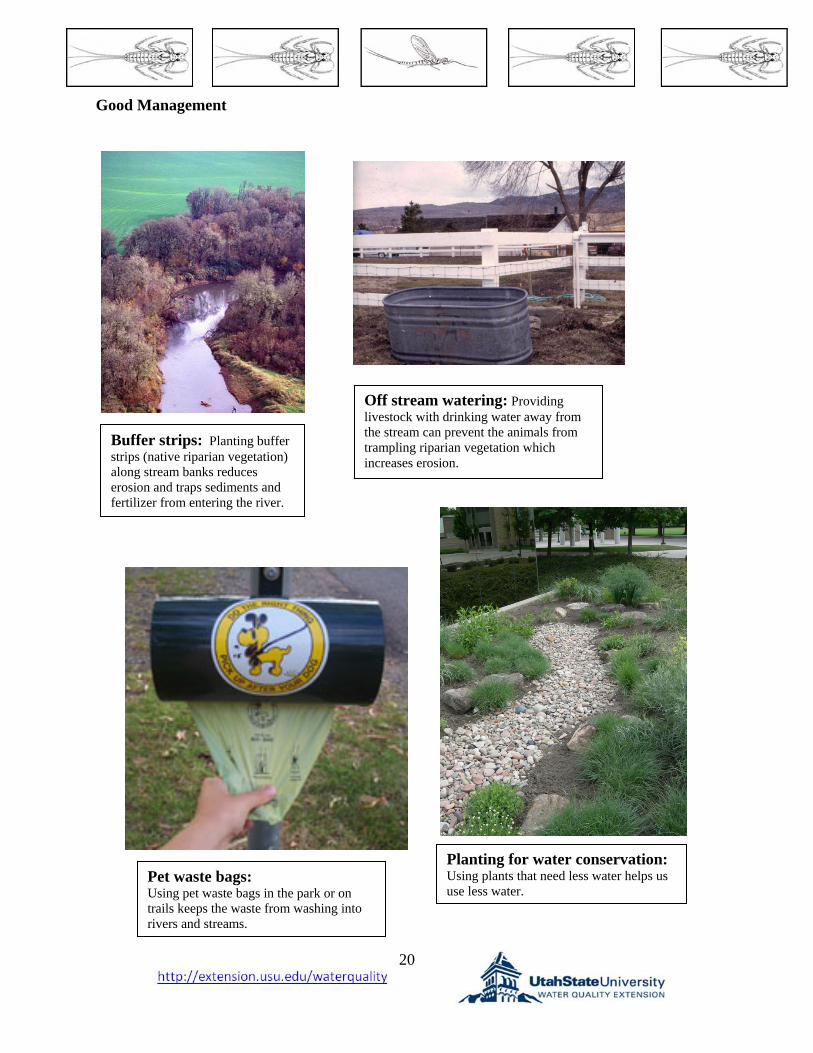
Good Management
Buffer strips: Planting buffer strips (native riparian vegetation) along stream banks reduces erosion and traps sediments and fertilizer from entering the river.
Off stream watering: Providing livestock with drinking water away from the stream can prevent the animals from trampling riparian vegetation which increases erosion.
Planting for water conservation: Using plants that need less water helps us use less water.
Pet waste bags: Using pet waste bags in the park or on trails keeps the waste from washing into rivers and streams.
21
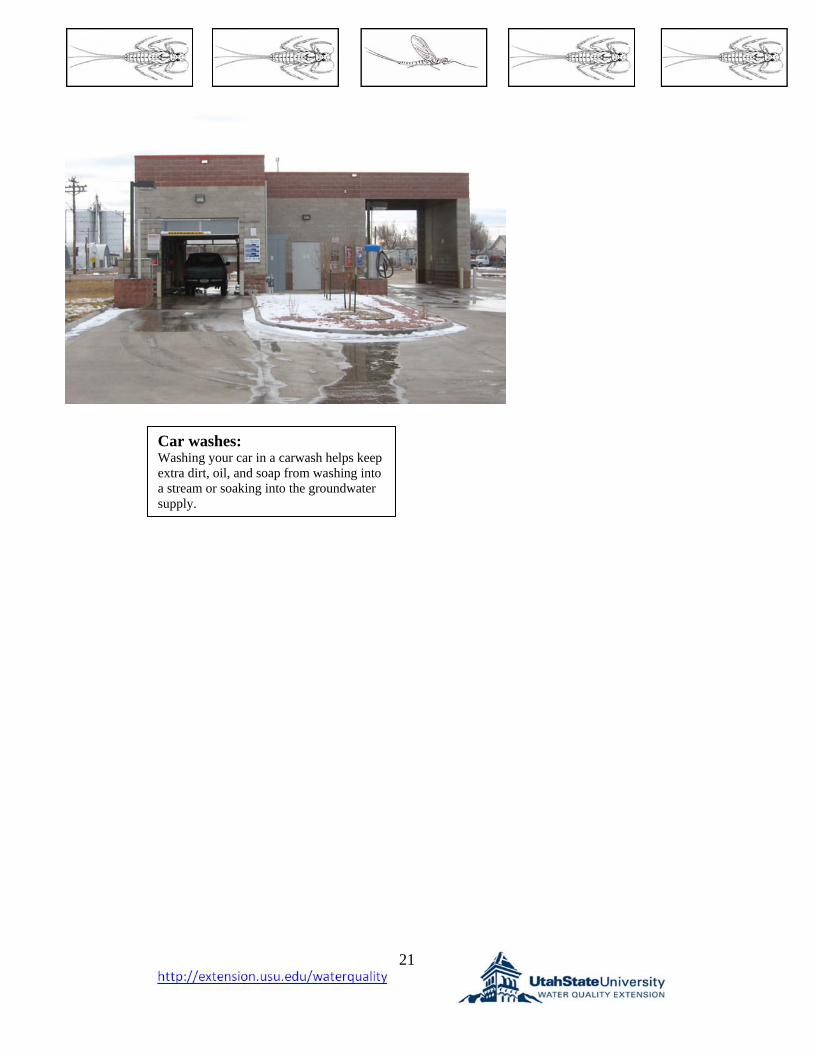
Car washes:
Washing your car in a carwash helps keep extra dirt, oil, and soap from washing into a stream or soaking into the groundwater supply.