
Wastewater UV Disinfection - Better Buildings Initiative · 2018-08-16 · UV Chemical...
33
www.jacobs.com | worldwide Wastewater UV Disinfection Samuel Jeyanayagam, PhD, PE, BCEE, WEF Fellow Vice President Regional Solutions Lead – US North [email protected]
Transcript of Wastewater UV Disinfection - Better Buildings Initiative · 2018-08-16 · UV Chemical...

www.jacobs.com | worldwide
Wastewater UV Disinfection
Samuel Jeyanayagam, PhD, PE, BCEE, WEF Fellow
Vice President
Regional Solutions Lead – US North

• Safety Moment
• Technology overview
• Regulatory challenges
• Technology challenges
• Design & operational challenges
• Closing thoughts
Presentation Outline
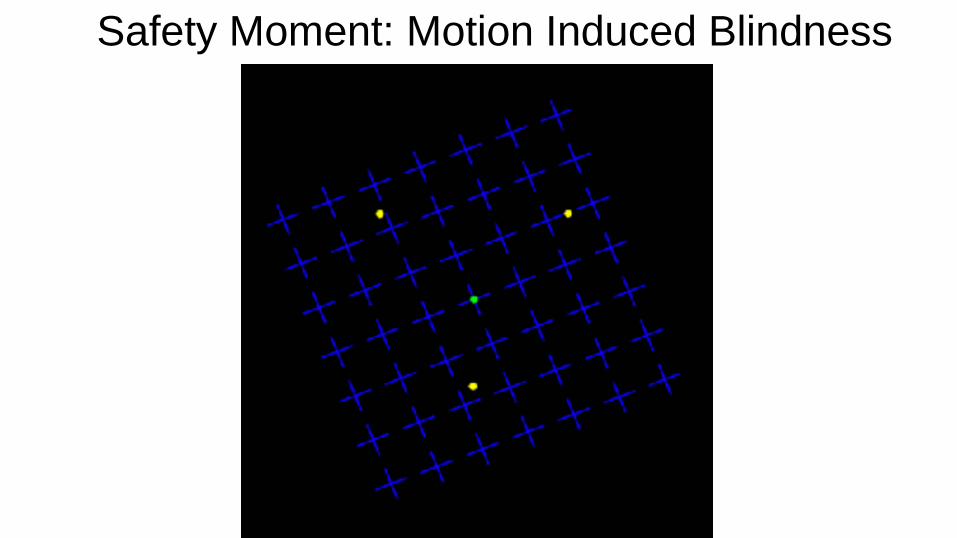
Safety Moment: Motion Induced Blindness
Motion Induced Blindness
• When driving, if you fix your gaze on the road straight
ahead, you may suffer a momentary loss of peripheral
vision & may not see a vehicle or person approaching
from the side.
• Always use the “eyes moving” technique when driving,
to reduce the risk of motion induced blindness.
• Now reverse the picture! If you are crossing a road on
foot and you see a car approaching, there’s a very
good chance you may be in that drivers blind zone!!
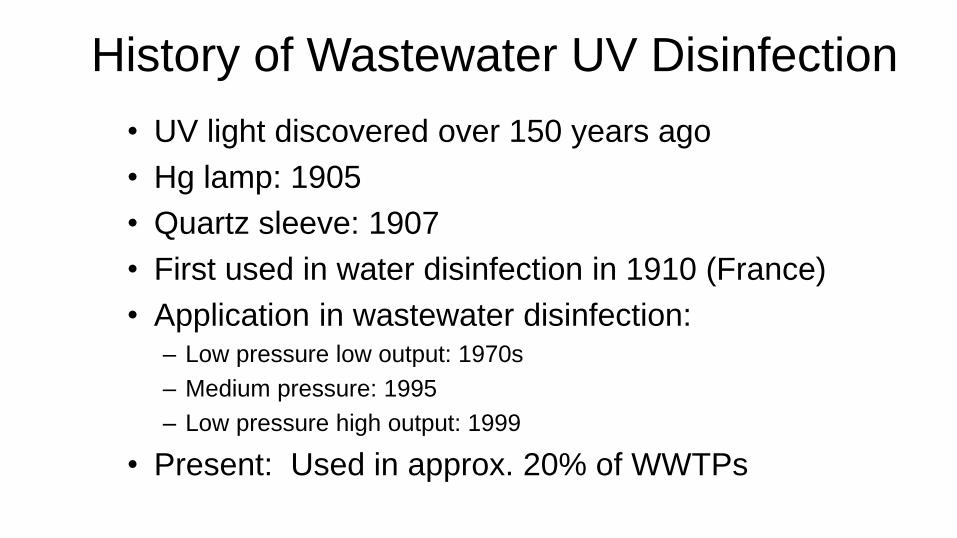
History of Wastewater UV Disinfection
• UV light discovered over 150 years ago
• Hg lamp: 1905
• Quartz sleeve: 1907
• First used in water disinfection in 1910 (France)
• Application in wastewater disinfection:– Low pressure low output: 1970s
– Medium pressure: 1995
– Low pressure high output: 1999
• Present: Used in approx. 20% of WWTPs

What is UV Light?
Vacuum UV UVC UVB UVA
2993804275981196Energy
kJ/mol

What is UV Dose?
I = UV intensity (mW/cm2)
t = Exposure time (seconds)
Dose = mW-sec/cm2
= mJ/cm2
UV Dose = I*t
What is UV Dose?

UV Chemical Disinfectants
UV Disinfection
UV vs. Chemical DisinfectionProperty Chemical UV Light
Pathogen Mixed & flows with the
disinfectant
Flows through a fixed
UV field
Residual Very important. Measure of
disinfection effectiveness
None
Residence time Very important. Measure of
disinfection effectiveness
Very short. Not as
important
Concentration / light
intensityRelatively uniform
concentration
Uneven intensity
distribution
Inactivation
mechanismPhysical damage. No
reactivation
DNA restructured.
Reactivation possible
Reactivation potential None Yes

• Technology overview
• Regulatory challenges• Technology challenges
• Design & operational challenges
• Closing thoughts
Presentation Outline

• Indicator organism
– Total coliform
– Fecal coliform
– E. Coli
– Enterococci
– Viruses?
• Reuse
– Getting closer to drinking water standards
– Disinfection by products
– Microconstituents
– Emerging pathogens
• Wet weather disinfection
Regulatory Challenges

Current Regulatory Scene
• The 2012 Recreational Water Quality Criteria recommendations have been adopted by many (not all) states
Indicator Recommendation 1
(Illness rate: 36/1,000)
Recommendation 2
(Illness rate: 32/1,000)
Geometric
Mean
Statistical
Threshold Value
Geometric
Mean
Statistical
Threshold Value
Enterococci
(marine & fresh)
35 130 30 110
E. Coli
(fresh)
126 410 100 320
STV: Not to be exceeded by >10% of the samples

The Need for Virus Indicator
USEPA’s position:
– Viruses are the leading cause of recreational
water borne diseases
– Bacterial indicators provide protection against
bacterial pathogens not viruses
To enhance public health protection, USEPA
will be revising the WQ criteria to include viral
indicator
Focus is on coliphages - viruses that infect
coliformsSomatic Coliphage

Future Virus Criterion
Schedule
• EPA has released the literature review of scientific information in
support of its position
• Draft criteria for public comment expected in 2018-2019
• Final criteria expected in 2019-2020?
Potential impact on disinfection
• Viruses generally more resistant to disinfection compared
bacteria
• Combined chlorine less effective on phages than free chlorine
• Significantly higher UV dose required for certain viruses

• Technology overview
• Regulatory challenges
• Technology challenges• Design & operational challenges
• Closing thoughts
Presentation Outline
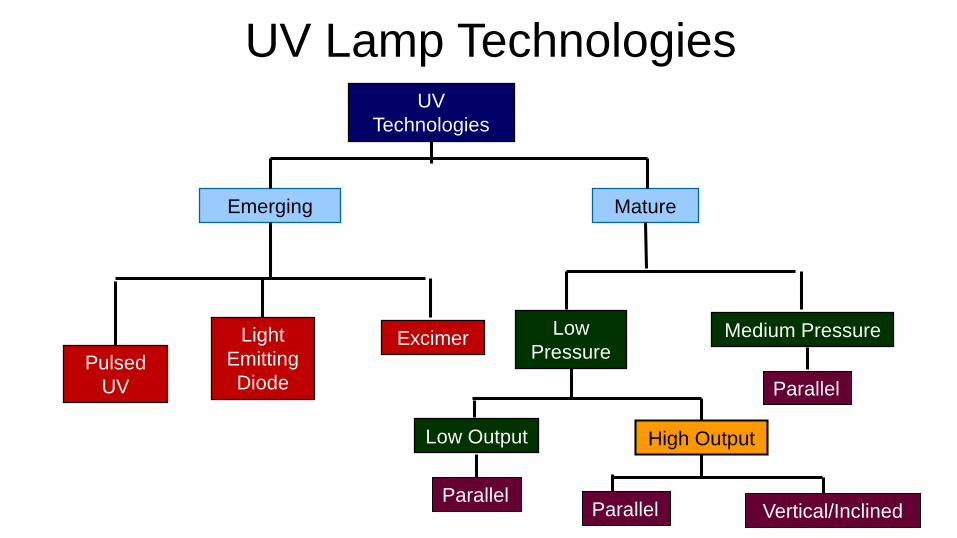
UV Lamp TechnologiesUV
Technologies
MatureEmerging
Low
PressureMedium Pressure
High OutputLow Output
ExcimerLight
Emitting
DiodePulsed
UV
Parallel Vertical/InclinedParallel
Parallel

Comparison of Different Lamp Orientations
Horizontal Lamp System Vertical & Inclined Systems
Completely submerged electrical connectors Electrical connectors not submerged
Lower hydraulic head loss Higher hydraulic head loss
Smaller modules; multiple modules form a bank Larger modules; one module can form a bank
Small davit crane for module lifting Minimum 1-ton crane required
Lamp replacement; Module removal from the
channel
Lamp replacement: without module removal
Short circuiting with a single lamp out of service No short circuiting even with multiple lamps out of
service
Sensitive to water level change; large fixed weir High allowable water level change; small fixed weir
Flow pacing: On/Off the entire bank Flow pacing: On/Off row(s) of lamps & banks

17
Characteristic LPHO
Horizontal
LPHO
Vertical
LPHO
Inclined
Medium
Pressure
Spectrum Monochromatic Monochromatic Monochromatic Polychromatic
Power, W/lamp 250 - 600 400 1,000 2,500
Germicidal efficiency,
%
35 - 40 35 - 40 N/A 15 - 20
Operating
temperature, 0C
100 100 >140 600 - 900
Lamp turndown, % 100 - 60 100 - 10 100 - 30 100 - 60
Lamp life, hrs 12,000 12,000 12,000 5,000
Lamps/MGD 10 10 3 2
No. of facilities >300 > 100 >10 > 75
CH2M design
experience
Yes Yes Yes Yes
Comparison of Commonly Used UV Technologies

Emerging Technologies
Light Emitting Diode Lamp• LEDs use alloys such as aluminum nitrite (AlN) and gallium nitrite (GaN)
to generate UV light
• Emission wavelength can be selected by varying the relative amounts of
AlN and GaN.
Benefits:
• Hg-free
• No warm-up
• Energy savings
• Technology overview
• Regulatory challenges
• Technology challenges
• Design & operational challenges• Closing thoughts
Presentation Outline

What is UV Dose?
I = UV intensity (mW/cm2)
t = Exposure time (seconds)
Dose = mW-sec/cm2
= mJ/cm2
UV Dose = I*t
Delivered UV Dose ≠ Calculated UV Dose
Due to:
• Uneven intensity variation
• Non-ideal flow conditions
What is UV Dose?

UV Intensity Distribution
Within a Reactor

48.3 mW.
sec/cm2
Delivered UV Dose is
Path-Dependent
Blatchely, et al., 1998
All microorganisms do not
receive the same dose.
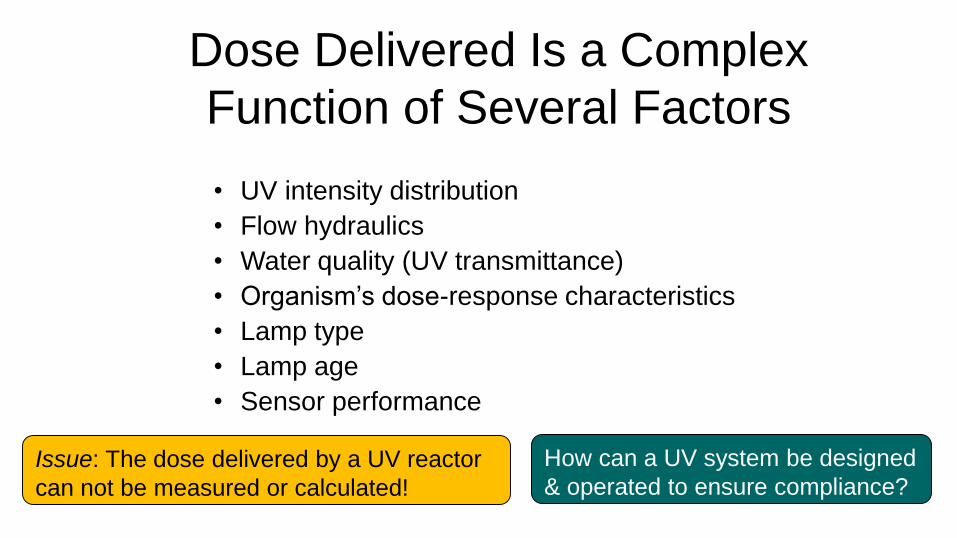
Dose Delivered Is a Complex
Function of Several Factors
• UV intensity distribution
• Flow hydraulics
• Water quality (UV transmittance)
• Organism’s dose-response characteristics
• Lamp type
• Lamp age
• Sensor performance
How can a UV system be designed
& operated to ensure compliance?Issue: The dose delivered by a UV reactor
can not be measured or calculated!

What is Equipment Validation?
• Performance-based testing
• Focus: Inactivation of target organism
• Purpose: Define the operating window of a UV reactor in terms of 3 measurable variables
– Flow
– UVT
– Power setting (lamp output)
Method of demonstrating the disinfection
efficacy of a given UV system.

Bioassay-based Validation Approach
Full-scale testing
N0 N
UV Reactor
Air cooling
UV lamp
Reflector
Collimating tube
Stirrer and petri dish
Collimated Beam UV System
Collimated Beam Test
-5
-4
-3
-2
-1
0
0 10 20 30 40 50
Log (
N/N
o)
UV Dose (mW•s/cm2)
UV dose (mJ/cm2)
Lo
g N
/No
Dose – Response
Curve
Bioassay Dose
Develop a family of
curves by varying:
• Flow
• UVT
• Power Input
log N/No

70
%
65
%
60
%
55
%
50
%
70%
65%
60%
55%
50%
(mJ
/cm
2)
Example Validation Curves

Impact of Upstream Processes
Extended Air w/Filtration
Trickling Filter
Pure Oxygen
Conv. AS
BNR
Ozonia

White’s
Handbook
Impact of Effluent Solids

Power Quality is Crucial for
Reliable UV Disinfection
• Brownout: Voltage fluctuations± 10-15%
• Cycle interruption: 1 cycle = 0.017 sec
• Sources of poor PQ– Power supply: Overloaded grid
– VFDs at WWTPs generate harmonics that can degrade power quality

• Hydraulics:
– Headloss
– Flow distribution
• Algae control
• Solids deposition
• Redundancy
– Channel redundancy
– Bank redundancy
Other Key Design Factors

Closing Thoughts
• Historical flow and UV Transmittance
data are crucial for ‘right sizing’ UV
facilities
Equipment
Validation
Regulatory
Compliance
Planning &
Design
OperationMaintenance
• UV disinfection is a mature technology
• Safety & environmental protection
favor UV over chlorine
• As regulations evolve, UV technology
is likely to become more viable
• High costs remain a barrier

Questions?

www.jacobs.com | worldwide
Wastewater UV Disinfection
Samuel Jeyanayagam, PhD, PE, BCEE, WEF Fellow
Vice President
Regional Solutions Lead – US North