Waste Management Industry Survey: Business and … · Waste Management Industry Survey: Business...
40
Catalogue no. 16F0023X Waste Management Industry Survey: Business and Government Sectors 2010
Transcript of Waste Management Industry Survey: Business and … · Waste Management Industry Survey: Business...

Catalogue no. 16F0023X
Waste ManagementIndustry Survey:Business andGovernmentSectors
2010

How to obtain more information
For information about this product or the wide range of services and data available from Statistics Canada, visit our website,www.statcan.gc.ca.
You can also contact us by
e-mail at [email protected]
telephone, from Monday to Friday, 8:30 a.m. to 4:30 p.m., at the following toll-free numbers:• Statistical Information Service 1-800-263-1136• National telecommunications device for the hearing impaired 1-800-363-7629• Fax line 1-877-287-4369
Depository Services Program• Inquiries line 1-800-635-7943• Fax line 1-800-565-7757
To access this product
This product, Catalogue no. 16F0023X, is available free in electronic format. To obtain a single issue, visit our website,www.statcan.gc.ca and browse by “Key resource” > “Publications.”
Standards of service to the public
Statistics Canada is committed to serving its clients in a prompt, reliable and courteous manner. To this end, this agencyhas developed standards of service that its employees observe. To obtain a copy of these service standards, please contactStatistics Canada toll-free at 1-800-263-1136. The service standards are also published at www.statcan.gc.ca under “About us” >“The agency” > “Providing services to Canadians.”
Statistics CanadaEnvironment Accounts and Statistics DivisionEnvironmental Protection Accounts and Surveys
Waste Management IndustrySurvey: Business andGovernment Sectors2010
Published by authority of the Minister responsible for Statistics Canada
© Minister of Industry, 2013
All rights reserved. Use of this publication is governed by the Statistics CanadaOpen License Agreement.
http://www.statcan.gc.ca/reference/licence-eng.html
August 2013
Catalogue no. 16F0023X
ISSN 1701-5677
Frequency: Biennial
Ottawa
Cette publication est également disponible en français.
Note of appreciation
Canada owes the success of its statistical system to a long-standing partnership betweenStatistics Canada, the citizens of Canada, its businesses, governments and otherinstitutions. Accurate and timely statistical information could not be produced withouttheir continued cooperation and goodwill.

User information
Symbols
The following standard symbols are used in Statistics Canada publications:
. not available for any reference period
.. not available for a specific reference period
... not applicable
0 true zero or a value rounded to zero
0s value rounded to 0 (zero) where there is a meaningful distinction between true zero and the value that wasrounded
p preliminary
r revised
x suppressed to meet the confidentiality requirements of the Statistics Act
E use with caution
F too unreliable to be published
* significantly different from reference category (p < 0.05)
Acknowledgements
The contributions of the respondents, industry groups and provincial environmental departments were critical to thesuccessful completion of the surveys and are gratefully acknowledged.
This report was prepared by the Environment Accounts and Statistics Division under the direction of Robert Smith,Director and John Marshall, Chief, Environmental Protection Accounts and Surveys. Data collection for the surveyswas conducted by the Collection Planning andManagement Division DuncanWrighte and the Environment Accountsand Statistics Division.
The 2010 Waste Management Industry Survey: was managed by Geneviève Clavet. Major contributions to theproject were made at various times by:
Carolyn Cahill Marc LavergneCarlos De Leon Peter Van WesenbeeckMichele McMillan RECYC-QuébecIman Mustapha
2 Statistics Canada – Catalogue no. 16F0023X
Preface
This report presents the results of the 2010 Waste Management Industry Survey: Business Sector andthe 2010 Waste Management Industry Survey: Government Sector. These surveys gathered information on thefinancial characteristics and waste management activities undertaken by companies, local governments and otherpublic waste management bodies.
These services included the collection and transportation of wastes and of materials destined for recycling, theoperation of non-hazardous waste disposal facilities, and the operation of transfer stations.
The results of these surveys provide a picture of physical characteristics of waste disposal and recycling as well asfinancial and employment features of businesses and local governments that provide waste management services.
The data have been analyzed and presented at a provincial level wherever it was possible to do so withoutcompromising confidentiality.
Statistics Canada – Catalogue no. 16F0023X 3
Table of contents
Highlights 6
Analysis 7
Total waste 7
Residential waste 9
Non-residential waste 9
Waste Diversion 9
Waste management industry financial and employment characteristics 10
Employment, local government and business sectors 13
Related products 14
Statistical tables
1 Disposal of waste 16
1-1 Province and territory 16
1-2 Source, province and territory 16
2 Diversion of waste by province and territory 17
3 Materials diverted by source, province and territory 17
4 Materials diverted by type, province and territory 18
4-1 2008 18
4-2 2010 18
5 Waste management industry by province and territory 19
5-1 Business sector characteristics 19
5-2 Government sector characteristics 20
6 Current expenditures by local governments on waste management by activity, province and territory 21
Data quality, concepts and methodology
Introduction 22
Defining waste and its components 24
Overall approach: data sources and methodology 25
Data accuracy 31
Comparability of data and related sources 34
4 Statistics Canada – Catalogue no. 16F0023X

Waste Management Industry Survey: Business and Government Sectors – 2010
Table of contents – continued
Definitions 36
Charts
1. Disposal of waste in Canada from 2002 to 2010 7
2. Total waste disposed for selected provinces, 2008 and 2010 8
3. Per capita disposal of waste for Canada and selected provinces, 2008 and 2010 9
4. Per capita current local government expenditures related to waste management for selectedprovinces, 2010 11
5. Waste diverted and local government current expenditures for selected provinces, 2010 12
Statistics Canada – Catalogue no. 16F0023X 5

Highlights
• Nationally, the amount of non-hazardous waste sent to private and public waste disposal facilities decreased 4%from 2008 to approximately 25 million tonnes in 2010. Quebec and Alberta saw the greatest declines in wastedisposal, each decreasing by 6% from 2008. Newfoundland and Labrador, Nova Scotia, and Saskatchewan hadthe highest increases over the same period, at 4% each.
• At 37%, residential waste accounted for slightly more than one-third of the total waste disposed in 2010.The disposal of residential waste decreased by 1% and the disposal of non-residential waste fell by 6%between 2008 and 2010.
• The amount of waste diverted to recycling or organic processing facilities decreased by 3% from 2008 to 8.1 milliontonnes, or 236 kg per person in 2010. This decrease, which was the first since 2002, was fueled by an 11%decrease in non-residential waste diversion. In contrast, residential waste diversion increased by 5%. The largestincrease in diversion was for electronic materials, at 60%.
• Operating revenues for governments from the provision of waste management services reached $2.3 billionin 2010. Current expenditures increased 12% from 2008, totalling $2.9 billion in 2010. Full-time employmentin the government sector of the waste management industry rose by 5%.
• Revenues of Canadian businesses providing waste management services increased 2% from 2008 tonearly $6 billion in 2010, while expenditures fell by 3% to just under $5 billion. Full-time employment in thebusiness sector increased by 2% during the same period.
6 Statistics Canada – Catalogue no. 16F0023X

Analysis
Total waste
Almost 25 million tonnes of non-hazardous waste were disposed in Canada in 2010, down 4%from 2008 but up 3% from 2002 (Chart 1). The total amount of residential waste disposed decreased by 1%between 2008 and 2010 to 9.3 million tonnes, while the disposal of non-residential waste declined by 6%to 15.6 million tonnes.
Chart 1Disposal of waste in Canada from 2002 to 2010
23
24
25
26
27
2002 2004 2006 2008 2010
million tonnes
Note(s): Totals for 2002, 2004, 2006, and 2008 have been revised since their original publication.
Source(s): Statistics Canada, CANSIM table 153-0041 (accessed August 21, 2013).Source(s): Statistics Canada, CANSIM table 153-0041 (accessed August 21, 2013).
Provincially, Ontario disposed the most waste at 9.2 million tonnes in 2010, followed by Quebec, Alberta, and BritishColumbia at 5.8, 3.9, and 2.7 million tonnes, respectively (Chart 2). The four provinces that disposed the most wasteare also the four provinces with the highest population counts, according to the 2010 Statistics Canada populationestimates.
Statistics Canada – Catalogue no. 16F0023X 7

Waste Management Industry Survey: Business and Government Sectors – 2010
Chart 2Total waste disposed for selected provinces, 2008 and 2010
+4% +4% -1%
-6%
-4%
+1% +4%
-6%
-5%
0
2
4
6
8
10
N.L. N.S. N.B. Que. Ont. Man. Sask. Alta. B.C.
million tonnes
2008
2010
Note(s): Percentages indicate changes between 2008 and 2010. Data for Prince Edward Island, Yukon, Northwest Territories, and Nunuvat are not included in order to meet the confidentiality requirements of the Statistics Act.
Provinc
Northwest Territories, and Nunuvat are not included in order to meet the confidentiality requirements of the Statistics Act.
Source(s): Statistics Canada, CANSIM table 153-0041 (accessed August 21, 2013).
Per capita waste disposal figures provide an additional perspective. On a per capita basis, a total of 729 kg ofwaste was disposed per person in 2010 (Chart 3). This per capita quantity, which includes both residential andnon-residential waste, was down 6% from 2008. The province with the lowest per capita disposal rate in 2010 wasNova Scotia at 389 kg per person. British Columbia, New Brunswick, and Ontario also disposed less waste percapita than the national average. The province with the highest per capita disposal rate was Alberta at 1,052 kg perperson. Per capita waste disposal decreased between 2008 and 2010 for all provinces except Newfoundland andLabrador, Nova Scotia, and Saskatchewan.
8 Statistics Canada – Catalogue no. 16F0023X

Waste Management Industry Survey: Business and Government Sectors – 2010
Chart 3Per capita disposal of waste for Canada and selected provinces, 2008 and 2010
-6%+3%
+3%
-2%
-8%-6%
-2%
+1%
-9%
-8%
0
200
400
600
800
1,000
1,200
CANADA N.L. N.S. N.B Que. Ont. Man. Sask. Alta. B.C.
kilograms
2008
2010
Note(s): Percentages indicate changes between 2008 and 2010. Data for Prince Edward Island, Yukon, Northwest Territories, and Nunavut are not included in order to meet the confidentiality requirements of the Statistics Act.
Provi
Northwest Territories, and Nunavut are not included in order to meet the confidentiality requirements of the Statistics Act.
Source(s): Statistics Canada, CANSIM tables 051-0001 and 153-0041 (accessed August 21, 2013).
Residential waste
At 37%, slightly more than one third of waste for disposal came from residential sources in 2010. The total disposalof residential waste decreased by 1% between 2008 and 2010 to 9.3 million tonnes. Calculated on a per capitabasis, the disposal of residential waste decreased by 3% to 271 kg per person.
Non-residential waste
Nationally, the total amount of non-residential waste fell by 6% to 15.6 million tonnes, while the per capita disposal ofnon-residential waste declined by 8% to 458 kg per person in 2010. Quebec, British Columbia, Alberta, and Ontarioall contributed to the decrease. The amount of non-residential waste exceeded the amount of residential wastedisposed in 2010 for all provinces examined. The difference is most notable in Alberta, where 75% of disposedwaste came from non-residential sources.
Waste Diversion
The total amount of materials diverted for recycling or composting decreased by 3% from 2008 toapproximately 8.1 million tonnes, or 236 kg per person in 2010. This decrease was driven by non-residentialdiversion, which declined by 11% to 3.6 million tonnes. In contrast, the diversion of residential material increasedby 5% to 4.5 million tonnes over the same period of time.
Statistics Canada – Catalogue no. 16F0023X 9
Waste Management Industry Survey: Business and Government Sectors – 2010
Ontario, Quebec and British Columbia diverted the most waste by weight from all sources at 2.7, 2.3, and 1.5 milliontonnes respectively. At 44%, slightly less than half of the diverted waste in the country came from non-residentialsources, down from 48% in 2008.
Paper fibres1 made up the largest portion of all diverted materials at 40% (3.2 million tonnes), followed by organicmaterials at 27% (2.2 million tonnes), and metals2 at 12% (950,410 tonnes). The largest increase from 2008 was inthe diversion of electronic materials, which was up 60% to 39,036 tonnes in 2010. There was also a 12% increase inthe diversion of metal, a 5% increase in the diversion of plastics (313,036 tonnes), and a 1% increase in the diversionof glass (426,794 tonnes). There were decreases in the amounts of diverted construction, renovation, and demolitionmaterials (down 9%), paper fibres (down 6%), organics (down 5%), and tires (down 4%) between 2008 and 2010.
Waste management industry financial and employment characteristics
Local government sector
Operating revenues
Operating revenues for local governments from the provision of waste management services totalled slightly morethan $2.3 billion in 20103.
Current expenditures
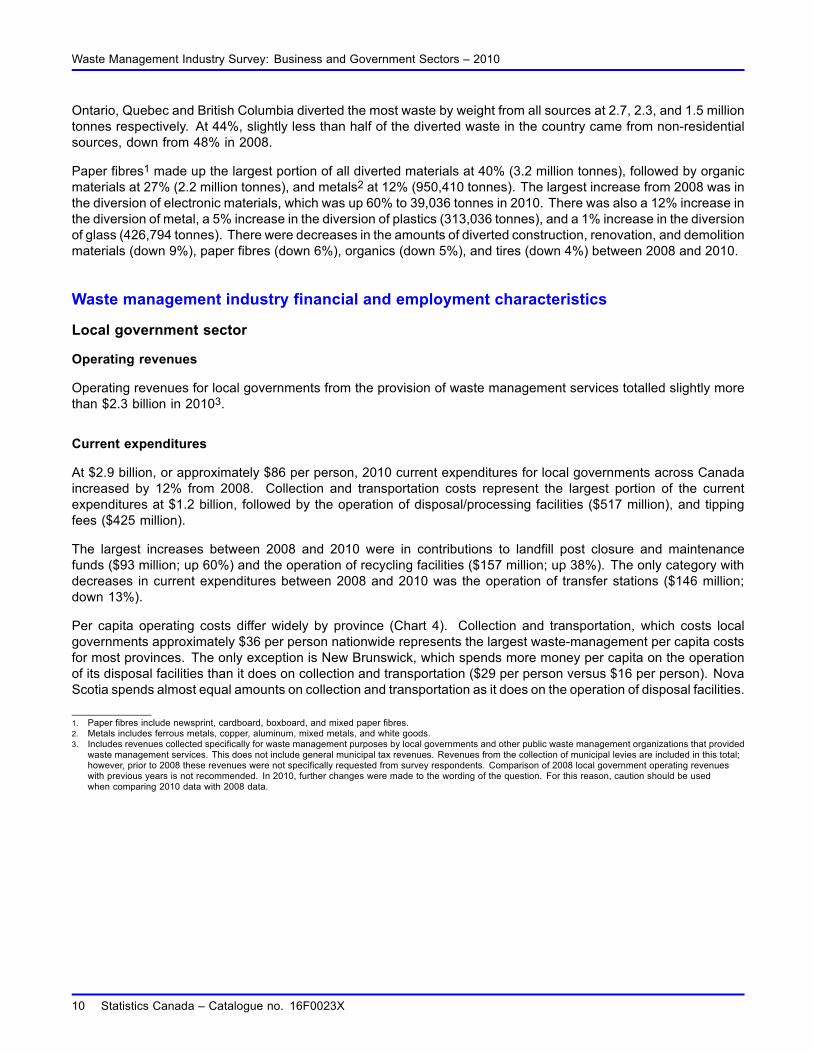
At $2.9 billion, or approximately $86 per person, 2010 current expenditures for local governments across Canadaincreased by 12% from 2008. Collection and transportation costs represent the largest portion of the currentexpenditures at $1.2 billion, followed by the operation of disposal/processing facilities ($517 million), and tippingfees ($425 million).
The largest increases between 2008 and 2010 were in contributions to landfill post closure and maintenancefunds ($93 million; up 60%) and the operation of recycling facilities ($157 million; up 38%). The only category withdecreases in current expenditures between 2008 and 2010 was the operation of transfer stations ($146 million;down 13%).
Per capita operating costs differ widely by province (Chart 4). Collection and transportation, which costs localgovernments approximately $36 per person nationwide represents the largest waste-management per capita costsfor most provinces. The only exception is New Brunswick, which spends more money per capita on the operationof its disposal facilities than it does on collection and transportation ($29 per person versus $16 per person). NovaScotia spends almost equal amounts on collection and transportation as it does on the operation of disposal facilities.
1. Paper fibres include newsprint, cardboard, boxboard, and mixed paper fibres.2. Metals includes ferrous metals, copper, aluminum, mixed metals, and white goods.3. Includes revenues collected specifically for waste management purposes by local governments and other public waste management organizations that provided
waste management services. This does not include general municipal tax revenues. Revenues from the collection of municipal levies are included in this total;however, prior to 2008 these revenues were not specifically requested from survey respondents. Comparison of 2008 local government operating revenueswith previous years is not recommended. In 2010, further changes were made to the wording of the question. For this reason, caution should be usedwhen comparing 2010 data with 2008 data.
10 Statistics Canada – Catalogue no. 16F0023X

Waste Management Industry Survey: Business and Government Sectors – 2010
Chart 4Per capita current local government expenditures related to waste management for selected provinces, 2010
0
5
10
15
20
25
30
35
40
45
50
Canada N.S. N.B. Que. Ont. Man. Sask. Alta. B.C.
dollars
Collection and transportation Operation of disposal facilities
Operation of recycling facilities Operation of organics processing facilities
N t ( ) D t f N f dl d d L b d P i Ed d I l d Y k N th t T it i d
Province
Operation of recycling facilities Operation of organics processing facilities
Note(s): Data for Newfoundland and Labrador, Prince Edward Island, Yukon, Northwest Territories, and Nunavut are not included in order to meet confidentiality requirements of the Statistics Act. For the same reason, the government expenditures related to the operation of organics processing facilities for New Brunswick and Alberta are not included.
Source(s): Statistics Canada, CANSIM tables 051-0001 and 153-0045 (accessed August 21, 2013).
In 2010, local governments spent approximately $15 per person on the operation of disposal facilities, $5 per personon the operation of recycling facilities, and $2 per person on the operation of organics processing facilities. Thedirection of public funds towards waste diversion varied amongst the provinces. For example, New Brunswick ($13),Nova Scotia ($8), Alberta ($7), and Ontario ($6) all spent more than the national average on the operation of recyclingfacilities per capita. Nova Scotia ($11) and Ontario ($3) spent more than the national average on the operation oforganics processing facilities per capita.
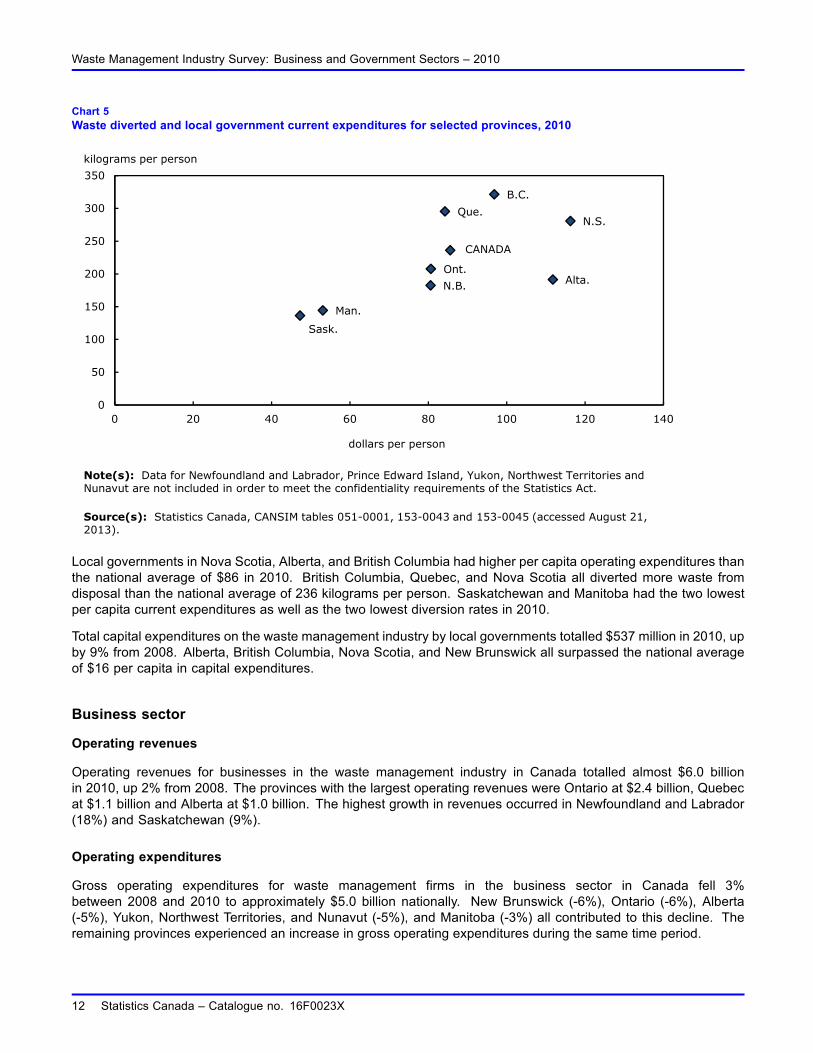
Plotting the per capita amount of diverted waste against the per capita total current expenditures for each provincereveals a relationship between money spent by governments and the proportion of waste that is ultimately divertedfrom disposal (Chart 5).
Statistics Canada – Catalogue no. 16F0023X 11
Waste Management Industry Survey: Business and Government Sectors – 2010
Chart 5Waste diverted and local government current expenditures for selected provinces, 2010
CANADA
N.S.
N.B.
Que.
Ont.
Man.
Sask.
Alta.
B.C.
0
50
100
150
200
250
300
350
0 20 40 60 80 100 120 140
Note(s): Data for Newfoundland and Labrador, Prince Edward Island, Yukon, Northwest Territories and Nunavut are not included in order to meet the confidentiality requirements of the Statistics Act.
Source(s): Statistics Canada CANSIM tables 051 0001 153 0043 and 153 0045 (accessed August 21
dollars per person
kilograms per person
Nunavut are not included in order to meet the confidentiality requirements of the Statistics Act.
Source(s): Statistics Canada, CANSIM tables 051-0001, 153-0043 and 153-0045 (accessed August 21, 2013).
Local governments in Nova Scotia, Alberta, and British Columbia had higher per capita operating expenditures thanthe national average of $86 in 2010. British Columbia, Quebec, and Nova Scotia all diverted more waste fromdisposal than the national average of 236 kilograms per person. Saskatchewan and Manitoba had the two lowestper capita current expenditures as well as the two lowest diversion rates in 2010.
Total capital expenditures on the waste management industry by local governments totalled $537 million in 2010, upby 9% from 2008. Alberta, British Columbia, Nova Scotia, and New Brunswick all surpassed the national averageof $16 per capita in capital expenditures.
Business sector
Operating revenues
Operating revenues for businesses in the waste management industry in Canada totalled almost $6.0 billionin 2010, up 2% from 2008. The provinces with the largest operating revenues were Ontario at $2.4 billion, Quebecat $1.1 billion and Alberta at $1.0 billion. The highest growth in revenues occurred in Newfoundland and Labrador(18%) and Saskatchewan (9%).
Operating expenditures
Gross operating expenditures for waste management firms in the business sector in Canada fell 3%between 2008 and 2010 to approximately $5.0 billion nationally. New Brunswick (-6%), Ontario (-6%), Alberta(-5%), Yukon, Northwest Territories, and Nunavut (-5%), and Manitoba (-3%) all contributed to this decline. Theremaining provinces experienced an increase in gross operating expenditures during the same time period.
12 Statistics Canada – Catalogue no. 16F0023X

Waste Management Industry Survey: Business and Government Sectors – 2010
Capital expenditures, which tend to vary significantly from year-to-year, fell 19%between 2008 and 2010 to $335 million. The largest increase in capital spending was in Quebec (up 67%to $77 million), while the largest decrease was in Alberta (down 53% to $67 million).
Employment, local government and business sectors
The number of full-time workers in the waste management industry, including both the government and businesssectors totalled just over 32,000 in 2010, an increase of 2% from 2008. Approximately 80% of the full-time workersare employed in the business sector. Full-time employment in the waste management industry rose by 5% in thegovernment sector and 2% in the business sector. The number of part-time jobs in both sectors increased by 9%to nearly 3,000 employees, in total. The numbers of part-time employees in the government and business sectorsare approximately equal.
Statistics Canada – Catalogue no. 16F0023X 13

Related products
Selected publications from Statistics Canada
16-002-X EnviroStats
16-201-X Human Activity and the Environment
16-253-X Canadian Environmental Sustainability Indicators: Socio-economic Information
16-257-X Environment Accounts and Statistics Product Catalogue
16F0006X Environmental Protection Expenditures in the Business Sector
Selected CANSIM tables from Statistics Canada
153-0041 Disposal of waste, by source, Canada, provinces and territories, biennial
153-0042 Materials diverted, by source, Canada, provinces and territories, biennial
153-0043 Materials diverted, by type, Canada, provinces and territories, biennial
153-0044 Business sector characteristics of the waste management industry, Canada, provinces andterritories, biennial
153-0045 Local government characteristics of the waste management industry, Canada, provinces andterritories, biennial
Selected surveys from Statistics Canada
1736 Waste Management Industry Survey: Government Sector
2009 Waste Management Industry Survey: Business Sector
Selected summary tables from Statistics Canada
• Disposal and diversion of waste, by province and territory
• Waste disposal by source, province and territory
14 Statistics Canada – Catalogue no. 16F0023X

Statistical tables

Waste Management Industry Survey: Business and Government Sectors – 2010
Table 1-1Disposal of waste — Province and territory
Total waste disposal Waste disposal per capita
2008 2010 Percentagechange
2008 to 2010
2008 2010 Percentagechange
2008 to 2010
tonnes percent kilograms percent
Canada 25,907,467 r 24,883,546 -4.0 778 r 729 -6.2Newfoundland and Labrador 380,176 r 394,235 3.7 751 r 770 2.6Prince Edward Island x x x x x xNova Scotia 354,231 367,246 3.7 378 389 2.8New Brunswick 479,461 475,265 -0.9 642 631 -1.7Quebec 6,146,319 r 5,795,707 -5.7 793 r 733 -7.5Ontario 9,631,559 9,247,415 -4.0 745 699 -6.1Manitoba 945,441 r 951,612 0.7 784 r 770 -1.8Saskatchewan 902,943 937,268 3.8 891 897 0.8Alberta 4,147,558 r 3,917,492 -5.5 1,155 r 1,052 -8.9British Columbia 2,811,568 2,658,271 -5.5 641 587 -8.5Yukon, Northwest Territories and Nunavut x x x x x x
Note(s): Figures may not add up to totals due to rounding. Total amount of non-hazardous waste disposal in public and private waste disposal facilities includeswaste that is exported out of the source province or out of the country for disposal. This does not include waste disposal in hazardous waste disposalfacilities or waste managed by the waste generator on site.
Source(s): Statistics Canada, Environment Accounts and Statistics Division, CANSIM tables 051-0001 and 153-0041.
Table 1-2Disposal of waste — Source, province and territory
Residential sources 1 Non-residential sources 2 All sources
2008 2010 2008 2010 2008 2010
tonnes
Canada 9,350,354 r 9,256,540 16,557,113 r 15,627,006 25,907,467 r 24,883,546Newfoundland and Labrador 200,918 r x 179,257 r x 380,176 r 394,235Prince Edward Island x x x x x xNova Scotia 148,060 145,589 206,171 221,657 354,231 367,246New Brunswick 233,703 219,486 245,758 255,779 479,461 475,265Quebec 2,848,822 r 2,853,189 3,297,497 r 2,942,518 6,146,319 r 5,795,707Ontario 3,231,399 3,204,264 6,400,160 6,043,151 9,631,559 9,247,415Manitoba 400,297 388,683 545,144 r 562,929 945,441 r 951,612Saskatchewan 289,760 283,726 613,182 653,541 902,943 937,268Alberta 993,976 r 970,422 3,153,581 r 2,947,070 4,147,558 r 3,917,492British Columbia 960,472 953,761 1,851,097 1,704,510 2,811,568 2,658,271Yukon, Northwest Territories and Nunavut x x x x x x
1. Residential non-hazardous waste disposal includes solid waste produced by all residences and includes waste that is picked up by the municipality (either usingits own staff or through contracting firms), and waste from residential sources that is self-hauled to depots, transfer stations and disposal facilities.
2. Non-residential non-hazardous solid waste are those wastes generated by all sources excluding the residential waste stream. These include: industrialmaterials, which are generated by manufacturing, and primary and secondary industries, and is managed off-site from the manufacturing operation; commercialmaterials, which are generated by commercial operations, such as, shopping centres, restaurants, offices, and others; and institutional materials which aregenerated by institutional facilities, such as, schools, hospitals, government facilities, seniors homes, universities, and others. These wastes also includeconstruction, renovation and demolition non-hazardous waste, also referred to as DLC (demolition, land clearing and construction waste). These refer towastes generated by construction, renovation and demolition activities. It generally includes materials, such as, wood, drywall, certain metals, cardboard,doors, windows, wiring, and others. It excludes materials from land clearing on areas not previously developed as well as materials that include asphalt,concrete, bricks and clean sand or gravel.
Note(s): Figures may not add up to totals due to rounding. Total amount of non-hazardous waste disposal in public and private waste disposal facilities includeswaste that is exported out of the source province or out of the country for disposal. This does not include waste disposal in hazardous waste disposalfacilities or waste managed by the waste generator on site.
Source(s): Statistics Canada, Environment Accounts and Statistics Division, CANSIM table 153-0041.
16 Statistics Canada – Catalogue no. 16F0023X

Waste Management Industry Survey: Business and Government Sectors – 2010
Table 2Diversion of waste by province and territory
Total materials diverted Diverted materials per capita Diversion rate
2008 2010 Percentagechange
2008 to 2010
2008 2010 Percentagechange
2008 to 2010
2008 2010
tonnes percent kilograms percent
Canada 8,310,570 r 8,063,223 -3.0 249 r 236 -5.3 24.3 r 24.5Newfoundland and Labrador x x x x x x x xPrince Edward Island x x x x x x x xNova Scotia 289,950 265,467 -8.4 309 281 -9.2 45.0 42.0New Brunswick 165,249 r 137,515 -16.8 221 r 183 -17.4 25.6 r 22.4Quebec 1 2,463,600 2,336,400 -5.2 318 296 -7.0 28.6 28.7Ontario 2,781,830 r 2,749,047 -1.2 215 r 208 -3.4 22.4 r 22.9Manitoba 165,667 r 178,481 7.7 137 r 144 5.1 14.9 r 15.8Saskatchewan 122,932 r 142,659 16.0 121 r 137 12.6 12.0 r 13.2Alberta 728,536 713,153 -2.1 203 192 -5.6 14.9 15.4British Columbia 1,505,112 1,457,062 -3.2 343 322 -6.3 34.9 35.4Yukon, Northwest Territories and Nunavut x x x x x x x x
1. Waste diversion data for the province of Quebec are derived from a survey administered by RECYC-QUÉBEC. Note that the amount of white goods reportedby RECYC-QUÉBEC is disproportionately larger than that reported by other provincial and territorial jurisdictions. The definition of white goods and thecollection methodology used by RECYC-QUÉBEC for this category of material differs from that of Statistics Canada’s Waste Management Industry Survey,resulting in this discrepancy.
Note(s): Figures may not add up to totals due to rounding. This information covers only those companies and local waste management organizations that reportednon-hazardous recyclable material preparation activities and refers only to that material entering the waste stream and does not cover any waste that maybe managed on-site by a company or household. Additionally, these data do not include those materials transported by the generator directly to secondaryprocessors, such as, pulp and paper mills while bypassing entirely any firm or local government involved in waste management activities.
Source(s): Statistics Canada, Environment Accounts and Statistics Division, CANSIM tables 051-0001, 153-0041 and 153-0043.
Table 3Materials diverted by source, province and territory
Residential sources 1 Non-residential sources 2 All sources
2008 2010 2008 2010 2008 2010
tonnes
Canada 4,300,979 r 4,505,257 4,009,592 r 3,557,966 8,310,570 r 8,063,223Newfoundland and Labrador x x x x x xPrince Edward Island x x x x x xNova Scotia 149,961 136,967 139,989 128,500 289,950 265,467New Brunswick 62,076 r x 103,173 r x 165,249 r 137,515Quebec 3 1,046,000 1,112,694 1,417,600 1,223,706 2,463,600 2,336,400Ontario 1,849,828 r 1,996,057 932,001 r 752,990 2,781,830 r 2,749,047Manitoba 70,400 r 85,460 95,267 r 93,021 165,667 r 178,481Saskatchewan 51,694 r 55,625 71,238 r 87,034 122,932 r 142,659Alberta 391,709 332,722 336,827 380,431 728,536 713,153British Columbia 614,204 676,102 890,908 780,960 1,505,112 1,457,062Yukon, Northwest Territories and
Nunavut x x x x x x
1. Residential non-hazardous recyclable materials include solid non-hazardous materials produced in all residences and include non-hazardous materials thatare picked up by the municipality (either using its own staff or through contracting firms) and non-hazardous materials from residential sources that areself-hauled to depots, transfer stations and disposal facilities.
2. Non-residential sources include solid non-hazardous recyclable material from the Industrial, Commercial, and Institutional (IC and I) sector as well as theConstruction, Renovation and Demolition sector (CRD). Materials are those generated by all IC and I and CRD sources in a municipality, and are excludedfrom the residential waste stream.
3. Waste diversion data are derived from a survey administered by RECYC-QUÉBEC.Note(s): Figures may not add up to totals due to rounding. This information covers only those companies and local waste management organizations that reported
non-hazardous recyclable material preparation activities and refers only to that material entering the waste stream and does not cover any waste that maybe managed on-site by a company or household. Additionally, these data do not include those materials transported by the generator directly to secondaryprocessors, such as, pulp and paper mills while bypassing entirely any firm or local government involved in waste management activities.
Source(s): Statistics Canada, Environment Accounts and Statistics Division, CANSIM tables 153-0042 and 153-0043.
Statistics Canada – Catalogue no. 16F0023X 17

Waste Management Industry Survey: Business and Government Sectors – 2010
Table 4-1Materials diverted by type, province and territory — 2008
Newfoundlandand
Labrador
PrinceEdwardIsland
NovaScotia
NewBrunswick
Quebec 1 Ontario Manitoba Saskat-chewan
Alberta BritishColumbia
Yukon,NorthwestTerritories
andNunavut
Canada
tonnes
All materials x x 289,950 165,249 r 2,463,600 2,781,830 r 165,667 r 122,932 r 728,536 1,505,112 x 8,310,570 rNewsprint x x 34,771 12,287 310,000 494,116 45,638 16,007 r 84,239 124,979 x 1,129,609 rCardboard and boxboard x x 27,271 15,111 456,000 419,690 38,249 19,723 r 115,789 260,478 x 1,381,298 rMixed paper x 0 7,399 x 376,000 210,720 10,263 3,869 r 86,941 x x 927,069 rGlass x x 1,222 x 103,000 143,780 7,361 x x x x 421,007Ferrous metals 0 0 4,244 1,499 134,400 110,467 x x 20,685 34,193 x 350,370Copper and aluminum x x 581 x 19,200 17,363 4,146 x 6,814 x x 58,950Mixed metals x x 1,462 3,540 0 22,364 4,052 1,143 20,266 73,471 x 127,033White goods 0 0 x x 270,000 12,376 x 2,743 x 12,192 x 312,988Electronics 0 0 x x 7,000 4,419 99 x 5,429 x 0 24,367Plastics x x 6,303 1,518 113,000 69,523 r 9,247 4,863 26,342 64,864 x 296,797 rTires 0 x x 298 73,000 8,087 1,499 x 3,392 x 667 158,336Construction, renovation and
demolition 0 0 40,368 x 211,000 209,628 2,331 x 54,056 198,480 0 720,076Organics 0 x 158,419 122,863 r 384,000 1,029,510 x 12,190 231,544 343,586 x 2,332,295 rOther materials x x 2,400 954 7,000 29,786 703 1,009 10,111 9,101 x 70,375
1. Waste diversion data for the province of Quebec are derived from a survey administered by RECYC-QUÉBEC. Note that the amount of white goods reportedby RECYC-QUÉBEC is disproportionately larger than that reported by other provincial and territorial jurisdictions. The definition of white goods and thecollection methodology used by RECYC-QUÉBEC for this category of material differs from that of Statistics Canada’s Waste Management Industry Survey,resulting in this discrepancy.
Note(s): Figures may not add up to totals due to rounding. This information covers only those companies and local waste management organizations that reportednon-hazardous recyclable material preparation activities and refers only to that material entering the waste stream and does not cover any waste that maybe managed on-site by a company or household. Additionally, these data do not include those materials transported by the generator directly to secondaryprocessors, such as, pulp and paper mills while bypassing entirely any firm or local government involved in waste management activities.
Source(s): Statistics Canada, Environment Accounts and Statistics Division, CANSIM table 153-0043.
Table 4-2Materials diverted by type, province and territory — 2010
Newfoundlandand
Labrador
PrinceEdwardIsland
NovaScotia
NewBrunswick
Quebec 1 Ontario Manitoba Saskat-chewan
Alberta BritishColumbia
Yukon,NorthwestTerritories
andNunavut
Canada
tonnes
All materials x x 265,467 137,515 2,336,400 2,749,047 178,481 142,659 713,153 1,457,062 x 8,063,223All paper fibres x x 59,977 30,474 1,052,000 1,101,819 106,704 44,740 281,133 528,301 x 3,246,679Glass x x 2,480 x 112,000 137,978 x x x 96,760 1,065 426,794Ferrous metals x 0 4,658 4,014 203,850 116,544 x x 23,014 32,368 x 429,575Copper and aluminum x x x x 30,550 17,791 3,218 x x 6,981 x 72,108Mixed metals x x 1,146 446 0 29,700 x 1,781 x 73,029 x 130,240White goods 0 0 2,124 x 274,000 12,853 294 2,191 x x x 318,487Electronics 0 x x 234 7,000 10,181 166 x 7,707 x x 39,036Plastics x x 7,084 1,663 115,000 79,163 9,932 x 29,709 64,608 248 313,036Tires 0 x x 391 71,000 6,455 1,698 x 3,624 x x 151,960Construction, renovation and
demolition 0 0 34,163 x 211,000 154,722 x x 49,846 198,018 0 653,255Organics 0 x 148,750 94,716 253,000 1,058,272 19,672 x 210,657 378,139 x 2,212,484Other materials x x 3,016 3,329 7,000 23,569 863 770 13,746 x x 69,569
1. Waste diversion data for the province of Quebec are derived from a survey administered by RECYC-QUÉBEC. Note that the amount of white goods reportedby RECYC-QUÉBEC is disproportionately larger than that reported by other provincial and territorial jurisdictions. The definition of white goods and thecollection methodology used by RECYC-QUÉBEC for this category of material differs from that of Statistics Canada’s Waste Management Industry Survey,resulting in this discrepancy.
Note(s): Figures may not add up to totals due to rounding. This information covers only those companies and local waste management organizations that reportednon-hazardous recyclable material preparation activities and refers only to that material entering the waste stream and does not cover any waste that maybe managed on-site by a company or household. Additionally, these data do not include those materials transported by the generator directly to secondaryprocessors, such as, pulp and paper mills while bypassing entirely any firm or local government involved in waste management activities.
Source(s): Statistics Canada, Environment Accounts and Statistics Division, CANSIM table 153-0043.
18 Statistics Canada – Catalogue no. 16F0023X

Waste Management Industry Survey: Business and Government Sectors – 2010
Table 5-1Waste management industry by province and territory — Business sector characteristics
Newfoundlandand
Labrador
PrinceEdwardIsland
NovaScotia
NewBrunswick
Quebec Ontario Manitoba Saskat-chewan
Alberta BritishColumbia
Yukon,NorthwestTerritories
andNunavut
Canada
number
Number of businesses2008 21 9 63 52 425 481 38 44 249 254 13 1,6492010 26 8 60 56 426 483 45 43 255 282 13 1,697
Total employees 12008 194 111 863 598 5,949 10,589 531 1,119 3,054 3,443 99 26,5502010 218 125 950 605 5,945 10,969 574 1,329 2,830 3,611 105 27,261
Full-time employees2008 166 111 x 548 5,735 10,342 511 x 2,888 3,342 91 25,3272010 192 125 x 558 5,671 10,630 558 x 2,671 3,421 94 25,779
Part-time employees2008 28 0 x 50 214 247 20 x 166 101 8 1,2232010 26 0 x 47 274 339 16 x 159 190 11 1,482
thousand dollars
Operating revenues 22008 31,771 19,384 129,278 116,072 1,071,505 2,456,664 157,140 121,504 960,537 769,012 14,879 5,847,7452010 37,509 19,519 136,407 112,450 1,138,489 2,398,797 155,141 132,401 1,009,426 806,437 13,184 5,959,762
Operating expenditures 22008 28,647 15,543 116,422 107,972 933,828 2,218,034 126,917 106,068 786,955 665,607 12,728 5,118,7222010 33,218 16,778 123,090 101,368 952,004 2,074,548 123,648 114,010 745,144 690,797 12,115 4,986,720
Capital expenditures 22008 x x 6,956 5,474 46,028 149,840 13,963 19,487 142,289 24,225 x 411,6512010 x x 10,077 x 76,747 128,424 8,997 11,358 66,589 22,336 x 335,302
1. Includes full and part-time employees. All employment estimates obtained from administrative data were counted as full-time employees.2. Includes only those revenues and expenditures related to waste management activities.Note(s): Figures may not add up to totals due to rounding. This table includes administrative data for businesses that were below the survey threshold for inclusion.
As businesses may operate in more than one province or territory, the national totals will not equal the sum of the provincial totals.Source(s): Statistics Canada, Environment Accounts and Statistics Division, CANSIM table 153-0044.
Statistics Canada – Catalogue no. 16F0023X 19
Waste Management Industry Survey: Business and Government Sectors – 2010
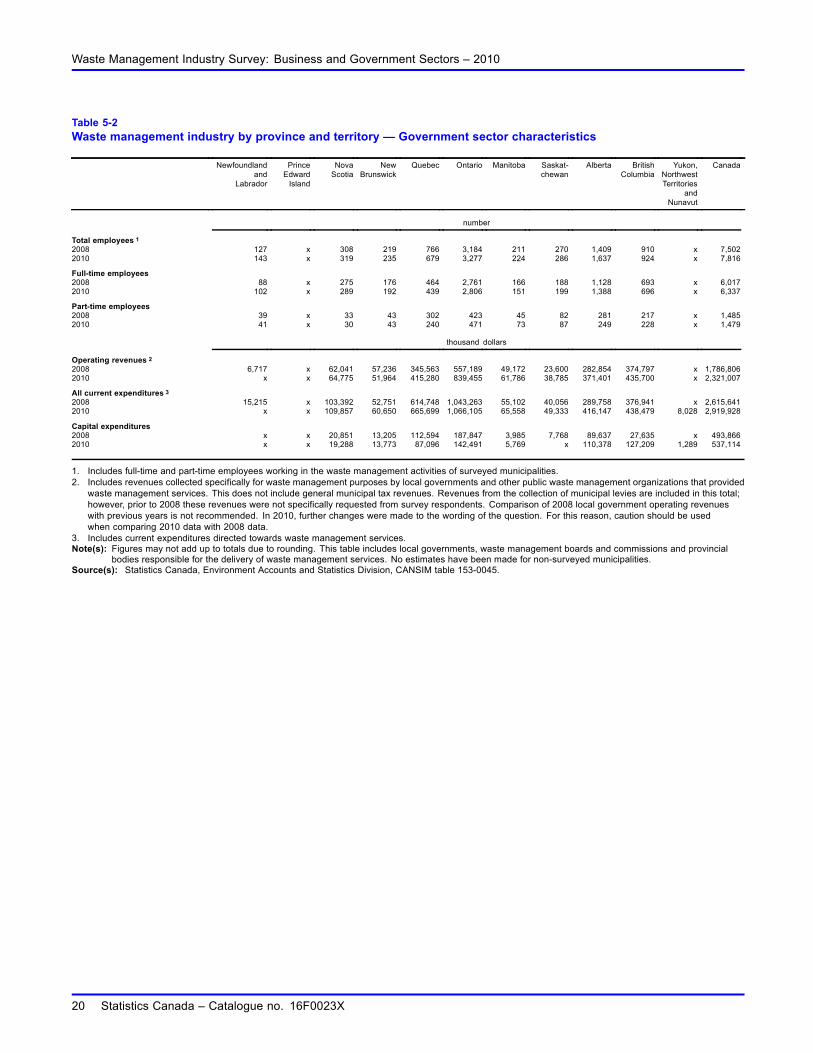
Table 5-2Waste management industry by province and territory — Government sector characteristics
Newfoundlandand
Labrador
PrinceEdwardIsland
NovaScotia
NewBrunswick
Quebec Ontario Manitoba Saskat-chewan
Alberta BritishColumbia
Yukon,NorthwestTerritories
andNunavut
Canada
number
Total employees 12008 127 x 308 219 766 3,184 211 270 1,409 910 x 7,5022010 143 x 319 235 679 3,277 224 286 1,637 924 x 7,816
Full-time employees2008 88 x 275 176 464 2,761 166 188 1,128 693 x 6,0172010 102 x 289 192 439 2,806 151 199 1,388 696 x 6,337
Part-time employees2008 39 x 33 43 302 423 45 82 281 217 x 1,4852010 41 x 30 43 240 471 73 87 249 228 x 1,479
thousand dollars
Operating revenues 22008 6,717 x 62,041 57,236 345,563 557,189 49,172 23,600 282,854 374,797 x 1,786,8062010 x x 64,775 51,964 415,280 839,455 61,786 38,785 371,401 435,700 x 2,321,007
All current expenditures 32008 15,215 x 103,392 52,751 614,748 1,043,263 55,102 40,056 289,758 376,941 x 2,615,6412010 x x 109,857 60,650 665,699 1,066,105 65,558 49,333 416,147 438,479 8,028 2,919,928
Capital expenditures2008 x x 20,851 13,205 112,594 187,847 3,985 7,768 89,637 27,635 x 493,8662010 x x 19,288 13,773 87,096 142,491 5,769 x 110,378 127,209 1,289 537,114
1. Includes full-time and part-time employees working in the waste management activities of surveyed municipalities.2. Includes revenues collected specifically for waste management purposes by local governments and other public waste management organizations that provided
waste management services. This does not include general municipal tax revenues. Revenues from the collection of municipal levies are included in this total;however, prior to 2008 these revenues were not specifically requested from survey respondents. Comparison of 2008 local government operating revenueswith previous years is not recommended. In 2010, further changes were made to the wording of the question. For this reason, caution should be usedwhen comparing 2010 data with 2008 data.
3. Includes current expenditures directed towards waste management services.Note(s): Figures may not add up to totals due to rounding. This table includes local governments, waste management boards and commissions and provincial
bodies responsible for the delivery of waste management services. No estimates have been made for non-surveyed municipalities.Source(s): Statistics Canada, Environment Accounts and Statistics Division, CANSIM table 153-0045.
20 Statistics Canada – Catalogue no. 16F0023X

Waste Management Industry Survey: Business and Government Sectors – 2010
Table 6Current expenditures by local governments on waste management by activity, province and territory
Newfoundlandand
Labrador
PrinceEdwardIsland
NovaScotia
NewBrunswick
Quebec Ontario Manitoba Saskat-chewan
Alberta BritishColumbia
Yukon,NorthwestTerritories
andNunavut
Canada
thousand dollars
Collection and transportation2008 7,117 x 26,579 11,174 328,337 440,477 29,712 16,022 127,899 107,174 x 1,105,2942010 x x 29,843 11,942 349,361 473,229 36,703 20,256 153,497 139,427 3,052 1,236,696
Tipping fees2008 1,444 x 10,933 6,944 134,598 139,614 5,115 x 16,464 47,694 x 368,2602010 x x 11,315 10,372 160,110 97,311 7,540 3,613 81,535 46,317 x 424,773
Operation of disposal facilities2008 6,621 x 26,757 18,159 71,511 132,397 11,053 11,274 67,937 115,902 x 465,2212010 8,294 x 29,593 21,869 80,292 170,979 11,015 12,019 54,046 126,234 x 516,991
Operation of transfer stations2008 0 x 6,581 x 6,458 88,250 x 678 13,986 49,142 x 168,6382010 0 x 6,946 x 5,897 64,906 1,198 238 x 52,027 x 145,960
Operation of recycling facilities2008 0 0 7,635 2,541 13,169 61,229 4,716 2,155 16,964 4,664 570 113,6432010 x 0 7,834 9,631 12,662 80,370 5,211 1,749 26,087 13,211 x 157,248
Operation of organics processingfacilities
2008 0 0 8,511 x 1,120 37,355 208 511 x 5,701 x 71,0452010 0 0 10,602 x 2,050 34,475 208 754 x 5,568 x 74,525
Contributions to landfills postclosure and maintenance fund 1
2008 0 0 4,283 1,218 4,084 21,091 1,244 x 9,225 10,179 x 58,4012010 x 0 3,999 991 3,947 20,477 466 x 37,131 16,388 x 93,171
Other current expenditures2008 33 x 12,112 7,784 55,470 122,850 x 1,851 x 36,485 x 265,1392010 109 x 9,726 2,367 51,382 124,357 3,218 x 33,128 39,306 x 270,564
1. Contributions to landfills post closure and maintenance fund were reported as other expenditures prior to 2008.Note(s): Figures may not add up to totals due to rounding. Includes current expenditures directed towards waste management services.Source(s): Statistics Canada, Environment Accounts and Statistics Division, CANSIM table 153-0045.
Statistics Canada – Catalogue no. 16F0023X 21

Introduction
The following information should be used to ensure a clear understanding of the underlying methodology of thesurvey and of key aspects of the data quality. This information will provide a better understanding of the strengthsand limitations of the data and of how they can be effectively used and analysed. The information may be ofparticular importance when making comparisons with data from other surveys or sources of information and indrawing conclusions regarding change over time.
Why is there a need for information on the waste management industry?
A general increase in environmental awareness has raised concerns over the impacts that our activities have onthe environment. The waste produced by society can impact the environment in various ways. For example, thegeneration and disposal of waste may contribute to soil and water contamination, while methane gas that is notcaptured at landfills adds to the accumulation of greenhouse gases in the atmosphere.
In turn, statistics on volumes of waste can help measure the effectiveness of environmental practices and policies.Canadians have access to an ever increasing array of environmental information on a variety of issues, includingwaste. As environmental awareness increases, Canadians need reliable environmental statistics in order to makeinformed decisions regarding their own patterns of consumption. As well, waste statistics can be used by researchersand policy makers to analyze industry trends and implement appropriate policy mechanisms.
The waste management industry
The services provided by the waste management industry include the collection and transportation of waste andmaterials destined for recycling (including composting), the operation of non-hazardous and hazardous wastedisposal facilities, the operation of transfer stations, the operation of recycling and composting facilities and thetreatment of hazardous waste.
The Canadian waste management industry embodies two inter-related elements. Waste management services canbe provided directly by a public body, such as a local government (for example, city, town, regional district) or a wastemanagement board or commission whose purpose is to coordinate the provision of such services. For example, anumber of local governments may agree to jointly administer a landfill or a recycling facility.
Private firms are the second source of waste management services. Local governments may enter into contractswith these firms to provide certain waste management services or the businesses may directly enter into sucharrangements with clients other than local governments. For example, a region may contract out curb-side wasteand/or recycling services to a company and this same company may enter into separate agreements with apartmentcomplexes or industrial operations.
22 Statistics Canada – Catalogue no. 16F0023X

Waste Management Industry Survey: Business and Government Sectors – 2010
Local government and other waste management service providers
For the purposes of this report, local government in Canada includes all government and quasi-governmental entities belowthe provincial or territorial level. Within this broad category, administrative functions are divided among municipalities, specialpurpose boards and local school districts. A further distinction is made between upper and lower tier municipalities. In thisreport, for the purpose of simplicity, the term local government is used to denote any of the following public organizations:
Upper-tier municipalities are those encompassing one or more local government entities, such as metropolitan corporations,regional districts, regional municipalities and counties.
Lower-tier municipalities are typically those whose borders can lie within or outside the jurisdiction of another level ofmunicipality. These lower tier municipalities can include cities, towns, villages, townships, rural municipalities, districts andcounties, and some quasi-municipalities, including local government districts and local improvement districts.
Other public waste service providers can come in a variety of forms, but as a rule consist of a group of local municipalities(usually at the lower tier level) who collectively provide a waste management service. A group such as this will typicallyoversee the contracting out of a specific service or set of services (for example, the operation of a materials recycling facility)but sometimes will also provide a service themselves (for example, the operation of a landfill).
Statistics Canada – Catalogue no. 16F0023X 23

Defining waste and its components
Waste management activities take many different forms and involve many different participants. This presentschallenges when trying to prepare an integrated picture of activities, including the total materials managed.
One common thread is that all the materials handled are unwanted by their producer. The unwanted materials maybe by-products of a production process– for example, fly ash from a furnace. Alternatively they might be products,the inherent value of which has been consumed from the perspective of the current holder–for example, a newspaperthat has been read or a package that has been opened and emptied of its contents.
Concepts and definitions in the waste management area have been evolving over the past several years. Themost common source of difficulty is in classifying types of waste. Strategies to compile waste statistics reflectthe specific needs of statistical and analytical projects: by type (municipal solid non-hazardous waste, hazardouswaste); by generator or by generating activity (residential, industrial, commercial, institutional and constructionand demolition projects) as well as by type of material. The differences in the terminology that the variousrespondents use can create many operational difficulties when surveys are in the field.See [Data quality, conceptsand methodology — Definitions] section used for this report). Progress is being made on both the national andinternational fronts toward the development and implementation of consistent classifications and measurementmethodologies of waste management industry activities as well as the materials that this industry handles.
24 Statistics Canada – Catalogue no. 16F0023X

Overall approach: data sources and methodology
General methodology
This report presents the physical quantities, types and sources of waste and recyclable materials as well as financialand employment characteristics of the waste management industry. These estimates are based on the integrationof two waste surveys conducted by Statistics Canada on a biennial basis: theWaste Management Industry Survey:Business Sector and theWaste Management Industry Survey: Government Sector. Essentially the same questionswere asked for the waste and recyclable quantities and types sections of both surveys, however the financial sectionsdiffered somewhat.
To arrive at physical totals for the disposal and recycling sections, data from the two surveys were combined andduplicate entries were removed. These duplicates occur because operating arrangements of disposal and recyclingactivities can vary. Sites may be owned and operated by the same entity, but some sites may be owned by agovernment body and operated by a private firm. Since in some cases an owner of a facility may not have necessarilybeen the operator and the survey may have been completed by both the owner and the operator, care was takento ensure that the information from each facility was only counted once. In these cases the information reported bythe owner of the facility was typically used. However, in cases where there was a large difference in the informationreported by the two respondents, further research was done to determine the reason for the discrepancy, and theappropriate response was used.
Not all of the population may have access to, or use, formal disposal or recycling facilities. In rural areas especially,arrangements can be made with a landowner to use property for the purpose of small-scale disposal sites (“dumps”).For this reason and others, a survey coverage population was developed using information provided by surveyrespondents as well as from other sources about the municipalities that were served by disposal and recyclingfacilities. Total populations were calculated for these municipalities using Statistics Canada data.1 The differencebetween the total population and the covered population was calculated. A provincial per capita disposal figurewas applied to this under covered population, and this total was added to the survey total to arrive at an adjusteddisposal figure. The under-covered portion of the population is small and has been decreasing with each iterationof the survey.
It is assumed that all Canadians produce waste and that this waste must be disposed of in some manner, thusrequiring an adjusted disposal figure. However, the same adjustment was not made to the recycling figures. Unlikewaste, which can be disposed of in a hole at the back of someone’s property, material to be recycledmust be preparedand processed. While the smallest recycling depots may not be surveyed because they fall below the municipalpopulation or business size thresholds for selection, the major material recovery facilities where this material isprocessed are covered by the survey. Therefore, most recycled material that falls within the conceptual parametersof this survey is captured and accounted for in the final estimate.
1. Statistics Canada, CANSIM, table 051-0001,“Estimates of population, by age group and sex for July 1, Canada, provinces and territories, annual”.
Statistics Canada – Catalogue no. 16F0023X 25

Waste Management Industry Survey: Business and Government Sectors – 2010
Coverage
The classification of waste management services
The North American Industry Classification System (NAICS) is an industry classification system developed by the statisticalagencies of Canada, Mexico and the United States. Created against the background of the North American Free TradeAgreement, it is designed to provide common definitions of the industrial structure of the three countries and a commonstatistical framework to facilitate the analysis of the three economies. NAICS is based on supply side or production orientedprinciples, to ensure that industrial data, classified to NAICS, is suitable for the analysis of production-related issues such asindustrial performance.
Businesses falling into the following NAICS classifications are considered to be “in scope” for theWaste Management IndustrySurvey: Business Sector.
56211 Waste collection: This industry comprises establishments primarily engaged in collecting and hauling non-hazardousor hazardous waste within a local area. Establishments engaged in hazardous waste collection may be responsible for treatingand packaging the waste for transport. Waste transfer stations are also included.
56221 Waste treatment and disposal: This industry comprises establishments primarily engaged in operating landfill sites,incinerators, or other treatment or disposal facilities for non-hazardous or hazardous waste. Establishments that integrate thecollection, treatment and disposal of waste are also included.
56292 Material recovery facilities: This industry comprises establishments primarily engaged in operating facilities in whichrecyclable materials are removed from waste, or mixed recyclable materials are sorted into distinct categories and preparedfor shipment.
56299 All other waste management services: This industry comprises establishments, not classified to any other industry,primarily engaged in waste management activities.
Note that missing from this list of classifications is NAICS 56291, Remediation Services. While in the same NAICS groupingas the waste management industry, this industry is not included as it does not provide waste management services as definedby the Canadian Council of Ministers of the Environment.
Source(s): Statistics Canada, North American Industry Classification System(NAICS) 2007,http://www.statcan.gc.ca/subjects-sujets/standard-norme/naics-scian/2007/index-indexe-eng.htm.
Reference period
The Waste Management Industry Surveys are biennial surveys. The information contained in this report reflectsthe total revenues, total operating and capital expenditures, total employment and waste quantities covering thefinancial year ending between April 1, 2010 and March 31, 2011.
Business sector
The 2010 Waste Management Industry Survey: Business Sector asked firms to report information on their wastemanagement activities for each of their provincial and territorial operations. Businesses were selected based on thesize of their workforce as well as the level of their total revenues. The threshold (based on revenue and employmentlevels) that was used to include or exclude a particular business from the survey mailout depended on the provinceor territory in which they operated. For example, surveyed businesses from Newfoundland and Labrador had a lowerrevenue and employment cut-off than those from Ontario.
The survey frame for the 2010 business survey was based on the 2008 survey supplemented and updated withinformation from the Statistics Canada Business Register (BR) and industry directories. Firms selected from the BRare a subset of the Waste Management and Remediation Services NAICS 562 (See text box “The classificationof waste management services”). The combined list was cross-checked with other industry directories to avoiddouble-surveying of units.
26 Statistics Canada – Catalogue no. 16F0023X

Waste Management Industry Survey: Business and Government Sectors – 2010
For those firms not included in the survey because of their small size, administrative data on total operatingexpenditures, total operating revenues and total employment obtained from Tax Data Division and StatisticsCanada’s Business Register were used to estimate their contribution to the industry.
Government sector
Local governments and other public waste management bodies were selected for the Waste Management IndustrySurvey: Government Sector on the basis of a municipal population threshold that varied by province and whetheror not a disposal, recycling and/or composting facility operated within their jurisdiction.
The mailing list for the 2010 survey was based on past survey information and supplemented by information obtainedfrom provincial sources.
Municipalities as well as regional waste management service boards in the province of Quebec were added to thesurvey frame starting with the 2008 survey. Estimates for financial and employment data for the local governmentsector as well as disposal data were taken from these surveys. Prior to 2008, municipalities in this province hadbeen excluded from the survey as the information was obtained from provincial sources.
Variables measured
For the reference year 2010, respondents were asked to report the following information:
• specific types of waste management activities conducted by the respondent;
• total quantities of non-hazardous waste managed in disposal facilities, recycled, composted, exported, andimported;
• sources of waste and recyclable and compostable material;
• total revenues realized from the sale of waste management services;
• total operating and capital expenditures; and
• total employment.
Data collection and processing
Data collection for both surveys took place during the fall, winter and spring of 2011 and 2012. Survey questionnaireswere mailed to a total of 1,353 businesses and local governments. The responses were returned by mail. Thequestionnaires were addressed to a contact person who was either responsible for, or had knowledge of, the wastemanagement operations of the survey unit.
For businesses that had operations in more than one province, a separate questionnaire was completed for eachprovince in which the waste management business operated. For example, a business with operations in threeprovinces completed three questionnaires, each one describing the activities within a province. This was not aconcern for the government sector.
Follow-ups by fax and/or telephone were carried out after the return due date to remind respondents to return theirquestionnaires.
Questionnaires were edited in two steps. First, validity edits were applied to ensure that responses to particularquestions fell within a limited range of possible values. This type of editing was applied mostly to the questions onquantities but was also used to identify unusual values in the financial sections. A second step, consistency edits,was then undertaken. These identified occasions where the responses in one section of the questionnaire werelogically inconsistent with those given in other sections.
Statistics Canada – Catalogue no. 16F0023X 27

Waste Management Industry Survey: Business and Government Sectors – 2010
Additional follow-up was carried out to collect missing data and to correct inconsistencies. The survey collectionperiod was closed by mid May 2012.
Government sector waste management
Many local governments use the services of private sector waste management firms. It was essential that both thequestionnaire structure and particular wording enabled respondents to distinguish between services they providedwith their own employees and those which they contracted out. In the processing phase it frequently becamenecessary to contact respondents to clarify the nature of these relationships.
In addition, groups of municipalities work together to provide waste management services for their residents. Inmany areas, different tiers of local governments exist and governments in each tier may be involved in aspects ofwaste service delivery. Many alternative forms of service delivery were identified. For example:
1. A regional government might serve an area within which there are a number of local municipalities.
2. The upper tier government might provide all of the waste services.
3. Only the lower tier municipalities might provide services.
4. Both tiers might provide different services (for example, one operates a disposal facility; the other provideswaste collection services).
5. Both tiers could be providing the same services to different parts of the region (a lower tier might run a disposalfacility for just their municipality with the regional government running a disposal facility for the remainder ofthe region).
6. Municipalities in one or both tiers could act co-operatively through a separate government agency such as aregional waste commission that both collects waste and runs the disposal facility.
7. None of the governments in an area could be doing any waste management, leaving provision of waste servicesstrictly to private sector firms.
8. A combination of the above scenarios.
Examples of each of these situations exist in Canada and both the survey vehicle and processing system had to beable to deal with these possibilities.
Extensive respondent follow-up was required in some cases. Returns for specific geographic areas were frequentlyprocessed together in order to build a clear picture of the service delivery area and to prevent either double countingor inadvertently missing pieces of information.
Evaluation of frame coverage
The estimates presented in this report refer only to waste and recyclable materials that have entered the managedwaste stream; in other words, waste or recyclables that have been collected, processed or disposed of by a privatewaste management firm or local government organization. Therefore, waste or recyclables that are directly managedby the generator are not covered.
28 Statistics Canada – Catalogue no. 16F0023X

Waste Management Industry Survey: Business and Government Sectors – 2010
Figure 1
Waste management industry survey coverage
Waste that is managed at the point of generation, on-site by the generator (e.g., backyard composting, disposal facilities owned and operated by the
generator)
Source(s): Statistics Canada, Environment Accounts and Statistics Division
Waste that is man aged at the point of generation, on-
site, by a waste management firm
Waste that is not formally managed by waste
management firms or municipalities
Waste that is formally managed by waste
management firms or municipalities
Waste managed off-site
Survey coverage
Non-hazardous solid waste
For example, waste created by a pulp and paper mill may be managed by the company on site or in anothercompany-run facility without the assistance of separate service providers. As a result, these quantities would not becounted by either survey. Also, waste generators may manage some waste materials themselves. Many householdsand businesses have on-site composters that handle at least a portion of home and garden organic waste. Whilethe amounts of compostable materials handled through central composting programs are included in the report, theon-site component is not. In addition, any unconventional methods of waste disposal, such as illegal dumping arenot included in the survey coverage. (The above points are illustrated in Figure 1).
In-scope establishments
A total of 1,054 fully completed and partially completed in-scope questionnaires were returned for the 2010 surveycycle; 405 for the business sector and 649 for the government sector. For those questionnaires that were notreturned, 231 were considered to be in-scope resulting in a combined total of 1285 in-scope respondents for the twosurveys.
Closures, mergers and acquisitions, out-of-scope establishments
Since the 2008 survey, some structural changes have occurred in the waste management industry. In the businesssector, of the establishments surveyed, 16 went out of business and 1 merger took place. Another 14 businessesthat had provided waste management services in 2008 did not provide these services in 2010 and were determinedto be out-of-scope for the purpose of this survey. There were not reported changes for government sector in thesame period.
Statistics Canada – Catalogue no. 16F0023X 29

Waste Management Industry Survey: Business and Government Sectors – 2010
Revisions
Revisions are made for the previous survey reference period, with the initial release of the current data, as required.The purpose is to address any significant issues with the data that were found between survey cycles. The actualperiod of revision depends on the nature of the issue, but rarely exceeds three years. For the most current dataplease refer to CANSIM tables 153-0041 to 153-0045.
30 Statistics Canada – Catalogue no. 16F0023X

Data accuracy
Many factors affect the accuracy of data produced in a survey. For example, respondents may have made errorsin interpreting questions, answers may have been incorrectly entered on the questionnaires, and errors may havebeen introduced during the data capture or tabulation process. Every effort was made to reduce the occurrence ofsuch errors in the survey. These efforts included: a complete verification of keyed data, validity and consistencyedits, extensive follow-up with the large businesses, and consultation with selected government departments andindustry associations.
Response burden
In order to track and thus make improvements to lessen the burden that these surveys impose on respondents, they wereasked to indicate the amount of time spent completing the questionnaire. The mean average number of hours reported bythe respondents was 3.7.
In general, errors such as incomplete coverage of the universe, incorrect classification of business or governmentactivity and inconsistencies in working definitions can be reduced if the survey is repeated at regular intervals andwith sufficient frequency. In this way, the mailing list may be well maintained and the respondents will be familiarwith the definitions used and the type of information required.
Incomplete coverage of the industry universe occurs when a firm in the industry is overlooked. If the reason fornot including the firm is that it has been incorrectly included in another industry, this is termed a classification error.Such errors have an impact upon estimates. However, these errors are less frequent now than in the past with theadoption of the NAICS classification system (See Data quality, concepts and methodology — Definitions and textbox, The classification of waste management services”).
Assessing data accuracy
One way to assess data accuracy is to compare it with data from other sources. For example, if the survey dataindicates that the amount of waste disposed and diverted has risen substantially since the previous survey, onemight also expect operating revenues and expenses to have risen. Similarly, if a provincial report is releasedindicating that the amount of diverted materials has increased significantly in that province, one might expectthe data obtained from these surveys to follow the same trend. If the data did not follow the expected trends itwould be investigated rigorously. One such comparison has been made with the business survey’s financial datafrom 2010 against administrative data available on Statistics Canada’s Business Register. In addition, recyclingestimates were compared and validated with those published by the provincial governments of Nova Scotia andOntario.
Response rates
The overall response rate for the 2010 waste management industry surveys, based on the ratio of the number ofcompleted and partially completed questionnaires to the total number of in-scope questionnaires, was 75% for thebusiness sector and 87% for the government sector.
Statistics Canada – Catalogue no. 16F0023X 31
Waste Management Industry Survey: Business and Government Sectors – 2010
Imputation rates
Although most businesses and local governments were very co-operative in answering the survey, some could notprovide all the data required in the format in which it was requested. For example, facilities operating without aweigh scale had difficulties answering questions about the weights of material collected or disposed. In cases wherevalues were missing from survey cells or where the respondent did not complete a questionnaire even after extensivefollow-up, information was imputed.
Data reliability
Imputation rates are an indicator of data reliability. Imputation is a term that refers to the proportion of data thatwere not obtained directly through a survey but rather came from an administrative source or was estimated usingdefensible and replicable methodologies.
Imputation is necessary to “complete” the data picture when there are non or missing responses to certain questionsor sets of questions.
Business sector
Employment and financial data for small firms that were not surveyed, as well as in-scope firms that did not respondwere imputed. Administrative sources such as the Statistics Canada Business Register and tax records were usedto fill in the missing values.
For large firms, the imputed values were compared with values from previous years and other sources, such asannual reports and security exchange filings to ensure that the imputed values were correct.
The overall imputation rate for the business financial variables was 26%.
Government sector
Historical data was used to fill in missing financial and employment values for the government sector survey. Howeverdue to the high response rate (87%) for this survey, very few values were in need of imputation.
Waste disposal and recycling
Imputation for missing values in the disposal and recycling sections involved a different set of processes. As thesetwo sections on both the business sector survey and the government sector survey were identical, the results fromthe two surveys were easily combined. This made it possible to remove duplicate data and to obtain a completedresponse from partial responses. For example, in the case where a local government owns a landfill but contracts outits operation, both the government body and the contracted business may have reported for the landfill. In this case,the duplicated data would be removed so that the landfill was accounted for only once. Also, both respondents maynot have been able to report for all aspects of the facility, but by combining responses a completed record could beobtained. To illustrate, a firm may have omitted the total quantity of waste disposed to the landfill but the municipalitymay have reported that value.
In cases where there were missing cell values in the completed survey forms, many of these values were obtainedthrough an intensive period of follow-up through email or telephone calls. Any remaining values were obtained fromprovincial and local government contacts, industry experts and publicly available sources, such as the Internet.
The tables presented in this report cover the data that were determined to be of sufficient quality for publication at adisaggregated level. Data confidentiality considerations as well as imputation rates play a role in this assessment.Data must be released at a level where the disclosure of the identity of any respondent in any cell is not possible.In addition, the levels of imputation must remain within reasonable limits.
32 Statistics Canada – Catalogue no. 16F0023X

Waste Management Industry Survey: Business and Government Sectors – 2010
Data limitations
Every effort has been made to ensure that the data presented in this report are of both high quality and reliability.However, it is important to understand the limitations of the data presented. This knowledge will allow readers tomake informed decisions before conducting further research or analysis using these data
Coverage
As discussed in Section "Data quality, concepts and methodology — Overall approach: data sources andmethodology–Evaluation of frame coverage", the estimates presented in this report refer only to that materialentering the waste stream and do not cover any waste that may be managed on-site by a company or household.While the majority of residential waste is handled by municipalities or private businesses, and thus included in thesurvey coverage, some non-residential waste is managed on-site by industrial generators. Also, some waste istransported by the generator directly to secondary processors. These practices are not currently accounted for bythese surveys despite anecdotal evidence suggesting that they are becoming increasingly common.
Agricultural waste is not covered by these surveys. This waste is typically managed on-site or by specialized firmsthat are not classified by NAICS as part of the waste management industry.
In addition, these data do not include materials that were processed for reuse and resale, (e.g., wholesale of scrapmetals or used clothing), nor those materials that are collected through deposit-return systems and therefore notprocessed at a material recovery facility.
Statistics Canada – Catalogue no. 16F0023X 33

Comparability of data and related sources
Comparisons between data sources
Quebec
Response burden for local governments has been reduced in the province of Quebec by using the results from aprovincial survey administered by RECYC-QUÉBEC. Estimates for diversion in Quebec are derived using thesedata. This arrangement is reviewed after each survey cycle in order to determine whether the data collected andpublished by RÉCYC-QUÉBEC are indeed comparable to those data collected through Statistics Canada surveys.While the amounts reported in most of the categories of diverted materials are comparable to other provinces, theamount of diverted white goods is a notable exception. The definition of white goods and the collection methodologyused by RECYC-QUÉBEC for this category of material differs from that of the Waste Management Industry Survey,resulting in this discrepancy.
Nova Scotia and Ontario
The government of Nova Scotia provides Statistics Canada with an aggregation of their diversion and disposalquantities obtained through their annual data call that goes out to municipalities in that province. Results fromthe Statistics Canada survey are compared to those obtained from Nova Scotia in order to identify, in advance, anysignificant differences between the two data sets. These differences are investigated and explained, where possible.
There is a similar data call initiated by the Waste Diversion Organisation of the province of Ontario that collectsdiversion data from its municipalities. These data are published on-line and accessed by Statistics Canada tocompare and identify any significant differences between the diversion numbers obtained by the waste survey withthose published by Ontario.
Comparisons over time
Data obtained from the 2010 survey are comparable with data from previous years for the following variables:
• Disposal data: comparable with 2002, 2004, 2006, and 2008. Some caution should be exercised when comparingdisposal data prior to 2002 as exported wastes were not included in the estimates prior to 2002. As well, becauseRECYC-QUEBÉC data were used for the residential disposal statistics prior to 2006, some caution should beexercised when comparing these series to those that followed.
• Recycling data: comparable with 2000, 2002, 2004, 2006, and 2008.
• Business sector financial data: Most variables comparable with 1995, 1996, 1998, 2000, 2002, 2004, 2006,and 2008. Some variables have been added or dropped from cycle to cycle.
• Local government sector financial data: Most variables comparablewith 1994, 1996, 1998, 2000, 2002, 2004, 2006, and 2008. Some variables have beenadded or dropped from cycle to cycle. Prior to 2008 revenues from municipal levies were not specificallyrequested from survey respondents. Consequently, government revenues increased significantlyfrom 2006 to 2008. Comparison of 2008 local government operating revenues with previous years is notrecommended. The wording of the question was further changed in 2010. For this reason, caution should beused when comparing 2010 data with 2008 data.
34 Statistics Canada – Catalogue no. 16F0023X

Waste Management Industry Survey: Business and Government Sectors – 2010
Measurement issues
Waste diversion generally refers to material that has avoided disposal through a combination of processes andactions, and refers to activities that handle the waste in such a way such that it is not disposed of in landfills orincinerators.1 There are several points to consider when using these data.
First, the diversion figures include only materials that were processed for recycling at publicly or privately ownedmaterial recycling facilities. The data do not include materials that were processed and reused by a business orpublic body on-site as part of its production process or as part of a secondary economic activity. Those materialsnever entered the non-hazardous waste stream and therefore are not considered to be waste for the purposes ofthis survey.
Second, it is acknowledged that data from a large portion of the “reuse” category are not included in these tables.For example, used clothing that is donated to a retailer and resold is excluded, as are used appliances that arerefurbished and resold. Deposit-return materials, such as beer bottles, are considered to be “reuse” and are notincluded in these tables unless they have been processed at a material recovery facility.
Third, these data do not include those materials managed by wholesalers of scrap metal, plastics or paper. As withthe other data in this report, these data cover only those firms whose primary source of income accrues from wastemanagement activities and those public bodies that provide waste management services.
Fourth, the agricultural sector is largely excluded from these data. Waste and recyclable materials (for example, deadlivestock, manure) from farms are generally managed on-site by the producer or managed by firms who specialize inthe management of agricultural waste. Most of these businesses are not classified as part of the waste managementindustry as defined by the North American Industry Classification System (NAICS).
Fifth, contaminated soil that is used as landfill cover or for some other beneficial purpose at a disposal facility (e.g.the building of berms) is excluded from these data. Other high tonnage excluded materials that should be noted areasphalt from roadworks, as well as debris from land clearing operations (for example, soil, brush, stumps).
Sixth, it is recognized that a potentially large quantity of materials diverted from landfills may be collected understewardship or “take it back” programs. Stewardship programs exist at the national and provincial and territorial levelfor items such as tires, electronics, beverage containers, batteries, paint, used oil, etc. Some of these materials maybe included in data collected by the survey if the firms involved in the collection and/or processing of these materialsfall under the waste management industry as defined by NAICS, or if a municipality involved in the collection ofmaterials or administration of a program has reported these materials on their survey.
Finally, composting data include tonnages managed through centralized programs that are owned and operated bymunicipalities, waste management boards or commissions as well as those facilities that are privately owned andoperated. Compost data exclude biosolids processing or application and estimates for on-site composting programssuch as backyard composting. In addition, data from on-site composting of industrial wastes or wastes from primaryresource extraction (e.g., forestry or fishing) may be excluded if their main business activity does not fall under thewaste management industry as defined by NAICS.
1. GAP Team, June 15, 2000, Manual on Generally Accepted Principles (GAP) for Calculating Municipal Solid Waste Flow. Toronto, p. 15.
Statistics Canada – Catalogue no. 16F0023X 35

Definitions
Composting
Composting is an aerobic biological treatment process used most frequently in Canada at this time for managementof biodegradable residential waste, such as leaf and yard or food wastes.
Construction, renovation and demolition waste (CR&D)
CR&D waste, also referred to as DLC (demolition, landclearing and construction waste), refers to waste generatedby construction, renovation and demolition activities. It generally includes materials such as brick, painted wood,drywall, metal, cardboard, doors, windows, wiring, etc. It excludes materials from land clearing on areas notpreviously developed. CR&D waste can come from residential sources such as house renovations or fromnon-residential sources for example the construction or demolition of office buildings.
Disposal facility
A facility at which waste is landfilled, incinerated, or treated for final disposal.
Diversion
Diversion represents the quantity of materials diverted from disposal facilities and represents the sum of all materialsprocessed for recycling at an off-site recycling or composting facility.
Generation
Total generation is the sum of total non-hazardous residential and non-residential solid waste disposed of in anoff-site disposal facility and the total materials processed for recycling at an off-site recycling facility.
Hazardous waste
Includes materials or substances that given their corrosive, inflammable, infectious, reactive and toxiccharacteristics, may present a real or potential harm to human health or the environment. Due to their hazardousnature they require special handling, storing, transportation, treatment and disposal as specified by theTransportation of Dangerous Goods Regulations (1985), The Canadian Environmental Protection Act (1988), TheBasel Convention (1989), or the Export and Import of Hazardous Waste Regulations (1992).
Incineration/thermal treatment
Incineration, in the context of waste, refers to the burning of waste. Incineration of waste materials converts thewaste into incinerator bottom ash, flue gases, particulates, and heat, which can in turn be used to generate electricpower. Most jurisdictions in Canada consider incineration to be disposal.
36 Statistics Canada – Catalogue no. 16F0023X

Waste Management Industry Survey: Business and Government Sectors – 2010
Industrial, commercial and institutional waste
Industrial, commercial, and institutional (IC & I) waste is the waste generated by all non-residential sources in amunicipality, and is excluded from the residential waste stream. This includes:
• Industrial waste, which is generated by manufacturing, primary and secondary industries, and is managed off-sitefrom the manufacturing operation, and is generally picked up under contract by the private sector;
• Commercial waste is generated by commercial operations such as shopping centres, restaurants, offices, etc.Some commercial waste (from small street-front stores, etc.) may be picked up by the municipal collection systemalong with residential waste;
• Institutional waste is generated by institutional facilities such as schools, hospitals, government facilities, seniorshomes, universities, etc. This waste is generally picked up under contract with the private sector.
Non-residential waste
Includes municipal solid non-hazardous waste generated by industrial, commercial and institutional sources as wellas waste generated by construction and demolition activities.
Recyclable material
Any material that has reached the end of its useful life in the form or purpose for which it was initially made and thatcan be recycled into a material that has value as a feedstock in another production process.
Recycling
Recycling is the process whereby a material (for example, glass, metal, plastic, paper) is diverted from the wastestream and remanufactured into a new product or is used as a raw material substitute.
Residential waste
Residential waste refers to waste from primary and seasonal dwellings, which includes all single family, multi-family,high-rise and low-rise residences.
It includes:
• The waste picked up by the municipality, (either using its own staff, or through contracted companies), and
• The waste from residential sources which is self-hauled to depots, transfer stations and landfills.
Sanitary landfill
A landfill that, at a minimum, accepts only specified types of wastes and whose access is controlled (by a fence orstaff, for example) in order to monitor the types and quantities of wastes being deposited. Often, it also includeslandfills that have technologies in place to keep wastes and leachate from contaminating the groundwater. Thesecan include systems that collect the leachate in order to treat and dispose of it.
Statistics Canada – Catalogue no. 16F0023X 37

Waste Management Industry Survey: Business and Government Sectors – 2010
Tipping fees (disposal fees)
Also known as disposal fees, these are fees that are paid to the owner, lessor or operator of a landfill for the right todispose of waste within that landfill. These fees can be assessed on a weight-based (e.g., per tonne), volume-based(per cubic metre) or per item basis (fees that differ according to the type of material being disposed, such as whitegoods or tires). Tipping fees may also be paid to the owner or operator of recycling facilities, organic materialprocessing facilities, or waste processing facilities.
Transfer station (non-hazardous)
A facility at which wastes transported by vehicles involved in collection are transferred to other vehicles that willtransport the wastes to a disposal (landfill or incinerator)or recycling facility.
Waste
There have been several definitions of waste proposed in recent years. One common thread among these definitionsis the concept that waste is a material that is unwanted by its producer. The unwanted materials may be by-productsof a production process - fly ash from a furnace, for example. Alternatively they might be products, the inherentvalue of which has been consumed from the perspective of the current holder. For example, a newspaper that hasbeen read, a package that has been opened and emptied of its contents, or an apple eaten to the core, are all similarinsofar as they have lost their original inherent value from the consumers perspective.
Waste for disposal
All materials not wanted by their generator and which are discarded for management at waste disposal facilities(excludes materials destined for recycling and composting).
Waste management industry
For the purposes of these surveys, the waste management industry broadly includes all firms and public bodiesoperating in Canada that provide the services of collection, transportation, diversion, treatment or disposal of wasteor recyclable materials.
38 Statistics Canada – Catalogue no. 16F0023X