Industry, Buildings and Waste Introduction
42
1 Industry, Buildings and Waste Introduction In cost data received from the various sources used in this analysis, costs associated with energy efficiency improvements (technologies) were often associated with positive economic benefits. In many cases, investments appeared to be cost effective, and have a rapid payback even under moderate to high discount rates. As such, one would assume that, what ever the financial source, these investments should be undertaken if one assumed only strict financial costs and available capital was not constrained. Defining costs associated with reducing human-caused (anthropogenic) impacts on the carbon cycle is a highly contentious issue. Different approaches to cost assessments (top- down, bottom-up, applicable discount rates, social costing, cost effectiveness, no regrets), different understandings of what costs include (risk, welfare, intangibles, capital investment cycles), different values associated with energy demand in different countries (accessibility, availabilit y, infrastructure, resource type and size), actions and technologies included in the analysis, and the perspective on technology development all have an impact on evaluating costs. Should analysts consider only historical responses to energy prices, production and demand elasticities, or income changes? Does one consider only technology options and their strict financial costs or see historic technology investments as sunk costs? Should one include producers’ or consumers’ welfare? Are there local, national, international issues? (Nyboer, 2007) INDUSTRY I. Introduction Globally, the manufacturing industry 1 is responsible for nearly 29% of world energy consumption, 19% of energy related CO2 emissions and 7% of non-CO2 emissions (USEPA, 2006(b)). Energy and GHG intensity among the different industrial sectors varies greatly and, therefore, potential absolute emissions reduction by industry type varies as well. We focus on the more intense industry because even a small change in their energy or GHG intensity can significantly alter emissions levels (drawn liberally from Nyboer, 2007). This is not to say other manufacturing industries are not important; growth may be rapid and contributions to emissions significant. Pulp and Paper While known to be an energy intensive industry, much of the energy is obtained from biomass, considered carbon neutral, 2 and some types of pulp mills are energy self-sufficient. In an effort to mitigate GHG emissions, biomass fuels can assume a greater proportion of the energy consumed. Emissions reduction associated with improved energy efficiency in boiler design, cogeneration, pulp digestion and pulp and paper drying, along with associated electrical systems provides significant opportunity in some parts of the world to reduce emissions. Cement, Lime, and Other Nonmetallic Minerals Cement and lime, two very energy and GHG intense commodities, generate significant amounts of process emissions due to the calcination of limestone (CaCO 3 ) to calcium oxide (CaO) releasing CO2. Outside of the combustion of fossil fuels, limestone calcining is the single largest 1 Energy industries such as petroleum refining and fossil fuel extraction are covered in the Energy Supply report. 2 UNFCCC and IPCC guidelines
Transcript of Industry, Buildings and Waste Introduction

1
Industry, Buildings and Waste
Introduction In cost data received from the various sources used in this analysis, costs associated with energy efficiency improvements (technologies) were often associated with positive economic benefits. In many cases, investments appeared to be cost effective, and have a rapid payback even under moderate to high discount rates. As such, one would assume that, what ever the financial source, these investments should be undertaken if one assumed only strict financial costs and available capital was not constrained. Defining costs associated with reducing human-caused (anthropogenic) impacts on the carbon cycle is a highly contentious issue. Different approaches to cost assessments (top-down, bottom-up, applicable discount rates, social costing, cost effectiveness, no regrets), different understandings of what costs include (risk, welfare, intangibles, capital investment cycles), different values associated with energy demand in different countries (accessibility, availabilit y, infrastructure, resource type and size), actions and technologies included in the analysis, and the perspective on technology development all have an impact on evaluating costs. Should analysts consider only historical responses to energy prices, produc tion and demand elasticities, or income changes? Does one consider only technology options and their strict financial costs or see historic technology investments as sunk costs? Should one include producers’ or consumers’ welfare? Are there local, national, international issues? (Nyboer, 2007) INDUSTRY
I. Introduction Globally, the manufacturing industry 1 is responsible for nearly 29% of world energy consumption, 19% of energy related CO2 emissions and 7% of non-CO2 emissions (USEPA, 2006(b)). Energy and GHG intensity among the different industrial sectors varies greatly and, therefore, potential absolute emissions reduction by industry type varies as well. We focus on the more intense industry because even a small change in their energy or GHG intensity can significantly alter emissions levels (drawn liberally from Nyboer, 2007). This is not to say other manufacturing industries are not important; growth may be rapid and contributions to emissions significant. Pulp and Paper While known to be an energy intensive industry, much of the energy is obtained from biomass, considered carbon neutral,2 and some types of pulp mills are energy self-sufficient. In an effort to mitigate GHG emissions, biomass fuels can assume a greater proportion of the energy consumed. Emissions reduction associated with improved energy efficiency in boiler design, cogeneration, pulp digestion and pulp and paper drying, along with associated electrical systems provides significant opportunity in some parts of the world to reduce emissions. Cement, Lime, and Other Nonmetallic Minerals Cement and lime, two very energy and GHG intense commodities, generate significant amounts of process emissions due to the calcination of limestone (CaCO3) to calcium oxide (CaO) releasing CO2. Outside of the combustion of fossil fuels, limestone calcining is the single largest
1 Energy industries such as petroleum refining and fossil fuel extraction are covered in the Energy Supply report. 2 UNFCCC and IPCC guidelines

2
human-caused source of CO2 emissions. Energy used to complete the process is often provided by the most carbon intense of fuels, coal, to make this the most carbon-intense of the manufacturing industries. As a result, it is a good candidate for the application of carbon capture and storage (CCS). Emissions from lime and cement production are distributed fairly evenly throughout the world; because the product’s bulk and weight make it undesirable to ship long distances, it is usually produced in the country where it is demanded. Blending ground clinker (product of the cement kiln after calcination) with other cementitious material like flyash, iron slag and pozzolan earths clinker, can reduce process emissions by reducing the amount of clinker required per unit of ground cement. World wide, there remain significant energy efficiency improvements in this and the other heat-intensive industries in the cement, lime and other non-metallic mineral and ceramic industries using proven existing technology. Some cogeneration potential also exists. Nonferrous Metal Smelting and Iron and Steel Smelting Often metal smelting requires the reduction of metal oxides to obtain pure metal through use of a “reductant”, usually coke. Because reduction processes generate relatively pure0020streams of CO2, the potential for capture and storage is good. The process of reduction is undergoing considerable research; alternative processes, such as direct reduced iron using electric arc furnaces, have shown considerable energy savings. In electric arc furnaces, carbon anodes decompose to CO2 as they melt the scrap iron and steel feed in “mini-mills”. In Hall-Heroult cells, a carbon anode oxidizes when an electric current forces oxygen from aluminum oxide (alumina) in the production of aluminum. Ceramic anodes may soon be available to aluminum producers and significantly reduce process CO2 emissions. Metal and Nonmetal Mining Mining involves the extraction of ore and its transformation into a concentrated form. This involves transportation from mine site, milling and separating mineral-bearing material from the ore. Some transportation depends on truck activity but the grinding process is driven by electric motors (i.e., indirect release of CO2). Some processes, like the sintering or agglomeration of iron ore and the liquid extraction of potash, use a considerable amount of fossil fuels directly. These show potential for energy efficiency and consequent emissions reduction. Chemical Products This diverse group of industries includes energy-intensive electrolytic processes as well as the consumption of large quantities of natural gas as a feedstock to produce commodities like ammonia, methanol, and hydrogen. Ethylene and propylene monomers from natural gas liquids are used in plastics production. Some chemical processes generate fairly pure streams of CO2 suitable for CCS. Other Manufacturing Most of the remaining industries, while economically important, individually play a relatively minor role in emissions generation because they are not energy intensive. In aggregate, however, these various industries contribute significantly to total industrial CO2 emissions. Because heat, steam, lighting and electromotive force are the primary energy end-uses, considerable potential for efficiency improvements can impact levels of absolute emissions generation. Industries in this group include the automotive industry, electronic products, leather and allied products, fabricated metals, furniture and related products, and plastics and rubber products.

3
Within the Industrial sector, the source for the current situation, reference, and mitigation scenario energy use and CO2 emissions is the International Energy Agency, with the IEA’s Beyond Alternative Policies scenario used as the Mitigation Scenario (IEA, 2006). Non-CO2 emissions come from the United States Environmental Protection Agency (EPA)’s Global Mitigation of Non-CO2 Greenhouse Gases report (EPA, 2006(b)).
II. Current Situation – year 2000 a. Energy consumption and mix, GHG emissions
Table 1.1 provides an overview of industrial energy consumption and GHG emissions. See App. A and B for complete fuel consumption and GHG emission tables disaggregated by country.
Table 1.1: Industrial Sector Fuel Consumption and CO2e Emissions in 2000 Fuel Consumption (Mtoe) Emissions (Mt CO2e)
Country/Region Fossil Fuels Electricity
Non-Fossil Fuels Total Combust’n
Non-CO2 Total
World 1138.5 457.4 160.7 1756.7 4366.4 2446.1 6812.5 OECD 538.3 277.4 67.4 883.0 1950.7 1079.5 3030.2 OECD North Am 242.0 124.3 44.7 410.9 822.3 627.8 1450.1
United States 192.9 98.2 35.9 327.0 660.5 474.2 1134.8 Canada 29.0 17.5 7.6 54.2 94.0 73.4 167.4 Mexico 20.1 8.6 1.2 29.8 67.8 80.1 147.9
OECD Pacific 100.1 53.5 5.3 158.9 413.3 126.8 540.1 Japan 64.4 34.7 2.3 101.5 269.8 57.0 326.8 Korea 19.4 10.9 0.0 30.4 82.7 26.9 109.6
Australia + NZ 16.2 7.8 3.0 27.1 60.8 42.9 103.7 OECD Europe 196.2 99.6 17.4 313.2 715.1 324.9 1040.0
Transition Econ 106.2 41.0 1.5 148.7 413.9 497.0 910.9 Russia 53.1 26.9 0.6 80.6 217.5 237.0 454.5
Other EIT 53.1 14.1 0.9 68.1 196.4 259.9 456.4 Developing Region 494.0 139.1 91.9 725.0 2001.8 869.7 2871.5
Developing Asia 332.3 93.5 36.3 462.0 1425.5 527.3 1952.8 China 200.7 56.9 0.0 257.6 903.1 289.7 1192.9 India 54.7 13.6 22.2 90.6 225.4 90.0 315.4
Indonesia 18.0 2.9 2.0 22.9 69.3 59.3 128.7 Other Developing
Asia 58.8 20.0 12.1 90.9 227.6 88.2 315.9 Latin America 60.6 24.4 33.7 118.7 219.4 107.2 326.6
Brazil 23.1 12.6 22.0 57.6 94.0 24.9 118.8 Other Latin Am 37.5 11.8 11.8 61.1 125.4 82.3 207.7
Africa 31.2 14.8 21.7 67.7 136.3 128.7 265.0 Middle East 69.9 6.4 0.2 76.5 220.7 106.4 327.1
Non-fossil fuel combustion data are not directly comparable to the Reference and Mitigation scenario data, due to differences in how they are calculated. The CO2 emissions from coke in the iron and steel sectors are considered to be combustion emissions, while many of the non-CO2 emissions are process emissions. Industrial process emissions alone are estimated at 826 Mt CO2e in 2000. Non-CO2 industrial emissions include N20 (produced primarily by the nitric acid and adipic acid industries), methane, and high global-warming-potential gases such as hydrofluorocarbons

4
(HFCs), perfluorocarbons (PFCs), and sulfur hexafluoride (SF6) (produced by the aluminum, magnesium, semiconductors, and HCFC-22 industries). By 2000 all major adipic acid production plants had implemented abatement technologies and dramatically reduced N2O emissions (USEPA, 2006(b)). The OECD is responsible for 44% of combustion and non-CO2 emissions, and developing countries for 29%, with the United States and China both responsible for approximately 17% of global industrial emissions. Fossil fuels comprise the majority of energy consumption, at 65%, while electricity consumption makes up 26%. The OECD consumes 50% of total fuel – slightly more than their share of emissions, while developing countries consume 26% - slightly less than their share of emissions. The United States is responsible for 19% of global fuel consumption, with China having the second largest demand, at 15%.
b. Overview of current financing sources
Table 1.2 shows the sources of financing for industry in each major global region. Table 1.2: Breakdown of Industrial Gross Fixed Capital Formation, $Millions (2000 USD)
Total GFCF
Domestic Investment
FDI Flows Debt
Bilateral ODA
Multilateral ODA
Africa 12,983.6 10,984.0 1,313.5 460.9 166.3 58.9 Annex-I Parties 813,357.7 746,433.6 2,707.7 64,214.9 1.4 0.0 Central Europe 104.7 104.7 0.0 0.0 0.0 0.0 Developing Asia 230,647.2 189,064.8 40,186.6 1,210.0 177.2 8.6 Eastern Europe 268.1 264.8 0.0 0.0 3.4 0.0 EU 284,013.1 178,285.1 73,194.7 32,533.3 0.0 0.0 Latin America 68,286.8 51,443.4 15,039.5 1,630.3 152.7 21.0 Middle East 30,357.1 27,307.5 3,047.5 0.0 2.1 0.0 North Africa 12,565.8 11,451.9 1,013.5 0.0 100.3 0.0 Northern Europe 0.0 0.0 0.0 0.0 0.0 0.0 OECD North America 376,404.7 199,824.3 146,205.8 30,373.6 1.1 0.0 OECD Europe 305,845.9 190,591.7 82,619.1 32,633.5 1.6 0.0 OECD Pacific 217,115.9 212,781.7 2,884.9 1,449.3 0.0 0.0 Other ( small island) 327.5 -418.8 0.0 745.2 1.1 0.0 Transition Economies 22,368.5 18,738.2 3,605.3 7.4 17.7 0.0 WORLD TOTAL 1,277,701.6 912,197.8 295,931.8 68,860.2 623.4 88.4
As Table 1.2 shows, most industrial investment (71% globally) comes from domestic investment, particularly in developing and transition economies – in OECD Europe and OECD North America, only 62% and 53% of industrial financing is domestic. Foreign direct investment provides 23% of total funding, but again is heavily weighted toward OECD Europe (27% of total) and OECD North America (39%). Debt plays a small role, and again is concentrated in developed countries, while official development assistance hardly registers as an industrial financing source.
III. Reference Scenario
a. Energy consumption and mix, GHG emissions The International Energy Agency’s World Energy Outlook 2006 Reference Scenario is used in this study as the source for industrial energy use and CO2 emissions. The Reference Scenario includes government policies and measures that were enacted or adopted by mid-2006, even if

5
they have not yet been fully implemented. However, possible, potential or even likely future policy actions are not included. Thus the Reference Scenario represents a “baseline vision of how energy markets would evolve if governments do nothing beyond what they have already committed themselves to doing to influence long-term energy trends” (IEA, 2006, p. 54). Both energy supply and energy end-use technologies are assumed to become gradually more efficient each year, and CCS is not expected to become commercially attractive on a large scale within the Reference Scenario time period (IEA, 2006). The Reference Scenario for non-CO2 greenhouse gas emissions comes from the baseline projections made in the U.S. Environmental Protection Agency report Global Anthropogenic Non-CO2 Greenhouse Gas Emissions: 1990-2020. Most of these emissions are process emissions. Sector-specific climate policy programs, agreements, and measures that are already in place are included, but planned activities with less certain impacts are excluded unless a well established program or an international sector agreement is in place (USEPA, 2006(a)). Regression analysis was used to estimate emissions for 2025 and 2030 , and some mitigation technologies are assumed to be adopted in the Reference Scenario to meet industry reduction targets (USEPA, 2006(b)). Table 2.1 and Figures 2.1 and 2.2 provide an overview of reference scenario industrial energy consumption and GHGs. Fuel consumption and GHG tables for the years between 2000 and 2030, with data available for specific countries in addition to the regional groupings in Table 2.1 can be found in Appendices C and D. Estimating the growth of industrial process CO2 emissions under a Reference Case scenario should be a priority for future reports on this topic.
Table 2.1: Industrial Sector Fuel Consumption and CO2e Emissions in 2030, Reference Scenario Fuel Consumption (Mtoe) Emissions (Mt CO2e)
Country/Region Fossil Fuels Electric
Non-Fossil Fuels Total Combust
Non-CO2* Total
World 2,597.0 939.9 395.1 3,931.9 8,075.2 4,690.7 12,765.9 OECD 903.0 351.2 138.8 1,393.0 2,593.2 1,935.3 4,528.5
OECD North Am 409.8 140.2 69.5 619.5 1,145.4 1,211.5 2,356.9 United States 318.8 96.7 56.8 472.3 898.9 798.7 1,697.6
Canada 55.9 22.9 12.1 90.9 152.3 91.6 244.0 Mexico 35.1 20.7 0.6 56.4 94.2 320.7 415.0
OECD Pacific 188.6 75.2 19.7 283.4 588.4 298.4 886.8 Japan 100.0 36.6 8.1 144.6 320.3 97.1 417.3 Korea 67.0 26.4 6.2 99.5 208.3 122.3 330.6
Australia +NZ 21.6 12.2 5.5 39.2 59.9 79.0 138.9 OECD Europe 304.6 135.8 49.6 490.0 859.3 425.5 1,284.8
Transition Econ 211.5 72.2 53.0 336.7 593.9 695.1 1,288.9 Russia 104.4 43.4 41.4 189.2 280.4 306.9 587.3
Other EIT 107.1 28.8 11.6 147.5 313.5 388.1 701.6 Developing Regions 1,482.5 516.5 203.4 2,202.3 4,888.2 2,060.3 6,948.5
Developing Asia 1,041.9 393.4 115.7 1,551.0 3,684.7 1,149.7 4,834.4 China 656.9 282.2 62.7 1,001.8 2,470.6 710.3 3,180.9 India 155.4 45.5 30.0 230.9 516.0 226.2 742.2
Indonesia 52.6 9.0 2.5 64.0 154.7 62.3 217.0 Other Developing Asia 177.1 56.8 20.5 254.4 543.5 150.9 694.4
Latin America 133.1 66.7 53.4 253.2 375.2 279.3 654.5

6
Brazil 55.9 26.3 42.6 124.8 168.9 71.2 240.1 Other Latin Am 77.2 40.5 10.8 128.4 206.3 208.2 414.5
Africa 63.3 32.9 34.0 130.2 188.2 293.5 481.7 Middle East 244.1 23.4 0.3 267.8 640.2 337.7 977.8
*Predominantly process emissions Figure 2.1: Reference Scenario Fuel Consumption by Region
Reference Scenario Fuel Consumption
0
500
1,000
1,500
2,000
2,500
3,000
3,500
4,000
4,500
2005 2010 2015 2020 2025 2030
Year
Mto
e
Developing
Transition
OECD
Figure 2.2 Reference Scenario Emissions by Region
Reference Scenario Emissions
0
2,000
4,000
6,000
8,000
10,000
12,000
14,000
2005 2010 2015 2020 2025 2030
Year
MtC
O2e Developing
Transition
OECD
Under the Reference Case Scenario, fuel consumption rises each time period in every region every year, but particularly in developing countries, where fuel consumption doubles between 2005 and 2030. This growth is driven by rising population levels; continued economic growth;

7
and urbanization and infrastructure development in China and other non-industrialized countries (WBCSD, 2006). However, the Reference Case scenario also includes significant energy efficiency improvements every year (estimated at 1.5% annually by Vattenfall (Vattenfall, 2007(c)), as energy intensity in developing and transition economies approaches current OECD levels by 2030 (IEA, 2006). A number of major emission reduction technologies are expected to be adopted under the Reference Scenario, including a shift of Chinese cement production to the pre-heater/precalciner technology (Vattenfall, 2007(c)), 100% process switching in the steel industry from the basic oxygen furnace to the electric arc furnace by 2030, as well as many other industrial technologies that are cost effective without a carbon price (Vattenfall, 2007(c)). Globally there is a slight fuel shift away from fossil fuels and toward non-fossil fuels from 2005 to 2030, which is the trend seen in the OECD. Transition economies experience a shift away from electricity and toward fossil fuels and non-fossil fuels, while developing countries shift slightly away from fossil fuels and toward electricity, and in China's case, toward non-fossil fuels. India on the other hand experiences a shift away from non-fossil fuels. As fuel consumption increases, so do combustion-related emissions. Overall emissions grow moderately in the OECD and transition economies, but grow extremely rapidly in developing countries. Industrial methane emissions fall in 2015, and then continue to rise, while industrial N20 emissions drop after 2020 by over 50%, as emissions from the adipic and nitric acid sectors fall significantly. Commitments by the global aluminum, semiconductor, and magnesium industries, as well as end-users, to substantially reduce emissions of high-GWP gases are included in the Reference Scenario, but HFC and PFC emissions still triple between 2005 and 2030 and SF6 emissions nearly double, due to strong growth in semi-conductor manufacturing, refrigeration, and air conditioning, as well as their use as substitutes for ozone depleting substances (Vattenfall, 2007(c), USEPA, 2006a).
b. Investment needs for the reference scenario Table 2.2 presents the projected industrial gross fixed capital formation per region through 2030 Table 2.2: Gross Fixed Capital Formation by Region and Time Period $Million (2005 USD)3
2002 2005 2010 2015 2020 2025 2030
Africa 25 20 28 36 45 56 71
Developing Asia 276 443 668 874 1 066 1 238 1 406
Latin A merica 88 34 44 53 61 69 79
Middle East 45 14 36 42 55 74 100
OECD Europe 313 243 291 369 417 452 431
OECD North America 323 372 426 481 543 586 628
OECD Pacific 160 251 258 342 363 387 411
Transition Economies 38 21 28 35 41 47 54
World 1 268 1 397 1 779 2 232 2 592 2 911 3 179 As in the current situation, a large majority of gross fixed capital formation is expected to come from domestic investment. However, detailed investment requirements are not known, and future research should attempt to estimate the industrial investments in energy efficiency and fuel switching required under the Reference Scenario.
3 Currency conversion from 2001 to 2005 USD done by UNFCCC staff.

8
IV. Mitigation Scenario a. Energy consumption and mix, GHG emissions
For Industrial Sector CO2 emissions, the WEO’s Beyond Alternative Policies Scenario (BAPS) is used as the Mitigation Scenario. This aggressive scenario caps CO2 emissions in 2030 at 2004 levels (26.1 Gt CO2e). The technology shifts it envisions are technically feasible, but occur at an unprecedented scale and rate, and hence require aggressive policies and the adoption of new technologies (IEA, 2006). For non-CO2 emissions, marginal abatement curve data from the U.S. Environmental Protection Agency report Global Mitigation of Non-CO2 Greenhouse Gases was used to model emission reductions achievable at a cost of $30 USD/tonne CO2e (2000 dollars). This value was selected because the marginal abatement cost curves were observed to rise sharply beyond this point. Regression analysis was used to estimate emissions for 2025 and 2030. Table 2.3 and Figures 2.3 and 2.4 provide an overview of industrial energy consumption and GHG emissions under the Mitigation Scenario. Fuel consumption and GHG emission tables for the years between 2000 and 2030, with data available for specific countries in addition to the regional groupings in Table 2.3 can be found in Appendices E and F.
Table 2.3: Industrial Sector Fuel Consumption and CO2e Emissions in 2030, Mitigation Scenario Fuel Consumption (Mtoe) Emissions (Mt CO2e)
Country/Region Fossil Fuels Electricity
Non-Fossil Fuels Total Combust’n
Non-CO2* Total
World 2,167.2 794.5 415.2 3,376.9 6,076.0 2,931.0 9,006.9 OECD 788.0 299.0 138.2 1,225.2 2,095.1 1,334.4 3,429.5
OECD North America 354.2 121.1 66.0 541.3 939.7 869.8 1,809.5 United States 276.4 83.0 53.7 413.1 733.6 589.7 1,323.3
Canada 47.2 19.6 11.7 78.6 125.1 72.1 197.2 Mexico 30.6 18.4 0.6 49.6 81.0 207.8 288.7
OECD Pacific 167.4 66.6 22.5 256.5 458.1 188.5 646.6 Japan 89.2 31.8 9.4 130.4 241.8 74.3 316.1 Korea 59.7 24.1 6.4 90.2 171.2 75.4 246.6
Australia + NZ 18.5 10.7 6.7 35.9 45.2 38.8 84.0 OECD Europe 266.4 111.3 49.7 427.4 697.3 276.1 973.4
Transition Economies 173.1 62.2 48.6 283.9 445.3 438.3 883.6 Russia 87.3 38.6 38.2 164.0 221.8 197.1 418.9
Other EIT 85.8 23.7 10.4 119.9 223.5 241.1 464.6 Developing Countries 1,206.1 433.3 228.4 1,867.8 3,535.6 1,158.3 4,693.9
Developing Asia 835.6 327.9 140.4 1,303.8 2,543.6 536.5 3,080.1 China 524.3 233.5 73.4 831.2 1,646.1 292.2 1,938.3 India 121.6 39.8 33.1 194.5 366.4 115.2 481.6
Indonesia 44.5 7.9 4.0 56.5 120.9 35.6 156.5 Other Developing Asia 145.2 46.6 29.8 221.6 410.3 93.3 503.6
Latin America 110.0 55.3 50.2 215.6 300.1 190.7 490.8 Brazil 46.6 21.3 39.5 107.4 133.2 47.9 181.1
Other Latin Am 63.4 34.1 10.8 108.2 166.9 142.8 309.7 Africa 53.6 29.2 37.5 120.3 149.1 190.1 339.1
Middle East 206.9 20.9 0.3 228.1 542.8 241.1 783.9 * Predominantly process emissions

9
Figure 2.3: Mitigation Scenario Fuel Consumption by Region
Mitigation Scenario Fuel Consumption
0
500
1,000
1,500
2,000
2,500
3,000
3,500
4,000
2005 2010 2015 2020 2025 2030
Year
Mto
e Developing
Transition
OECD
Figure 2.4: Mitigation Scenario Emissions by Region
Mitigation Scenario Emissions
0
1,000
2,000
3,000
4,000
5,000
6,000
7,000
8,000
9,000
10,000
2005 2010 2015 2020 2025 2030
Year
MtC
O2e Developing
Transition
OECD
Under the Mitigation Scenario, fuel consumption rises slowly in the OECD and transition economies, but rises by over 60% from 2005 to 2030 in developing countries. There is a slight global and developing country shift away from fossil fuels and toward electricity, while the OECD moves toward non-fossil fuels instead, and transition economies move away from non-fossil fuels and toward fossil fuels and electricity. Total emissions rise in each region in every time period, but global combustion emissions actually stabilize in 2015, and then fall after 2020. Industrial methane emissions fall until 2015 and then rise, while industrial N20 emissions drop by 90% after 2005 and stay low from then on.

10
Emissions of SF6 drop until 2010 and then rise slowly, while HFCs and PFCs continue to rise every period. Figures 2.5 shows how fuel consumption rises in both scenarios, although less sharply in the Mitigation Scenario, while Figure 2.6 shows that emissions under the Mitigation Scenario actually decline before rising slightly, compared to strong growth under the Reference Scenario. Figure 2.5: Mitigation vs. Reference Scenario Fuel Consumption
Mitigation vs. Reference Scenario Fuel Consumption
2,500
2,700
2,900
3,100
3,300
3,500
3,700
3,900
4,100
2005 2010 2015 2020 2025 2030
Year
Mto
e Mitigation
Reference
Figure 2.6: Mitigation vs. Reference Scenario Emissions
Mitigation vs. Reference Scenario Emissions
6,000
7,000
8,000
9,000
10,000
11,000
12,000
13,000
14,000
2005 2010 2015 2020 2025 2030
Year
MtC
O2e Mitigation
Reference
Compared to the Reference case, fossil fuel and electricity demand declines by 17% and 15% respectively in the Mitigation scenario, while non-fossil fuel energy consumption rises by 5%. Almost all of this growth comes from biomass and waste consumption, particularly in Asia, where increased combined heat and power projects using biomass displace some gas and coal

11
(IEA, 2006). All regions reduce their fuel demand, with China accounting for 30% of the total reduction in fuel consumption. Significant contributors to fossil fuel demand reductions between the Reference and Mitigation scenarios are a substitution of coal with natural gas in China, and a decline in oil demand in developing countries due to fuel switching and improvements in process heat and boiler efficiencies. In transition economies, improved industrial efficiency leads to significant natural gas demand reductions. Electricity consumption in OECD countries falls by 25%, with motor system efficiency improvements a prime contributor to the decline. More than half of global industrial energy savings result from increased efficiency in the iron and steel, chemicals, and non-metallic minerals industries, with industrial energy intensity in non-OECD countries approaching OECD levels by 2030 (IEA, 2006). Efficiency improvements reduce both fuel and electricity use, while cogeneration investments reduce fuel demand, by capturing heat from the electricity generation process. Global combustion-related CO2 emissions decline by 25% in the Mitigation Scenario, compared the Reference Scenario, with developing Asia reducing emissions the most (-31%) led by China (-33%) and India (-29%). China alone is responsible for 40% of the combustion-related emission reductions in 2030, while the OECD accounts for 25% of total reductions. Global non CO2 emissions (mostly process emissions) decline by 28%, led by a 59% decline in China (representing 24% of total global non-CO2 emission reductions), primarily due to reduced industrial methane emissions. China also significantly reduces its HFC and PFC emissions. The US contributes 12% of global non-CO2 emission reductions, reducing domestic emissions (especially industrial methane emissions) by 26%.
b. Investment needs for the mitigation scenario Most emission reductions from the industrial sector result from improved efficiency of motor systems as well as current industrial processes, feedstock substitution in the cement industry, CO2 capture and storage (CCS), and efforts to reduce non-CO2 emissions (Vattenfall, 2007(c)). There is also a fuel-shift away from fossil fuels and electricity, and toward biomass and waste. Within this sector, financing for abatement projects is generally internal, and comes from businesses directly (IEA, 2006). Energy efficiency investments in particular are often cost effective currently if one assumed only strict financial costs (intangible costs such as service quality are not estimated here). However, barriers such as the upfront investment cost, lack of awareness of alternatives, and training requirements to effectively undertake emission reduction activities or operate new equipment prevent the uptake of many of these cost effective investments. In developing countries in particular, the mobilization of the initial capital investment can be a significant barrier. We estimate that in 2030 a minimum of $205.5 billion (2000 USD) of incremental investment will be needed to meet the mitigation scenario emission levels, compared to the Reference Scenario emission levels. 4,5 This includes $43.7 billion to reduce CO2, and $161.8 billion to reduce non-CO2 emissions, most of which are process emissions. Table 2.5 presents the estimated investment required in the intervening years between the present and 2030.
4 The investment needs in Dialogue Working Paper 8 differ from those presented here. To ensure that investment estimates in the Working Paper are consistent between sectors, a different methodology was used to estimate each sector’s investment requirements in the mitigation scenario. Costs from CDM projects were extrapolated to estimate industrial methane emissions. IEA provided energy efficiency investments globally until 2030. These were allocated to regions based on energy consumption, and divided by 26 to get a proxy for investment for only 2030. 5 The cost data here are NOT uniformly adjusted to 2005 USD. Subsequent interim reports be updated.

12
Investments to improve fuel efficiency are estimated at $18 billion, and CCS investments are an additional $5 billion. As most of the mitigation activities are efficiency or process in nature, no extraordinary infrastructure or education investments are expected to be needed. Table 2.5: Estimated incremental industrial investment to achie ve the Mitigation Scenario (CO2 emission reductions only) Mitigation Scenario Industry Investment to reduce CO2 Emissions ($billion USD, 2005) 2005 2010 2015 2020 2025 2030 OECD Fuel Efficiency $0.0 $0.4 $2.5 $4.6 $6.8 $8.9 OECD Electricity Efficiency $0.0 $0.5 $3.4 $6.3 $9.2 $12.1 OECD CCS $2.2 Total OECD $0.0 $0.8 $5.9 $10.9 $16.0 $23.2 non-OECD Fuel Efficiency $0.0 $0.4 $2.6 $4.7 $6.9 $9.1 non-OECD Electricity Efficiency $0.0 $0.4 $2.4 $4.5 $6.5 $8.6 non-OECD CCS $2.8 Total non-OECD $0.0 $0.8 $5.0 $9.2 $13.4 $20.4 Total World $0.0 $1.6 $10.9 $20.2 $29.4 $43.7 In order to estimate the incremental investment required to meet the Mitigation Scenario’s CO2 emission targets, the investment requirements to meet the WEO’s Alternative Policy (AP) Scenario were used as a starting point, as investment estimates are available for this moderate-mitigation scenario (IEA, 2006)6. Costs were then estimated for the additional efficiency assumed by the Beyond Alternative Policy (BAP) Scenario - a 6.38% electricity efficiency improvement (mostly from improved motor-drive systems (IEA, 2006) and a 7% fossil fuel efficiency improvement by 2030 in each region. The BAP Scenario also included 0.5Gt CO2 of CCS by 2030, which was assumed to occur at a rate of 0.1Gt CO2 per year from 2026-2030, at a cost of $49.80 per tonne of CO2 (40 EUR/ton CO2 converted to 2005 USD) (Vattenfall, 2007(c)). The estimation is rough, and is illustrative only, due to data limitations. Year 2030 investment in electricity efficiency was assumed to be 6.38% greater than the AP Scenario and investment in fossil fuel efficiency was estimated to be 7% greater than the AP Scenario. As AP Scenario investment costs displayed roughly straight-line growth from 2010 to 2030, the additional investment costs to achieve the BAPS scenario were assumed to follow the same trend, and investment requirements for the intervening years were calculated accordingly. Overall, this results in an under-estimation of investment costs. Ideally, a marginal cost curve would have been used to estimate the additional costs for the additional efficiency, but only average costs were available. Tables 2.6 and 2.7 provide detailed incremental investment requirements to achieve non-CO2 emission reductions in the industrial sector. To estimate non-CO2 investment costs, EPA cost curve data were used to identify mitigation activities that could be undertaken for less than $30/tonne CO2e capital cost, beyond which the marginal cost curves was observed to rise sharply. A model was constructed to calculate the amount of each activity that would be undertaken in each country in each time period, and the
6 Demand-side investment figures for OECD and non-OECD countries were provided for 2030, and investment in each intervening time period was estimated from a line graph. Investment allocated to the Industrial sector in each time period was calculated by applying the Industry share of total investment over the 2005-2030 time period to the estimates of investment in intervening years.

13
total investment requirement. The detailed investment requirement estimates for N20 emission reduction are presented in Appendix G. Table 2.6 Mitigation Scenario Investment Requirements to Mitigate N20 Emissions from the Nitric Acid and Adipic Acid Industries ($billion US, 2000)
Non-CO2 Emission Abatement Investment ($Million 2000 USD) Region 2010 2015 2020 2025 2030 Nitric Adipic Nitric Adipic Nitric Adipic Nitric Adipic Nitric Adipic Africa Developing Asia $19.6 $2.1 $0.0 $0.1 $9.0 $0.1 $0.5 $0.1 $6.5 $8.1 Latin America $3.1 $0.4 $0.0 $1.5 $0.1 $7.7 $1.4 Middle East North Africa OECD-North America $14.0 $1.6 $0.0 $0.1 $6.5 $0.1 $0.5 $0.1 $34.7 $6.1 OECD-Europe $34.9 $4.1 $0.0 $0.2 $15.2 $0.1 $0.5 $0.1 $76.8 $1.5 OECD-Pacific $2.6 $0.8 $0.0 $0.1 $1.1 $0.1 $5.7 $3.1 Other Transition Economies $3.6 $0.4 $0.0 $1.6 $0.1 $8.6 $1.6 TOTAL $77.8 $9.4 $0.0 $0.5 $34.9 $0.3 $1.8 $0.3 $140.0 $21.8
Table 2.7 Total Mitigation Scenario Investment Requirements to Mitigate N20 Emissions ($billion US, 2000)
Total N2O Emission Abatement Investment ($Million 2000 USD) Region 2010 2015 2020 2025 2030 Africa Developing Asia $21.7 $0.1 $9.1 $0.6 $14.6 Latin America $3.5 $1.5 $0.1 $9.1 Middle East North Africa OECD-North America $15.6 $0.1 $6.6 $0.6 $40.8 OECD-Europe $39.0 $0.2 $15.3 $0.6 $78.3 OECD-Pacific $3.4 $0.1 $1.1 $0.1 $8.8 Other Transition Economies $4.0 $1.6 $0.1 $10.2 TOTAL $87.2 $0.5 $35.2 $2.1 $161.8
A second point estimate of incremental abatement cos ts for industrial GHG mitigation was calculated based on Vattenfall’s 2007 report Global Mapping of Greenhouse Gas Abatement Opportunities up to 2030 – Industry Sector Deep-dive to be $62.1 billion USD. This estimate provides additional detail about the key technologies that are adopted under a mitigation scenario, but the abatement costs include energy savings resulting from the investments, and not just the initial capital cost. Table 2.8 details the Vattenfall estimates, with the amount of CO2e abatement achieved with each technology adjusted to the actual emission reductions under the Mitigation scenario. The industrial CO2 mitigation technology estimates from Table 2.8 can be viewed in conjunction with the total investment requirement estimates in Table 2.5 in order to provide a complete picture of industrial CO2 mitigation, while the high global-warming-potential gases section provides an estimate of abatement costs for hydrofluorocarbons (HFCs), perfluorocarbons (PFCs), and sulfur hexafluoride (SF6), which are not modeled in Tables 2.6 and 2.7. The abatement costs in Table 2.8 show that energy efficiency in the clinker process in the cement

14
industry and direct casting in the steel industry are associated with negative abatement costs, indicating that they save money as well as reducing emissions, and so should be priorities for investment. The regional distribution of these industrial abatement opportunities in 2030 is 26% in China, 13% in the US and Canada, 10% in OECD Europe, 12% in Eastern Europe, 14% in other industrial countries, and 25% in the rest of the world (Vattenfall, 2007(c)). Table 2.8: Estimated incremental abatement cost to achieve the Mitigation Scenario, including fuel savings (2005 USD)
Industry Technology Abatement Cost USD/tCO2e
Gt CO2e Reduced in 2030
Abatement Cost (USD)
Cement Fuel efficiency -$41 0.13 $0 Fuel Substitution $36 0.13 $4,542,532,104 Clinker substitutes $20 0.19 $3,825,501,243 CCS $50 0.21 $10,573,135,070 Steel Cogeneration $26 0.08 $2,055,887,375 Process energy efficiency $32 0.08 $2,545,384,369 Material and product effic. $32 0.04 $1,272,692,184 Direct casting -$9 0.08 $0 Smelt reduction $20 0.08 $1,566,390,381 CCS $50 0.16 $7,831,951,904 Other Indust Cogeneration $27 0.16 $4,307,573,547 Steam systems efficiency $27 0.16 $4,307,573,547
Materials production process energy effic. $27 0.12 $3,230,680,160
Fuel substitution $32 0.12 $3,818,076,553 Material and product effic. $25 0.04 $978,993,988 Feedstock substitution $21 0.08 $1,664,289,780 Process Innovation $26 0.08 $2,055,887,375 CCS $50 0.08 $3,915,975,952 High GWP ODS substitution $11 0.27 $2,898,303,085 Industrial Process* $13 0.06 $756,020,158 TOTAL $62,146,848,773 Process Emissions Cement Clinker substitute $20 0.26 $5,137,760,449 Electricity Reduction Steel Motor Efficiency $32 0.04 $1,272,692,184 Other Indust Motor Efficiency $42 0.90 $38,278,664,929 Total $39,551,357,113 * Industrial process includes primary aluminum + HCFC-22 + semiconductor + magnesium manufacturing/production Source: Vattenfall, 2007(c), with emissions mapped to IEA BAPS
Although this report only deals with fuel-related CO2 emissions, two other industrial sources of emission reductions are too large to avoid mentioning. The clinker making process in the cement

15
industry results in significant process-related CO 2 emissions (as well as fuel-related emissions), and substituting other materials for clinker in the final cement product therefore reduces the use of clinker, and the associated process emissions. The abatement cost associated with substituting up to 30% of clinker with other materials is $5.1 billion USD (including fuel savings). Electricity-related emissions are discussed in the Energy Supply report, but the significant role of motor efficiency on reducing industrial emissions warrants its inclusion in the discussion here. Improved motor efficiency across the industrial sector reduces emissions by almost 1 Gt CO2 in the Mitigation scenario, with an associated abatement cost (including fuel savings) of $39.6 billion USD. Overall, compared to the Reference Scenario, energy consumers have to invest more in the Mitigation scenario, while energy producers invest less. Consumers in OECD countries pay approximately eight times more for CO2 reduction than consumers in non-OECD countries on a per-capita basis, as both the capital cost of equipment and the initial efficiency is higher in OECD countries. Energy bill savings are still nearly four times the increased investment requirements, and the payback periods for investments are very short, particularly in developing countries and for policies taken before 2015. However, government intervention remains necessary to overcome barriers preventing the initial investments from being made (IEA, 2006).
VI. Assessment of needed changes in financial and policy arrangements to fill the gap between the BAU and mitigation scenarios (changes to existing policy mechanisms and some insight on any new sources of finance that could be used)
The feasibility of reducing industrial emissions to those in the Mitigation Scenario is high, as emissions are easy to track, most emitters are large and economically rational, abatement measures do not usually have an impact on consumers’ lifestyles, and non-CO2 gases are limited and easily identifiable (Vattenfall, 2007(c)). Additionally, most financing for industrial efficiency improvements comes internally from business. However, within industry, the majority of mitigation opportunities exist in China and other developing countries, where the upfront financial investment, as well as knowledge about, and availability of advanced technologies are often lacking. As a result, additional mechanisms will be needed to stimulate industrial investment to meet the Mitigation Scenario goals in developing countries. Internationally, the key regulatory mechanism that is required to ensure that CO2 abatement opportunities are pursued in the industrial sector is a stable financial incentive to invest in lower emission technology and spur early capital retirement, such as a CO2 price. A global CO2 price would be best, as regional differences could cause distortions. Policies to reduce the capital cost of more efficient equipment and provide incentives for small-scale CCS technologies would also be useful (Vattenfall, 2007(c); IEA, 2006). To reduce non-CO2 industrial emissions, a cap and trade system on performance standards is likely to be more efficient than technology standa rds, as it would spur innovation and address the large number of diverse measures needed for abatement. Clear international incentives will be needed to ensure that China and non-industrialized countries achieve their abatement potential (Vattenfall, 2007(c)). All regions of the world can benefit from the use of public and private partnerships to undertake specific mitigation activities or reduce the emissions of certain non-CO2 gases, as well as incentives and awareness-raising programs to encourage the efficient development of new industrial plants and the retrofit and refurbishment of existing ones (IEA, 2007). Additional global actions that are needed include reduction of transaction costs involved with international investment, promotion of energy-utility sponsored energy efficiency programs, strengthening of carbon markets to provide incentives for industry investments in emission reductions, and

16
collaboration with equity funds and venture capital markets in order to design market instruments that promote additional energy efficiency investment (Laitner, 2007). In developing countries specifically, international collaboration and technology transfer are extremely important for driving higher energy efficiency. Small-scale local industrial operations often use outdated processes, low quality fuel and feedstock, and suffer from weaknesses in transport infrastructure (IEA, 2007). As a result, there is a significant potential for energy efficiency improvement, but specific policies tailored to the industry and location are required. Programs are also needed to build developing-country capacity to implement change, and to promote collaborative research and development (WEO, 2006). All of these activities should be strongly supported by international financial institutions, development assistance programs and international CO2 reduction incentives (IEA,2007).
VII. Conclusions Under the Mitigation Scenario, industrial energy use declines in every region, and also shifts, with fossil fuels and electricity becoming less important (declining by 17% and 15% respectively), and biomass and waste rising in importance (increasing by 5% by 2030). Total greenhouse gas emissions also decline in every region, with global combustion-related CO2 emissions declining by 25% in 2030, compared to the Reference Scenario, and global non CO2 emissions (mostly process emissions) declining by 28%. China alone is responsible for 30% of the global decline in fuel consumption, 40% of the global decrease in combustion-related emissions, and 24% of the reduction in global non-CO2 emissions. As a result, special attention needs to be paid to ensuring that these fuel and emission reductions are enabled, and there are incentives for China to achieve these targets. Improved motor system efficiency is a significant contributor to reduced electricity demand by industry, and should be a special focus. Finally, more than half of global industrial energy savings result from increased efficiency in the iron and steel, chemicals, and non-metallic minerals industries, and particular attention should be given to measures targeting these industries as well. Within the Industrial sector, financing for abatement projects is generally internal, and comes from business directly. We estimate that in 2030 a minimum of $205.5 billion of incremental investment will be needed to meet the mitigation scenario emission levels, compared to the Reference Scenario emission levels. This includes $43.7 billion to reduce CO2 (of which investments to improve fuel efficiency are estimated at $18 billion, and CCS investments are an additional $5 billion), and $161.8 billion to reduce N20 emissions, most of which are process emissions. The key regulatory mechanism that is required to ensure that CO 2 abatement opportunities are pursued in the industrial sector is a stable financial incentive to invest in lower emission technology and spur early capital retirement, such as a global CO2 price. To reduce non-CO2 industrial emissions, a cap and trade system on performance standards is likely to be more efficient than technology standards, as it would spur innovation and address the large number of diverse measures needed for abatement. However, to ensure that China and other non-industrialized countries meet their abatement potential, despite the fact that the upfront financial investment, as well as knowledge about and availability of advanced technologies are often lacking, additional measures specific to developing countries will be needed. These include international collaboration and technology transfer, industry and location specific policies to address the outdated processes and low quality fuel and feedstock used in some small-scale local operations, and programs to build developing-country capacity to implement change, and to promote collaborative research and development. These activities will require the strong support of international financial institutions, development assistance programs, and international industry associations, as well as the use of international CO2 reduction incentives.

17
BUILDINGS
I. Introduction The Buildings sector includes residential floorspace and all commercial or service activities of the economy. Fuel use and emissions discussed in this chapter refer to the ongoing operating energy use of buildings, and not to construction activities, which are included in the Industrial sector. Most fuel use and emissions in the Buildings sector result from the combustion of fossil fuels for space and water heating. While biomass is used for cooking and heating in developing countries, this is assumed to be harvested sustainably, so does not contribute to CO2 emissions. Much of the increase in energy demand has been focused on electricity; we see significant increases in the number of appliances and cooling (HVAC) technologies over the last few decades. Energy demand varies considerably depending on the climate regime and the standard of living of the country in question. However, as incomes rise (particularly in developing countries), homes become larger and the number of appliances owned increases, causing fuel and electricity demand to rise accordingly – a trend that is likely to continue if unconstrained. Within the Buildings sector, the source for the current situation, reference, and mitigation scenario data is the International Energy Agency, with the IEA’s Beyond Alternative Policies scenario used as the Mitigation Scenario.
II. Current Situation – year 2000 a. Energy consumption and mix, GHG emissions
Table 3.1 provides an overview of Building sector energy consumption and GHG emissions. See App. H and I for complete fuel consumption and GHG emission tables disaggregated by country.
Table 3.1: Buildings Sector Fuel Consumption and CO2 Emissions in 2000 Fuel Consumption (Mtoe) Emissions (Mt CO2) Country/Region Fossil Electricity Non-Fossil Total (All Combustion) World 954.2 560.5 781.2 2,295.8 2,573.6 OECD 614.6 414.5 59.8 1,088.9 1,595.2 OECD North America 284.8 229.7 19.5 533.9 708.7 United States 240.8 202.3 11.6 454.7 596.9 Canada 33.9 22.7 1.8 58.4 85.5 Mexico 10.2 4.6 6.0 20.8 26.4 OECD Pacific 85.1 62.9 2.1 150.1 234.1 Japan 58.1 45.0 0.0 103.2 162.0 Korea 21.9 8.5 0.1 30.5 59.7 Australia and New Zealand 5.1 9.3 1.9 16.3 12.4 OECD Europe 244.7 121.9 38.3 404.9 652.4 Transition Economies 105.3 31.9 9.8 147.1 274.1 Russia 59.9 17.6 2.1 79.6 159.1 Other EIT 45.4 14.3 7.7 67.5 115.0 Developing Countries 234.2 114.0 711.6 1,059.9 704.3 Developing Asia 145.3 55.1 506.4 706.8 467.3 China 84.3 20.3 213.1 317.6 285.8 India 30.6 8.4 178.6 217.7 96.8 Indonesia 12.5 3.9 39.7 56.1 35.9 Other Developing Asia 17.9 22.5 75.0 115.5 48.8 Latin America 28.1 27.4 25.9 81.3 72.5 Brazil 8.0 13.7 7.2 28.9 21.3

18
Other Latin America 20.1 13.7 18.7 52.4 51.1 Africa 18.7 11.5 179.3 209.5 53.0 Middle East 42.2 20.1 0.0 62.3 111.4
The OECD is responsible for 47% of fuel consumption and developing countries for 46%. The United States is the largest consumer, at 20% of total energy demand, followed by China at 14% and India at 9%. In terms of CO2 emissions, the OECD again is the largest emitter, at 62% of emissions, with developing countries only producing 27% of emissions. The United States produces 23% of global CO2 emissions, followed by China at 11%. The residential sector is responsible for three-quarters of Building sector energy consumption, although the share can be closer to 90% in developing countries (Vattenfall, 2007(b); UNEP, 2007). The largest contributor to CO2 emissions is space heating and ventilation (36% of total), followed by lighting (16%), residential appliances (15%), water heating (13%), commercial appliances (9%), and air conditioning (8%). The commercial sector has a higher CO2 intensity than the residential sector, due to a larger share of electricity and lower share of renewables in its fuel mix (Vattenfall, 2007(b)).
b. Overview of current financing sources Table 3.2 shows the sources of financing for the buildings sector in each major global region.
Table 3.2: Breakdown of Buildings Gross Fixed Capital Formatio n, 2000 Million US$
Total GFCF
Domestic Investment
FDI Flows Debt
Bilateral ODA
Multilateral ODA
Africa 2,865.8 2,364.5 12.4 485.8 0.5 2.7 Annex-I Parties 199,461.2 190,603.1 2,546.4 6,311.5 0.1 0.0 Central Europe 30.5 30.5 0.0 0.0 0.0 0.0 Developing Asia 101,104.3 99,543.6 1,555.6 0.0 5.1 0.0 Eastern Europe 78.2 78.2 0.0 0.0 0.0 0.0 EU 46,512.0 39,446.7 1,864.9 5,200.4 0.0 0.0 Latin America 16,093.4 15,937.7 155.6 0.0 0.1 0.0 Middle East 1,628.7 810.9 63.0 754.7 0.0 0.0 North Africa 4,125.6 4,117.1 7.1 0.0 1.4 0.0 Northern Europe 0.0 0.0 0.0 0.0 0.0 0.0 OECD North Am 143,609.2 142,300.0 250.1 1,059.0 0.1 0.0 OECD Europe 55,808.8 48,795.0 1,813.5 5,200.4 0.0 0.0 OECD Pacific 58,945.2 57,735.8 547.9 661.5 0.0 0.0 Other ( small island) 146.7 101.1 45.0 0.6 0.0 Transition Econ 4,181.4 4,063.2 117.3 0.0 0.9 0.0 WORLD TOTAL 388,731.6 377,232.0 4,522.4 6,965.8 8.7 2.7
As Table 3.2 shows, the vast majority of commercial and residential investment (97% globally) comes from domestic investment, with the exception of the Middle East, where 46% of gross fixed capital formation comes from debt, and Africa, where 17% comes from debt. Official development assistance to the Buildings sector is virtually zero.
III. Reference Scenario a. :Energy consumption and mix, GHG emissions
The International Energy Agency’s World Energy Outlook 2006 Reference Scenario is used in this study as the source for Buildings energy use and CO2 emissions. The Reference Scenario

19
includes government policies and measures that were enacted or adopted by mid-2006, even if they have not yet been fully implemented. However, possible, potential or even likely future policy actions are not included. Thus the Reference Scenario represents a “baseline vision of how energy markets would evolve if governments do nothing beyond what they have already committed themselves to doing to influence long-term energy trends” (IEA, 2006). Both energy supply and energy end-use technologies are assumed to become gradually more efficient each year (IEA, 2006), but because buildings last several decades or longer, some more efficient technologies take time to penetrate the market. Table 4.1 and Figures 4.1 and 4.2 provide an overview of reference scenario Buildings energy consumption and GHG emissions. Fuel consumption and GHG emission tables for the years between 2000 and 2030, with data available for specific countries in addition to the regional groupings in Table 4.1 can be found in Appendices J and K. Table 4.1: Buildings Sector Fuel Consumption and CO2 Emissions in 2030, Reference Scenario
Fuel Consumption (Mtoe) Emissions (Mt
CO2)
Country/Region Fossil Fuels Electricity Non-Fossil
Fuels Total (All
Combustion) World 1,499.9 1,322.1 1,145.9 3,967.9 4,088.6 OECD 750.6 691.2 159.0 1,600.7 1,932.4
OECD North Am 336.9 387.7 37.1 761.8 847.1 United States 273.7 337.0 26.7 637.4 687.3
Canada 45.9 35.3 3.3 84.4 111.6 Mexico 17.4 15.4 7.1 40.0 48.3
OECD Pacific 109.4 101.5 17.3 228.2 297.0 Japan 66.3 58.6 6.7 131.7 190.2 Korea 32.9 25.9 2.5 61.3 82.0
Australia + NZ 10.1 17.0 8.1 35.2 24.9 OECD Europe 304.3 202.0 104.5 610.8 788.3
Transition Econ 176.8 57.0 121.6 355.4 458.9 Russia 88.9 27.9 89.2 206.0 233.3
Other EIT 87.9 29.1 32.4 149.4 225.6 Developing Regions 572.5 573.9 865.3 2,011.7 1,697.3
Developing Asia 353.7 379.1 548.4 1,281.2 1,078.2 China 207.7 196.5 202.6 606.8 637.6 India 74.0 91.3 196.2 361.4 233.7
Indonesia 27.9 21.0 49.5 98.4 81.3 Other Developing Asia 44.1 70.3 100.1 214.5 125.7
Latin America 63.4 61.8 30.3 155.5 177.3 Brazil 14.7 23.4 12.5 50.6 44.7
Other Latin America 48.7 38.4 17.7 104.9 132.5 Africa 54.3 58.2 283.5 396.0 164.2
Middle East 101.2 74.8 3.1 179.1 277.6

20
Figure 4.1: Reference Scenario Fuel Consumption by Region
Reference Scenario Fuel Consumption
0
500
1,000
1,500
2,000
2,500
3,000
3,500
4,000
4,500
2005 2010 2015 2020 2025 2030
Year
Mto
e Developing
Transition
OECD
Figure 4.2: Reference Scenario Emissions by Region
Reference Scenario Emissions
0
500
1,000
1,500
2,000
2,500
3,000
3,500
4,000
4,500
5,000
2005 2010 2015 2020 2025 2030
Year
MtC
O2e Developing
Transition
OECD
From 2005 to 2030, fuel consumption in the Buildings sector rises by 43% under the Reference Case scenario. Electricity use rises by 86%, propelled by a 226% increase in electricity use in developing countries. However, in 2030 a significant fuel mix differential is still observed, with developing countries continuing to rely heavily on biomass and waste (43% of their fuel consumption, with the remainder split evenly between electricity and fossil fuels), and developed countries’ consumption dominated by electricity (43% of fuel consumption) and fossil fuels (47% of fossil fuels). Fossil-fuel combustion-related emissions rise by 30% between 2005 and 2030, with the US accounting for 17% of emissions in 2030 and China responsible for 16%. The Residential sector is responsible for approximately three-quarters of Buildings sector emissions,

21
and the Commercial sector is responsible for approximately one-quarter of emissions, with these proportions staying constant throughout the time periods (Vattenfall, 2007(b)). The main drivers of increased buildings emissions are floor space growth (64% residential growth by 2030) (driven by population and GDP growth, a growing service sector, and the continued rise of the information economy (WBCSD, 2006), increasing demand for electric appliances (the number of appliances per European household has increased tenfold over the past 30 years) and a fuel shift to electricity (such as for water heating in developing countries) (Vattenfall, 2007(b); IEA, 2006). Within the residential sector, increased demand for electric water heating in developing countries is leading electricity intensity, and hence CO2 intensity to increase. Under the reference case scenario, some residential energy uses become more efficient (washers and dryers consume 1.9% less energy each year, refrigerators and freezers consume 1.65% less, air conditioning consumes 0.1% less), but stand-by demand increases by 0.4% per year. Compact fluorescent light bulb penetration increases under the reference case scenario from approximately 8% to 21% in 2030. Traditional biomass is assumed to be harvested sustainably, and therefore be carbon neutral (Vattenfall, 2007(b)).
b. Investment needs for the reference scenario Tables 4.2 and 4.3 present the projected Residential and Commercial gross fixed capital formation per region in each time period through 2030. Table 4.2: Gross Fixed Capital Formation in the Residential Sector by Region and Time Period (2001 Million US$)
2002 2005 2010 2015 2020 2025 2030 Africa 3,558.5 7,491.6 15,895.3 17,112.0 21,031.5 26,912.6 35,090.1 Developing Asia 63,988.1 144,077.6 221,214.9 255,511.2 309,972.5 387,968.1 500,328.9
Latin America 40,833.3 6,592.9 34,057.0 47,385.2 59,915.8 73,576.8 88,840.0 Middle East 1,176.8 780.9 3,077.3 3,631.3 4,269.7 5,405.7 7,031.8 OECD Europe 253,272.8 204,598.1 271,129.5 317,102.4 340,988.0 369,211.6 314,661.4 OECD North Am 715,692.7 546,827.0 609,201.2 705,687.8 706,123.9 769,607.5 882,792.8
OECD Pacific 585,203.3 394,053.6 546,337.5 452,091.1 511,999.4 523,891.2 552,510.0 Transition Econ 4,169.5 6,829.4 12,043.6 13,782.2 16,673.3 20,865.5 26,345.1
Table 4.3: Gross Fixed Capital Formation in the Commercial Sector by Region and Time Period (2001 Million US$) 2002 2005 2010 2015 2020 2025 2030 Africa 24,761.9 22,564.5 28,647.2 43,597.6 61,204.5 84,761.2 116,384.8 Developing Asia 136,764.5 248,376.7 478,604.2 715,181.5 981,833.1 1,302,357.9 1,664,495.2 Latin America 45,606.6 73,152.6 72,036.8 96,223.2 122,952.8 153,883.9 188,975.0
Middle East 49,383.1 37,356.8 76,613.7 127,028.9 177,670.9 235,801.4 304,530.3 OECD Europe 763,702.6 844,163.8 1,116,337.9 1,363,054.4 1,617,310.2 1,878,744.7 1,810,673.4
OECD North Am 733,994.4 1,046,309.8 1,330,390.8 1,557,617.5 1,865,071.9 2,184,590.8 2,499,662.9 OECD Pacific 271,005.4 421,521.5 490,657.3 663,088.9 780,431.0 911,558.2 1,021,613.3 Transition Econ 25,678.2 27,341.4 48,142.2 69,146.6 93,011.7 121,012.6 152,362.5 As in the current situation, almost all gross fixed capital formation is expected to come from domestic investment. However, detailed investment requirements are not known, and future research should attempt to estimate the investments in energy efficiency and fuel switching in the Buildings Sector that will occur under a Reference Scenario.

22
IV. Mitigation Scenario a. Energy consumption and mix, GHG emissions , Comparison with Reference
Scenario For the Buildings Sector, the WEO’s Beyond Alternative Policies Scenario (BAPS) is used as the Mitigation Scenario. This aggressive scenario caps CO2 emissions in 2030 at 2004 levels (26.1 Gt CO2e). The technology shifts it envisions are technically feasible, but occur at an unprecedented scale and rate, and hence require aggressive policies and the adoption of new technologies (IEA, 2006). Table 4.4 and Figures 4.3 and 4.4 provide an overview of energy consumption and GHG emissions by the Buildings Sector under the Mitigation Scenario. Fuel consumption and GHG tables for the years between 2000 and 2030, with data available for specific countries in addition to the regional groupings in Table 4.4 can be found in Appendices L and M. Table 4.4: Buildings Sector Fuel Consumption and CO2 Emissions in 2030, Mitigation Scenario
Fuel Consumption (Mtoe) Emissions (Mt CO2)
Country/Region Fossil Fuels Electricity Non-Fossil
Fuels Total (All Combustion) World 1,301.7 1,033.7 1,044.5 3,379.9 3,535.0 OECD 662.7 554.9 194.0 1,411.7 1,710.8
OECD North America 305.7 318.6 40.8 665.1 772.1 Unite d States 247.4 277.8 30.0 555.2 623.9
Canada 42.0 28.5 3.4 73.9 102.9 Mexico 16.3 12.2 7.4 36.0 45.3
OECD Pacific 97.7 82.5 21.7 202.0 266.7 Japan 60.2 48.3 8.1 116.6 172.9 Korea 28.2 20.3 3.7 52.2 70.6
Australia + NZ 9.4 13.9 10.0 33.2 23.2 OECD Europe 259.3 153.8 131.5 544.6 672.1
Transition Economies 150.4 44.7 112.7 307.8 390.2 Russia 75.2 21.4 82.8 179.4 197.0
Other EIT 75.2 23.3 30.0 128.5 193.2 Developing Countries 488.6 434.0 737.8 1,660.4 1,434.0
Developing Asia 293.9 280.0 453.8 1,027.6 880.3 China 175.5 147.9 158.7 482.1 530.8 India 52.4 73.3 172.1 297.9 160.0
Indonesia 26.0 16.3 45.0 87.3 76.2 Other Developing Asia 40.0 42.4 78.0 160.3 113.3
Latin America 56.1 47.9 30.6 134.5 157.8 Brazil 13.5 17.8 12.0 43.3 41.0
Other Latin America 42.6 30.0 18.5 91.2 116.8 Africa 49.2 47.0 245.4 341.6 149.0
Middle East 89.5 59.2 8.0 156.7 246.9

23
Figure 4.3: Mitigation Scenario Fuel Consumption by Region
Mitigation Scenario Fuel Consumption
0
500
1,000
1,500
2,000
2,500
3,000
3,500
4,000
2005 2010 2015 2020 2025 2030
Year
Mto
e Developing
Transition
OECD
Figure 4.4 Mitigation Scenario Emissions by Region
Mitigation Scenario Emissions
0
500
1,000
1,500
2,000
2,500
3,000
3,500
4,000
2005 2010 2015 2020 2025 2030
Year
MtC
O2e Developing
Transition
OECD
Over the period 2005 to 2030, energy consumption in the Mitigation Scenario rises by 22%. In 2030, the residential sector is responsible for approximately 75% of the energy consumed in the Buildings sector, with about half of this used for space heating. The commercial sector uses the remaining 25% of energy, with space heating responsible for the largest energy demand (36% of total), followed by lighting (22% of total) (Vattenfall, 2007(b)). Electricity use rises by 55% from 2005 to 2030 under the Mitigation Scenario, led by developing countries (+155%), particularly developing Asia (+201%). Non-fossil fuel energy consumption rises by 96% in the OECD, driven by demand for combined heat and power, while it falls by 4% in developing countries (and 24% in China) as there is a shift away from traditional cooking and heating

24
methods. Fossil fuel use rises by 50% in developing countries but stays constant at 2005 levels in the OECD. Fossil fuel combustion-related emissions rise by 13% globally from 2005 to 2030, declining by 2% in the OECD but rising by 40% in developing countries. Figures 4.5 and 4.6 show how fuel consumption and emissions continue to rise in the Reference Scenario, while they level off in the Mitigation Scenario. Figure 4.5: Mitigation vs. Reference Scenario Fuel Consumption
Mitigation vs. Reference Scenario Fuel Consumption
2,500
2,700
2,900
3,100
3,300
3,500
3,700
3,900
4,100
4,300
4,500
2005 2010 2015 2020 2025 2030
Year
Mto
e Mitigation
Reference
Figure 4.6: Mitigation vs. Reference Scenario Emissions
Mitigation vs. Reference Scenario Emissions
3,000
3,200
3,400
3,600
3,800
4,000
4,200
4,400
4,600
2005 2010 2015 2020 2025 2030
Year
MtC
O2e
Mitigation
Reference
Compared with the Reference Scenario, total fuel consumption in the Mitigation Scenario in 2030 drops by 20% and CO2 emissions fall by 19%. The OECD is responsible for 40% of the total

25
emission reductions, with China contributing 20% of the total. The largest proportional decline is in India, where CO2 emissions fall by 34% in 2030 compared with the Reference Case. Electricity use drops by 36% worldwide, and accounts for 69% of the total reduction in fuel consumption. However, OECD countries still derive a substantially higher share of their total Buildings sector energy from electricity than other countries (39% of total fuel use, vs. 15% in transition economies and 26% in developing countries). Non-fossil fuel energy consumption rises in the OECD by 79%, due primarily to biomass-fueled combined heat and power, but declines in developing countries by 16% as a result of a shift away from traditional biomass cooking and heating (IEA, 2006). The largest contributor to electricity use reduction is more efficient appliances, both in OECD and non-OECD countries, with improved air conditioning efficiency (primarily in non-OECD countries), better insulation, and improved lighting efficiency (primarily in OECD countries) also making significant contributions. Efficiency standards cause the efficiency of equipment in non-OECD countries to approach the lower level of efficiency currently attained in OECD countries. Stricter building codes reduce oil and gas demand for space heating in OECD countries, while solar power use doubles, primarily for water heating (IEA, 2006). For both the residential and commercial sectors, the largest emission mitigation measures address heating and ventilation, including building envelope improvements (façade, roof, and floor insulation), water heating and air conditioning. Lighting is a lever mainly in residential buildings, and improving the efficiency of other appliances and reducing standby losses are other significant sources of abatement. Under the mitigation scenario, compact fluorescent light bulb use in the residential sector increases from 8% in 2002 to 54% in 2030, with particularly high penetration in China due to the low cost there (Vattenfall, 2007(b)).
b. Investment needs for the mitigation scenario Most emission reductions from the Buildings sector result from increased efficiency of appliances, space and water heating and cooling systems, and lighting. There is also a fuel-shift away from fossil fuels and electricity, and toward biomass and waste. Within this sector, financing for abatement projects generally comes from the private sector or from consumers themselves (IEA, 2006). We estimate that in 2030, $93.5 billion US dollars (2005 dollars)7 of incremental investment will be needed worldwide in the Buildings Sector to meet the mitigation scenario emission levels, compared to the Reference Scenario emission levels, with $81.5 billion to reduce electricity related emissions and $11.9 billion to reduce fuel-related emissions. Table 4.6 presents the estimated incremental investment required in selected years between the present and 2030. As most of the mitigation activities are efficiency-related, no extraordinary infrastructure or education investments are foreseen.
7The investment needs in Dialogue Working Paper 8 differ from those presented here. In order to ensure that the investment estimates in the Working Paper are consistent between sectors, a different methodology was used to estimate each sector’s investment requirements to meet the mitigation scenario. For energy efficiency investments, an estimation of required global cumulative investment for the period until 2030 was provided by the IEA. This was allocated to regions based on energy consumption, and divided by 26 to get a proxy for investment for only 2030.

26
Table 4.5: Estimated incremental Buildings sector investment in 5-year intervals to meet Mitigation Scenario vs. Reference Scenario
Mitigation Scenario Buildings Investment ($billion, 2005 USD) 2005 2010 2015 2020 2025 2030 OECD Fuel Efficiency $0.0 $0.3 $1.7 $3.3 $5.7 $7.1 OECD Electricity Efficiency $0.0 $2.2 $15.7 $29.1 $42.6 $56.1 Total OECD $0.0 $2.5 $17.4 $32.4 $48.3 $63.2 non-OECD Fuel Efficiency $0.0 $0.2 $0.8 $1.8 $3.4 $4.8 non-OECD Electricity Efficiency $0.0 $1.1 $7.2 $13.2 $19.3 $25.4 Total non-OECD $0.0 $1.3 $8.0 $15.1 $22.7 $30.2 Total World $0.0 $3.8 $25.3 $47.5 $70.9 $93.5
In order to estimate the incremental investment required to meet the Mitigation Scenario’s CO2 emission targets, the investment requirements to meet the WEO’s Alternative Policy (AP) Scenario were used as a starting point, as investment estimates are available for this moderate-mitigation scenario (IEA, 2006)8. Costs were then estimated for the additional efficiency assumed by the Beyond Alternative Policy (BAP) Scenario - a 9.89% electricity efficiency improvement by 2030 in each region except Japan, which has an additional 5.26% improvement. The estimation is rough, and is illustrative only, due to data limitations. Year 2030 investment was assumed to be 9.89% greater than the AP Scenario for non-OECD countries, and 9.5% greater for OECD countries. As AP Scenario investment costs displayed roughly straight-line growth from 2010 to 2030, the additional investment costs to achieve the BAPS scenario were assumed to follow the same trend, and investment requirements for the intervening years were calculated accordingly. Overall, this results in an under-estimation of investment costs. Ideally, a marginal cost curve would have been used to estimate the additional costs for the additional efficiency, but only average costs were available. Investment requirements for fuel-related emission reductions were also estimated from Vattenfall’s 2007 report Global Mapping of Greenhouse Gas Abatement Opportunities up to 2030 – Buildings Sector Deep-Dive. These are presented in Table 4.6, and are based on the technical cost of each mitigation option, which is calculated from the marginal cost of each more efficient technology and the discounted energy savings, with the energy savings adjusted to match the Mitigation scenario. The technical cost estimate of $55.1 billion USD is a rough approximation of cumulative investment over the period 2005 to 2030. Table 4.6 Estimated Incremental Fuel-Efficiency Related Investment to meet the Mitigation Scenario (2005 USD)
Technology
Gt CO2 Reductions in 2030
Technical Cost (USD/MWh)
TWh abatement in 2030 Total technical cost
Residential Water Heating 0.09 41.1 684 $22,586,142,857 Heating & Ventil’n 0.30 14.9 2,386 $28,630,285,714 Commercial Heating & Ventil’n 0.19 5.0 976 $3,902,354,400 TOTAL $55,118,782,971
8 Demand-side investment figures for OECD and non-OECD countries were provided for 2030, and investment in each intervening time period was estimated from a line graph. Investment allocated to the Buildings sector in each time period was calculated by applying the Buildings share of total investment over the 2005-2030 time period to the estimate of investment in intervening years.

27
Although electricity related emission reductions are discussed in the Energy Supply chapter, their importance to Building sector mitigation warrants a brief overview of their potential scale and costs. Table 4.7 presents Vattenfall’s estimated electricity-efficiency related energy and emission reductions, and their associated technical costs. Electricity reductions could abate nearly 2 Gt CO2 in 2030, for a cost of $98.5 billion USD. Please note that these figures are not adjusted to match the Mitigation scenario and are presented for reference only. Table 4.7 Potential Incremental Electricity-Efficiency Related Emission Reductions and Investment (2005 USD)
Technology
Gt CO2 Reductions in 2030
Technical Cost (USD/MWh)
TWh abatement in 2030 Total technical cost
Residential Lighting 0.20 17.0 320 $5,432,180,000 Standby (Appliances) 0.20 65.0 335 $21,801,000,000 Refrigerators/Freezers 0.04 50.0 66 $3,315,000,000 Washers/Dryers 0.10 30.0 133 $3,989,700,000 Other Appliances 0.20 28.0 447 $12,507,880,000 Water Heating 0.06 33.0 257 $8,491,560,000 Air Conditioning 0.10 43.0 106 $4,547,250,000 Heating & Ventilation 0.19 12.0 814 $9,763,440,000 Total 1.09 2478 $69,848,010,000 Commercial Lighting 0.20 34.0 325 $11,060,880,000 Appliances 0.30 13.0 700 $9,104,420,000 Water Heating 0.10 10.0 538 $5,381,600,000 Air Conditioning 0.20 4.0 485 $1,941,760,000 Heating & Ventilation 0.06 4.0 284 $1,136,906,400 Total 0.86 $28,625,566,400 TOTAL BUILDINGS 1.95 $98,473,576,400
Regionally, in 2030, 21% of the emission reductions occur in the U.S. and Canada, 20% in China, 14% in OECD Europe, 10% in Eastern Europe, 13% in other industrial countries, and 22% in the rest of the world (Vattenfall, 2007(b)). Overall, compared to the Reference Scenario, energy consumers have to invest more in the Mitigation scenario, while energy producers invest less. Consumers in OECD countries pay approximately eight times more than consumers in non-OECD countries on a per-capita basis, as both the capital cost of equipment and the initial efficiency is higher in OECD countries (IEA, 2006). A common characteristic of the investments required to abate CO2 emissions in the Buildings sector is that they are profitable very quickly if only financial costs are considered (intangible costs such as service quality are not estimated here). Vattenfall’s analysis of abatement costs concluded that all mitigation opportunities that are possible below 40 EUR/tCO2e come at a zero or negative financial net cost once energy savings are considered, and the World Energy Outlook 2006 reported that energy bill savings are nearly four times higher than the increased investment costs required to achieve the Alternative Policy Scenario (Vattenfall, 2007(b); IEA, 2006). Reasons why these measures are not undertaken under the Reference case scenario include market failures, misaligned incentives (the builder is not the operator, buildings are typically

28
constructed before being purchased), high perceived consumer discount rates, and program costs. As a result, government policy (particularly efficiency standards) will be critical to achieving abatement in the Buildings sector (Vattenfall, 2007(b); IEA, 2006).
VI. Assessment of needed changes in financial and policy arrangements to fill
the gap between the BAU and mitigation scenarios The incremental investment needed to achieve the Mitigation Scenario’s emissions compared to the Reference Scenario’s emissions is estimated at $93.5 billion (2005 USD) in 2030, with $11.9 billion of this going to reduce fuel-related emissions. At least $55.1 billion in investment will be needed to mitigate fuel-related emissions over the entire Mitigation scenario time period. In developed countries, commercial building and residence owners will need to provide this investment, and so policies to provide incentives for this will be needed. Carbon markets may provide an incentive for commercial sector actors to invest in mitigation activities. In developing and transition economies, the involvement of international and multinational organizations and institutions, as well as foreign governments and businesses will be critical to achieving the necessary investments. All of these policies are critically important to achieving the Mitigation goal, as confirmed by an International Energy Agency report on financing energy efficiency in the Buildings sector, which concluded: Contrary to expectations, this study’s findings emphasise that increased capital availability is not the most important tool in overcoming energy efficiency’s financial barrier. Instead, the solution lies in carefully designed policy packages, and strong political will. Policy makers should focus on reducing obstacles to the involvement of private actors (T’Serclaes, 2007, p.6). Because an analysis of the mitigation options available in the buildings sector reveals that most actions are associated with financial benefits, yet are not being undertaken, barriers to investment clearly exist. Some of the barriers include misaligned incentives (the builder is usually not the operator, high upfront investment costs, high perceived discount rate), lack of information about alternatives, service quality differences (real or perceived), lack of awareness of spending on electricity and heating (flat rate heating charges in some cities, or inclusion of electricity costs in overhead or maintenance fees), distortions in capital markets (such as linking of electric utility profits to sales), and transaction costs (for efficiency programs and compliance efforts) (Pew, 2006; Vattenfall, 2007(b)). While all of the policies described below will help to increase investment in efficiency in the buildings sector, attention should be paid to ensuring that each of these major barriers is addressed in any policy package that is developed. Energy labeling and mandatory minimum energy-efficiency standards, as well as stricter mandatory building codes, and building certification and energy-rating schemes are the most important requirements for meeting the Mitigation Scenario CO2 reduction targets. Energy labeling and minimum efficiency standards are well developed in OECD countries, but while they have also been established in many non-OECD countries, they need to be expanded to cover more equipment types, and raised toward the current efficiency levels of equipment in the OECD (IEA, 2006). Private sector support for these more-stringent government policies is essential, as of course is effective enforcement of standards and regulations. In non-OECD countries, multilateral lending institutions, international organizations, and other governments should assist government to develop and implement these policies. OECD governments need to improve conditions for technology transfer, while developing countries also need to make changes to facilitate this. Capacity building and collaborative research and development programs are also needed between OECD and non-OECD countries. Smaller developing countries need to be

29
assisted in particular in all of these areas, as their access to capital is much more difficult than for China and India (IEA, 2006). In addition to energy labeling and efficiency standards for equipment and buildings, a number of specific policies and programs are recommended to meet the Mitigation Scenario in the Buildings sector. To be most effective, all of these measures should be combined in packages that address all of the barriers to adequate investment, such as the upfront investment cost, lack of information, and lack of training (T’Serclaes, 2007). These additional policies and programs include:
• Funding and expansion of existing public/private partnerships (e.g. reduced rate mortgages offered by banks but supported by the government) to demonstrate the feasibility and cost savings from energy efficient building practices (Pew, 2006). These programs should be especially encouraged as they lead to market transformation (T’Serclaes, 2007);
• Appropriate energy pricing policies, including consumption-based billing of heating and electricity use (and user control over their consumption) (Suding, 2004);
• Incentives or obligations for energy utilities to run energy-saving programs (Laitner, 2007);
• Fiscal and financial incentives for energy efficiency investments in buildings, such as tax credits (IEA, 2006). The incentive structure must support the regulations and standards that have been put in place (Suding, 2004), and should encourage continual improvement. For example, in China there is consideration of applying “feebates” to new energy hook-ups, with building owners either paying a fee or receiving a rebate depending upon the demand or building efficiency (UNEP, 2007);
• Public finance mechanisms, such as bond financing, revolving loans, and policies to encourage energy service companies to invest in energy efficiency markets (Laitner, 2007);
• Research, development, and demonstration of solar heating and cooling systems (IEA, 2006);
• Reduction of transaction costs (excessive reporting and administrative requirements) (Crosby, 2007);
• Building standards must require strong energy efficiency and reduced CO2 emissions to receive a “green” rating, regardless of performance on other characteristics (Pew, 2006);
• Collaboration with socially responsible equity funds and venture capital markets to design new market instruments to promote the use of these mechanisms to increase energy efficiency (Laitner, 2007);
• Promotion of smart land-use planning policies – higher-density, more spatially compact, and mixed use communities; as well as building characteristics such as siting, shape, color, orientation, shading, and passive heating, cooling, and ventilation (Pew, 2006). New buildings should be directed toward areas with existing service, traffic and energy infrastructure (UNEP, 2007);
• Consideration of building energy efficiency and the entire energy chain in larger-scale city planning, in order to achieve significantly higher building efficiency through design (this can also dramatically reduce transportation and industrial emissions). An example is the Eco-Cities initiative in the European Union (UNEP, 2007);
• Research and development funding for advanced energy-efficient building materials and technologies;
• Awareness, information and training campaigns, including a focus on changing consumer behaviour (switching off lights that aren’t in use, etc).

30
VII. Conclusions Compared with the Reference Scenario, total fuel consumption in 2030 in the Mitigation Scenario drops by 20% and CO2 emissions fall by 19%. The OECD is responsible for 40% of the total emission reductions, with China contributing 20% of the total. Electricity accounts for 69% of the total reduction in fuel consumption, driven by more efficient appliances, improved air conditioning and lighting efficiency, and better insulation. Building codes reduce oil and gas demand for space heating in the OECD, while non-fossil fuel energy consumption rises in the OECD by 79%, due primarily to biomass-fueled combined heat and power. The countries that achieve the largest absolute reductions in CO2 emissions compared with the Reference Scenario are China, the United States, India, and Russia. These countries in particular should be a focus for policy efforts, to ensure that the reductions are realized. The incremental investment needed to achieve the Mitigation Scenario’s emissions compared to the Reference Scenario is estimated at $93.5 billion (2005 USD) in 2030, with $11.9 billion of this going to reduce fuel-related emissions. At least $55.1 billion in investment will be needed to mitigate fuel-related emissions over the entire Mitigation scenario time period. Since funding in this sector generally comes from the private sector (business and household owners), the focus for achieving the Mitigation Scenario’s emission levels should be on integrated packages of policies and measures that overcome the barriers to this private investment – particularly the high upfront cost, lack of information about alternatives, and lack of training in more efficient technologies. The most important policies include energy labeling and efficiency standards for equipment and buildings. International organizations need to work with developing countries to ensure that they are able to implement these policies, and strengthen them so that equipment and building efficiency approaches that of the OECD. Within the Buildings sector, lack of investment capital is not the key barrier that needs to be overcome. Instead, integrated and effective policy packages and the political will to implement them are the key precursors to achieving the Mitigation Scenario. WASTE
I. Introduction The Waste sector includes both landfills and wastewater. Energy consumpt ion data on this sector are not available, but most energy consumption is covered elsewhere. For example, much of the energy used to move waste (sewage, domestic and commercial) material is likely captured in the transportation sector as freight or off-road. If one assumes that CO2 generated in the treatment of sewage is considered carbon neutral because it comes from biomass, the major GHG emission from landfills and wastewater treatment is methane (CH4). Produced by anaerobic degradation of organic matter, the methane is often used to power sewage treatment processes or to co-generate electricity. Nitrous oxide (N20) is also emitted during wastewater processing. Carbon ending up in landfills may be sequestered indefinitely; it is not always appropriate to assume that carbon in the waste stream winds up in the atmosphere again (Nyboer, 2007). Within the Waste sector, the source for the current situation, reference, and mitigation scenario emissions is the United States Environmental Protection Agency (EPA)’s Global Mitigation of Non-CO2 Greenhouse Gases report (EPA, 2006(b)). Current waste production data comes from the report OECD Environmental Data Compendium 2006/2007: Waste (OECD, 2007).

31
II. Current Situation – year 2000 a. Energy consumption and mix, GHG emissions
Tables 2.1 and 2.2 provide an overview of Waste sector GHG emissions and waste production worldwide. Complete GHG emission tables, with data disaggregated by country, can be found in Appendix N. Table 2.1: 2000 Waste Non-CO2 gases, CO2 equivalent (million tons)
Country/Region CH4 N2O TOTAL World 1,178.51 94.79 1,273.30 OECD 445.57 44.56 490.14
OECD North America 253.15 22.65 275.81 United States 180.74 19.75 200.48
Canada 25.48 1.42 26.89 Mexico 46.94 1.49 48.43
OECD Pacific 35.38 5.25 40.63 Japan 5.70 3.80 9.51 Korea 16.44 0.71 17.15
Australia and New Zealand 13.24 0.73 13.97 OECD Europe 157.04 16.66 173.70
Transition Economies 104.56 6.88 111.44 Russia 48.62 3.76 52.38
Other EIT 55.94 3.12 59.06 Developing Countries 628.37 43.35 671.72
Developing Asia 400.45 30.22 430.67 China 163.01 18.52 181.52 India 122.23 2.25 124.48
Indonesia 32.85 2.35 35.20 Other Developing Asia 82.37 7.09 89.46
Latin America 91.67 5.97 97.64 Brazil 39.69 3.80 43.48
Other Latin America 51.99 2.17 54.16 Africa 80.69 4.32 85.01
North Africa 19.72 1.41 21.13 Other Africa 60.97 2.91 63.88
Middle East 55.56 2.85 58.41 Table 2.2: Waste Production, 1000s tonnes, most recent year available (1998-2005)
Water Purification
and Distribution
Hazardous Waste (most
recent year available)*
Municipal Waste Total
Canada 5,808 13,380 19,188 Mexico 3,887 36,090 39,977
USA 39,848 222,860 262,708 Japan 8,310 3,305 54,930 66,545 Korea 2,957 18,250 21,207
Australia 634 8,900 9,534 N.Zealand 39 1,540 1,579

32
Austria 1,910 837 4,590 7,337 Belgium 200 2,325 4,750 7,275 Czech R. 650 1,363 2,950 4,963 Denmark 820 423 3,340 4,583 Finland 510 2,300 2,370 5,180 France 960 9,727 33,780 44,467
Germany 19,841 48,430 68,271 Greece 354 4,710 5,064
Hungary 543 4,590 5,133 Iceland 4 150 154 Ireland 60 204 3,000 3,264
Italy 13,550 6,396 31,150 51,096 Luxembourg 130 78 310 518 Netherlands 170 2,160 10,160 12,490
Norway 873 1,840 2,713 Poland 3,280 1,779 9,350 14,409
Portugal 50 144 4,620 4,814 Slovak
Republic 260 1,019 1,400 2,679 Spain 3,414 27,590 31,004
Sweden 920 1,354 4,170 6,444 Switzerland 210 1,004 4,910 6,124
Turkey 3,240 1,196 29,740 34,176 UK 1,390 5,146 36,120 42,656
*Hazardous waste is calculated as production plus imports less exports Source: OECD Environmental Data Compendium 2006/2007: Waste (OECD, 2007) Current global waste deposited in landfill sites is estimated at 786 million tonnes, and emissions of CH4 and N20 in 2000 were 1.18 billion and 95 million tonnes CO2e respectively. Of total methane emissions from the landfill and wastewater sectors, landfills were responsible for 58% of emissions in 2000, while wastewater contributed the remaining 42% (USEPA, 2006(a)). Developing countries are the largest contributor to methane emissions, contributing 53% of the total, with China responsible for 14% and India for 10% of global emissions. The U.S. is the largest global emitter, at 15% of emissions. In terms of nitrous oxide emissions, the OECD and developing countries are equal contributors, while the US emits 21% of the global total, and China emits 20%. The vast majority of emissions in developing countries come from untreated wastewater in latrines and open sewers; over 80% of domestic wastewater is uncollected and untreated in large portions of China/centrally planned Asia, south and east Asia and Africa, with the situation worse in rural areas. Septic tanks are the largest contributor in the United States (USEPA, 2006(a)).
b. Overview of current financing sources Gross fixed capital formation data are not available for the Waste sector.
III. Reference Scenario a. :Energy consumption and mix, GHG emissions
The Reference Scenario for non-CO2 greenhouse gas emissions comes from the baseline projections made in the U.S. Environmental Protection Agency report Global Anthropogenic

33
Non-CO2 Greenhouse Gas Emissions: 1990-2020. Sector-specific climate policy programs, agreements, and measures that are already in place are included, but planned activities with less certain impacts are excluded unless a well established program or an international sector agreement is in place (USEPA, 2006(a)). Regression analysis was used to estimate emissions for 2025 and 2030, and some mitigation technologies are assumed to be adopted in the Reference Scenario to meet industry reduction targets (USEPA, 2006(b)). Table 3.1 and Figure 3.1 provide an overview of Waste sector emissions under the Reference Scenario. Complete GHG emission tables for the years between 2000 and 2030 can be found in Appendix O. Table 3.1: Reference Scenario Waste Non-CO2 gases in 2030, CO2e (million tons)
Country/Region CH4 N20 Total World 1,420.02 120.24 1,540.27 OECD 420.98 53.70 474.68
OECD North America 285.26 24.63 309.89 United States 176.37 20.92 197.28
Canada 43.81 1.65 45.46 Mexico 65.09 2.06 67.15
OECD Pacific 43.47 11.68 55.15 Japan 3.57 9.96 13.54 Korea 18.33 0.81 19.14
Australia and New Zealand 21.57 0.90 22.47
OECD Europe 92.24 17.40 109.64 Transition Economies 123.10 6.16 129.27
Russia 40.40 3.24 43.64 Other EIT 82.70 2.92 85.62
Developing Countries 875.94 60.38 936.32 Developing Asia 541.90 39.99 581.89
China 193.87 22.19 216.06 India 173.56 3.17 176.74
Indonesia 44.25 3.18 47.43 Other Developing Asia 130.22 11.44 141.66
Latin America 124.88 8.25 133.13 Brazil 53.05 5.12 58.17
Other Latin America 71.83 3.13 74.96 Africa 112.18 7.13 119.31
North Africa 11.39 2.08 13.47 Other Africa 100.79 5.05 105.84
Middle East 96.98 5.02 101.99

34
Figure 3.1 Reference Scenario Emissions by Region
Reference Scenario Emissions
0
200
400
600
800
1,000
1,200
1,400
1,600
1,800
2005 2010 2015 2020 2025 2030
Year
MtC
O2e
e
Developing
Transition
OECD
In the Reference scenario, developing countries contribute 62% of Waste methane emissions and the OECD contributes 30% in 2030, with China (14%), India (12) and the United States (12%) the largest global emitters. Developing countries are the largest nitrous oxide emitters, producing 50% of emissions in 2030, compared to 45% for the OECD. China (19%) and the United States (17%) are the largest emitters. Over the period 2005 to 2030, total Waste sector emissions rise by 17%, with emissions falling by 1% in OECD countries, but rising by 15% in transition economies and by 30% in developing countries. Methane emissions from landfills gradually increase in the Reference Scenario. They are driven upwards by population growth; increases in personal incomes and expanding industrialization, leading to increased waste generation; and increased waste diversion to landfills in Eastern Europe and China, but are then reduced by an increase in waste-related regulations (particularly in developed countries), as well as methane capture and use (USEPA, 2006(b)). OECD emissions are projected to decrease by over 30% between 1990 and 2020, with the European Union Landfill Directive, which limits the amount of organic matter that can be disposed of in landfills, being a major contributor to the decline. However, developing countries show high growth in emissions, with African landfill emissions rising by 77% between 1990 and 2020, South and East Asian emissions rising by 34%, and Latin American emissions rising by 52% (USEPA, 2006(a)). Wastewater methane emissions grow much faster than landfill emissions, driven by population growth, particularly in developing countries that use latrines and open sewers instead of advanced wastewater treatment systems (USEPA, 2006(b)). The fastest growth is in Africa and the Middle East, where wastewater methane is expected to double between 1995 and 2020. By 2020, wastewater’s share of emissions has grown from 42% of the total to 45% of the total (USEPA, 2006(a)). Wastewater nitrous oxide emissions are projected to decrease in several EU countries by 2020, but rise quickly in developing countries, particularly Africa, where they grow by 86% by 2020. Population growth is a key driver, as are increasing personal incomes, which lead to increased protein consumption and hence increased nitrogen availability in wastewater. This will be a strong driver in fast-growing economies such as China and India (USEPA, 2006(a)).

35
b. Investment needs for the reference scenario Data on estimated gross fixed capital formation under the Reference Scenario are not available. Future research should attempt to estimate the investments in reducing Waste Sector emissions that will occur under the Reference Scenario.
IV. Mitigation Scenario
a. :Energy consumption and mix, GHG emissions For the Waste sector’s Mitigation Scenario, marginal abatement curve data from the U.S. Environmental Protection Agency report Global Mitigation of Non-CO2 Greenhouse Gases were used to model emission reductions achievable at a cost of $30 USD/tonne CO2e (2000 dollars). This value was selected because the marginal abatement cost curves were observed to rise sharply beyond this point. Regression analysis was used to estimate emissions for 2025 and 2030. Table 4.1 and Figure 4.1 provide an overview of GHG emissions under the Mitigation Scenario. GHG emission tables for the years between 2000 and 2030 can be found in Appendix P. Table 4.1: Mitigation Scenario Waste Non-CO2 gases in 2030, CO2e (million tons)
Country/Region CH4 N20 Total World 707.25 90.18 797.43 OECD 236.27 40.28 276.54
OECD North America 163.61 18.47 182.08 United States 102.04 15.69 117.73
Canada 30.89 1.24 32.12 Mexico 30.68 1.55 32.23
OECD Pacific 24.30 8.76 33.06 Japan 1.21 7.47 8.69 Korea 11.55 0.61 12.16
Australia and New Zealand 11.54 0.68 12.22
OECD Europe 48.35 13.05 61.40 Transition Economies 58.03 4.62 62.66
Russia 19.05 2.43 21.48 Other EIT 38.99 2.19 41.18
Developing Countries 412.95 45.28 458.23 Developing Asia 255.47 29.99 285.46
China 91.40 16.65 108.04 India 81.82 2.38 84.20
Indonesia 20.86 2.38 23.24 Other Developing Asia 61.39 8.58 69.97
Latin America 58.87 6.19 65.06 Brazil 25.01 3.84 28.85
Other Latin America 33.86 2.35 36.21 Africa 52.89 5.35 58.23
North Africa 5.37 1.56 6.93 Other Africa 47.52 3.79 51.30 Middle East 45.72 3.76 49.48
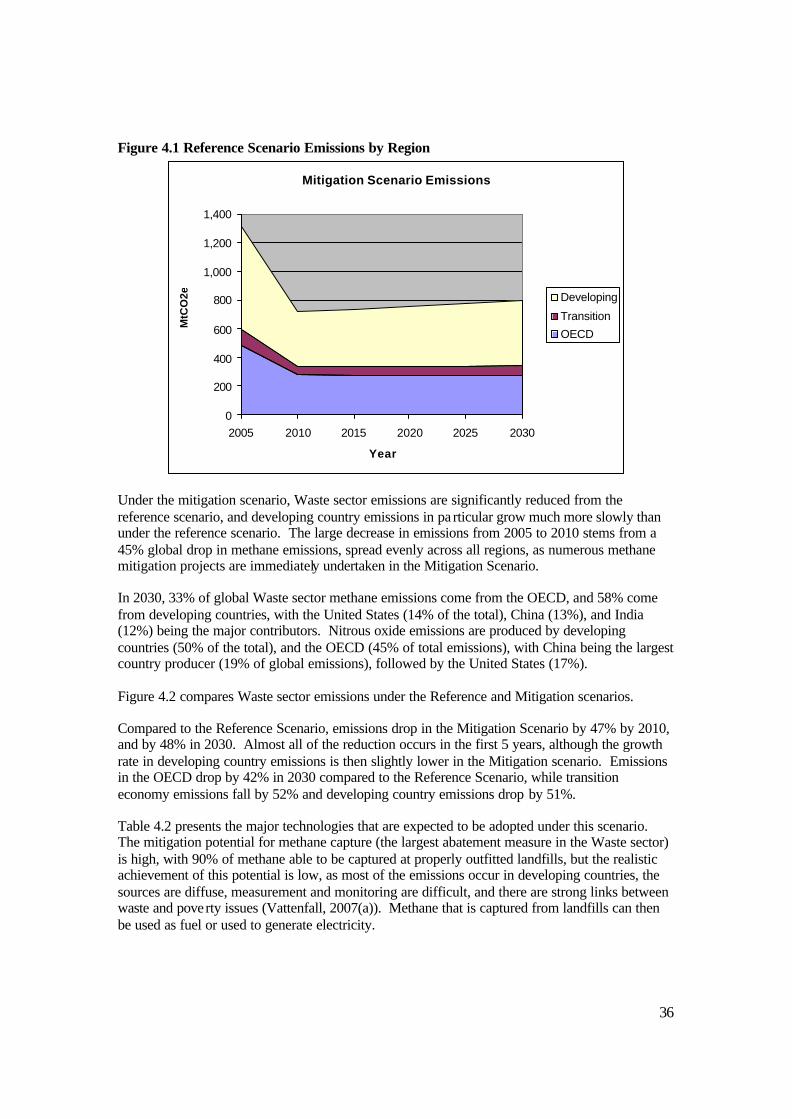
36
Figure 4.1 Reference Scenario Emissions by Region
Mitigation Scenario Emissions
0
200
400
600
800
1,000
1,200
1,400
2005 2010 2015 2020 2025 2030
Year
MtC
O2e
e
Developing
Transition
OECD
Under the mitigation scenario, Waste sector emissions are significantly reduced from the reference scenario, and developing country emissions in pa rticular grow much more slowly than under the reference scenario. The large decrease in emissions from 2005 to 2010 stems from a 45% global drop in methane emissions, spread evenly across all regions, as numerous methane mitigation projects are immediately undertaken in the Mitigation Scenario. In 2030, 33% of global Waste sector methane emissions come from the OECD, and 58% come from developing countries, with the United States (14% of the total), China (13%), and India (12%) being the major contributors. Nitrous oxide emissions are produced by developing countries (50% of the total), and the OECD (45% of total emissions), with China being the largest country producer (19% of global emissions), followed by the United States (17%). Figure 4.2 compares Waste sector emissions under the Reference and Mitigation scenarios. Compared to the Reference Scenario, emissions drop in the Mitigation Scenario by 47% by 2010, and by 48% in 2030. Almost all of the reduction occurs in the first 5 years, although the growth rate in developing country emissions is then slightly lower in the Mitigation scenario. Emissions in the OECD drop by 42% in 2030 compared to the Reference Scenario, while transition economy emissions fall by 52% and developing country emissions drop by 51%. Table 4.2 presents the major technologies that are expected to be adopted under this scenario. The mitigation potential for methane capture (the largest abatement measure in the Waste sector) is high, with 90% of methane able to be captured at properly outfitted landfills, but the realistic achievement of this potential is low, as most of the emissions occur in developing countries, the sources are diffuse, measurement and monitoring are difficult, and there are strong links between waste and poverty issues (Vattenfall, 2007(a)). Methane that is captured from landfills can then be used as fuel or used to generate electricity.

37
Figure 4.2: Waste Sector Emissions in the Reference and Mitigation Scenarios, MtCO2e
Mitigation vs. Reference Scenario Emissions
600
700
800
900
1,000
1,100
1,200
1,300
1,400
1,500
1,600
2005 2010 2015 2020 2025 2030
Year
MtC
O2e Mitigation
Reference
Table 4.2: Mitigation Technologies in the Waste Sector
Landfills
Technical maximum potential abatement (Gt CO2e/yr, 2030)
Realistic potential at <20 EUR/tCO2e (% realization rate)
Realistic potential at <40 EUR/tCO2e (% realization rate)
Capture and use methane using pipes and wells
Reduce landfills by recycling 0.7 0.19 (27%) 0.24 (34%)
Wastewater Improve filtering to reduce decomposition
Extract methane with aerobic digesters
0.6 0.1 (17%) 0.2 (33%)
Source: Vattenfall, 2007(a) b. Investment needs for the mitigation scenario
The major abatement opportunity that is undertaken in the Waste sector is capture of methane from landfills and wastewater, and the use of that methane for fuel or electricity production. Within the landfill sector, methane emissions can also be reduced at the source by reducing the amount of degradable material that enters landfills through reduced initial waste production, and through recycling and composting. Wastewater emissions can be reduced by advanced treatment technologies that use aerobic rather than anaerobic digestion and by the filtering out of degradable waste.

38
We estimate that in 2030, $14.9 billion (2000 USD)9 of incremental investment will be needed in the Waste Sector to meet the mitigation scenario emission levels, compared to the Reference Scenario emission levels. Table 4.3 presents the estimated incremental investment required in selected years between the present and 2030. Education and infrastructure costs are not believed to be significantly different between the Reference and Mitigation scenarios. Table 4.3: Incremental Waste Non-CO2 Emission Abatement Investment to meet the Mitigation Scenario ($Million, 2000 USD)
Country/Region 2010 2015 2020 2025 2030 Africa $3,130.8 $273.1 $273.1 $1,233.5 $2,527.3 AUS/NZ $656.7 $78.5 $78.5 $169.0 $386.6 Brazil $540.8 $23.7 $23.7 $204.2 $531.7 Canada $259.1 $27.5 $27.5 $251.0 $210.1 China $1,470.4 $34.8 $34.8 $507.2 $1,210.2 CIS $460.3 $18.0 $18.0 $170.3 $458.3 Eastern Europe $1,537.2 $34.6 $34.6 $527.4 $1,256.1 EU-15 $2,768.6 $0.0 $0.0 $172.0 $324.9 India $527.8 $31.1 $31.1 $212.1 $545.5 Japan $415.6 $0.0 $0.0 $13.6 $36.8 Latin America & Caribbean $1,411.7 $82.3 $82.3 $565.8 $1,315.8 Mexico $1,097.4 $57.4 $57.4 $429.3 $1,021.4 Middle East $1,772.6 $191.8 $191.8 $853.3 $1,903.4 Non-EU Europe $164.5 $0.0 $0.0 $18.3 $59.7 OPEC $0.0 $0.0 $0.0 $0.0 $0.0 Russia $1,026.9 $0.0 $0.0 $285.9 $698.1 South & SE Asia $864.8 $55.8 $55.8 $355.2 $855.0 South Korea $235.7 $2.3 $2.3 $76.0 $244.8 Turkey $239.3 $11.9 $11.9 $92.6 $286.3 Ukraine $456.4 $50.1 $50.1 $220.9 $554.5 United States $1,675.0 $0.0 $0.0 $933.0 $450.1 WORLD $20,711.6 $973.0 $973.0 $7,290.5 $14,876.6
To estimate investment costs to mitigate methane and nitrous oxide emissions, cost curve data from the 2006 US EPA report Global Mitigation of Non-CO2 Greenhouse Gases were used to identify mitigation activities that could be undertaken for less than $30/tonne CO2e capital cost, and a model was constructed to calculate the amount of each activity that would be undertaken in each year, and the resulting total investment requirement. The EPA cost curves were based on the average net cost and potential abatement achievable by each mitigation option. A discount rate of 10% and a tax rate of 40% were assumed (USEPA, 2006(b)). The detailed investment requirement estimates for non-CO2 emissions are presented in Appendix Q. Most of the abatement opportunities in the Waste sector are in developing countries, coincident with waste emissions distribution, and the abatement cost is similar across all time periods. However, in order to achieve the mitigation scenario’s abatement, local standards and policies
9 The investment needs in Dialogue Working Paper 8 differ from those presented here. In order to ensure that the investment estimates in the Working Paper are consistent between sectors, a different methodology was used to estimate each sector’s investment requirements to meet the mitigation scenario. Costs from CDM projects were extrapolated to estimate waste emission reduction investment requirements.

39
will be needed, and financial incentives will need to be put in place for developing countries to take action (Vattenfall, 2007(a)).
VII. Assessment of needed changes in financial and policy arrangements to fill
the gap between the BAU and mitigation scenarios (changes to existing policy mechanisms and some insight on any new sources of finance that could be used)
In many developed countries, actions that reduce methane emissions from landfills and wastewater treatment are likely to be undertaken for environmental and public health concerns aside from climate change. This already occurs under the Reference Scenario in many countries. However, there are still many barriers to investment methane abatement actions, particularly in developing countries. These include lack of awareness of, and experience with alternative technologies; poor economics at smaller dumps and landfills; lim ited infrastructure for natural gas use in some regions; lack of even rudimentary disposal systems at many dumps; and difficulties bringing together the many different actors involved in energy generation, fertilizer supply, and waste management. To overcome these, a combination of several measures is necessary, including:
• Institution building and technical assistance policies; • Voluntary agreements; • Regulatory measures; • Market-based programs.
Institution building and technical assistance is most important in developing countries. This involves setting up the technical and legal framework to manage and treat solid waste and wastewater. Multilateral or bilateral programs are ideally suited to help with this; the Interamerican Development Bank has had a special focus on waste management infrastructure, and the U.S. Country Studies Program, joint implementation initiatives, and the Global Environment Facility provide technical assistance and financing for these actions. Voluntary agreements or public -private partnerships can be set up between governments and utilities to overcome information and experience barriers and identify good mitigation sites. Regulations can be used to reduce the amount of waste that enters landfills through regulations that require waste to be separated (to enable recycling) at source, or that require minimum recycled-content standards for products. Existing landfills and wastewater facilities can be regulated to require methane capture and use. Once the infrastructure, regulations, and awareness exist, market-based programs can provide additional funding and incentive for projects. These can include initiatives such as tax credits, or low-cost financing, and may be provided by national governments or through the Global Environment Facility or similar funds (IPCC, 1996). Effective mitigation of global Waste sector emissions will require packages of several appropriate measures to be put together for each region, depending on the sophistication of its current waste management infrastructure.
VII. Conclusions Under the Mitigation Scenario, emissions drop by 48% in 2030 compared to the Reference Scenario. Almost all of the reductions occur in the first 5 years, and are the result of reduced methane emissions, although the growth rate in developing country emissions is also slightly lower than in the Reference scenario. Emissions in the OECD drop by 42% in 2030 compared to the Reference Scenario, while transition economy emissions fall by 52% and developing country emissions drop by 51%.

40
The major emission reduction measure in the Waste sector is capture and use of methane produced from anaerobic digestion in landfills and wastewater treatment. We estimate that in 2030, $14.9 billion (2000 USD) of incremental investment will be needed in the Waste Sector to undertake the mitigation measures that are necessary to achieve the Mitigation scenario’s emission levels. While methane emission reductions have a high technical potential, with 90% of methane able to be captured at properly outfitted landfills, the realistic potential is low, as most emission reductions occur in developing countries, the sources are diffuse, measurement and monitoring are difficult, and there are strong links between waste and poverty issues. Other barriers to investment in methane abatement actions, particularly in developing countries, are lack of awareness of, and experience with alternative technologies; poor economics at smaller dumps and landfills; limited infrastructure for natural gas use in some regions; lack of even rudimentary disposal systems at many dumps; and difficulties bringing together the many different actors involved in energy generation, fertilizer supply, and waste management. To overcome these, a combination of several measures is necessary, including institution building and technical assistance policies to ensure the development of a solid waste and wastewater treatment infrastructure; voluntary agreements and public-private partnerships to overcome information and expertise barriers; regulatory measures to divert waste from landfill and require methane capture and use; and market-based programs to provide incentives and reduce risk associated with investing in methane reduction projects. Both institution building and technical assistance (especially in developing countries) and market-based mechanisms (particularly in developed countries) can benefit from the involvement of bilateral and multilateral programs.

41
REFERENCES Crosby I. 2007. Mobilizing Commercial Lending for Energy Efficiency/Renewable Energy
Projects: IFC’s Evolving Approach. Moscow: International Finance Corporation (IFC) International Energy Agency (IEA). 2007. Tracking Industrial Energy Efficiency and CO2
Emissions. Paris: IEA IEA. 2006. World Energy Outlook 2006. Paris: OECD/IEA Intergovernmental Panel on Climate Change (IPCC). 1996. Technologies, Policies and
Measures for Mitigating Climate Change, Chapter 8: Solid Waste and Wastewater Disposal. Available at: <http://www.gcrio.org/ipcc/techrepI/solidwaste.html>
Laitner J, K Ehrhardt-Martinez and W Prindle. 2007. The American Energy Efficiency Investment Market. Washington, DC: American Council for an Energy-Efficient Economy (ACEEE)
Nyboer J. 2007. Chapter 8: Industry and Waste Management. In: King A and L Dilling. The First State of the Carbon Cycle Report (SOCCR): The North American Carbon Budget and Implications for the Global Carbon Cycle – Synthesis and Assessment Product 2.2. U.S. Climate Change Science Program. pp. 8-1 - 8-24
Organization for Economic Cooperation and Development (OECD). 2007. OECD Environmental Data Compendium 2006/2007: Waste. OECD
Pew Center on Global Climate Change. 2006. Building Solutions to Climate Change. Arlington, VA: Pew Center on Global Climate Change
Suding P. 2004. Use the Carrot as well as the Stick - How to increase efficiency of energy and resources in the urban construction sector of the PR China. Beijing: GTZ
T’Serclaes P. 2007. Financing Energy Efficient Homes: Existing policy responses to financial barriers. Paris: OECD/IEA
United States Environmental Protection Agency (USEPA). 2006(a). Global Anthropogenic Non-CO2 Greenhouse Gas Emissions: 1990-2020. Washington, DC: USEPA
USEPA. 2006(b). Global Mitigation of Non-CO2 Greenhouse Gases. Washington, DC: USEPA United Nations Environment Programme (UNEP). 2007. Buildings and Climate Change:
Status, Challenges and Opportunities. UNEP Vattenfall. 2007(a). Global Mapping of Greenhouse Gas Abatement Opportunities up to 2030:
Agriculture and Waste Sector Deep-Dive. Vattenfall Vattenfall. 2007(b). Global Mapping of Greenhouse Gas Abatement Opportunities up to 2030:
Buildings Sector Deep-Dive. Vattenfall Vattenfall. 2007(c). Global Mapping of Greenhouse Gas Abatement Opportunities up to 2030:
Industry Sector Deep-Dive. Vattenfall World Business Council on Sustainable Development (WBCSD). 2006. Energy Efficiency in
Buildings. WBCSD

42
APPENDICES Appendix A – Industry – Current situation - complete fuel consumption information disaggregated by country Appendix B – Industry – Current situation - complete GHG emission information disaggregated by country Appendix C – Industry – Reference Scenario - complete fuel consumption information disaggregated by available countries Appendix D – Industry – Reference Scenario - complete GHG emission information disaggregated by available countries Appendix E – Industry – Mitigation Scenario - complete fuel consumption information disaggregated by country Appendix F – Industry – Mitigation Scenario - complete GHG emission information disaggregated by country Appendix G – Industry – Mitigation Scenario - Investment requirement estimates for N2O. Appendix H – Buildings – Current Situation – complete fuel consumption information disaggregated by country Appendix I – Buildings – Current Situation – complete CO2 emission information disaggregated by country Appendix J – Buildings – Reference Scenario – complete fuel consumption informatio n disaggregated by country Appendix K – Buildings – Reference Scenario – complete CO2 emission information disaggregated by country Appendix L – Buildings – Mitigation Scenario – complete fuel consumption information disaggregated by country Appendix M – Buildings – Mitigation Scenario – complete CO2 emission information disaggregated by country Appendix N – Waste – Current Situation – complete GHG emission information disaggregated by country Appendix O – Waste – Reference Scenario – complete GHG emission information disaggregated by country Appendix P – Waste – Mitigation Scenario – complete GHG emission information disaggregated by country Appendix Q – Waste – Mitigation Scenario - Investment requirement estimates for Methane and Nitrous Oxide Mitigation.