V.S. Industry Berhad BUY · BNP Paribas Wealth Mngt. Gan Sem Yam 8.77 6.91 Historical Chart Source:...
15
MALAYSIA INVESTMENT RESEARCH REPORT KDN PP13226/04/2013 (032022) JF APEX SECURITIES BERHAD (47680-X) Please read carefully the important disclosures at end of this publication Investment Highlights We initiate coverage on V.S. Industry (VS) with a target price of RM1.50, based on 12.5x FY2017F PE with diluted EPS of 12 sen. We advise investors to accumulate the stock amid current share price weakness. Our fair value for VS renders 27% potential capital appreciation to investors coupled with its decent dividend yield of 4-5%. Growth remains intact albeit absence of ‘forex play’. Despite share price falling 25% year-to-date due to rebound of MYR against USD and across-the-broad selling pressure on export oriented counters, we believe VS still commands a resilient business model, which is able to provide fully integrated assembly services for Electronics Manufacturing Services (EMS) ranging from plastic injection moulding, production of Printed Circuit Board (PCB), battery packs and sub/full assembly of consumer electronic products. It is a leading global EMS provider, ranked 31 st largest in the world, according to the Manufacturing Market Insider, along with other prestigious names like Foxconn and Flextronics. Commendable earnings growth and sturdy balance sheet. VS is a fundamentally sound company, enjoying 5- year Compounded Annual Growth Rate (CAGR) of 19% for revenue and CAGR of 40% for headline net profit during FY10 till FY15. Going forward, we envisage the Group’s core net earnings to grow by 29.9% to RM135.7m for FY16F and 20.6% to RM163.7m for FY17F with key earnings contribution from its three major clients, namely Dyson (vacuum cleaner), Keurig (coffee brewer) and Zodiac (robotic pool cleaner). Besides, VS commands a sturdy balance sheet with current low net gearing of 0.2x, which allows it to have ample flexibility to gear up for future capacity expansion and M&A. Resumption of strong orders from Dyson. Moving forward, we believe the Group could clinch more orders in respect of box build full assembly for the new model of vacuum cleaner from Dyson. The first Purchase Order (PO) could come in a few months time. We learnt that the Group could bag as much as RM300m new orders per annum from Dyson starting FY17F over a period of 3-5 years. Hence, this shall lift the Group’s earnings by 12.6% for FY17F and 10.8% for FY18F. This is on top of existing Dyson models with job scope worth estimated RM650m in FY17F. Our earnings forecast has yet to factor in the potential contract win. Inorganic growth to further expand its business and bottom line. VS plans to embark on an acquisition strategy to level up its business. The Group may consider taking up Initiating Coverage 8 July 2016 V.S. Industry Berhad BUY A force to be reckoned with Target Price: RM1.50 Share Price RM1.18 Target Price RM1.50 Company Description V.S Industry Berhadn and its subsidiary manufacture, assemble, and sell plastic molded parts and electronics parts and components such as speakers and remote controls. Stock Data Bursa / Bloomberg code 6963 / VSI MK Board / Sector Main / Ind-Prod Syariah Compliant status Yes Issued shares (m) 1169.92 Par Value (RM) 1.00 Market cap. (RM’m) 1380.51 52-week price Range RM0.88-1.69 Beta (against KLCI) 0.67 3-m Average Daily Volume 3.76m 3-m Average Daily Value RM4.58m Share Performance 1m 3m 12m Absolute (%) -4.1 0.0 31.1 Relative (%-pts) -4.2 -1.8 36.4 Major Shareholders % Beh Kim Ling 9.77 BNP Paribas Wealth Mngt. Gan Sem Yam 8.77 6.91 Historical Chart Source: Bloomberg Lee Chung Cheng 03-87361118, ext. 758 [email protected]
Transcript of V.S. Industry Berhad BUY · BNP Paribas Wealth Mngt. Gan Sem Yam 8.77 6.91 Historical Chart Source:...

MALAYSIA INVESTMENT RESEARCH REPORT
KDN PP13226/04/2013 (032022) JF APEX SECURITIES BERHAD (47680-X)
Please read carefully the important disclosures at end of this publication
Investment Highlights
We initiate coverage on V.S. Industry (VS) with a
target price of RM1.50, based on 12.5x FY2017F PE with diluted EPS of 12 sen. We advise investors to
accumulate the stock amid current share price weakness.
Our fair value for VS renders 27% potential capital appreciation to investors coupled with its decent dividend
yield of 4-5%.
Growth remains intact albeit absence of ‘forex play’.
Despite share price falling 25% year-to-date due to rebound
of MYR against USD and across-the-broad selling pressure on export oriented counters, we believe VS still commands a
resilient business model, which is able to provide fully
integrated assembly services for Electronics Manufacturing Services (EMS) ranging from plastic injection moulding,
production of Printed Circuit Board (PCB), battery packs and sub/full assembly of consumer electronic products. It is a
leading global EMS provider, ranked 31st largest in the
world, according to the Manufacturing Market Insider, along with other prestigious names like Foxconn and Flextronics.
Commendable earnings growth and sturdy balance
sheet. VS is a fundamentally sound company, enjoying 5-year Compounded Annual Growth Rate (CAGR) of 19% for
revenue and CAGR of 40% for headline net profit during FY10 till FY15. Going forward, we envisage the Group’s core
net earnings to grow by 29.9% to RM135.7m for FY16F and
20.6% to RM163.7m for FY17F with key earnings contribution from its three major clients, namely Dyson
(vacuum cleaner), Keurig (coffee brewer) and Zodiac (robotic pool cleaner). Besides, VS commands a sturdy
balance sheet with current low net gearing of 0.2x, which
allows it to have ample flexibility to gear up for future capacity expansion and M&A.
Resumption of strong orders from Dyson. Moving
forward, we believe the Group could clinch more orders in respect of box build full assembly for the new model of
vacuum cleaner from Dyson. The first Purchase Order (PO) could come in a few months time. We learnt that the Group
could bag as much as RM300m new orders per annum from
Dyson starting FY17F over a period of 3-5 years. Hence, this shall lift the Group’s earnings by 12.6% for FY17F and
10.8% for FY18F. This is on top of existing Dyson models with job scope worth estimated RM650m in FY17F. Our
earnings forecast has yet to factor in the potential contract
win.
Inorganic growth to further expand its business and
bottom line. VS plans to embark on an acquisition strategy
to level up its business. The Group may consider taking up
Initiating Coverage 8 July 2016 V.S. Industry Berhad BUY
A force to be reckoned with Target Price: RM1.50
Share Price RM1.18 Target Price RM1.50 Company Description V.S Industry Berhadn and its subsidiary manufacture, assemble, and sell plastic molded parts and electronics parts and components such as speakers and remote controls.
Stock Data Bursa / Bloomberg code 6963 / VSI MK Board / Sector Main / Ind-Prod Syariah Compliant status Yes Issued shares (m) 1169.92 Par Value (RM) 1.00 Market cap. (RM’m) 1380.51 52-week price Range RM0.88-1.69 Beta (against KLCI) 0.67 3-m Average Daily Volume 3.76m 3-m Average Daily Value RM4.58m
Share Performance
1m 3m 12m Absolute (%) -4.1 0.0 31.1 Relative (%-pts) -4.2 -1.8 36.4
Major Shareholders % Beh Kim Ling 9.77 BNP Paribas Wealth Mngt. Gan Sem Yam
8.77 6.91
Historical Chart
Source: Bloomberg
Lee Chung Cheng
03-87361118, ext. 758

8 July 2016 Initiating Coverage – VS Industry Berhad JF APEX SECURITIES
2
a strategic stake in a healthcare and wellness company to
reap the synergistic benefits. This could render sub/full assembly works worth RM180m yearly contract for VS under
its China operation in addition to the profits from ownership stake in an immediate term. Should the acquisition
materialise, it could contribute RM13m yearly net profit to
the Group for FY17F onwards. Meanwhile, for the recent acquisition of 12.1% stake in Seeing Machines Ltd (SML),
we expect VS to benefit from the R&D collaboration and manufacturing opportunity of the company in the longer run
by participating in the Automotive Driver Monitoring System (DMS) and Driver Safety Solution (DSS).
Improving margin with profit turnaround in overseas
operations. Historically, VS’ net margin of 3-5% was
significantly below its peer of 6-9%, mainly dragged down by losses in overseas operations. Going forward, we reckon
that the Group’s profit margin would improve along with the anticipated profit turnaround in China and Indonesia
operations. Indonesian market is expected to be profitable
in FY16F (9MFY16: PBT of +RM4.8m vs FY15: PBT of –RM3.6m); whilst Chinese market is envisaged to breakeven
in FY16F (9MFY16: PBT of +RM2.8m vs FY15: PBT of –RM7.6m). Thus, overall group’s core net margin (excluding
forex gain/loss) could improve to 6.5-7.0% for FY16-18F from 5.4% in FY15.
Attractive dividend yield. The Group subscribes to
minimum 40% net profit payout as its dividend policy with
quarterly dividend declaration. We expect VS to reward shareholders with 4.8 sen/share for FY16F and 6.0
sen/share for FY17F, which translate into decent dividend yield of 4-5% based on current closing price. The Group is
currently enjoying average utilisation rate of below 60%,
which allows it to continue growing without incurring heavy capex for the coming years.
Earnings Outlook
We estimate the Group’s FY2016F, FY2017F and
FY2018F core net earnings to trend positively, up
29.9%, 20.6% and 18.1% respectively on the back of higher revenue achieved (FY16F: +9.1%; FY17F: +11.9%
and FY18F: +16.9%). Furthermore, the Group’s profit margin is expected to continue expanding in line with the
turnaround in overseas operations.
Valuation/Recommendation
We initiate coverage on VS with a target price of
RM1.50, based on 12.5x FY2017F PE with diluted EPS
forecast of 12 sen. The PER assigned for valuation of VS is at the sector average PE and +2 standard deviation above
mean of historical PE of the Group.
The target PE is warranted in view of the Group’s capability
of securing sizeable orders from Dyson and its potential
strategic acquisition of a healthcare and wellness company
under its China operation to further expand its earnings in FY17F.

8 July 2016 Initiating Coverage – VS Industry Berhad JF APEX SECURITIES
3
Company Background
VS is a leading global electronics manufacturing services (EMS) provider involved in plastic injection
moulding, mould design and fabrication, production of Printed Circuit Board (PCB), sub-assembly and final product assembly of consumer electronic products. It is one of the world’s top 50 Integrated EMS
providers and top 5 largest EMS providers in ASEAN. VS also serves as original design manufacturer (ODM) & original equipment manufacturer (OEM) to customers who are mainly from the USA, Europe &
Japan.
VS has more than 30 years of experience and track record, having established in 1982. Examples of
finished and semi-finished products manufactured and/or assembled by the Group include coffee brewers, vacuum cleaners, automatic swimming pool cleaners, automotive plastic components, printed circuit
boards, and battery packs etc.
Figure 1: Integrated EMS Services Provider
Source: Company, JF Apex
Figure 2: Business Activities
Source: Company, JF Apex

8 July 2016 Initiating Coverage – VS Industry Berhad JF APEX SECURITIES
4
Figure 3: Key Products
Source: Company, JF Apex VS’ clientele comprises renowned multinational consumer product companies based in the US, Europe and
Japan. Top 3 customers of VS contribute about 55% to turnover. No single customer contributes more than 30% to the Group revenue, minimizing risk of overly reliance on any one particular customer.
Figure 4: Major Customers for Malaysian Operation
Source: Company, JF Apex
8 July 2016 Initiating Coverage – VS Industry Berhad JF APEX SECURITIES
5
Figure 5: Major Customers for Overseas Operations
Source: Company, JF Apex
The Group has factories in Senai, Johor; Jakarta, Indonesia; Zhuhai and Qingdao, China; as well as Hanoi, Vietnam, with a combined production space in excess of 3m sq ft. The Group has about 10,000 staff,
down from 15,000 staff several years ago, despite rising revenue. This was achieved through ongoing initiatives to increase automation as well as improvement in production process flow to increase
efficiency.
Figure 6: Overseas Operations and Production Capacity
Source: Company, JF Apex

8 July 2016 Initiating Coverage – VS Industry Berhad JF APEX SECURITIES
6
Geographically, Malaysia is the largest earnings contributor to the Group. Malaysian operation contributed
close to 70% to the Group’s topline with remaining 30% from China and Indonesian operations. Product wise, consumer electronic is the largest contributor to the Group’s revenue with more than 90% of VS’
output is for consumer products segment. The balance is made up of clients in automotive, medical devices, and machinery.
Figure 7: FY15 Contribution by Production Country
Source: Company, JF Apex
Top 3 customers, namely, Keurig, Dyson and Zodiac contributed 55% of the Group’s turnover and 80% of
Malaysia’s turnover. No single customer contributes more than 30% to the Group revenue, hence minimizing risk of overly reliance on any particular customer.
Figure 8: Revenue Mix by Clients
Source: Company, JF Apex
8 July 2016 Initiating Coverage – VS Industry Berhad JF APEX SECURITIES
7
SWOT Analysis
Strengths
Leading EMS service provider with proven track
record.
Able to offer fully integrated services with OEM
and ODM capabilities. Strong business relationship with Dyson and
Keurig.
Experienced management as founding
members having over 30 years of experience in
the industry. Ready to take on more orders with ample
capacity as current utilisation rate is below
60%. Ongoing push for higher automation to
increase productivity and reduce labour cost.
Weaknesses
Concentration risk with top three customers,
Keurig, Dyson and Zodiac contribute 55% of
the Group’s FY15 revenue. Forex risk with strengthening of MYR against
USD. VS is net beneficiary of appreciation of
USD against MYR and vice versa.
Opportunities
Inorganic growth stemming from potential
M&A and organic growth with sizeable contracts to be won from existing clients.
Strengthening of USD against MYR. VS is net
beneficiary of appreciation of USD against MYR
and vice versa. Turnaround of overseas operations especially in
China and Indonesia.
Threats
The Group’s earnings could be affected by
downturn in E&E industry. Intense competition in contract manufacturing
may result in drop of profit margin.
Impact of Brexit.
Industry Review/Outlook
The worldwide electronics manufacturing services (EMS) market is a determining force in production of
electronics products and now accounts for almost 40 percent of all assembly. While the rate of growth for
outsourcing is slowing, it still represents the most desired manufacturing model for the assembly of electronics products available to OEM companies. The EMS industry declined approximately 1.7 percent in
2015 as a result of the slowing of sales for PCs (desktop and notebook).
New Venture Research (NVR) estimates that total electronics assembly value was $1.3 trillion in 2015 and will grow to approximately $1.6 trillion in 2020 – a 4.0 percent compounded annual growth rate. Fueled
by the demand for EMS services, NVR believes that the contract manufacturing industry will grow from
$430 billion in 2015 to $580 billion in 2020 - approximately at a 6.2 percent CAGR.
(Source: New Venture Research Report)

8 July 2016 Initiating Coverage – VS Industry Berhad JF APEX SECURITIES
8
Figure 9: VS is the only Malaysian company ranked under The Manufacturing Market
Insider’s Top 50 EMS providers (Based on 2015 Sales)
1 Foxconn, Taiwan
2 Pegatron, Taiwan
3 Flextronics, Singapore
4 Jabil, US
5 Sanmina, US
6 Celestica, Canada
7 New Kinpo Group, Taiwan
8 Wistron, Taiwan
9 Universal Scientific Industrial Co Ltd, China
10 Plexus, US
11 Benchmark Electronics, US
12 Shenzhen Kaifa, China
13 Venture, Singapore
14 Zollner Elektronik Group, Germany
15 PKC Group, Finland
16 SIIX, Japan
17 Asteelflash, France
18 UMC Electronics, Japan
19 Sumitronics, Japan
20 Fabrinet, Thailand
21 Kimball Electronics Group, US
22 Integrated Micro-Electronics Inc, Philippines
22 Global Brands Manufacture, Taiwan
23 NEO Tech, US
24 Scanfil EMS, Finland
25 Enics, Switzerland
26 Ducommum, US
27 3CEMS, China
28 VIDEOTON Holding, China
29 VTech Communications, HK
30 Katolec, Japan
31 VS Industry, Malaysia
32 WKK Technology Ltd, HK
33 Neways Electronics International N.V., The Netherlands
34 Eolane, France
35 Wong’s, HK
36 Key Tronic, US
37 Oriental Semiconductor Electronics, Taiwan
38 Global Brands Manufacturing, Taiwan
39 Creation Technologies, Canada
40 Hana Microelectronics, Thailand
41 Computime Limited, HK
42 ALL CIRCUITS, France
43 LACROIX Electronics, France
44 Kitron, Norway
45 Topscom, China
46 SVI, Thailand
47 Valuetronics Holding, HK
48 Di-Nikko Engineering, Japan
49 Nippon Manufacturing Service, Japan
50 TT Electronics, UK
Source: Manufacturing Market Insider
8 July 2016 Initiating Coverage – VS Industry Berhad JF APEX SECURITIES
9
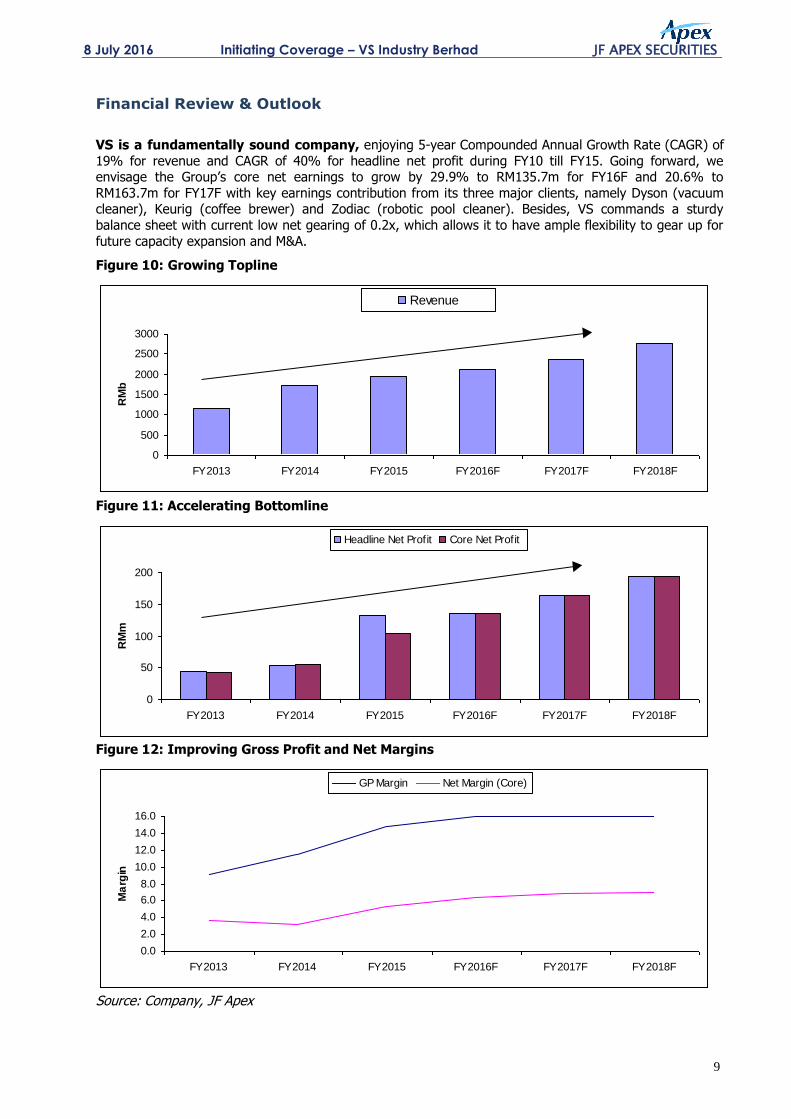
Financial Review & Outlook
VS is a fundamentally sound company, enjoying 5-year Compounded Annual Growth Rate (CAGR) of
19% for revenue and CAGR of 40% for headline net profit during FY10 till FY15. Going forward, we envisage the Group’s core net earnings to grow by 29.9% to RM135.7m for FY16F and 20.6% to
RM163.7m for FY17F with key earnings contribution from its three major clients, namely Dyson (vacuum cleaner), Keurig (coffee brewer) and Zodiac (robotic pool cleaner). Besides, VS commands a sturdy
balance sheet with current low net gearing of 0.2x, which allows it to have ample flexibility to gear up for
future capacity expansion and M&A.
Figure 10: Growing Topline
0
500
1000
1500
2000
2500
3000
FY2013 FY2014 FY2015 FY2016F FY2017F FY2018F
RM
b
Revenue
Figure 11: Accelerating Bottomline
0
50
100
150
200
FY2013 FY2014 FY2015 FY2016F FY2017F FY2018F
RM
m
Headline Net Profit Core Net Profit
Figure 12: Improving Gross Profit and Net Margins
0.0
2.0
4.0
6.0
8.0
10.0
12.0
14.0
16.0
FY2013 FY2014 FY2015 FY2016F FY2017F FY2018F
Ma
rgin
GP Margin Net Margin (Core)
Source: Company, JF Apex

8 July 2016 Initiating Coverage – VS Industry Berhad JF APEX SECURITIES
10
For 9MFY16, revenue of VS increased 13.4% yoy to RM1.6b, while core net earnings soared
by 45.0% YoY to RM101.7m (excluding RM7.1m forex gain). The strong surge in core net profit was due to higher sales volume, improved gross profit margin, lower net interest expense and lower effective
tax rate pursuant to utilization of export-related tax incentives.
Meanwhile, the Group achieved headline net profit of RM19.3m for its 3QFY16, down 27.2% yoy and
29.8% qoq amid higher revenue recorded, RM507.8m (+20.9% yoy and +1.3% qoq). This was mainly due to lower gross profit margin resulting from weakening of USD against MYR during the period as the
USDMYR exchange rate used in the revenue recognition was less favourable as compared to the USDMYR exchange rate used to book the raw materials cost coupled with forex loss. Excluding the forex gain or
loss, VS registered 3QFY16 core net profit of RM23.7m, up 15.4% yoy on the back of healthy orders from all key customers, but still down 18.0% qoq as affected by unfavourable forex.
Figure 13: Quarterly Financials
Year to 31 July (RMm) 3QFY16 2QFY16 3QFY15 qoq % yoy % 9MFY16 9MFY15 yoy %
Revenue 507.8 501.1 420.1 1.3 20.9 1621.4 1430 13.4
Gross Profit 70.7 85.9 66.1 -17.7 7.0 263.3 214.9 22.5
EBIT 26.6 39.7 38.3 -33.0 -30.5 145.4 115.7 25.7
PBT 22.3 35.8 34.5 -37.7 -35.4 133 102.6 29.6
Net Profit 19.3 27.5 26.5 -29.8 -27.2 107 80 33.8
Core Net Profit 23.7 28.9 20.5 -18.0 15.4 101.7 70.1 45.0
Gross margin (%) / ppt 13.9 17.1 15.7 -3.2 -1.8 16.2 15.0 1.2 EBIT margin (%) / ppt 5.2 7.9 9.1 -2.7 -3.9 9.0 8.1 0.9 PBT margin (%) / ppt 4.4 7.1 8.2 -2.8 -3.8 8.2 7.2 1.0 Net margin (%) / ppt 3.8 5.5 6.3 -1.7 -2.5 6.6 5.6 1.0 Source: Company, JF Apex
Improved overseas operations. Indonesia operations continued to be profitable in 3QFY16 with PBT of RM1.0m, against pre-tax loss of RM2.6m a year ago and climbed 42.9% qoq thanks to higher orders
secured from existing customers and higher margin as benefited from economies of scale following
increase in production. The Group expects performance to continue improving going forward with current 9MFY16 PBT of RM4.8m, successfully returning into the black from a year ago.
For China operations, it registered marginal loss of RM1.1m in 3QFY16 due to seasonal factors. However,
9MFY16 remained profitable at RM2.8m. Management expects full year performance to be satisfactory or
at least breakeven. Earnings shall pick up in tandem with better sales volume given depreciation and fixed overheads are already factored in.

8 July 2016 Initiating Coverage – VS Industry Berhad JF APEX SECURITIES
11
Figure 14: Geographical Breakdown Year to 31 July (RMm) 3QFY16 2QFY16 3QFY15 qoq % yoy % 9MFY16 9MFY15 yoy %
Revenue
Malaysia 356.3 311.7 284.1 14.3 25.4 1098.2 989.3 11.0
Indonesia 26.3 25.2 18.7 4.4 40.6 82.4 58 42.1
China 124.6 163.8 116.7 -23.9 6.8 439 381.2 15.2
PBT
Malaysia 23.4 31.8 40.2 -26.4 -41.8 127.9 112 14.2
Indonesia 1 0.7 -2.6 42.9 n.a. 4.8 -3.3 n.a.
China -1.1 4.8 -3 n.a. n.a. 2.8 -4.5 n.a.
PBT margin (%) / ppt
Malaysia 6.6 10.2 14.1 -3.6 -7.6 11.6 11.3 0.3
Indonesia 3.8 2.8 n.a. 1.0 n.a. 5.8 n.a. n.a.
China n.a. 2.9 n.a. n.a. n.a. 0.6 n.a. n.a. Source: Company, JF Apex
Moving into 4QFY16, we envisage VS to chalk up better core net earnings of RM34.0m, up 43.5% qoq and flat or slip marginally yoy. Historically, 1Q and 4Q are the stronger quarters whilst 2Q
and 3Q are the weaker seasons. Thus, this bring VS’ forecasted core net earnings for FY16F to
RM135.7m, up 29.9% yoy (against FY15: core net earnings of RM104.4m). This was mainly due to higher sales volume with revenue up 9.1% yoy coupled with better gross margin of 16.0% (against FY15: gross
margin of 14.8%) banking on improving overseas operations.
For FY17F, we envisage the Group’s revenue and core net earnings to grow further by 11.9%
yoy to RM2.4b and 20.6% yoy to RM163.7m respectively, driven by consistent sales orders from its three main customers - Dyson, Keurig and Zodiac as well as continued improving sales and operational
efficiency from its Indonesia and China operations.
Potential earnings upside. We believe the Group could clinch more orders in respect of box build full assembly for the new model of vacuum cleaner from Dyson. The Group could bag as much as RM300m
new orders per annum from Dyson starting FY17F over a period of 3-5 years. Hence, this shall lift the
Group’s earnings by 12.6% for FY17 and 10.8% for FY18F. This is on top of the existing Dyson’s model with job scope worth estimated RM650m in FY17F. Our earnings forecast is yet to factor in the potential
new contract win.
VS plans to embark on an acquisition strategy to further enhance its earnings. The Group may
consider taking up a strategic stake in a healthcare and wellness company to reap the synergistic benefits. This could render sub/full assembly works worth RM180m yearly contract for VS under its China
operation in addition to the profits from ownership stake in an immediate term. Should the acquisition materialise, it could contribute RM13m yearly net profit to the Group for FY17F onwards.
8 July 2016 Initiating Coverage – VS Industry Berhad JF APEX SECURITIES
12
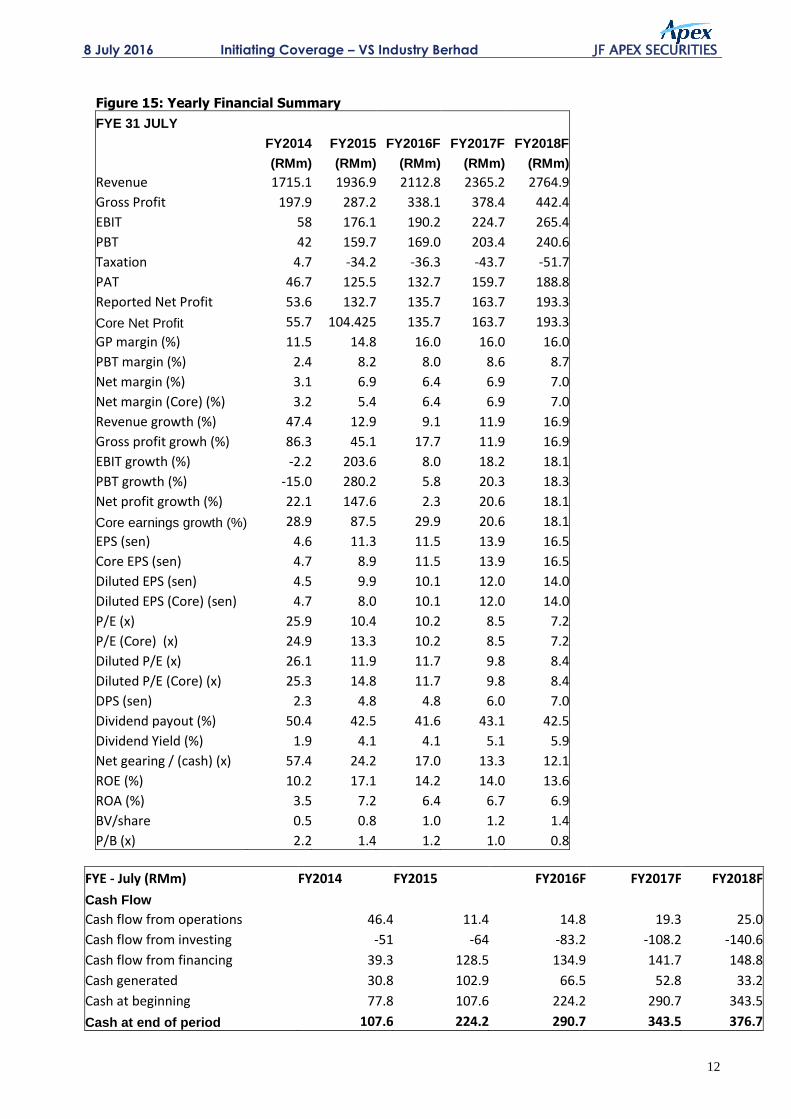
Figure 15: Yearly Financial Summary
FYE 31 JULY
FY2014 FY2015 FY2016F FY2017F FY2018F
(RMm) (RMm) (RMm) (RMm) (RMm)
Revenue 1715.1 1936.9 2112.8 2365.2 2764.9
Gross Profit 197.9 287.2 338.1 378.4 442.4
EBIT 58 176.1 190.2 224.7 265.4
PBT 42 159.7 169.0 203.4 240.6
Taxation 4.7 -34.2 -36.3 -43.7 -51.7
PAT 46.7 125.5 132.7 159.7 188.8
Reported Net Profit 53.6 132.7 135.7 163.7 193.3
Core Net Profit 55.7 104.425 135.7 163.7 193.3
GP margin (%) 11.5 14.8 16.0 16.0 16.0
PBT margin (%) 2.4 8.2 8.0 8.6 8.7
Net margin (%) 3.1 6.9 6.4 6.9 7.0
Net margin (Core) (%) 3.2 5.4 6.4 6.9 7.0
Revenue growth (%) 47.4 12.9 9.1 11.9 16.9
Gross profit growh (%) 86.3 45.1 17.7 11.9 16.9
EBIT growth (%) -2.2 203.6 8.0 18.2 18.1
PBT growth (%) -15.0 280.2 5.8 20.3 18.3
Net profit growth (%) 22.1 147.6 2.3 20.6 18.1
Core earnings growth (%) 28.9 87.5 29.9 20.6 18.1
EPS (sen) 4.6 11.3 11.5 13.9 16.5
Core EPS (sen) 4.7 8.9 11.5 13.9 16.5
Diluted EPS (sen) 4.5 9.9 10.1 12.0 14.0
Diluted EPS (Core) (sen) 4.7 8.0 10.1 12.0 14.0
P/E (x) 25.9 10.4 10.2 8.5 7.2
P/E (Core) (x) 24.9 13.3 10.2 8.5 7.2
Diluted P/E (x) 26.1 11.9 11.7 9.8 8.4
Diluted P/E (Core) (x) 25.3 14.8 11.7 9.8 8.4
DPS (sen) 2.3 4.8 4.8 6.0 7.0
Dividend payout (%) 50.4 42.5 41.6 43.1 42.5
Dividend Yield (%) 1.9 4.1 4.1 5.1 5.9
Net gearing / (cash) (x) 57.4 24.2 17.0 13.3 12.1
ROE (%) 10.2 17.1 14.2 14.0 13.6
ROA (%) 3.5 7.2 6.4 6.7 6.9
BV/share 0.5 0.8 1.0 1.2 1.4
P/B (x) 2.2 1.4 1.2 1.0 0.8
FYE - July (RMm) FY2014 FY2015 FY2016F FY2017F FY2018F
Cash Flow
Cash flow from operations 46.4 11.4 14.8 19.3 25.0
Cash flow from investing -51 -64 -83.2 -108.2 -140.6
Cash flow from financing 39.3 128.5 134.9 141.7 148.8
Cash generated 30.8 102.9 66.5 52.8 33.2
Cash at beginning 77.8 107.6 224.2 290.7 343.5
Cash at end of period 107.6 224.2 290.7 343.5 376.7
8 July 2016 Initiating Coverage – VS Industry Berhad JF APEX SECURITIES
13
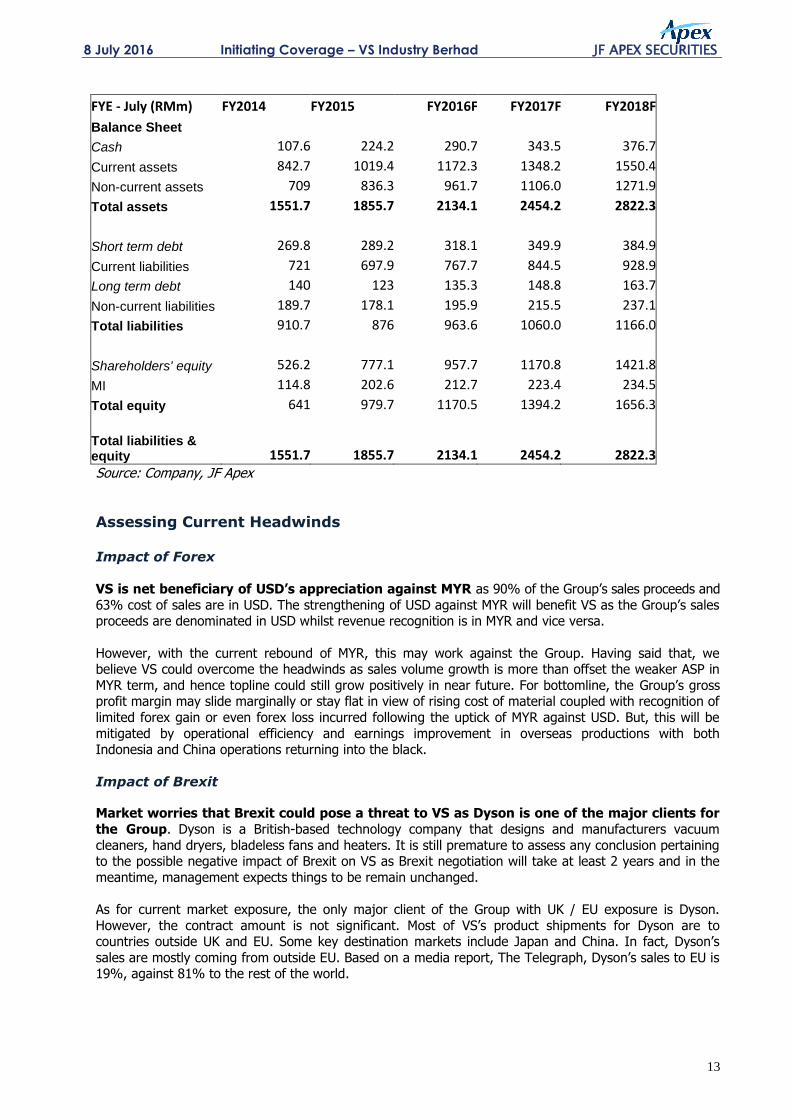
FYE - July (RMm) FY2014 FY2015 FY2016F FY2017F FY2018F
Balance Sheet
Cash 107.6 224.2 290.7 343.5 376.7
Current assets 842.7 1019.4 1172.3 1348.2 1550.4
Non-current assets 709 836.3 961.7 1106.0 1271.9
Total assets 1551.7 1855.7 2134.1 2454.2 2822.3
Short term debt 269.8 289.2 318.1 349.9 384.9
Current liabilities 721 697.9 767.7 844.5 928.9
Long term debt 140 123 135.3 148.8 163.7
Non-current liabilities 189.7 178.1 195.9 215.5 237.1
Total liabilities 910.7 876 963.6 1060.0 1166.0
Shareholders' equity 526.2 777.1 957.7 1170.8 1421.8
MI 114.8 202.6 212.7 223.4 234.5
Total equity 641 979.7 1170.5 1394.2 1656.3
Total liabilities & equity 1551.7 1855.7 2134.1 2454.2 2822.3 Source: Company, JF Apex
Assessing Current Headwinds Impact of Forex VS is net beneficiary of USD’s appreciation against MYR as 90% of the Group’s sales proceeds and
63% cost of sales are in USD. The strengthening of USD against MYR will benefit VS as the Group’s sales proceeds are denominated in USD whilst revenue recognition is in MYR and vice versa.
However, with the current rebound of MYR, this may work against the Group. Having said that, we believe VS could overcome the headwinds as sales volume growth is more than offset the weaker ASP in
MYR term, and hence topline could still grow positively in near future. For bottomline, the Group’s gross profit margin may slide marginally or stay flat in view of rising cost of material coupled with recognition of
limited forex gain or even forex loss incurred following the uptick of MYR against USD. But, this will be
mitigated by operational efficiency and earnings improvement in overseas productions with both Indonesia and China operations returning into the black.
Impact of Brexit
Market worries that Brexit could pose a threat to VS as Dyson is one of the major clients for
the Group. Dyson is a British-based technology company that designs and manufacturers vacuum
cleaners, hand dryers, bladeless fans and heaters. It is still premature to assess any conclusion pertaining to the possible negative impact of Brexit on VS as Brexit negotiation will take at least 2 years and in the
meantime, management expects things to be remain unchanged.
As for current market exposure, the only major client of the Group with UK / EU exposure is Dyson.
However, the contract amount is not significant. Most of VS’s product shipments for Dyson are to countries outside UK and EU. Some key destination markets include Japan and China. In fact, Dyson’s
sales are mostly coming from outside EU. Based on a media report, The Telegraph, Dyson’s sales to EU is 19%, against 81% to the rest of the world.

8 July 2016 Initiating Coverage – VS Industry Berhad JF APEX SECURITIES
14
Peer Comparison
Figure 16: Peer Comparison
Source: Bloomberg, JF Apex
Historical PE
Figure 17: Historical PE band of VS
Source: Bloomberg, JF Apex
Valuation & Recommendation
We initiate coverage on VS with a target price of RM1.50, based on 12.5x FY2017F PE with diluted
EPS forecast of 12 sen. The PER assigned for valuation of VS is at the sector average PE and +2 standard deviation above mean of historical PE of the Group. The target PE is warranted in view of the Group’s
capability of securing sizeable orders from Dyson and its potential strategic acquisition of a healthcare and wellness company under its China operation to further expand its earnings in FY17F.
6
7
8
9
10
11
12
13
14
10/2
/14
11/2
/14
12/2
/14
1/2/
15
2/2/
15
3/2/
15
4/2/
15
5/2/
15
6/2/
15
7/2/
15
8/2/
15
9/2/
15
10/2
/15
11/2
/15
12/2
/15
1/2/
16
2/2/
16
3/2/
16
4/2/
16
5/2/
16
6/2/
16
7/2/
16
Mean: 9.7
+1SD: 11.1
+2SD: 12.5
-1SD: 8.2
-2SD: 6.8
Company Ticker Rec
Share Price @ 4
July 16 Target price Market Cap.
Dividend
Yield (%)
(RM) (RM) (RMm) FY2015 FY2016F FY2017F FY2015 FY2016F FY2015 FY2016F FY2016F
VS Industry VSI MK Equity BUY 1.18 1.50 1368.8 10.4 10.2 8.5 17.1 14.2 1.4 1.2 4.1
SKP Resources SKP MK Equity N.R. 1.2 1.71 1404.1 16.0 10.3 8.7 33.4 40.1 4.0 3.5 4.6
EG industries EG MK Equity N.R. 0.84 1.09 177.5 2.7 10.9 7.0 20.9 8.5 0.6 N.A. N.A.
PIE Industrial PIE MK Equity N.R. 12.48 14.55 958.6 19.5 15.8 12.9 14.0 15.0 2.5 2.3 3.0
Uchi Technologies UCHI MK Equity N.R. 1.54 1.65 669.9 13.1 12.5 12.1 23.3 25.2 2.9 2.6 6.8
LCTH Corp LCTH MK Equity N.R. 0.57 N.A. 205.2 8.2 N.A. N.A. 12.6 N.A. 1.0 N.A. N.A.
Average (excluding VS industry) 11.9 12.4 10.2 20.8 22.2 2.2 2.8 4.8
P/E (x)ROE (%) P/B (x)

8 July 2016 Initiating Coverage – VS Industry Berhad JF APEX SECURITIES
15
JF APEX SECURITIES BERHAD – CONTACT LIST
JF APEX SECURITIES BHD Head Office: 6th Floor, Menara Apex Off Jalan Semenyih Bukit Mewah 43000 Kajang Selangor Darul Ehsan Malaysia General Line: (603) 8736 1118 Facsimile: (603) 8737 4532
PJ Office: 15th Floor, Menara Choy Fook On No. 1B, Jalan Yong Shook Lin 46050 Petaling Jaya Selangor Darul Ehsan Malaysia General Line: (603) 7620 1118 Facsimile: (603) 7620 6388
DEALING TEAM Head Office: Kong Ming Ming (ext 3237) Shirley Chang (ext 3211) Norisam Bojo (ext 3233) Institutional Dealing Team: Lim Teck Seng Sanusi Bin Mansor (ext 740) Fathul Rahman Buyong (ext 741) Ahmad Mansor (ext 744)
Zairul Azman (ext 746) PJ Office: Mervyn Wong (ext 363) Azfar Bin Abdul Aziz (Ext 822) Tan Heng Cheong (Ext 111)
RESEARCH TEAM Head Office: Lee Chung Cheng (ext 758) Lee Cherng Wee (ext 759) Norsyafina binti Mohamad Zubir (ext 753) Low Zy Jing (ext 754) Nazhatul Shaza Binti Shukor (ext755)
JF APEX SECURITIES - RESEARCH RECOMMENDATION FRAMEWORK
STOCK RECOMMENDATIONS
BUY : The stock’s total returns* are expected to exceed 10% within the next 12 months.
HOLD : The stock’s total returns* are expected to be within +10% to – 10% within the next 12 months.
SELL : The stock’s total returns* are expected to be below -10% within the next 12 months.
TRADING BUY : The stock’s total returns* are expected to exceed 10% within the next 3 months.
TRADING SELL : The stock’s total returns* are expected to be below -10% within the next 3 months.
SECTOR RECOMMENDATIONS
OVERWEIGHT : The industry as defined by the analyst is expected to exceed 10% within the next 12 months.
MARKETWEIGHT : The industry as defined by the analyst is expected to be within +10% to – 10% within the next 12 months.
UNDERWEIGHT : The industry as defined by the analyst, is expected to be below -10% within the next 12 months.
*capital gain + dividend yield
JF APEX SECURITIES BERHAD - DISCLAIMER
Disclaimer: The report is for internal and private circulation only and shall not be reproduced either in part or otherwise without the prior written consent of JF Apex Securities Berhad. The opinions and information contained herein are based on available data believed to be reliable. It is not to be construed as an offer, invitation or solicitation to buy or sell the securities covered by this report. Opinions, estimates and projections in this report constitute the current judgment of the author. They do not necessarily reflect the opinion of JF Apex Securities Berhad and are subject to change without notice. JF Apex Securities Berhad has no obligation to update, modify or amend this report or to otherwise notify a reader thereof in the event that any matter stated herein, or any opinion, projection, forecast or estimate set forth herein, changes or subsequently becomes inaccurate. JF Apex Securities Berhad does not warrant the accuracy of anything stated herein in any manner whatsoever and no reliance upon such statement by anyone shall give rise to any claim whatsoever against JF Apex Securities Berhad. JF Apex Securities Berhad may from time to time have an interest in the company mentioned by this report. This report may not be reproduced, copied or circulated without the prior written approval of JF Apex Securities Berhad.
Published & Printed by:
JF Apex Securities Berhad (47680-X) (A Participating Organisation of Bursa Malaysia Securities Berhad)