Vot. 79126 SYNTHESIS OF GOLD NANOPARTICLES … · SYNTHESIS OF GOLD NANOPARTICLES EMBEDDED WITH...
110
Vot. 79126 SYNTHESIS OF GOLD NANOPARTICLES EMBEDDED WITH POLYMERIC FOR APPLICATION AS NOVEL LABEL FOR BIOLOGICAL DIAGNOSTIC HADI NUR UNIVERSITI TEKNOLOGI MALAYSIA
-
Upload
phunghuong -
Category
Documents
-
view
232 -
download
1
Transcript of Vot. 79126 SYNTHESIS OF GOLD NANOPARTICLES … · SYNTHESIS OF GOLD NANOPARTICLES EMBEDDED WITH...

Vot. 79126
SYNTHESIS OF GOLD NANOPARTICLES EMBEDDED WITH POLYMERIC
FOR APPLICATION AS NOVEL LABEL FOR BIOLOGICAL DIAGNOSTIC
HADI NUR
UNIVERSITI TEKNOLOGI MALAYSIA

ii
UNIVERSITI TEKNOLOGI MALAYSIAUTM/RMC/F/0024 (1998)
BORANG PENGESAHANLAPORAN AKHIR PENYELIDIKAN
TAJUK PROJEK : SYNTHESIS OF GOLD NANOPARTICLES EMBEDDED ON POLYMERIC LAYER AS NOVEL FOR APPLICATION AS
Saya HADI NUR (HURUF BESAR)
Mengaku membenarkan Laporan Akhir Penyelidikan ini disimpan di Perpustakaan Universiti Teknologi Malaysia dengan syarat-syarat kegunaan seperti berikut :
1. Laporan Akhir Penyelidikan ini adalah hakmilik Universiti Teknologi Malaysia.
2. Perpustakaan Universiti Teknologi Malaysia dibenarkan membuat salinan untuktujuan rujukan sahaja.
3. Perpustakaan dibenarkan membuat penjualan salinan Laporan AkhirPenyelidikan ini bagi kategori TIDAK TERHAD.
4. * Sila tandakan ( / )
5.
SULIT (Mengandungi maklumat yang berdarjah keselamatan atauKepentingan Malaysia seperti yang termaktub di dalamAKTA RAHSIA RASMI 1972).
TERHAD (Mengandungi maklumat TERHAD yang telah ditentukan oleh Organisasi/badan di mana penyelidikan dijalankan).
TIDAKTERHAD
TANDATANGAN KETUA PENYELIDIK
Nama & Cop Ketua Penyelidik
Tarikh : _________________
v
CATATAN : * Jika Laporan Akhir Penyelidikan ini SULIT atau TERHAD, sila lampirkan surat daripada pihak berkuasa/organisasi berkenaan dengan menyatakan sekali sebab dan tempoh laporan ini perlu dikelaskan
Lampiran 20
ASSOC. PROF. DR. HADI NUR
1 SEPTEMBER 2009
LABEL FOR BIOLOGICAL DIAGNOSTICS

ACKNOWLEDGEMENTS
These acknowledgements must begin with the Ministry of Science,
Technology and Innovation (MOSTI) for allowing grant to this project through Science
Fund funding No. 03-01-06-SF0326 (Vot. 79126). I am particularly grateful
to the Research Management Center (RMC), UTM for infrastructure, facilities and
technical support.
Innumerable thanks go to Prof. Dr. Salasiah Endud, Associate Prof. Dr.
Zainab Ramli, Ms. Sasha M. Nasir and Mr. Lim Kheng Wei for their valuable contri-
butions. I wish to express my sincerest appreciation to Ibnu Sina Institute for
Fundamental Science Studies for research facilities.
Assoc. Prof. Dr. Hadi NurProject Leader
iii

ABSTRACT
In this study, a method for synthesizing polyvinyl alcohol (PVA) embedded gold film is presented. This approach takes advantage of the high affinity of thiol molecules towards gold. Gold particles, in the size range of 20 to 180 nm, were first prepared by the conventional Turkevitch method by the reduction of gold, tetrachloroauric acid (HAuCl4) with sodium citrate in water. The Ultraviolet-Visible (UV-Vis) absorption spectra and dark-field microscopy confirmed the presence of a surface plasmon resonance (SPR), attributed to the nanosized gold particles. The resultant gold particles of sizes as low as 27 nm with nearly spherical in shape were achieved as determined by Transmission Electron Microscopy (TEM) and Field Emission Electron Microscopy (FESEM). In the preparation of PVA embedded gold (PVA-Gold) film, PVA was functionalized with (3-mercaptopropyl) trimethoxysilane (MPTMS) which produced a thiol functionality on the surface. Then, gold particles were chemisorbed onto the surface of partially dried thiol functionalized PVA to produce PVA-Gold composite. The composite materials were characterized using Fourier transform infrared spectroscopy (FTIR), FESEM, TEM and UV-Vis diffuse reflectance (UV-Vis DR) spectroscopy. The TEM results showed that the gold particles embedded on the surface of PVA were polydispersed with the average particle size from 30 nm to 150 nm. The catalytic potential of PVA-Gold for oxidation reaction has been investigated in the liquid phase oxidation of styrene with aqueous tert-butyl hydroperoxide and the results were analyzed by gas chromatography (GC) and gas chromatography-mass spectrometry (GC-MS). PVA-Gold were found to be highly active catalyst (95% conversion of styrene) and selective towards the oxidation of styrene to give benzaldehyde (73%) as the main product. Moreover, PVA-Gold also showed a very good regenerability in the repeated oxidation of styrene. The unique optical properties of PVA-Gold were also exploited in the interactions with several amino acids such as L-Arginine (Arg), L-Proline (Pro), L-Tryptophan (Trp) and L-Tyrosine (Tyr). The UV-Vis DR demonstrated that the SPR peaks for the amino acid – PVA-Gold conjugates were relatively shifted towards longer wavelength as evidence of a successful functionalization of gold with the amine groups of amino acid. The above findings suggest that PVA-Gold have potential application as heterogeneous oxidation catalyst and can be explored as probes for biosensing application.
iv

KEY RESEARCHERS
Assoc. Prof. Dr. Hadi Nur
Assoc. Prof. Dr. Zainab Ramli
Ms. Saha M. Nasir
Mr. Lim Kheng Wei
Email : [email protected]
Tel. No. : 07-5536077
Vot No. : 79126
v

vi
ABSTRAK
Dalam kajian ini, suatu kaedah bagi mensintesis filem polivinil alkohol (PVA) mengandung emas dilaporkan. Kaedah ini, mempergunakan sifat saling tarik molekul tiol yang kuat terhadap emas. Partikel emas, bersaiz dalam julat 20 nm – 180 nm, pertamanya disediakan menurut kaedah konvensional Turkevitch secara penurunan emas, asid tetrakloroaurik (HAuCl4) dengan natrium sitrat di dalam air. Spektrum serapan ultralembayung-nampak (UV-Vis) dan mikroskopi medan gelap menunjukkan terdapat bukti plasmon resonans permukaan (SPR) yang disebabkan oleh partikel emas bersaiz nano. Partikel emas yang diperolehi bersaiz paling kecil 27 nm dan hampir berbentuk sfera seperti yang diperlihatkan oleh mikroskopi elektron pancaran (TEM) dan mikroskopi elektron pengimbasan pancaran medan (FESEM). Dalam penyediaan filem PVA bertatahkan emas (PVA-Emas), PVA telah difungsikan dengan (3-merkaptopropil) trimetoksisilana (MPTMS) bagi melekatkan kumpulan berfungsi tiol pada permukaannya. Kemudian, partikel emas dijerap kimia pada permukaan separa kering PVA berfungsikan tiol untuk seterusnya menghasilkan komposit PVA-Emas. Bahan komposit tersebut telah dicirikan dengan spektroskopi inframerah transformasi Fourier (FTIR), FESEM, TEM dan spektroskopi pemantulan difusi ultralembayung-nampak (UV–Vis DR). Keputusan daripada TEM menunjukkan partikel emas terpahat pada permukaan PVA secara berserakan dengan purata saiz partikel di antara 30 nm hingga 150 nm. Keupayaan emas sebagai mangkin bagi tindak balas pengoksidaan dikaji dalam pengoksidaan stirena dengan tert-butil hidroperoksida (TBHP) dalam fasa cecair dan hasil tindak balas tersebut telah dianalisis menggunakan kromatografi gas (GC) dan kromatografi gas-spektrometri jisim (GC-MS). PVA-Emas didapati mangkin yang sangat aktif (95% penukaran stirena) dan selektif terhadap pengoksidaan stirena kepada benzaldehid (73%), sebagai hasil utama. Tambahan lagi, PVA-Emas memperlihatkan kebolehulangan yang sangat baik bagi pengoksidaan stirena. Sifat optik emas yang unik telah dieksploitasikan dalam interaksinya dengan beberapa amino asid seperti L-Arginine (Arg), L-Proline (Pro), L-Tryptophan (Trp) dan L-Tyrosine (Tyr). Spektrum UV-Vis DR menunjukkan puncak SPR bagi konjugat amino asid-PVA Emas telah beranjak kepada nombor gelombang yang lebih tinggi secara relatif menjadi bukti bahawa emas telah difungsikan dengan kumpulan amina dalam amino asid dengan jayanya. Keputusan kajian yang di atas menunjukkan tanda-tanda bahawa PVA-Emas berpotensi diaplikasikan sebagai mangkin pengoksidaan heterogen dan berguna sebagai prob dalam aplikasi biosensor.

vii
PENYELIDIK UTAMA
Assoc. Prof. Dr. Hadi Nur
Assoc. Prof. Dr. Zainab Ramli
Cik Saha M. Nasir
En. Lim Kheng Wei
Email : [email protected]
Tel. No. : 07-5536077
Vot No. : 79126

viii
TABLE OF CONTENTS
CHAPTER TITLE PAGE
TITLE
STATEMENT
ACKNOWLEDGEMENTS
ABSTRACT
KEY RESEARCHERS
ABSTRAK
PENYELIDIK UTAMA
TABLE OF CONTENTS
LIST OF TABLES
LIST OF FIGURES
LIST OF ABBREVIATIONS
LIST OF APPENDICES
i
ii
iii
iv
v
vi
vii
viii
xi
xii
xiv
xvi
1 INTRODUCTION
1.1 Research Background 1
1.2 Problem Statement 4
1.3 Research Objectives 7
1.4 Scope of Study 8
2 LITERATURE REVIEW
2.1 Historic Introduction of Gold Nanoparticles 9
2.2 Wet Chemical Synthesis of Gold Nanoparticles 11
2.2.1 Turkevitch Method 12

ix
2.2.2 Brust-Schiffrin Method 12
2.2.3 Seed Mediated Growth Method 13
2.3 Important Properties of Gold Nanoparticles 14
2.3.1 Absorption Properties 14
2.3.2 Scattering Properties 16
2.4 Polymers as Support 18
2.4.1 PVA Composite using Sol-Gel Process 18
2.4.2 Polymers as Support for Gold 20
2.5 Gold Catalysis 22
2.6 Gold Nanoparticles in Biosensors 23
3 EXPERIMENTAL
3.1 Chemicals 25
3.2 Synthesis of Gold Nanoparticles in Different 25
Sizes and Shapes
3.2.1 Synthesis of 20 nm Gold Nanoparticles 26
3.2.2 Synthesis of 30 nm to 180 nm 27
Gold Nanoparticles
3.3 Preparation of PVA Embedded Gold Film 28
(PVA-Gold)
3.4 Catalytic Oxidation Reactions 29
3.4.1 Catalytic Activity of PVA-Gold Film 29
3.4.2 Reusability of the Catalyst 29
3.5 Interactions of PVA-Gold Film with Amino Acids 30
3.6 Characterization Techniques 30
3.6.1 Ultraviolet-Visible Spectroscopy (UV-Vis) 31
3.6.2 Optical Imaging of Gold Nanoparticles 32
3.6.3 Field Emission Scanning 33
Electron Microscopy (FESEM)

x
3.6.4 Transmission Electron Microscopy (TEM) 34
3.6.5 Attenuated Total Reflectance (ATR) 35
3.6.6 Ultraviolet-Visible Diffuse Reflectance 36
Spectroscopy (UV-Vis DR)
3.6.7 Gas Chromatography (GC) 37
3.6.8 Gas Chromatography-Mass Spectrometry 38
(GC-MS)
4 RESULTS AND DISCUSSION
4.1 Optical Properties of Gold Nanoparticles 39
4.2 Surface Morphology of Gold Nanoparticles 44
4.3 PVA-Gold Film Characterization 46
4.3.1 FTIR Spectra of PVA-Gold Film 46
4.3.2 UV-Vis DR of PVA-Gold Film 49
4.3.3 FESEM of PVA-Gold Film 50
4.3.4 TEM of PVA-Gold Film 52
4.4 Catalytic Activity of PVA-Gold Film 53
4.5 Interaction of PVA-Gold Film with 56
Amino Acids
5 CONCLUSIONS AND RECOMMENDATIONS
5.1 Conclusions 59
5.2 Future Work 61
REFERENCES 62
APPENDICES 74
PUBLICATIONS

xi
LIST OF TABLES
TABLE NO. TITLE PAGE
3.1 Approximate amount of citrate and the corresponding sizes of nanoparticles for samples S2 – S6.
28
4.1 The catalytic activity of PVA-Gold film during the catalyst reuse in the oxidation of styrene.
55

xii
LIST OF FIGURES
FIGURE NO. TITLE PAGE
1.1 Schematic representation of the proposed gold nanoparticles embedded in the surface of polymer: (a) gold nanoparticles attached on the surface of the polymer layer by chemisorption, (b) gold nanoparticles embedded in the polymer layer by attachment of nanoparticles on the surface of partially dried functionalized polymeric layer.
6
2.1 The Lycurgus Cup (4 th Century B.C.) is ruby red in transmitted light and green in reflected light, due to the presence of gold colloids.
10
2.2 Formation of gold nanoparticles coated with organic shells by reduction of Au(III) compounds in the presence of thiols.
13
2.3 Formation of surface charges on a metal particle by the electric field of light.
14
2.4 Strong absorption band around 520 nm in the spectrum is the origin of the observed colour of the nanoparticle solution.
16
2.5 Under a microscope with white light illumination, (a) 58 and (b) 78 nm gold particles have the appearance of highly fluorescent green and yellowish particles, respectively.
17
2.6 Chemical structure of PVA.
22
3.1 Synthesis of 20 nm gold nanoparticles.
26
3.2 Synthesis of gold nanoparticles of different sizes.
27

xiii
4.1 Electrostatic repulsion keeps the particles separate.
40
4.2(a) Absorption spectra of gold nanoparticle solutions for samples S1-S6.
41
4.2(b) Photographs of colloidal dispersions of gold nanoparticles with increasing size for samples S1-S6.
42
4.3 Representative photograph of gold nanoparticles viewed under optical microscope. The different colours corresponds to different shape of the particles.
43
4.4 FESEM images of gold nanoparticles prepared from different concentration of citrate. Images (a) – (f) correspond to samples S1 – S6. The inset in images (a) – (f) shows the TEM images of gold nanoparticles.
45
4.5 FTIR spectra of (a) control PVA film, (b) PVA-MPTMS film prepared under acid condition and (c) PVA-Gold film.
48
4.6 UV-Vis DR spectra of (a) PVA-MPTMS film prepared under acid condition and (b) PVA-Gold film.
49
4.7 FESEM micrograph of (a) PVA film, (b) PVA-MPTMS film, and (c) PVA-Gold film.
51
4.8 TEM micrograph of PVA-Gold film.
52
4.9 Schematic representation of the oxidation of styrene.
53
4.10 The conversion and product selectivity of the oxidation of styrene with tert-butyl hydroperoxide using PVA-MPTMS and PVA-Gold as catalyst.
54
4.11 Chemical structure of various amino acids.
56
4.12 UV-Vis DR spectra of PVA-Gold film before (a) and after interaction with amino acids; (b) Pro, (c) Trp (d) Tyr and (e) Arg.
58

xiv
LIST OF ABBREVIATIONS
% - Percentage
wt %. - Percentage of weight
° - Degree
°C - Degree Celsius
?max wavelength of maximum absorbance
atm - atmospheric pressure
ATR - Attenuated total reflectance
Au - Aurum (gold)
cm - centimeter
cm2 - centimeter squared
DNA - Deoxyribonucleic acid
E° Electrode potential
FESEM - Field emission scanning electron microscopy
FTIR - Fourier transform infrared
g - Gram
GC - Gas chromatography
GC-MS - Gas chromatography with mass spectrometry
HAuCl4 - Hydrogen tetrachloroaurate
HCl - Hydrochloric acid
HNO3 - Nitric Acid
L - Liter
M - Molar
mL - milliliter
µL - microliter
xv
µm - micrometer
mm - millimeter
MPTMS - (3-mercaptopropyl) trimethoxysilane
nm - Nanometer
SO2 - Sulfur dioxide
SPR - Surface plasmon resonance
TBHP - tert-butyl hydroperoxide
UV - Ultraviolet
UV-Vis - Ultraviolet-visible
UV-Vis DR - Ultraviolet-visible diffuse reflectance spectroscopy

xvi
LIST OF APPENDICES
APPENDIX TITLE PAGE
A Chemical reagents for synthesis of gold nanoparticles and chemical reagents for synthesis of PVA-Gold.
74
B Chemical reagents for catalytic testing and chemical reagents for interactions with amino acids.
75
C Calculation of % Conversion and % Selectivity. 76
D GC chromatogram of oxidation of styrene with TBHP at 70º C for 3 hours.
77
E GC chromatogram of oxidation of styrene with TBHP at 70º C for more than 24 hours.
78

CHAPTER 1
INTRODUCTION
1.1 Research Background
Nanoparticles can be defined as particles with at least one of their three-
dimensional sizes in the range of 1 – 100 nm. Recent intense interest in nanoparticles
stems from the fact that nanoparticles exhibit unique properties compared to their bulk
counterparts. Many of these properties including physical, chemical, optical, electrical
and magnetic can be controlled by relatively simple tuning of their sizes, shapes,
compositions, protecting ligands and interparticle distance. To date, the most widely
studied nanoparticles have been those of metals, semiconductors and magnetic materials
due to the potential applications of these materials in optoelectronics, catalysis,
reprography, and other areas [1]. However, among these metallic particles, gold
nanoparticles stand out in particular due to their associated strong surface plasmon
resonance (SPR). Surface plasmon was found to be dependent not only on the size of the
gold nanoparticles but on their shape as well [2]. The SPR absorption and other unique
properties resulting from the small gold particle size can be exploited in a wide range of

2
sensing applications such as bioimaging [3-5], chemical and biological sensing [6, 7]
and colorimetric assays for DNA detection [8, 9].
It was demonstrated that gold nanoparticles could readily bind thiol, amine,
cyanide, diphenylphosphine functional groups [10-13]. Amino acids, which is a
constituent of proteins, are considered as suitable agents in the biofunctionalization of
gold nanoparticles due to the presence of different functional groups, such as –SH and
–NH2, with affinity for gold. Generally, amino acids can be adsorbed on the gold particle
surface during the formation of particles, using amino acid itself as a reducing agent [14-
16], or in the latter stage, by ligand exchange reactions or binding on the former
adsorbed stabilizing molecules [17]. Most applications of gold nanoparticles as sensors
are based on detecting the shifts in the SPR peak, due to either the change in the local
dielectric constant of the nanoparticles resulting from adsorbed biomolecules or due to
biomolecule induced agglomeration of the nanoparticles [18].
Gold in the bulk is chemically inert and has often been regarded to be poorly
active as a catalyst. However, when the dimension of gold is reduced below ~10 nm, it
turns out to be surprisingly active for many reactions such as CO oxidation, especially at
low temperatures as first discovered by Haruta [19]. The catalytic activity of both
heterogeneous and homogeneous gold based catalyst is now well established in different
processes: selective or complete oxidation, hydrochlorination, and hydrogenation
reactions [20]. All of these applications show the special reactivity of gold compared
with platinum group metals and this may be explained in terms of the electronic states
(+1, +3) and the high electrode potential of gold (Eº = +1.69 V).
Nanoparticles have a tendency to aggregate and are difficult to recover from
reactions due to their small size. Therefore, in order to overcome these difficulties, it is
necessary to immobilize the gold nanoparticles onto a matrix material such as polymers
because the immobilized nanoparticles are more stable. The principle advantages of the
method are that the resulting materials are easily prepared in a single-step procedure and
the possibility to control the thickness of the polymeric layer. These materials also

3
possess the processing and handling advantages of bulk materials. Other benefits of
immobilizing nanoparticles in polymeric matrices include increased stability, improved
processability, recyclability, and solubility in a variety of organic solvents. Among
polymers, polyvinyl alcohol (PVA) is a commercially important water soluble polymer
which is known to be a good stabilizer of noble metal particles. PVA is also the most
important material for the dehydration of organic mixtures owing to its good chemical
stability, film forming ability and high hydrophilicity [21]. Other polymers commonly
used for the stabilization of gold nanoparticles are poly(1-vinylpyrrolidone) and
poly(ethylene glycol) [22]. In the case of heterogeneous catalysis, the catalytic
properties of gold were shown to depend strongly on the support, the preparation
method, and particularly the size of the gold particles [23, 24].

4
1.2 Problem Statement
Gold nanoparticles hold a particular interest to those in the biological sciences
because they are on the same size scale as biological macromolecules, proteins and
nucleic acids. The interactions between biomolecules and nanomaterials have formed the
basis for a number of applications including detection, biosensing, cellular and in-situ
hybridisation labelling, cell tagging and sorting, point-of-care diagnostics, kinetic and
binding studies, imaging enhancers, and even as potential therapeutic agents.
Recently, it has been reported that the scattering property of gold nanoparticle
could be harnessed in a living cell to make cancer detection easier [25, 26]. What makes
the approach so promising is that the method was simple, employing only inexpensive
microscope and white light. However, the method used was not practical because in the
above method, the gold nanoparticles were in solution form such that it could not be
recovered and reused. In this research, we investigated the feasibility of immobilizing
gold nanoparticles (and also their conjugates) in polymer film without degradation of
their SPR properties.
The catalysis by metal nanoparticles is one of the most important and attractive
research owing to an increase in exposed surface area and to a possibility of finding
novel properties generated by quantum size effect [27]. The use of homogeneous gold
catalyst could be unfavourable in practical applications as the separation and reuse of the
catalyst after reaction would be problematic. Most studies on gold catalysts have been
focused on gold oxide supports as these catalytic systems are mostly used for gas-phase
oxidation. However, as recently reported, gold catalysts also represent a useful
alternative to platinum group metals systems for liquid phase oxidation [28]. In this case,
the presence of a solvent such as water dramatically affects the interaction between the
reagent and the catalytically active materials. In particular, gold on polymer shows
superior selectivity and is much less affected by poisoning, when compared with
classical palladium and platinum catalysts. As poisoning represents one of the major

5
drawbacks limiting industrial application in liquid phase oxidation involving oxygen as
the oxidant, the advantage of using a gold catalyst may not be of only academic interest
but could also have industrial potential. As a consequence, there is a growing need for a
general procedure to prepare gold catalysts with high dispersion, regardless of the
polymer support used.
Despite a large number of methods reported to immobilize gold nanoparticle in
polymer film, it is still desirous to develop a simple and effective synthesis of such
nanoparticles with better size control and uniform particle distribution. Nevertheless, the
difficult handling of these extremely fine particles has posed a strong limitation to their
use. Most metal nanoparticles are very unstable. They can aggregate because of the high
surface free energy and readily oxidized-contaminated by air, moisture, sulfur dioxide
(SO2) and so on. Therefore, the embedding of gold nanoparticles in a polymer surface
represents a valid solution to the manipulation and stabilization problems. Furthermore,
polymer embedding represents a straightforward but effective way to use the mesoscopic
properties of metal nanoparticles.
Previous studies reported that the immobilization of gold nanoparticles on
polymeric surfaces or substrates involved the immersion of the functionalized surface
such as thiol functionalized polymer in gold solutions [20] followed by drying.
However, this method is not practical as the gold nanoparticles attached to the surface
may be easily detached since they are only linked to the functionalized polymeric
surface via chemisorption so that the particle-to-surface contact area is too small to
allow a strong attachment. Our approach is different compared to the previous study as
the gold nanoparticles are annealed on the surface of partially dried functionalized (3-
mercaptopropyl) trimethoxysilane (MPTMS) polymeric layer. Thus, the gold
nanoparticles are not only linked to the functional groups on the polymer surface but are
actually embedded in the polymer layer which enhanced the particle-to-surface contact
area between gold nanoparticles and PVA film, making it more difficult for the
detachment of the gold nanoparticles as presented schematically in Figure 1.1.

6
• Gold nanoparticles embedded in the surface of polymer with high interfacial interaction
Our Proposed Design
Previous Design (a)
• Gold nanoparticles attached on the surface of polymer with low interfacial interaction
(b)
Figure 1.1: Schematic representation of the proposed gold nanoparticles embedded in
the surface of polymer: (a) gold nanoparticles attached on the surface of the polymer layer by chemisorption, (b) gold nanoparticles embedded in the polymer layer by attachment of nanoparticles on the surface of partially dried functionalized polymeric layer.

7
1.3 Research Objectives
The objectives of the study are:
(1) To synthesize gold nanoparticles using the Turkevitch method via the reduction
of HAuCl4 with sodium citrate in water.
(2) To incorporate gold nanoparticles on the surface of functionalized PVA with a
high particle-to-surface contact area between them.
(3) To investigate the catalytic activity of the gold nanoparticles embedded on PVA
for liquid phase oxidation of styrene.
(4) To investigate the structural and morphological properties of the gold
nanoparticles embedded on PVA in the interactions with amino acids.

8
1.4 Scope of Study
In this research, the gold nanoparticles will be synthesized by the reduction of Au
(III) ions with citrate in water, a process pioneered by Turkevitch [30] in 1951 and later
refined by Frens [31]. In this method, citrate serves as both reducing agent and an
anionic stabilizer. It yields uniform and almost spherical particles with diameters
ranging from a few to approximately 150 nm. The size of the resulting colloidal gold
nanoparticles, whose surfaces are negatively charged with citrate, is controlled by the
molar ratio of HAuCl4 / sodium citrate (the lower the ratio, the smaller the particle size).
The produced gold nanoparticles will be studied on its surface morphology and physical
properties especially related to its SPR absorption and scattering properties.
Then, the stable incorporation of gold nanoparticles on the surface of polymeric
layer, such as PVA, will be achieved by using MPTMS as a linker molecule which has
the ability to react with the functional groups of the polymeric layer [32]. The catalytic
activity of gold nanoparticles embedded on PVA (PVA-Gold) was investigated for the
oxidation of styrene and the biosensing capability of PVA-Gold were studied on the
interactions with various amino acids.
CHAPTER 2
LITERATURE REVIEW
2.1 Historic Introduction of Gold Nanoparticles
The history of metal particles is a long and illustrious one, going back to the
dawn of civilization, at least some 5000 years. The extraction of gold started in the 5th
millennium B.C. near Varna (Bulgaria). Gold at that time was mainly used in medicine
for its magico-religious powers and played almost no role in rational therapeutics until
late Middle Age. It was not until Geber (pseudonym for Islamic alchemist Jabir Ibn
Hayyan) prepared aqua regia (a mixture of hydrochloric and nitric acid) which is able to
dissolve gold in the 5th or 4th century B.C. that gold was becoming more important for
medicine. Gold particles have found their way into glasses for over 2000 years, usually
as nanoparticles and have most frequently been employed to give stained glass its
brilliant ruby colour used in churches in the 17th century. The most famous example of
colloidal gold used in glass is the Roman Lycurgus Cup that was manufactured in the 5 th
or 4th century B.C. The Lycurgus Cup [33] reflects green light and transmit ruby red
light due to the presence of gold colloids as shown in Figure 2.1

10
Figure 2.1 The Lycurgus Cup (4th Century B.C.) is ruby red in transmitted light and green in reflected light, due to the presence of gold colloids [33].
In 1685 Andreas Cassius and Johan Knuckel described a mixture of tin oxide and
gold that was found to have an intense purple colour, a royal purple colour in fact and
this “Purple of Cassius” was used to colour glasses and even garments. The preparation
involved the reduction of gold salts by Sn(II) present in the tin oxide to form small
impregnated gold particles [34]. The actual purple colour may have been due to the
agglomerated state of the gold nanoparticles, but may equally have been caused by the
high refractive index of the tin oxide.
The first so-called “scientific” study of gold particles took place in 1857, when
Michael Faraday investigated the ruby red colloids of gold. Faraday prepared the first
stable suspension of gold colloids by reducing gold chloride with phosphorus in CS2 (a
two phase system) and announced that the colour was due to small size of the metal
particles and was not attributable to some peculiar state of the gold metal [35].
A milestone in the development of metal particles science was Mie’s theoretical
considerations of the colours of colloidal metals, and in particular those of gold. In 1908,

11
Mie presented a solution to Maxwell’s equations for the absorption and scattering of
electromagnetic radiation by spherical metallic particles. This theory has been used to
calculate the spectra of particles smaller than the wavelength of light for nanoparticles
whose metallic dielectric function is known and which are embedded in an environment
of known dielectric constant [36]. Since Mie’s work, numerous researches have
investigated the properties of metal particles because of their unusual optical properties.
2.2 Wet Chemical Synthesis of Gold Nanoparticles
A variety of methods have been demonstrated for preparing gold nanoparticles
which display different characteristics of the final product. A simple and effective
method is a wet colloidal chemical synthesis technique, which allows one to
conveniently control the size and distribution of the nanoparticles. Essentially, solutions
of various precursors are mixed in well-defined quantities and under controlled
conditions such as reagent and additive concentrations, solvent polarity and viscosity,
temperature and pH to promote the formation of colloidal dispersions or insoluble
compounds which precipitates out of solution. The advantage of wet chemical processes
is that a large variety of compounds can be fabricated on essentially cheap equipment
and in significant quantities.
There are mainly two approaches to the production of metal nanoparticles by wet
chemical methods: direct synthesis or a seeding growth method. For gold nanoparticles,
direct synthesis can be categorized in two ways: the Turkevitch method [30] and the
Brust-Schiffrin method [37, 38].

12
2.2.1 Turkevitch method
The most popular method of preparing aqueous suspensions of gold
nanoparticles is based on the reduction of HAuCl4 by citrate in water, which was first
described by Turkevitch et al. [30] in 1951 and is now commonly referred to as the
“Turkevitch method”. Citrate is known as one of the most widely used reagents to
prepare gold nanoparticles. In this method, citrate serves as both a reducing agent and an
anionic stabilizer. Initially, the citrate reduces Au(III) ions to Au(0) and later acts as the
stabilizing agent by forming a layer of citrate ions over the gold nanoparticles surface,
inducing sufficient electrostatic repulsion between individual particles to keep them
from agglomerating. The Turkevitch method was later refined by Frens [31] which
produces almost spherical particles over a tunable range of sizes from 15 to 150 nm by
varying the ratio of gold salt to citrate concentration in the medium. This method is often
used when a rather loose shell of ligands is required around the gold core in order to
prepare a precursor to valuable gold nanoparticles based materials.
2.2.2 Brust-Schiffrin Method
The facile two phase synthesis method reported by Brust et al. was path breaking
because it opened an entirely new route to understanding the stability, reactivity and
self-assembly of metallic particles in non polar media. The Brust method (Figure 2.2)
utilizes borohydride reduction of gold salts in the presence of an alkanethiol capping
agent in a one step, two phase process involving organic solvents to produce smaller
gold clusters (1 - 5 nm) [38]. Gold nanoparticles synthesized using this method offer
excellent control and uniformity of size and can be dried and re-dispersed easily, since
the protective capping agent is chemically bound by covalent bond to the surface of the

13
metal nanoparticle. Moreover, the gold nanoparticles are extremely soluble and
resoluble in organic media such as hexane or toluene. However, the organic solvents
used in these techniques render them unsuitable for solution based biosensors of
biomolecules like proteins and saccharides. Later, Leff et. al further reported the
synthesis of gold nanoparticles with diameters ranging from 1.5 to 20 nm by varying the
Au(III) ion to stabilizer thiol molar ratio [39].
Figure 2.2: Formation of gold nanoparticles coated with organic shells by reduction of Au(III) compounds in the presence of thiols [40].
2.2.3 Seed Mediated Growth Method
Seed-mediated growth is another technique frequently used in producing
spherical nanoparticles of different sizes. The central concept of this technique is that
small nanoparticle seeds serve as nucleation centers to grow nanoparticles to a desired
size. Hydroxylamine and ascorbic acid are common reducing agents used in seeding
Au
S S S
S S
S S
S
NaBH4
SH
HAuCl4

14
growth of gold nanoparticles. The particle size can be controlled by varying the ratios of
gold salt to seeds concentration. However, this method produces a certain percentage of
non spherical byproducts such as nanorods, triangles and hexagonal nanoplates which
cannot be efficiently separated from the spherical ones. Jana et. al have demonstrated a
seeding growth approach to prepare gold nanoparticles 5 – 40 nm in diameter with a
very narrow size distribution. In addition, the particle sizes can be easily manipulated by
varying the ratio of seed to metal salt [41].
2.3 Important Properties of Gold Nanoparticles
2.3.1 Absorption Properties
Spherical gold nanoparticles characteristically exhibit a single strong absorption
band that is not present in the spectrum of the bulk gold. The surface plasmon resonance
(SPR) of metal particles is based on the confined electron gas of the particles: the
surface electrons are oscillating with respect to the positive metal core (Figure 2.3).
Figure 2.3: Formation of surface charges on a metal particle by the electric field of light.
++ +
+
_ _
_
_
light
electric field
surface charges

15
When the size of noble metals is reduced to the nanometer scale, the electrons
near or at the surface become loose compared with those inside the core. Thus, when
they interact with an incoming light wave, the electrons in the conduction band begin to
polarize to one side of the surface by the action of the electric field of the wave. As the
wave keeps oscillating between (+) and (-) (in respect to the direction of the arbitrary
coordination scale), the polarized electrons also begin to oscillate from one side of the
surface (of the nanoparticle) to the other side. Diffusion of the nanoparticle (Brownian
motion) is so much slower than the frequency of the light wave that the nanoparticle can
be assumed to be fixed at its position, which means that this is a collective motion.
When the frequency of the electric field of the incoming light wave becomes comparable
to the oscillation frequency of this electron motion, very strong absorption is induced in
this region. This is surface plasmon resonance absorption.
Due to the excitation of plasmon resonances in the electron gas by visible light,
nanoparticles of numerous transition metals show intensive absorption maxima in the
UV-Visible spectra [42]. For instance, gold nanoparticles of 20 nm in diameter exhibit
plasmon resonances at 520 nm as shown in Figure 2.4. Besides that, the many distinctive
colours of nanoparticle colloids of noble, alkali, alkaline earth and rare earth metals may
be attributed to the presence of this surface plasmon absorption band. These absorption
phenomena are quantitatively described by the Mie theory [36], in which the theoretical
absorption spectrum of dilute spherical particles is related to their size and relative
dielectric properties compared to the surrounding medium.

16
Figure 2.4: Strong absorption band around 520 nm in the spectrum is the origin of the
observed red colour of the nanoparticle solution.
2.3.2 Scattering Properties
When a metallic nanoparticle is exposed to an electromagnetic wave, the
electrons in the metal (plasmons) oscillate at the same frequency as the incident wave.
Then, the oscillating electrons radiate electromagnetic radiation with the same frequency
as the oscillating electrons. It is this secondary radiation of light at the same incident
wavelength which forms the scattered light. The light-scattering properties of a particle
depend on composition, size, shape, homogeneity and bathing medium refractive index
[43].
Metallic particles such as gold and silver have a very high light-scattering power,
which allows these particles to be easily detected, by light-scattering, at particle
520 nm
Wavelength (nm)
Ab
sorb
ance

17
concentrations as low as 10-16 M. The scattered light by individual particles can be
detected under low magnification (x100 total magnification) by using a simple, low-cost,
and easy to use light microscope with an appropriate illuminating system. Juan
Yguerabide and Evangelina E. Yguerabide [44, 45] observed that light-scattering of
submicroscopic particles such as gold particles has the same appearance as fluorescent
solutions when illuminated by a beam of white light. Gold nanoparticles of 58 nm in
diameter scatter green light while gold particles with 78 nm scatter yellow light as
shown in Figure 2.5.
Figure 2.5: Under a microscope with white light illumination, (a) 58 and (b) 78 nm
gold particles have the appearance of highly fluorescent green and yellowish particles, respectively [44].
(a)
(b)

18
2.4 Polymers as Support
2.4.1 PVA Composite using Sol-Gel Process
An attempt has been made to prepare hybrid materials by using an organic
polymer and an inorganic phase via synthesis of the alkoxysilyl containing precursors.
Organic-inorganic hybrids are materials in which organic and inorganic components
interpenetrate each other in nanometer scale and both form percolated three-dimensional
networks commonly by sol-gel processing.
Previous studies have shown that introducing inorganic component derived from
Si-containing precursor into an organic polymer can form a homogeneous
nanocomposite membrane with enhanced physico-chemical stability and separation
performance [46]. It is well known that silane-coupling agents, ((R’)n – Si – (OR)4-n) are
usually utilized directly as inorganic precursors for sol-gel process [47]. During sol-gel
process, alkoxy groups (R) hydrolyze in the presence of water, and then formed
inorganic silica particles and organic polymer through condensation reactions. In
addition, the organic group R’ containing hydrophilic and hydrophobic functional
groups such as − NH3, H2C = CH −, −SH groups provides the nanocomposite membrane
with different properties.
Sol-gel processing is a wet chemical route for the synthesis of colloidal
dispersions of inorganic and organic-inorganic hybrid materials, particularly oxides and
oxide-based hybrids. The process allows high-purity, high homogeneity nanoscale
materials to be synthesized at lower temperatures compared to competing high-
temperature methods. A significant advantage that sol-gel science affords over more
conventional materials processing routes is the mild conditions that the approach
employs.

19
Two main routes and chemical classes of precursors have been used for sol-gel
processing:
1. The inorganic route (“colloidal route”), which uses metal salts in aqueous
solution (chloride, oxychloride nitrate) as raw materials. This are generally less
costly and easier to handle but their reactions are more difficult to control and the
surfactant that is required by the process might interfere later in the downstream
manufacturing and end use.
2. The metal-organic route (“alkoxide route”) in organic solvents. This route
typically employs metal alkoxides M(OR)Z as the starting materials, where M is
Si, Ti, Zr, Al, Sn or Ce; OR is an alkoxy group, and Z is the valence or the
oxidation state of the metal. Metal alkoxides are preferred due to their
commercial availability. The selection of appropriate OR groups (bulky,
functional, fluorinated) allows developers to fine tune properties. Other
precursors are metal diketones and metal carboxylates. A larger range of mixed
metal nanoparticles can be produced in mild conditions, often at room
temperature, by mixing metal alkoxides (or oxoalkoxies) and other oxide
precursors.
In general, the sol-gel process consists of the following five steps: sol formation,
gelling, shape forming, drying and densification. After mixing of the reactants, the
organic and inorganic precursors undergo two chemical reactions, hydrolysis and
condensation polymerization, typically with an acid or base as a catalyst, to form small
solid particles or clusters in a liquid (either organic or aqueous solvent). The resulting
solid particles or clusters are so small (1 – 1000 nm) that gravitational forces are
negligible and interactions are dominated by van der Waals, columbic and steric forces.
The sols-colloidal suspensions of oxide particles – are stabilized by an electrical double
layer, or steric repulsion, or a combination of both. Over time, the colloidal particles are
link together by further condensation and a dimensional network occurs. As gelling
proceeds, the viscosity of the solution increases dramatically. The sol-gel can then be

20
formed into three different shapes: thin film, fiber and bulk. Thin (100 nm or so)
uniform and crack-free films can be readily formed on various materials by lowering,
dipping, spinning or spray coating techniques.
Bandyopadhyay et al. had illustrated that transparent materials can be obtained
by the preparation of PVA/silica organic inorganic hybrid composites by using sol-gel
technique and tetraethoxysilane as the precursor for silica [48]. Likewise, Ruili Guo et
al. studied the incorporation of silica particles into PVA matrix to prepare PVA-silica
nanocomposite by in-situ sol gel reaction of MPTMS within PVA [49]. MPTMS had
been used as a derivatization reagent to anchor a colloidal gold monolayer to a
hyhydroxide rich suface [23].
2.4.2 Polymer as Support for Gold
The embedding of nanoscopic metal structures in polymeric matrices represents
the simplest way to protect clusters and take advantage of their physical characteristics.
Wolgang et al. reported the selective immobilization of gold nanoparticles on a
photoreactive polymer, poly(styrene-co-4-vinylbenzyl thiocyanate)(PS-co-VBT). The
gold nanoparticles were attached to the areas of polymers which had previously been
illuminated with UV and modified with 2-aminoethanethiol [50]. Corbierre et al.
described the synthesis of novel gold nanoparticles decorated with covalently bound
thiol capped polystyrene macromolecules and their incorporation in a polystyrene matrix
[51-53]. They speculated that gold nanoparticles whose polymer ligand is chemically the
same as the matrix would be more thermodynamically favorable in their incorporation.
Polymer embedded metal clusters can be obtained by two different approaches;
the direct, in-situ formation of nanoparticles within the matrix, or the transfer of pre-

21
synthesized particles into the matrix. Each method has its own advantages and
disadvantages. In the in-situ methods, metal clusters are generated inside a polymer
matrix by decomposition (thermolysis, photolysis, radiolysis, etc.) or chemical reduction
of a metallic precursor dissolved into the polymer. However, rigorous control of particle
size, composition, morphology and in particular, the shape of the resultant nanoparticles,
is very difficult. Previously, Mayer et al. investigated the stabilization of gold colloids in
several water soluble polymers by using the in-situ reduction methods applied to the
gold salt precursor [54]. The most stable colloids were obtained for polymers possessing
hydrophobic backbones and for side groups that allow good interactions with the gold
precursor ions.
In the ex-situ approach, clusters are first produced by soft-chemistry routes and
then dispersed into polymeric matrices. Usually the preparative scheme allows to obtain
gold clusters whose surface has been passivated by a monolayer of n-alkanethiol
molecules (CnH2n+1 – SH). A disadvantage of this second approach is that surface
modification of these ex-situ synthesized materials is usually required to allow
dispersion of the particles in the chosen matrix material, to ensure aggregation during
the processing stage (polymerization, sol-gel transition, etc.) [55]
Polymers may be employed as steric stabilizer and also as a means of controlling
nanoparticle growth and interparticle spacing [56, 57]. The resulting composite combine
the optical and electrical properties of the particles and the cohesion stability of the
polymer. Other than that, using a polymer as a protecting agent has been demonstrated
to be a good method of producing gold nanoparticles/polymer nanocomposites [58].
PVA is one of the polymers known as a good stabilizer for gold nanoparticles. It
is a water soluble polymer extensively investigated as a host of different kind of nano-
fillers. Figure 2.6 shows the chemical structure of PVA.

22
OH
n
Figure 2.6: Chemical structure of PVA.
Jie Bai et al. prepared a novel and easy synthetic route for the fabrication of PVA
nanofibers containing gold nanoparticles without using additional stabilizing agent
because the polymer can serve as both stabilizing agent and material for forming fibers
[59]. Kang et al. reported a method to produce gold nanoparticles inside the PVA matrix
by using photoreduction technique [60]. Van der Zande et al. investigated the optical
properties of gold nanorods incorporated in PVA films [61].
2.5 Gold Catalysis
Gold has been considered to be too inert to provide active surfaces for catalyzing
chemical reactions. For that reason, its chemical reactivity has not yet been researched in
as much depth as that of the platinum group metals and its remarkable catalytic
properties have been ignored until recently. However, gold has emerged as one of the
most active catalysts for oxidation of alcohols including diols [62]. In particular, Corma
[63] and Tsukuda [64], independently demonstrated the potential of gold nanoparticles
for the oxidation of aliphatic alcohols. On the other hand, supported gold nanoparticles
are extraordinarily active for low temperature oxidation of hydrocarbon and carbon
monoxide [65]. The latter studies were the first examples in which gold was proposed as
the best catalysts for a process, in contrast to the poor activity of gold reported
23
previously. Haruta et al. reported that the oxidation of propene to propene oxide, which
is essential in the chemical industry, can be carried out with gold supported on titania
[23]. Moreover, they showed the catalytic activity of gold appears for particles in the
nanometric size range, there being a direct relationship between activity and particle
diameter [66]. Supported gold nanoparticles catalyst (Au/TiO2) was also investigated for
the oxidation of benzylic compounds into corresponding ketones without any organic
solvent at 1 atm O2 under mild reaction conditions (=100 ºC), in which a high selectivity
and a good yield of benzylic ketones were obtained [67]. Styrene epoxidation over gold
supported on different transition metal oxides prepared by homogeneous deposition-
precipitation were reported to show good styrene conversion activity and selectivity for
styrene oxide [68]. The gold loading and gold particle size were found to be strongly
affected by the transition metal oxide support used in the catalyst.
Gold nanoparticles dispersed within a polymer matrix are highly promising for
the tailored catalytic material because of their easy handling, storage and recoverability
[69]. In all of the above supported catalysts, although the highly dispersive gold
nanoparticles can be prepared by most of the traditional method but they aggregate
easily to form larger particle and decrease the catalytic activity. Hence, it is desirable to
increase the catalytic activity of gold by stabilizing the nanoparticles against
agglomeration and understand the role of the support in the catalytic activity.
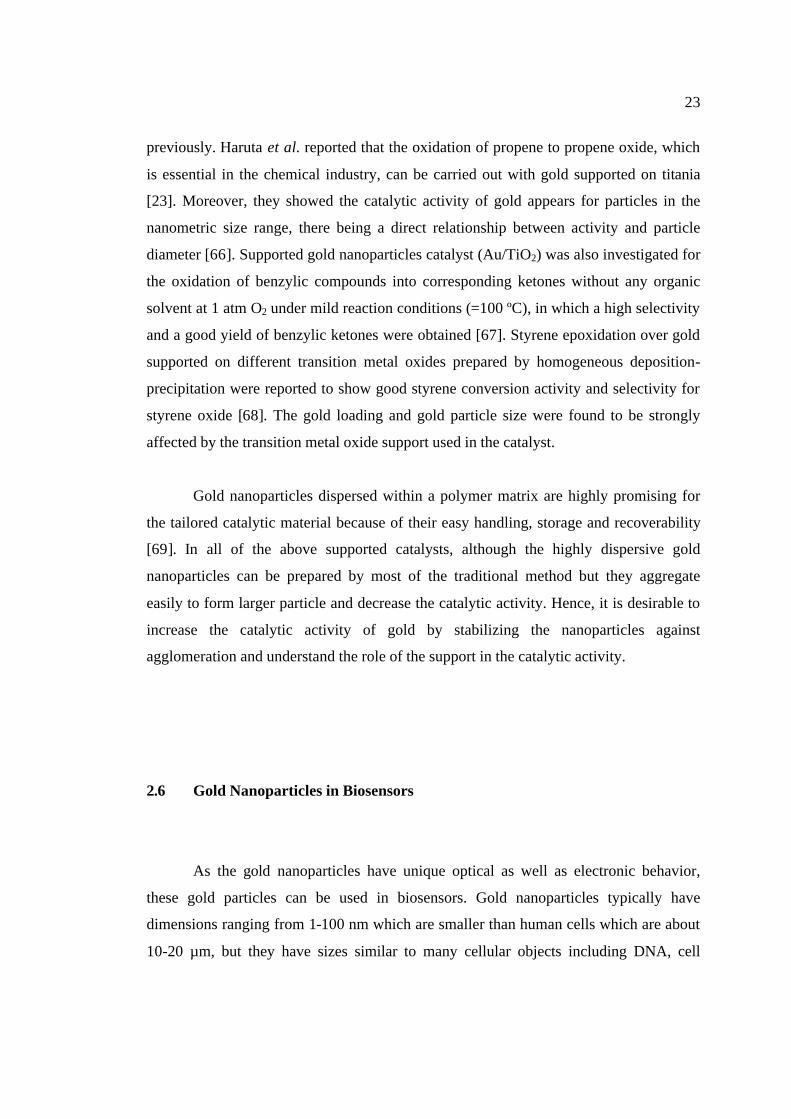
2.6 Gold Nanoparticles in Biosensors
As the gold nanoparticles have unique optical as well as electronic behavior,
these gold particles can be used in biosensors. Gold nanoparticles typically have
dimensions ranging from 1-100 nm which are smaller than human cells which are about
10-20 µm, but they have sizes similar to many cellular objects including DNA, cell

24
surface receptors, and viruses. This unique size of gold nanoparticles facilitates the
development of nanosensors that can probe proteins (enzymes and receptors) or DNA
inside the cell or outside the cell. For example, Link et al. [42] showed that gold
nanoparticles are particularly attractive for biomedical applications as optical biosensors
owing to their dimensions, long-term stability along with their biocompatibility with
antibodies, proteins and DNA.
Major strategy for the conjugation of biomolecules to gold nanoparticles was
generally based on the direct interaction between some functional group within the
biomolecule and the metal surface [70]. The research on gold nanoparticles has
established that these can be used for detection colorimetric oligonucleotides based on
the optical properties of gold nanoparticles. The basic principle involved in the design of
a biosensor based on gold nanoparticles is that the gold nanoparticles are functionalized
or capped with a thiolated biomolecule which upon identifying the complementary
biomolecule causes changes in the optical absorption of gold nanoparticles [71].
Typically, gold nanoparticles can be readily modified with thiol-containing
biomolecules because the thiol group forms a strong interaction on the metal surface.
Several researches were also performed to investigate gold nanoparticles modified with
biomolecules which do not contain a thiol group [70]. More recently it was
demonstrated that amine derivatives complexed with gold nanoparticles in a manner
similar to that of thiol derivatives [72]. In our study, using amine chemistry for surface
modification, binding of amino acids with the gold nanoparticles surface was
accomplished through the amino functionality.

CHAPTER 3
EXPERIMENTAL
3.1 Chemicals
Grade and purity of the chemical reagents that were used in this study are given
in Appendix A and Appendix B. All chemicals were used as available without further
purification.
3.2 Synthesis of Gold Nanoparticles in Different Sizes and Shapes
Gold nanoparticles of different sizes and shapes were synthesized using the
method described by Turkevitch et al. [30]. In the present study, preparations of gold
nanoparticles of sizes 20 nm and 30 – 180 nm were attempted.

26
3.2.1 Synthesis of 20 nm Gold Nanoparticles
The 20 nm gold nanoparticles were synthesized by the citrate reduction of
HAuCl4 in water. A 250 mL double neck round bottom flask was cleaned in aqua regia
(3 HCl : 1 HNO3) and rinsed with distilled water. 100 mL of 1 mM HAuCl4 solution
(0.04g HAuCl4.3H2O in 100 mL water) was heated to boiling, refluxed while being
stirred (Figure 3.1). Then, 10 mL of a 38.8 mM sodium citrate solution (0.1141g sodium
citrate in 10 mL water) is added quickly. The solution turned colour from yellow to
black and to deep red.
After the colour changed, the solution was refluxed for an additional 15 minutes.
Then, the heater was turned off and the solution was stirred until it reached cool to room
temperature. The resulting product, labeled as sample S1, was characterized by
ultraviolet-visible (UV-Vis) spectroscopy and dark-field microscopy.
Figure 3.1: Synthesis of 20 nm gold nanoparticles.

27
3.2.2 Synthesis of 30 nm to 180 nm Gold Nanoparticles
50 mL of 0.01% HAuCl4 solution (0.01g in 100 mL water) was heated to boiling
while being stirred in a 100 mL conical flask (Figure 3.2). Then a few hundred µL of 1%
sodium citrate solution is quickly added to the auric solution. The solution changed
colour within minutes from yellow to black and then to red or purple colour depending
on the sizes of the nanoparticles. After the colour changed, the solution was stirred for
an additional 10 minutes.
The colour change for larger nanoparticles was slower compared to smaller
nanoparticles. The amount of citrate solution was varied in order to obtain different size
gold nanoparticles. The approximate amount of citrate and the corresponding sizes of
nanoparticles for samples S2 – S6 are listed in Table 3.1. The resulting product was
characterized by UV-Vis spectroscopy.
Figure 3.2: Synthesis of gold nanoparticles of different sizes.

28
Table 3.1: Approximate amount of citrate and the corresponding sizes of nanoparticles for samples S2 – S6.
Samples Citrate amount (µL) Nanoparticles size (nm)
S2 350 30
S3 330 40
S4 260 50
S5 230 60
S6 210 80
3.3 Preparation of PVA Embedded Gold Film (PVA-Gold)
PVA-Gold film was synthesized using the methods described by Guo et al. [49]
and Horovitz et al. [73] with slight modifications. An amount of 7.0 g of PVA was
dissolved in 100 mL of distilled at 90°C for an hour under magnetic stirring to obtain 7
wt% PVA homogeneous solutions. The hot solution was filtered and then, 0.7g of
MPTMS and an appreciable amount of 1 M HCl was added to the PVA/MPTMS
mixture to adjust the pH of the medium to pH 1.5. After that, the mixture was stirred for
12 hour at room temperature. The resulting homogeneous solution was cast on a glass
slide (25.4 mm x 76.2 mm) and dried at room temperature for 24 hours. The PVA/Gold
film were prepared by placing 3 - 5 drops of the said gold colloidal solution on the
PVA/MPTMS film and heated at 100°C for an hour. The resulting PVA/Gold film was
peeled off from the glass slide and was characterized using UV-Vis diffuse reflectance
spectroscopy (UV-Vis DR), attenuated total reflectance (ATR), transmission electron
microscopy (TEM) and field emission scanning electron microscopy (FESEM).

29
3.4 Catalytic Oxidation Reactions
Oxidation of styrene using PVA-Gold film as the catalyst was carried out
according to the procedures of Patil et al. [74] as described below:
3.4.1 Catalytic Activity of PVA-Gold Film
The styrene oxidation reactions with tert-butyl hydroperoxide (TBHP) were
carried out at atmospheric pressure by contacting 0.1 g catalyst (PVA-MPTMS film or
PVA-Gold film) with 1.2 mL (10 mmol) styrene and 5.7 mL (15 mmol) 70% aqueous
TBHP in a 25 mL round-bottomed flask equipped with a magnetic bar under reflux (at
70°C) for a period of 3 hours. Blank reaction, which is the reaction with the absence of
catalyst, was also carried out using the same procedure. After the reaction mixture was
cooled, the catalyst was separated from the reaction mixture using diethyl ether. The
reaction products and unconverted reactants were analyzed by gas chromatography (GC)
and gas chromatography-mass spectrometry (GC-MS).
3.4.2 Reusability of the Catalyst
The reusability of the PVA-Gold as catalyst was studied in the repeated
oxidation of styrene. The reactions were carried out as described in Section 3.41. At the
end of the reaction, the catalyst was separated from the mixture with diethyl ether and
dried at room temperature before reused. The reaction products and unconverted
reactants were analyzed by GC.

30
3.5 Interaction of PVA-Gold Film with Amino Acids
The amino acids used for the interactions with PVA-Gold film were L-Proline, L-
Arginine, L-Tryptophan and L-Tyrosine. 1% solutions of amino acids were prepared by
dissolving 1.0 g of amino acids in 100 mL distilled water. PVA-Gold films in 1cm2 sizes
were immersed in 1 mL of 1% amino acids solutions for 5 minutes before it was dried
slowly at room temperature. Then, the films were characterized by UV-Vis DR.
3.6 Characterization Techniques
Characterizations of colloidal gold nanoparticles were carried out by means of
several methods: UV-Vis spectroscopy, dark field microscopy, FESEM and TEM. ATR,
UV-Vis DR, FESEM and TEM were used to investigate the physicochemical properties
of polymer samples. UV-Vis DR was also used to characterize polymer samples which
were reacted with amino acids.
On the contrary, the resulting products of the oxidation of styrene were analyzed
using GC. GC-MS was also used to verify the resulting products. All the products were
analyzed using GC to determine the amount of product while the components of the
products were identified by using GC-MS.

31
3.6.1 Ultraviolet-Visible Spectroscopy (UV-Vis)
The ultraviolet-visible (UV-Vis) spectroscopy measures the absorbance, A, of an
object (without unit) which quantifies how much light is absorbed by it and thus allows
the determination of the surface plasmon band. The absorbance is given by:
A = log10 (I0/I) (3.1)
where I0 is the intensity of the incident light of a specific wavelength, λ and I is the
intensity of the light that has passed through the sample. The measurement of the
absorbance gives further information such as concentration, as it is linked to the Beer-
Lambert’s Law:
A = ε ⋅ C ⋅ L (3.2)
where C is the concentration, (mol. L-1) of the absorbing species, L is the pathlength
(cm), through the sample and ε (L. mol-1.cm-1) is an intrinsic property of the species
known as molar absorptivity or extinction coefficient.
Method
All UV-Vis studies of gold nanoparticles solutions were carried out using
PerkinElmer Lambda 25 UV-Vis spectrophotometer, using a 1 cm quartz cell. The
single absorbance peak in the range of 520 – 550 nm is due to the characteristic surface
plasmon absorption band of the gold nanoparticles.

32
3.6.2 Optical Imaging of Gold Nanoparticles
Optical imaging of gold nanoparticles was done under dark-field microscopy.
Dark-field microscopy was used to detect the surface plasmon scattering of gold
nanoparticles of different size and shape. The method uses a simple and traditional
microscope setup with a dark field condenser which is able to focus the light onto the
sample at a wide angle. Transmitted light does not enter the microscope objectives and
thus, the scattered light from the metal nanoparticles can be seen. Furthermore, the light
source of a dark-field microscope can be polarized as the metal nanoparticles are also
polarization sensitive.
Method
A few drops of gold nanoparticles solution was deposited on a microscope slide
and covered with a glass slide cover. The glass slide was then mounted onto the
microscope sample platform. Optical imaging of gold nanoparticles was characterized
using a 75W Xenon light source and CXR3 Trinocular Research Microscope (Labomed)
in epi-illuminated darkfield mode. Images were collected through a 40x, 0.5 NA
darkfield objective and detected using a CCD camera.

33
3.6.3 Field Emission Scanning Electron Microscopy (FESEM)
Field emission scanning electron microscopy (FESEM) is a type of electron
microscope capable of producing high resolution images of a sample surface. FESEM
images have a characteristic of three-dimensional appearance and are useful for judging
the surface topography, morphology and structure of the sample. In brief, electrons are
ejected from a filament and accelerated and focused into a small probe that is scanning
over the surface of the sample. The low energy secondary electrons ejected from the
sample surface by the interaction of the primary beam was detected and transformed to
signal used for creating images [75].
Method
For gold nanoparticles in solution form, a few drops of solution was deposited on
a carbon coated stub and allowed for drying for a day. However, for PVA, PVA-
MPTMS and PVA-Gold film samples, the samples were first cut into 1 cm2 before
placed on the carbon coated stub. Prior to scanning, the samples were attached to the
sample holder and coated with platinum using BIO-RAD Polaron Division SEM Coating
System machine. Platinum coating is needed to prevent charge build-up on the sample
surface, besides increasing secondary electron emission. Samples were scanned using
Jeol JSM-6701F FESEM operating at 15 kV.

34
3.6.4 Transmission Electron Microscopy (TEM)
Transmission electron microscopy (TEM) is a microscopy technique whereby a
beam of electrons is transmitted through an ultra thin specimen, interacting with the
specimen as it passes through it. An image is formed from the electrons transmitted
through the specimen, magnified and focused by an objective lens and appears on an
imaging screen, a fluorescent screen in most TEMs, plus a monitor, or on a layer of
photographic film, or to be detected by a sensor such as a charge coupled device (CCD)
camera.
Method
A small amount of sample is added in acetone. The mixture was ultrasonicated to
disperse the particles well. A small drop of suspension was placed on Formvar film-
coated copper grids and dried. The TEM micrographs of the samples were recorded by
Philip CM12 electron microscope (Philips Electron Optics, Eindhoven, Netherlands)
operating at 80 kV. For the characterization of PVA-Gold, 1 cm2 samples were placed on
the mesh copper grid before scanned.

35
3.6.5 Attenuated Total Reflectance (ATR)
The attenuated total reflectance (ATR) infrared technique is one of the most
useful methods for characterization of polymer surfaces. The depth probed into the
samples depends, in a complex manner, on the wavelength, the refractive indices of the
sample and the crystal, and on the angle of reflection. ATR generally allows qualitative
or quantitative analysis of samples with little or no sample preparation which greatly
speeds sample analysis and with this technique, it is possible to record spectra of
polymers of any thickness, not being restricted to polymer films.
Method
All spectra were recorded on a Nicolet Avatar-370 DTGS instrument (Thermo
Electron Corporation) in the 4000 – 650 cm- 1 range. The polymer film samples were
positioned in the center of the reflection element and the pressure plates were fastened
by use of a torque wrench (1 N/cm2). Then, the spectra were collected with EZ Omnic
software.

36
3.6.6 Ultraviolet-Visible Diffuse Reflectance Spectroscopy (UV-Vis DR)
Ultraviolet-visible diffuse reflectance (UV-Vis DR) spectroscopy is a powerful
technique for the qualitative and quantitative determination of the absorption spectra of
solid samples or molecules embedded on the solid surfaces [76]. The UV-Vis DR can
reveal the chemical valence of incorporated metal ion.
UV-Vis DR spectroscopy measures the amount of light reflected from the sample
surface with an integrating sphere. The data are reported as a percent of reflectance
(%R) read on the transmittance scale of the instrument and correspond to R = I/Io where
Io is the intensity of the incident light and I is the intensity of the light reflected from the
sample. The percentage reflectance unit was then converted to Kubelka Munk unit
which is a more convenient way to display the reflectance spectra.
Method
Instrument used for this analysis is a Perkin Elmer Lambda 900 UV-VIS-NIR
spectrometer. Samples were previously cut into the size of 1 cm2 and then placed in the
quartz cell holder. The sample holder was then located and locked properly in the
analyzer compartment. The sample was scanned in the range of wavelength 800 – 200
nm.

37
3.6.7 Gas Chromatography (GC)
Gas Chromatography (GC) is a method for separating components of mixtures of
volatile compounds [77]. It is widely is used for the determination of organic
compounds. In gas chromatography, the sample is converted to the vapor state and the
eluent is a gas, which act as carrier gas. The carrier gas is a chemically inert gas
available in pure form. The stationary phase is generally a nonvolatile liquid supported
on a capillary wall or inert solid particles. Separation occurs as the vapor constituents
equilibrate between carrier gas and the stationary phase. By measuring the retention time
and comparing this time with that of a standard of the pure substance, it may be possible
to identify the peak [78]. The area under the peak is proportional to the concentration.
This instrument consists of carrier gas reservoir, injection port, thermostat heaters,
column, detector and recorder.
Method
GC instrument of Thermo Finnigan with 30 m x 0.25 mm x 0.25 µm column has
been used to analyze the sample before and after the reaction. Analysis temperature was
increased from 40oC to 180oC with the rate of 10oC per minute and then from 180oC to
250oC with the increase rate of 14oC per minute. The temperature was hold for 30
seconds at 250oC. Sample volume for each injection is 1 µL.

38
3.6.8 Gas Chromatography-Mass Spectrometry (GC-MS)
The appearance of a chromatographic peak at a particular retention time does not
guarantee the presence of a particular compound. Combination of gas chromatography
and mass spectrometry (GC-MS) is a powerful analytical technique that could solve this
problem. Mass spectrometry (MS) is an instrumental technique that produces, separates,
and detects ions in the gas phase. The mass spectrometer is a sensitive and selective
detector, and when a capillary GC column is used, this technique is able to identify and
quantify a complex mixture of trace substances [78].
Method
GC-MS instrument of Agilent 5973/6890N model with 30 m x 0.25 mm x 0.2
µm column has been used to analyze the product of reaction. Analysis temperature was
increased from 40oC to 250oC with the rate of 5oC per minute. The temperature was hold
for 3 minutes at 40oC and 5 minute at 250oC. Sample volume for each injection is
0.4 µL. Based on the highest peak, computer program will suggest the best match
structure that may contain in the sample.

39
CHAPTER 4
RESULTS AND DISCUSSION
4.1 Optical Properties of Gold Nanoparticles
The sodium citrate-stabilized gold nanoparticles were prepared following a
method described by Turkevitch et al. [30] which is by the citrate reduction of HAuCl4
in water. Gold nanoparticles with different sizes and shapes were prepared by varying
the amount of citrate solution added. Larger gold particles were produced when the
amount of citrate were reduced [79]. Citrate plays a role in the passivation of formed
gold particles. When a high citrate amount is added, the negative citrate ions adsorbed
onto the gold nanoparticles is increased and this introduce the surface charge that repels
the particles and prevent them from agglomerating. Schematic representation of this
phenomenon is shown in Figure 4.1. However, when less citrate amount was added, the
coverage of the citrate ions is incomplete and coarsening process causes the particles to
aggregate into larger particles.

40
Figure 4.1: Electrostatic repulsion keeps the particles separate.
The formation-growth of gold nanoparticles in samples S1 – S6 as prepared
according to Chapter 3 Section 3.2, was monitored by UV-Vis spectroscopy, looking at
the very intensive SPR absorption in the visible region characterizing nanosized gold
(Figure 4.2(a)). SPR is due to the collective excitation of electrons in the conduction
band of gold nanoparticles arising from resonance with incident visible radiation and it
is sensitive to the local chemical environment, refractive index, and nanoparticle size
and shape [2]. It is well reported that [80, 81] the size and shape of metal nanoparticles
determine the spectral position of the plasmon band as well as its width.
The SPR peak of sample S1 was observed at 527 nm, which corresponds to
excitation of the surface plasmon vibration in the gold nanoparticles. The presence of
this resonance in the visible region is responsible for the lovely pink to blue colours
observed in gold colloidal solutions.

41
Figure 4.2(a) Absorption spectra of gold nanoparticle solutions for samples
S1 – S6.
As the amount of citrate added increased in sample S2, the SPR peak was
slightly red-shifted to 533 nm, which indicates some aggregation of nanoparticles.
Further increase in the concentration of citrate results in red-shifting of the absorption
spectra, which can be observed from samples S3 and S4 with their SPR peak positioned
at 538 nm and 541 nm respectively. Samples S5 and S6 showed broad and weak peaks at
542 nm and 543 nm respectively due to the formation of aggregates which is attributable
to the electric dipole-dipole interactions and coupling between plasmons of
neighbouring particles in the aggregates.
1.0
0.9
420 460 500 540 580 620 660 700
1.1
0.8
0.7
0.6
0.5
0.4
0.3
0.2
0.1
390 0.0
Wavelength (nm)
Ab
sorb
ance
S1
S2
S3
S4
S5
S6
527 nm 533 nm 538 nm 541 nm 542 nm 543 nm
λmax = SPR
42
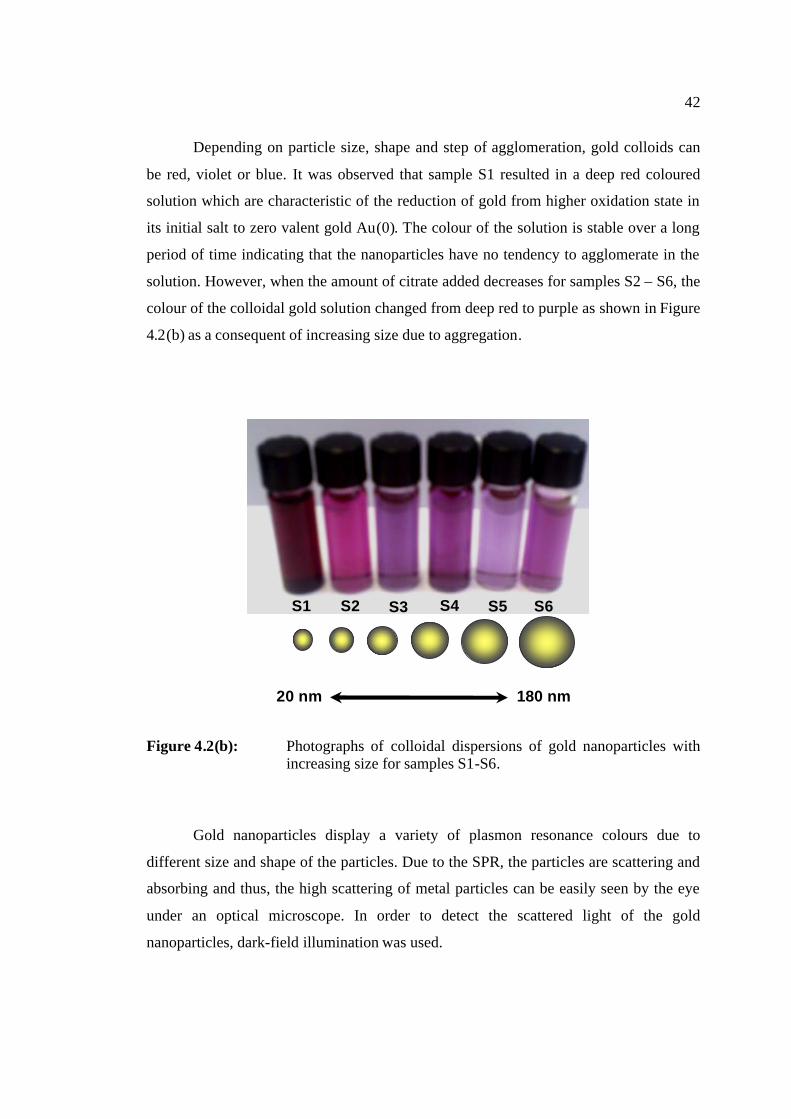
Depending on particle size, shape and step of agglomeration, gold colloids can
be red, violet or blue. It was observed that sample S1 resulted in a deep red coloured
solution which are characteristic of the reduction of gold from higher oxidation state in
its initial salt to zero valent gold Au(0). The colour of the solution is stable over a long
period of time indicating that the nanoparticles have no tendency to agglomerate in the
solution. However, when the amount of citrate added decreases for samples S2 – S6, the
colour of the colloidal gold solution changed from deep red to purple as shown in Figure
4.2(b) as a consequent of increasing size due to aggregation.
Figure 4.2(b): Photographs of colloidal dispersions of gold nanoparticles with
increasing size for samples S1-S6.
Gold nanoparticles display a variety of plasmon resonance colours due to
different size and shape of the particles. Due to the SPR, the particles are scattering and
absorbing and thus, the high scattering of metal particles can be easily seen by the eye
under an optical microscope. In order to detect the scattered light of the gold
nanoparticles, dark-field illumination was used.
20 nm 180 nm
S1 S2 S3 S4 S5 S6

43
In dark-field imaging, the light is scattered by the samples and the transmitted
light is blocked and only scattered light is detected. In this way, the background is dark
and the sample which scatters strongly gives very bright images. Under the illumination
with a beam of white light, multicolor images can be seen due to the differently scattered
light wavelength.
Figure 4.3 shows a representative photograph of gold nanoparticles observed
under dark-field microscopy. The different colours; the blue particles (scattering
between 400 – 480 nm), green particles (500 – 550 nm) and yellow particles (600 – 700
nm), are attributed to the different gold nanoparticles size due to SPR phenomenon [82].
Figure 4.3: Representative photograph of gold nanoparticles viewed under optical microscope. The different colours correspond to different shape of the particles.
4 mm

44
4.2 Surface Morphology of Gold Nanoparticles
Figure 4.4 illustrates FESEM micrographs of the synthesized gold nanoparticles
with increasing diameters (images (a) – (f) for samples S1 - S6). The FESEM images
show that the gold nanoparticles formed in all the samples were in a homogeneous form.
Other than that, it was observed that smaller sized particles are almost spherical in shape
and as the crystallite size grew larger, the particles became more elongated.
The insets in Figures 4.4 (a) – (f) are corresponding to TEM images of gold
nanoparticles. The TEM study of gold nanoparticles confirmed that the particles are
almost spherical in shape with an average diameter ranging from 20 - 180 nm. From the
TEM study, the average diameters for samples S1 – S6 were determined to be 27, 56,
83, 100, 102 and 116 nm, respectively.

45
Figure 4.4: FESEM images of gold nanoparticles prepared from different
concentration of citrate. Images (a) – (f) correspond to samples S1 – S6. The inset in images (a) – (f) shows the TEM images of gold nanoparticles.
(c) (d)
20 nm 50 nm
(f) (e)
50 nm 20 nm
(a)
20 nm 20 nm
(b)

46
4.3 PVA-Gold Film Characterization
In this study, PVA with a thiol functionality (PVA-MPTMS) was synthesized by
reacting PVA with MPTMS, an alkoxysilane modifying group, via sol-gel reaction.
Then, PVA-Gold film was prepared by embedding colloidal gold solutions with average
particle size of 27 nm on the surface of PVA-MPTMS. The resulting PVA-Gold film
was dried and then characterized using FTIR, UV-Vis DR, FESEM, and TEM.
4.3.1 FTIR Spectra of PVA-Gold Film
Figure 4.5 shows the FTIR spectra of PVA film, PVA-MPTMS film and PVA-
Gold film in the range of 4000-750 cm-1. In all cases, there is a broad absorption noticed
in the range of 3294 -3370 cm-1. It is due to the O−H stretching vibrations for the
absorbed moisture and hydrogen bonded hydroxyl groups present in the sample. In
general, PVA will absorb definite amount of moisture to attain equilibrium with the
humidity level of the environment under the prevailing temperature conditions. The
absorbed moisture remains hydrogen bonded to the PVA matrix.
The absorption peak at 1000-1100 cm-1 is assigned to the stretching vibrations of
C−O and C−O−C groups in PVA (Figure 4.5(a)). An increase in the absorbance of the
peak at 1000-1100 cm-1 of PVA-MPTMS film is attributed to the formation of Si−O−C
(1043 cm-1) and Si−O−Si (1093 cm-1) bonds (Figure 4.5(b)).

47
The Si−O−Si group is the result of condensation reaction between hydrolyzed
silanol Si−OH groups and the Si−O−C groups may be originated from the condensation
reaction between Si−OH and C−OH groups from PVA. Therefore, the presence of
Si−O−C and Si−O−Si bonds confirmed the existence of covalent linkage between the
organic groups and the silica, which led to better compatibility and crosslinking network
between organic and inorganic components.
The appearance of gold nanoparticles could not be detected from FTIR
spectroscopy as no changes were observed in the absorption spectra of PVA-MPTMS
and PVA-Gold film (see Figure 4.5(c)). Other characterization techniques such as UV-
Vis DR, FESEM and TEM were used to detect the appearance of gold nanoparticles on
polymer film.
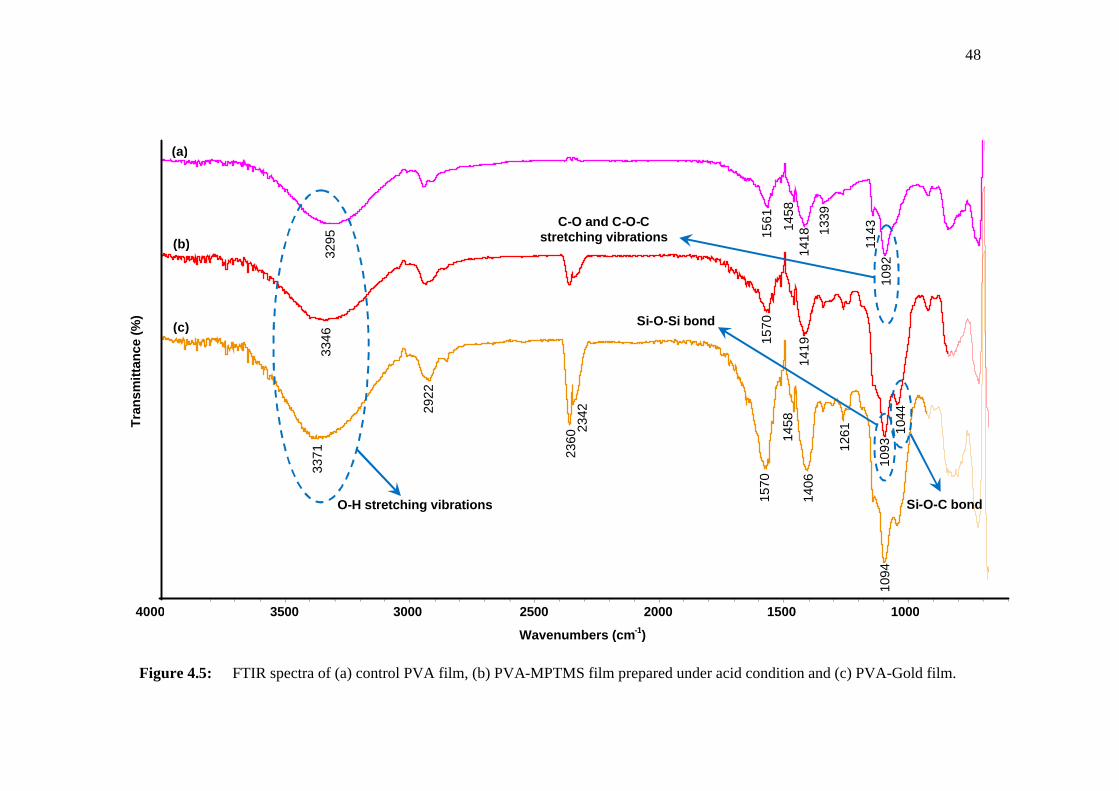
48
Figure 4.5: FTIR spectra of (a) control PVA film, (b) PVA-MPTMS film prepared under acid condition and (c) PVA-Gold film.
Wavenumbers (cm-1)
Tra
nsm
ittan
ce (%
)
1094
(a)
(b)
(c)
1092
11
43
1339
1418
1458
1561
3295
1044
10
93
1419
1570
3346
1261
1406
1458
1570
2342
23
60
2922
3371
1000 1500 2000 2500 3000 3500 4000
O-H stretching vibrations
C-O and C-O-C stretching vibrations
Si-O-Si bond
Si-O-C bond
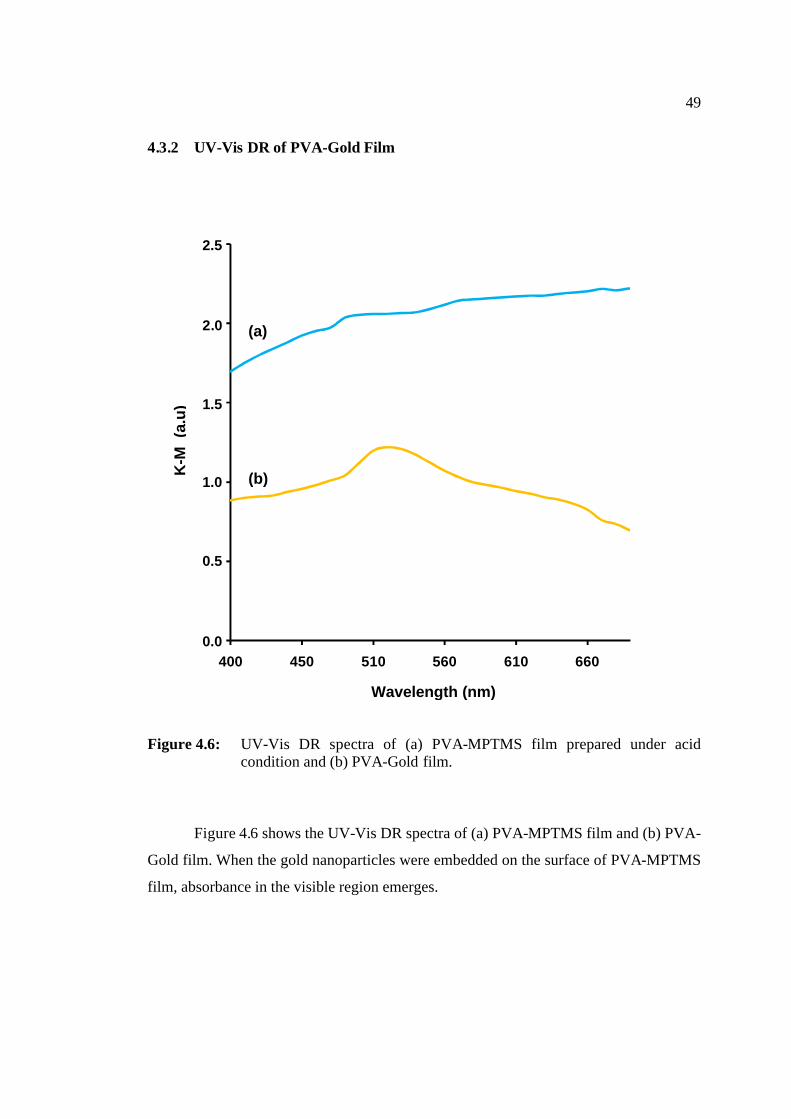
49
4.3.2 UV-Vis DR of PVA-Gold Film
Figure 4.6: UV-Vis DR spectra of (a) PVA-MPTMS film prepared under acid
condition and (b) PVA-Gold film.
Figure 4.6 shows the UV-Vis DR spectra of (a) PVA-MPTMS film and (b) PVA-
Gold film. When the gold nanoparticles were embedded on the surface of PVA-MPTMS
film, absorbance in the visible region emerges.
0
0.5
1
1.5
2
2.5
400 450 510 560 610 660
K-M
(a.
u)
Wavelength (nm)
(a)
(b)
2.5
2.0
1.5
1.0
0.5
0.0

50
The aggregation of colloidal gold on PVA-MPTMS would result in the coupling
of plasmons of individual particles and would be reflected in the UV-Vis spectrum of
PVA-Gold film as an increased absorbance at a longer wavelength. However, the
absence of such feature in the UV-Vis spectrum of PVA-Gold film when compared to
the spectrum of an aqueous solution of colloidal gold indicates that the gold
nanoparticles are embedded on PVA-MPTMS film in a monolayer and are isolated from
each other.
4.3.3 FESEM of PVA-Gold Film
The FESEM observation of the PVA film, PVA-MPTMS film and PVA-Gold
film are shown in Figure 4.7 (a), (b) and (c) respectively. Obvious contrast can be seen
between all three PVA samples. The surface of the PVA is homogeneous and the silica
phase did not form. However, silica particles can be found in the surface of PVA-
MPTMS due to the polycondensation of MPTMS leading to conglomeration in the
polymer matrix.

51
Figure 4.7: FESEM micrograph of (a) PVA film, (b) PVA-MPTMS film, and (c) PVA-Gold film.
(a) (b)
PVA film
(c)
Gold nanoparticles
PVA functionalized with MPTMS

52
4.3.4 TEM of PVA-Gold Film
The morphology of gold nanoparticles embedded into PVA matrices was imaged
by TEM. As visible in Figure 4.8, the existence of gold nanoparticles on the surface of
the polymer was evidenced by detection of dark spots. TEM micrograph of gold
nanoparticles revealed that the average diameter of the nanoparticles vary in between 30
nm –150 nm.
Figure 4.8: TEM micrograph of PVA-Gold film.

53
4.4 Catalytic Activity of PVA-Gold Film
The catalytic activity of PVA-Gold film with gold particle size 27 nm for the
oxidation of styrene was studied. The reaction was carried out under reflux (at 70°C)
using a reaction mixture containing 10 mmol styrene, 15 mmol TBHP and 0.01 g of
catalyst by procedures described earlier [74]. The reaction scheme for the oxidation of
styrene is illustrated in Figure 4.9.
CH2
PVA-Gold
TBHP, 70°C, 3 h
CHO
+
O
+
CH3O
Figure 4.9: Schematic representation of the oxidation of styrene.
Reaction products of the oxidation of styrene using TBHP as the oxidant
catalyzed by PVA-MPTMS and PVA-Gold were analyzed by GC. The major products in
this reaction proved to be benzaldehyde, styrene oxide and acetophenone. Other possible
products of prolonged oxidation of styrene were found to include benzoic acid and
phenylacetaldehyde (Appendix E). The selectivities towards benzaldehyde, styrene
oxide and acetophenone as the reactions products are shown in Figure 4.10.

54
Figure 4.10: The conversion and product selectivity of the oxidation of styrene with
tert-butyl hydroperoxide using PVA-MPTMS and PVA-Gold as catalyst.
As indicated in Figure 4.10, the reaction catalyzed by all the catalysts
produced the highest yield of benzaldehyde and their selectivities towards the formation
of products are almost similar to each other. Blank reaction is the reaction carried out in
the absence of PVA-Gold film, while PVA-MPTMS is the reaction carried out in the
absence of gold nanoparticles.
From the results, PVA-MPTMS showed high benzaldehyde selectivity of
68.3% with 94.7% styrene conversion. However, PVA-Gold film showed the best
performance with respect to the highest benzaldehyde selectivity of 73.4% and styrene
conversion activity of 95.0% in the oxidation reaction. It was worth highlighting that in
the presence of gold nanoparticles, the selectivity for benzaldehyde was significantly
enhanced in comparison to that of PVA-MPTMS. This indicated the important role
played by the nanosized gold of the PVA-Gold film in oxidation of styrene. However,
when the reaction was carried out for over 24 hours, the styrene conversion and
benzaldehyde selectivity decreased to 84.0% and 38.7%, respectively with many side
products as mentioned before.
0
10
20
30
40
50
60
70
80
90
100
Blank PVA-MPTMS PVA-Gold
Con
vers
ion
(%)
Acetophenone
Styrene oxide
Benzaldehyde
Product selectivity (%):
10 60
68.323
13.1
18.5
73.4
26.6

55
Leaching is a particular problem of supported catalysts in liquid phase reactions.
Thus, it is of interest to investigate the reusability of PVA-Gold film in the oxidation of
styrene. The PVA-Gold film could be easily recovered from the reaction products and
regenerated by separation with diethyl ether and drying in air. They were reused for 2
times in fresh reactant mixtures. The regenerability of the PVA-Gold film was studied at
70°C for 2 cycles and results are shown in Table 4.1.
Table 4.1: The catalytic activity of PVA-Gold film during the catalyst reuse in the oxidation of styrene.
Number of reuse
Styrene conversion
(%)
Selectivity (%)
Benzaldehyde Styrene oxide Acetophenone
1 94.7 54.8 9.2 24.8
2 93.9 56.2 - 43.8
The PVA-Gold showed excellent reusability in both catalytic activity and
selectivity in the oxidation with enchanced selectivity to benzaldehyde. The result
suggest that PVA as support material is capable of enhancing catalytic activity by
providing constantly stirred environment through swelling of the polymer matrix in
solution during the reaction. One suggests that the long chain of the polymer acts as real
molecular stirrer. This is supported by the fact that PVA-MPTMS also showed relatively
high conversion. However, a major drawback of these methods is the adsorption on the
support of the residual chlorines coming from the gold precursor (HAuCl4), which is
often considered as a source of gold sintering and can also poison the catalytic activity
[83].

56
4.5 Interaction of PVA-Gold Film with Amino Acids
Gold nanoparticles have excellent biocompatibility to biomolecules and are
widely used in bioassays [84-86]. Their negatively charged surfaces readily bind thiol,
amine, cyanide and diphenylphosphine functional groups [10-13]. Amino acids are
constituents of proteins and their amine (NH2) groups are known to bind to gold
particles. The unique optical properties of PVA-Gold were exploited in the detection of
several amino acids such as L-Arginine (Arg), L-Proline (Pro), L-Tryptophan (Trp) and
L-Tyrosine (Tyr). Their chemical structures are shown in Figure 4.11.
NH2
CH
C
H2C
OH
O
H2C
H2C
HNCH2N
NH
HN
COH
O
Arginine Proline
H2N CH C
CH2
OH
O
HN
H2N CH C
CH2
OH
O
OH
Tryptophan Tyrosine
Figure 4.11: Chemical structure of various amino acids.

57
According to the Mie [36] scattering theory, any variation in the refractive index
of the surface layer should lead to some changes in the intensity or position of the SPR
peak. Such variations could arise from a compositional change in the dispersion medium
or from binding events that might occur at the colloid-solution interface. In general, an
increase in the refractive index of the surrounding medium often causes the SPR peak to
shift to the red.
As seen in Figure 4.12, the interaction of Pro with PVA-Gold film modifies only
slightly the plasmon band from 527 nm (Figure 4.12(a)) to 530 nm (Figure 4.12(b)).
However, for Trp (Figure 4.12(c)) and Tyr (Figure 4.12(d)), it was observed that there is
a red shift as well as peak broadening of the SPR band to 540 nm and 542 nm,
respectively. The peak broadening of Tyr could be related to its structure where Tyr
possesses an a-amine group and a terminal hydroxyl group which is able to facilitate in
crosslinking. It is suggested that hydrogen bonding interactions between neighboring
–OH groups of Tyr are probably responsible for the absorption change [87, 88]. In the
case of Trp, the indole group contains a secondary amine, which could also bind to the
gold surface of PVA-Gold film [15].
The peak position of Arg (Figure 4.12(e)) is red-shifted and broadened with a
maximum absorption around 590 nm. Citrate-capped gold nanoparticles are negatively
charged due to a layer of negative citrate ions. The positively charged amino group in
Arg should interact with the negative charge on the surface of gold nanoparticles
through electrostatic binding thus forming assemblies. Furthermore, the interaction of
gold nanoparticles on PVA-Gold film with amine-rich amino acid like Arg is also
considered to be induced by the interaction among amino acids attached on the
nanoparticles surface. Generally, the amino group in a side chain binds to the gold
nanoparticles surface while the terminal amino group forms hydrogen bonding with the
carboxyl group of another amino acid on an adjacent nanoparticle [70].

58
Figure 4.12: UV-Vis DR spectra of PVA-Gold film before (a) and after interaction with amino acids; (b) Pro, (c) Trp (d) Tyr and (e) Arg.
(a)
(b)
(c)
(d)
(e)
Wavelength (nm)
450 500 550 600 650
K-M
(a.u
.)

CHAPTER 5
CONCLUSIONS AND FUTURE WORK
5.1 Conclusions
In this thesis, the feasibility of using well-stabilized gold nanoparticles on
polyvinyl alcohol (PVA) film as catalyst has been demonstrated. The UV-Vis absorption
spectra and dark-field microscopy confirmed the presence of a surface plasmon
resonance (SPR), attributed to the nanosized gold particles. The resultant gold particles
of sizes as low as 27 nm with nearly spherical in shape were achieved as determined by
TEM and FESEM.
The PVA-Gold film obtained by above-mentioned method revealed a catalytic
activity in the oxidation of styrene to benzaldehyde with 73.4% selectivity and 95%
styrene conversion. The PVA matrix surrounding the gold nanoparticles proved useful in
catalysis by making the recovery of the PVA-Gold catalyst possible as shown by the
reasonably high conversions of styrene over the regenerated catalysts.

60
A recycling test for PVA-Gold in styrene oxidation was performed, and after 2
cycles, no significant loss of activity and selectivity were observed. In this regard, the
long term stability of PVA-Gold is definitely superior than gold colloid; the latter deem
impossible to separate from the products after a catalytic reaction. It is worth noting that
this catalyst could be an alternative for the transition metal catalyst for the
transformation of styrene.
Gold nanoparticles embedded in PVA matrix were evaluated for the SPR
properties with amino acids for biosensor applications. The UV-Vis DR spectra
evidenced the binding of amino acids to PVA-Gold film with the red-shifting as well as
peak broadening of the SPR bands upon addition of amino acids to PVA-Gold. The red-
shift was due to weak binding interactions between amino acids and gold nanoparticles.
Lastly, we conclude that, based on its properties, PVA-Gold film is a promising
material for heterogeneous oxidation catalyst and can be explored as probes for
biosensing application.
61
5.2 Future Work
The knowledge gained from this research opens new avenues to further research
in the design and development of new methods to make supported gold nanoparticles
with desired properties to aptly suit biosensor and catalytic applications. At the moment
there is limited mechanistic understanding of how supported gold nanoparticles achieve
the high catalytic activities and selectivities during the catalysis process. This, therefore,
represents an area where kinetics of the reaction is key area to be studied, particularly
using in-situ spectroscopies. In future work, how the structure of gold nanoparticle
aggregates affects their optical properties also needs to be clarified. Further work on the
characterization of these particles is still required. As a global guide for future actions,
this work opens new perspectives for the use of PVA-Gold composite as a
heterogeneous catalyst and probes for biosensing application.

62
REFERENCES
1. Shi, W., Sahoo, Y., Swihart, M. T., Prasad, P.N. (2005). Gold Nanoshells on
Polystyrene Cores for Control of Surface Plasmon Resonance. Langmuir. 21.
1610-1617.
2. Liz-Marzan, L. M. (2006). Tailoring Surface Plasmons through the Morphology
and Assembly of Metal Nanoparticles. Langmuir. 22. 32.
3. Sokolov, K., Follen, M., Aaron, J., Pavlova, I., Malpica, A., Lotan, R. and
Richards-Kortum, R. (2003). Real-Time Vital Optical Imaging of Precancer
Using Anti-Epidermal Growth Factor Receptor Antibodies Conjugated to Gold
Nanoparticles. Cancer Research. 63. 1999-2004.
4. Durr, N. J., Larson, T., Smith, D. K., Korgel, B. A., Sokolov, K. and Ben-Yakar,
A. (2007). Two-Photon Luminescence imaging of Cancer Cells Using
Molecularly Targeted Gold Nanorods. Nano Letters. 7(4). 941-945.
5. Santra, S., Dutta, D., Walter, G. A., Moudgil, B. M. (2005). Fluorescent
Nanoparticle Probes for Cancer Imaging. Technology in Cancer Research &
Treatment. 4(6). 593-602.

63
6. West, J. L. and Halas, N. J. (2000). Applications of Nanotechnology to
Biotechnology. Current Opinion in Biotechnology. 11. 215-217.
7. Yánez-Sodeno, P. and Pingarron, J. M. (2005). Gold Nanoparticle-Based
Electrochemical Biosensors. Anal Bioanal Chem. 382. 884-886.
8. Nath, N. and Chilkoti, A. (2002). A Colometric Gold Nanoparticle Sensor to
Interrogate Biomolecular Interactions in Real Time on a Surface. Anal. Chem.
74. 504-509.
9. Mirkin, C. A., Letsinger, R. L., Mucic, R. C., Storhoff, J. J. (1996). A DNA-
Based Method for Rationally Assembling Nanoparticles into Macroscopic
Materials. Nature. 382. 607-609.
10. Burst, M., Bethell, D., Schiffrin, D. J. and Kiely, C. J. (1995). Adv. Mater. 7.
795.
11. Leff, D. V., Brandt, L. and Heath, J. R. (1999). Synthesis and Characterization of
Hydrophobic, Organically-Soluble Gold Nanocrystals Functionalized with
Primary Amines. Langmuir. 12. 4723-4730.
12. Grabar, K. C., Smith, P. C., Musick, M. D., Davis, J. A., Walter, D. G., Jackson,
M. A., Guthrie, A. P., Natan, M. J. (1996). Kinetic Control of Interparticle
Spacing in Au Colloid-Based Surfaces - Rational Nanometer-Scale Architecture.
J. Am. Chem. Soc. 118(5). 1148-1153.
13. Grabar, K. C., Allison, K. J., Baker, B. E., Bright, R. M., Brown, K. R., Freeman,
R. G., Fox, A. P., Keating, C. D., Musick, M. D., Natan, M. J. (1996). Two-
Dimensional Arrays of Colloidal Gold Particles: A Flexible Approach to
Macroscopic Metal Surfaces. Langmuir. 12(10). 2353.
64
14. Mandal, S., Selvakannan, P. R., Phadtare, S., Pasricha, R. And Sastry, M. (2002).
Synthesis of a Stable Gold Hydrosol by the Reduction of Chloroaurate Ions by
the Amino Acid, Aspartic Acid. Proc. Indian Acad. Sci. (Chem. Sci.). 114(5).
513-520.
15. Selvakannan, P. R., Mandal, S., Phadtare, S., Gole, A., Pasricha, R., Adyanthaya,
S. D. and Sastry, M. (2004). Water-Dispersible Tryptophan-Protected Gold
Nanoparticles Prepared by the Spontaneous Reduction of Aqueous Chloroaurate
Ions by the Amino Acid. J. Colloid Interf. Sci. 269. 97-102.
16. Polavarapu, L. and Xu, Q.-H. (2008). A Single-Step Synthesis of Gold
Nanochains using an Amino Acid as a Capping Agent and Characterization of
their Optical Properties. Nanotechnology. 19. 1-6.
17. Xu, L., Guo, Y., Xie, R., Zhuang, J., Yang, W., Li, T. (2002). Three-Dimensional
Asembly of Gold Nanoparticles using Dipeptides. Nanotechnology. 13. 725-728.
18. Sugunan, A., Juilland, P., Thanachayanont, C., Dutta, J., Hilborn, J. G. (2004).
Synthesis of bio-compatible gold nanoparticles. Proceedings of International
Conference on Smart Materials (SMARTMAT-04). Chiang Mai, Thailand.
19. Haruta, M. (2005). Catalysis by Gold Nanoparticles. Encyclopedia of
Nanoscience and Nanotechnology. 1. 655-664.
20. Thompson, D. (1998). Gold Bull. 31. 111.
21. Zhang, Q. G., Liu, Q. L. and Chen, J. H. (2007). Dehydration of Isopropanol by
Novel Poly(vinyl alcohol)-Silicone Hybrid Membranes. Ind. Eng. Chem. Res. 46.
913-920.

65
22. Shan, J. and Tenhu, H. (2007). Recent advances in polymer protected gold
nanoparticles:synthesis, properties and applications. Chem. Commun. 4580-4598.
23. Haruta, M. (1997). Size- and Support-Dependency in the Catalysis of Gold.
Catalysis Today. 36. 153-166.
24. Valden, M., Lai, X. And Goodman, D. W. (1998). Onset of Catalytic Activity of
Gold Clusters on Titania with the Appearance of Nonmetallic Properties.
Science. 281.
25. El-Sayed, I. H., Huang, X. and El-Sayed, M. (2005). Surface Plasmon Resonance
Scattering and Absorption of anti-EGFR Antibody Conjugated Gold
Nanoparticles in Cancer Diagnostics: Applications in Oral Cancer. Nano Letters.
5(5). 829-834.
26. Huang, X., El-Sayed, I. H., Qian, W and El-Sayed, M. (2006). Cancer Cell
Imaging and Photothermal Therapy in the Near-Infrared Region by Using Gold
Nanorods. J. Am. Chem. Soc. 128. 2115-2120.
27. Lewis, L. N. (1993). Chemical Catalysis by Colloids and Clusters. Chem. Rev.
93(8). 2693–2730
28. Ishida, T., Kuroda, K., Kinoshita, N., Minagawa,W., Haruta, M. (2008). Direct
Deposition of Gold Nanoparticles onto Polymer Beads and Glucose Oxidation
with H2O2. J. Colloid Interface Sci. 323. 105-111.
29. Huang, X., Huang H., Wu, N., Hu, R., Zhu, T., Liu, Z. (2000). Investigation of
structure and chemical states of self-assembled Au nanoscale particles by angle-
resolved X-ray photoelectron spectroscopy. Surface Science. 459. 183–190.
30. Turkevitch, J. (1985). Gold Bull. 18. 86.

66
31. Frens, G.(1973). Controlled Nucleation for the Regulation of the Particle Size in
Monodisperse Gold Suspensions. Nature: Phys. Sci. 241. 20-22.
32. Tseng, J. –Y., Lin, M. –H., Chau, L. –K. (2001). Preparation of colloidal gold
multilayers with 3-(mercaptopropyl)-trimethoxysilane as a linker molecule. A:
Physicochemical and Engineering Aspects. 182. 239-245.
33. Wagner, F. E., Haslbeck S., Stievano, L., Calogero , S., Pankhurst, Q. A. and
Martinek, K. -P. (2000). Before striking gold in gold-ruby glass. Nature. 407.
691-692.
34. Weyl, W. A. (1951). Coloured Glasses. Society of Glass Technology, Sheffield,
UK.
35. Faraday, M. (1857). Experimental Relations of Gold (and other Metals) to Light.
Philos. Trans. 147. 145-181.
36. Mie, G. (1908). Ann.Physik. 25(4). 377.
37. Brust, M., Walker, M., Bethell, D., Schriffrin, D. J. and Whyman, R. (1994).
Synthesis of Thiol-derivatised Gold Nanoparticles in a Two-phase Liquid-Liquid
System. J. Chem. Soc., Chem. Commun. 801-802.
38. Brust, M., Fink, J., Bethell, D., Schiffrin, D. J. and Kiely, D. (1995). Synthesis
and Reactions of Functionalized Gold Nanoparticles. J. Chem. Soc., Chem.
Commun. 1655-1656.
39. Leff, D. V., Ohara, P. C., Heath, J. R., Gelbert, W. M. (1995). Thermodynamic
Control of Gold Nanocrystal Size: Experiment and Theory. J. Phys. Chem. 99.
7036-7041.
67
40. Daniel, M. –C. and Astruc, D. (2004). Gold Nanoparticles: Assembly,
Supramolecular Chemistry, Quantum-Size-Related Properties, and Applications
toward Biology, Catalysis, and Nanotechnology. Chem. Rev. 104. 293-346.
41. Jana, N. R., Gearheart, L. and Murphy, C. J. (2001). Evidence for Seed-Mediated
Nucleation in the Chemical Reduction of Gold Salts to Gold Nanoparticles.
Chem. Mater. 13. 2313-2322.
42. Link, S. and El-Sayed, M. (2003). Optical Properties and Ultrafast Dynamics of
Metallic Nanoparticles. Annu. Rev. Phys. Chem. 54. 331-366.
43. Hutter, E. and Fendler, J. H. (2004). Exploitation of Localized Surface Plasmon
Resonance. Adv. Mater. 16(19). 1685 - 1706.
44. Yguerabide, J. and Yguerabide, E. E.(1998). Light-Scattering Submicroscopic
Particles as Highly Fluorescent Analogs and Their Use as Tracer Labels in
Clinical and Biological Applications. I. Theory. Analytical Chemistry. 262. 137–
156.
45. Yguerabide, J. and Yguerabide, E. E.(1998). Light-Scattering Submicroscopic
Particles as Highly Fluorescent Analogs and Their Use as Tracer Labels in
Clinical and Biological Applications. II. Experimental Characterization.
Analytical Chemistry. 262. 157-176.
46. Uragami, T., Okazaki, K., Matsuhi, H. and Miyata, T. (2002). Structure and
Permeation Characteristics of an Aqueous Ethanol Solution of Organic-Inorganic
Hybrid Membranes Composed of Poly(vinyl alcohol) and Tetraethoxysilane
Macromolecules. 35. 9156-9163.

68
47. Andrade, G., Barbosa-Stancioli, E. F., Piscitelli Mansur, A. A., Vanconcelos, W.
L. and Mansur, H. S. (2006). Design of Novel Hybrid Organic-Inorganic
Nanostructured Biomaterials for Immunoassay Applications. Biomed. Mater. 1.
221-234.
48. Banyopadhyay, A., Sarkar, M. D., Bhowmick, A.K. (2005). Poly(vinyl
alcohol)/silica hybrid nanocomposites by sol-gel technique: Synthesis and
properties. Journal of Material Science. 40. 5233-5241.
49. Guo, R., Ma, X., Hu, C., Jiang, Z. (2007). Novel PVA-silica nanocomposite
membrane for pervoporative dehydration of ethylene glycol aqueous solution.
Polymer. 48. 2939-2945.
50. Weinberger, M. R., Rentenberger, S. and Kern, Wolgang. (2007). Selective
Immobilization of Gold Nanoparticles on the Surface of a Photoreactive
Polymer.Monatshefte für Chemie. 138. 309-314.
51. Corbierre, M. K., Cameron, N. S., Sutton, M., Mochrie, S. G. J., Lurio, L. B.,
Ruhm, A. and Lennox, R. B. (2001). Polymer-Stabilized Gold Nanoparticles and
Their Incorporation into Polymer Matrices. J. Am. Chem. Soc. 123. 10411-
10412.
52. Corbierre, M. K., Cameron, N. S., Sutton, M., Laaziri, K. and Lennox, R. B.
(2005). Gold Nanoparticle/Polymer Nanocomposites: Dispersion of
Nanoparticles as a Function of Capping Agent Molecular Weight and Grafting
Density. Langmuir. 21(13), 6063 -6072.
53. Corbierre, M. K., Cameron, N. S., Lennox, R. B.(2004). Polymer-Stabilized
Gold Nanoparticles with High Grafting Densities. Langmuir. 20. 2867-2873.

69
54. Mayer, A. B. R. and Mark, J. E. (1997). Colloidal Gold Nanoparticles Protected
By Water-Soluble Homopolymers And Random Copolymers. Eur. Polym. J.
34(1). 103-108.
55. Carotenuto, G. and Nicolais, L. (2004). Synthesis and characterization of gold-
based nanoscopic additives for polymers. Composites: Part B. 35. 385-391.
56. Khanna, P. K., Gokhale, R., Subbarao, V. V. V. S., Vishwanath, A. K., Das, B.
K. and Satyanarayana, C. V. V. (2005). PVA stabilized gold nanoparticles by use
of unexplored albeit conventional reducing agent. Materials Chemistry and
Physics. 92. 229-233.
57. Tripathy, P., Ram, S., Fecht, H.-J. (2006). Gold Nanoparticles from Induced
Au3+? Au0 Reaction in Polyvinyl Alcohol Molecules in Presence of Sucrose in
Hot Water. Plasmonics. 1(2-4). 121-127.
58. Pérez-Juste, J., Rodríguez-González, B., Mulvaney, P. and Liz-Marzán, L. M.
(2005). Optical Control and Patterning of Gold-Nanorod-Poly(vinyl alcohol)
Nanocomposite Films. Adv. Funct. Mater. 15. 1065-1071.
59. Bai, J., Li, Y., Yang, S., D, J., Wang, S., Zheng, J., Wang, Y., Yang, Q., Chen,
X., Jing, X. (2007). A simple and effective route for the preparation of
poly(vinylalcohol) (PVA) nanofibers containing gold nanoparticles by
electrospinning method. Solid State Communication. 141. 292-295.
60. Kang, B. and Wu, J. W.(2006). Fabrication of Gold/Polyvinyl-Alcohol Nano-
Composites by Photoreduction and Their Optical Characterization. Journal of the
Korean Physical Society. 49(3). 955-958.

70
61. Van der Zande, B. M. I., Pagès, L., Hikmet, R. A. M. and Van Blaaderen, A.
(1999). Optical Properties of Aligned Rod-Shaped Gold Particles Dispersed in
Poly(vinyl alcohol) Films. J. Phys. Chem. B. 103. 5761-5767.
62. Porta, F. And Rossi, M. (2003). Gold Nanostructured Materials for the Selective
Liquid Phase Catalytic Oxidation. J. Mol. Catal. A : Chem. 204-205. 553-559.
63. Abad, A., Concepción, P., Corma, A. and Angew, G. (2005). Int. Ed. 44. 4066.
64. Tsunoyama, H., Sakurai, H., Negishi, Y. and Tsukuda, T. (2005). Size-Specific
Catalytic Activity of Polymer-Stabilized Gold Nanoclusters for Aerobic Alcohol
Oxidation in Water. J. Am. Chem. Soc. 127(2005). 9374–9375.
65. Haruta, M., Yamada, N., Kobayashi, T. and Iijima, S. (1989). Gold Catalysts
Prepared by Coprecipitation for Low-Temperature Oxidation of Hydrogen and of
Carbon Monoxide. J. Catal. 115(2). 301-309.
66. Haruta, M. (1997). Gold as Low-Temperature Oxidation Catalyst. Stud. Surf. Sci.
Catal. 110. 123.
67. Dapurkar, S. E., Shervani, Z., Yokoyama, T., Ikushima, Y., Kawanami, H.
(2009). Supported Gold Nanoparticles Catalysts for Solvent-free Selective
Oxidation of Benzylic Compounds into Ketones at 1 atm O2. Catal. Lett. 130(1-
2). 42-47.
68. Choudhary, V. R., Jha, R. and Jana, P. (2006). Epoxidation of Styrene by TBHP
to Styrene Oxide using Barium Oxide as a Highly Active/Selective and Reusable
Solid Catalyst. Green Chem. 8. 689 – 690.
69. Kr´alik, M. and Biffis, A. (2001). Catalysis by metal nanoparticles supported on
functional organic polymers. J. Mol. Catal. A: Chem. 177. 113–138

71
70. Niemeyer, C. M. (2001). Angew. Chem. Int. Ed. 40. 4128.
71. Yoo, E. J., Park, H. G. And Chang, Y. K. (2008). Size-Dependent Flocculation
Behaviour of Colloidal Au Nanoparticles Modified with Various Biomolecules.
Ultramicroscopy. 108. 1273-1277.
72. M. Aslam, Lei Fu, Ming Su, K. Vijayamohanan and Vinayak P. Dravid. (2004).
Novel One-Step Synthesis of Amine-Stabilized Gold Nanoparticles. J. Mater.
Chem. 14. 1795.
73. Horovitz, O., Tomoaia, G., Mocanu, A., Yupsanis, T., Tomoaia-Cotisel, M.
(2007). Protein Binding to Gold Auto-assembled Films. Gold Bulletin. 40(4).
295-304.
74. Patil, N.S.,Uphade, B.S., Jana, P., Bhargava, S.K. and Choudhary, V.R. (2004).
Epoxidation of Styrene by Anhydrous t-Butyl Hydroperoxide Over Reusable
Gold Supported on MgO and Other Alkaline Earth Oxides. J. Catal. 223. 236-
239.
75. Blake, D. F. (1990). Scanning Electron Microscopy. In: Perry, D. L. ed.
Instrumental Surface Analysis of Geologic Materials. New York: VCH
Publishers, Inc. 11 – 43.
76. Frei, R.W. and MacNeil, J.D. (1973). Diffuse Reflectance Spectroscopy in
Environmental Problem-Solving. Cleveland, Ohio: CRC Press.
77. Littlewood, A. B. (1970). Gas Chromatography: Principles, Techniques and
Applications. (2nd ed.) New York: Academic Press, Inc.

72
78. Christian, G. D. (2003). Analytical Chemistry. (6th ed.) New York: John Wiley &
Sons, Inc.
79. Kimling, J., Maier, M., Okenve, B., Kotaidis, B., Ballot, H. and Plech, A. (2006).
Turkevitch Method for Gold Nanoparticles Synthesis Revisited. J. Phys. Chem.
B. 110(32). 15700-15707.
80. Grabar, K. C., Freeman, R. G., Hommer, M. B. and Natan M.J. (1995).
Preparation and Characterization of Au Colloid Monolayers. Anal. Chem. 67(4).
735–743.
81. Link, S. and El-Sayed, M. A. (1999). Spectral Properties and Relaxation
Dynamics of Surface Plasmon Electronic Oscillations in Gold and Silver
Nanodots and Nanorods. J. Phys. Chem. B. 103. 8410-8426.
82. Mock, J. J., Smith, D. R. and Shultz, S. (2003). Local Refractive Index
Dependence of Plasmon Resonance Spectra from Individual Nanoparticles. Nano
Lett. 3(4). 485-491.
83. Oh, H.S., Yang, J. H., Costello, C.K., Wang, Y.M., Bare, S.R., Kung H.H., and
Kung, M.C. (2002). Selective catalytic oxidation of CO: Effect of chloride on
supported Au catalysts. J. Catal. 210. 375.
84. Wilson, R. (2008). The Use of Gold Nanoparticles in Diagnostics and Detection.
Chem. Soc. Rev. 37. 2028-2045.
85. Hayat, M. A. (1989). Colloidal Gold, Principles, Methods and Applications.
Academic Press: New York.

73
86. Jain, P. K., El-Sayed, I. H. and El-Sayed, M. (2007). Au nanoparticles target
cancer. Nanotoday. 2(1). 18-29.
87. Boal, A. K. and Rotello, V. M. (2000). Intra- and Intermonolayer Hydrogen
Bonding in Amide-Functionalized Alkanethiol Self-Assembled Monolayers on
Gold Nanoparticles. Langmuir. 16. 9527-9532.
88. Paulini, R., Frankamp, B. L., Rotello, V. M. (2002). Effects of Branched Ligands
on the Structure and Stability of Monolayers on Gold Nanoparticles. Langmuir.
18(6). 2368-2373.

74
APPENDIX A
Chemical reagents for synthesis of gold nanoparticles
Chemical reagent Molecular formula Purity (%) Brand
Hydrogen tetrachloroaurate(III)
hydrate
HAuCl4.3H2O
99
Sigma-
Aldrich
Sodium Citrate Na3C6H5O7.2H2O USP Testing Sigma-
Aldrich
Hydrochloric acid HCl 37
Nitric acid HNO3 90
Chemical reagents for synthesis of PVA-Gold
Chemical reagent Molecular formula Purity (%) Brand
Polyvinyl alcohol (PVA) [-CH2CHOH-]n 98-99 Sigma-
Aldrich
(3-mercaptopropyl)
trimethoxysilane (MPTMS)
HS(CH2)3Si(OCH3)3 95 Aldrich
Hydrochloric acid HCl 37

75
APPENDIX B
Chemical reagents for catalytic testing
Chemical reagent Molecular formula Purity (%) Brand
Styrene C8H8 = 99.5 Fluka
tert-butyl
hydroperoxide C4H10O2 ~70 (aqueous) Fluka
Diethyl ether C4H10O 99.5 BDH
Chemical reagents for interactions with amino acids
Chemical reagent Molecular formula Purity (%) Brand
L-Arginine C6H14N4O2 99 BDH
L-Proline C5H9NO2 99 BDH
L-Tryptophan C11H12N2O2 99 BDH
L-Tyrosine C9H11NO3 99 BDH

76
APPENDIX C
Calculation of % Conversion and % Selectivity
%100(%) ×=inputsubstractofAmount
reactedsubstrateofAmountConversion
%100(%) ×=productallofareapeakTotal
productdisiredofareaPeakySelectivit

77
APPENDIX D
GC chromatogram of oxidation of styrene with TBHP at 70º C for 3 hours.
Styrene (reactant)
Benzaldehyde (product)
Styrene oxide (product)
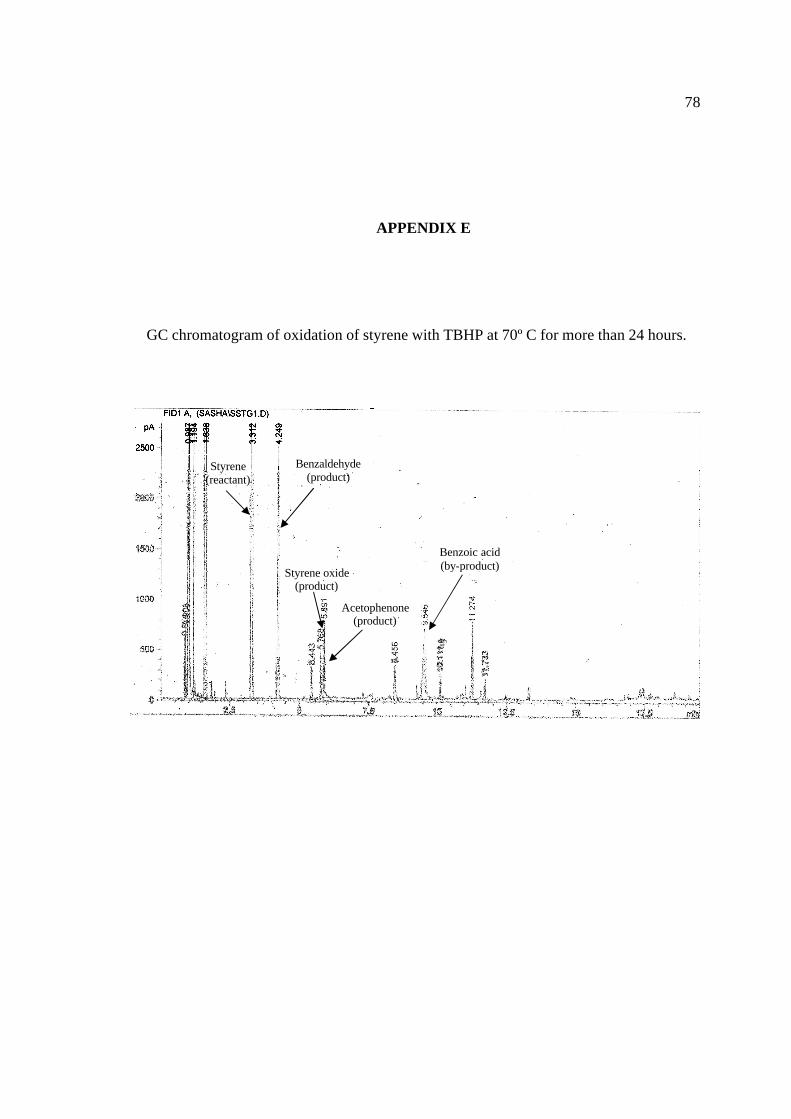
78
APPENDIX E
GC chromatogram of oxidation of styrene with TBHP at 70º C for more than 24 hours.
Styrene
(reactant) Benzaldehyde
(product)
Styrene oxide (product)
Acetophenone (product)
Benzoic acid (by-product)

Gold Nanoparticles Embedded on the Surface of Polyvinyl Alcohol Layer Sasha Md. Nasir and Hadi Nur* Ibnu Sina Institute for Fundamental Science Studies, Universiti Teknologi Malaysia, 81310 UTM Skudai, Johor, Malaysia. *To whom correspondence should be addressed. E-mail: [email protected] Received 17 February 2008
ABSTRACT A novel method for synthesizing polyvinyl alcohol (PVA) embedded gold film is presented. Gold particles, in the size range of 20 to 180 nm, were first prepared by the conventional Turkevitch method by the reduction of gold, hydrogen tetrachloroaurate (HAuCl4) with sodium citrate in water. The resulting gold nanoparticles were characterized by ultra violet-visible (UV-Vis) absorption spectroscopy, dark-field microscopy, transmission electron microscopy (TEM) and field emission electron microscopy (FESEM). In the preparation of PVA embedded gold film, PVA was functionalized with (3-mercaptopropyl) trimethoxysilane (MPTMS) which produced a thiol functionality on the surface. Then, gold particles were embedded on the surface of partially dried functionalized PVA where the gold particles are chemisorbed onto the thiol groups. Their physical properties were studied using Fourier transform infra red spectroscopy (FTIR), FESEM, TEM and UV-Vis diffuse reflectance (UV-Vis DR). Considering that the gold nanoparticles in solution cannot possibly be recovered and reused, the PVA embedded gold film on the other hand, has potential to be reused multiple of times. | Gold Nanoparticles | Polyvinyl Alcohol | Biosensor | Surface Plasmon Resonance |
1. Introduction
Nanotechnology is an anticipated manufacturing technology that allows thorough, inexpensive control of the structure of matter by working with atoms. It allows many things to be manufactured at low cost and with no pollution. Nanotechnologies can extend the long-established trend toward smaller, faster, cheaper materials and devices. Sometimes called the building block of nanotechnology, nanoparticles (particles with diameter less than 100 nm) constitute a commercially important sector of the nanotechnology market. Recent intense interest in nanoparticles stems from the fact that, materials at the nanoscale exhibit unique optical, electronic and magnetic properties not seen in the bulk scale, which makes nanostructures attractive for a wide range of applications. In particular, nanostructures made from the noble metals, such as gold, with their associated strong surface plasmon resonance (SPR) have attracted considerable attention. Colloidal gold have been used technologically for a very long time now. In the 17th century, the brilliant colours of nanosized colloidal particles of Ag, Au and Cu were used in staining glasses [1]. Gold nanoparticles scatter light intensely and are much brighter than chemical fluorophores. They have ready bioconjugation, potential
Article
Journal of
Fundamental Sciences
Available online at http://www.ibnusina.utm.my/jfs

Sasha Md. Nasir and Hadi Nur / Journal of Fundamental Sciences 4 (2008) 245-252
246
noncytotoxicity, not susceptible to photobleaching and excellent biocompatibility to biomolecules. Furthermore, gold nanoparticles can easily be detected in as low as 10-16 M concentration and have strong binding affinity towards thiols, disulfides and amines [2]. The brilliant colours exhibited by gold nanoparticles in the visible and near-infrared spectral regions can be attributed to their fascinating SPR properties. SPR is an optical phenomenon arising from the interaction between an electromagnetic wave and the conduction electrons in a metal. Under the irradiation of light, the conduction of electrons in a gold nanostructure are driven by the electric field to collectively oscillate at a resonant frequency relative to the lattice of the positive ions. At this resonant frequency, the incident light is absorbed by the nanostructure. Some of the photons will be released in all direction and this process is known as scattering. At the same time, some of these photons will be converted into phonons or vibrations of the lattice and this process is referred to as absorption. In general, the SPR peak of a gold nanostructure consists of two components; scattering and absorption [3]. The SPR spectrum depends on the nanoparticles itself (i.e. its size, shape and material) but also on the external properties of the nanoparticles environment. This makes noble metal nanoparticles extremely valuable from sensing point of view. Additionally, gold nanoparticles are promising candidates for applications in nanodevices, nanoelectronics, biolabeling biosensors. Recent studies have shown that gold nanoparticles have immense potential for cancer diagnosis and therapy on account of their SPR enhanced light scattering and absorption [4]. Gold bioconjugates have been used for vital imaging of precancerous and cancerous cells by researches for in vitro and in vivo experiments [5]. Other than that, gold nanoparticles efficiently convert the strongly absorbed light into localized heat, which can be exploited for selective laser photothermal therapy of cancer. So far, the results are extremely promising. What makes this approach so promising is that it does not require expensive high powered microscopes or lasers to view the results, as other technique require. All it takes is a simple, inexpensive optical microscope and white light [2,4]. However, the method used was not practical because in the above method, the gold nanoparticles were in solution form such that it cannot be recovered and reused. Furthermore, most nano-sized metal are very unstable. They can aggregate because of the high surface free energy and can be oxidized-contaminated by air, moisture, SO2 and so on. Therefore, the embedding of nanoscopic metals into polymer represents a valid solution to the manipulation and stabilization problems. In this research, novel functionalized gold nanoparticles embedded on the surface of polymer will be prepared for the application of biological diagnostics whereby the results can be viewed simply by employing an optical microscope and white light.
2. Materials and Methods Synthesis and Characterization All the chemicals were used as received without further purification. UV-Vis studies of gold nanoparticles solutions were carried out using PerkinElmer Lambda 25 UV-Vis spectrophotometer, using a 1 cm quartz cell. The single absorbance peak in the range of 520 – 550 nm is due to the characteristic surface plasmon absorption band of the gold nanoparticles. Optical imaging of gold nanoparticles was characterized using a 75W Xenon light source and CXR3 Trinocular Research Microscope (Labomed) in epi-illuminated darkfield mode. Images were collected through a 40x, 0.5 NA darkfield objective and detected using a CCD camera. The surface morphology of the samples was conducted using Jeol JSM-6701F FESEM operating from 2.0 kV to 5.0 kV. TEM micrographs were taken with a Philip CM12 electron microscope (Philips Electron Optics, Eindhoven, Netherlands) operating at 80 kV. Infrared spectra were performed on a Nicolet Avatar-370 DTGS instrument

Sasha Md. Nasir and Hadi Nur / Journal of Fundamental Sciences 4 (2008) 245-252 247
(Thermo Electron Corporation) in the 4000–650 cm−1 range. UV-Vis Diffuse Reflectance (UV-Vis DR) of PVA-Gold film was recorded using Perkin Elmer Lambda 900 UV-VIS-NIR spectrometer.
Synthesis of Gold Nanoparticles in Different Sizes and Shapes Synthesis of 20 nm Gold Nanoparticles The 20 nm gold nanoparticles were synthesized by the citrate reduction of HAuCl4 in water. A 250 mL double neck round bottom flask was cleaned in aqua regia (3 HCl : 1 HNO3) and rinsed with distilled water. 100 mL of 1 mM HAuCl4 solution (0.04g HAuCl4.3H2O in 100 mL water) was heated to boiling, refluxed while being stirred (Figure 3.1). Then, 10 mL of a 38.8 mM sodium citrate solution (0.1141g sodium citrate in 10 mL water) is added quickly. The solution turned colour from yellow to black and to deep red. After the colour changed, the solution was refluxed for an additional 15 minutes. Then, the heater was turned off and the solution was stirred until it reached cool to room temperature. Synthesis of 30 nm to 180 nm Gold Nanoparticles 50 mL of 0.01% HAuCl4 solution (0.01g in 100 mL water) was heated to boiling while being stirred in a 100 mL conical flask (Figure 3.2). Then a few hundred µL of 1% sodium citrate solution is quickly added to the auric solution. The solution changed colour within minutes from yellow to black and then to red or purple colour depending on the sizes of the nanoparticles. After the colour changed, the solution was stirred for an additional 10 minutes. The colour change for larger nanoparticles was slower compared to smaller nanoparticles. The amount of citrate solution determines the size of the nanoparticles synthesized. The approximate amount of citrate and the corresponding sizes of nanoparticles are listed in Table 1.
Table 1 : Approximate amount of citrate and the corresponding sizes of nanoparticles.
Citrate amount (µL) Nanoparticles size (nm)
350 30 330 40 260 50 230 60 210 80
Synthesis of PVA Embedded Gold Film (PVA-Gold) PVA was dissolved in distilled water at 90°C for an hour to obtain 7 wt% PVA homogeneous solutions. The hot solution was filtered and then, 0.7g of MPTMS and an appreciable amount of 1 M HCl was added to the filtrate to adjust the pH of the medium to 1.5. After that, the mixture was stirred for 12 hour at room temperature. The PVA solutions were cast on a glass slide and dried at room temperature for 1 day and then the dried film were annealed at 100°C for an hour. Next, a few drops of gold nanoparticles solution were deposited on the surface of the dried PVA membrane and was annealed again for an hour. The resulting PVA membrane was peeled off from the glass slide for characterization.

Sasha Md. Nasir and Hadi Nur / Journal of Fundamental Sciences 4 (2008) 245-252
248
3. Results and Discussion Colour and UV-Vis Absorption Property of Different Sized Gold Nanoparticles
The amount of citrate solution determines the size of the nanoparticles. Larger gold particles were produced when the amount of citrate were reduced [11]. When a high citrate amount is added, the negative citrate ions adsorbed onto the gold nanoparticles is increased and this introduce the surface charge that repels the particles and prevent them from agglomerating. However, when less citrate amount was added, the coverage of the citrate ions is incomplete and thus, causes the particles to aggregate into larger particles.
The formation-growth of gold clusters was monitored by UV-Vis spectroscopy, looking at the very intensive SPR absorption in the visible region characterizing nano-sized gold. Figure 2 shows the UV-Vis absorption spectra of samples S1-S6. The SPR peak of sample S1 was located at 527 nm. As the particle size increased from sample S1 - S6, the absorption peak is moved to higher wavelengths (red-shift, from 527 nm – 543 nm) due to the aggregation of the gold nanoparticles.
As the size of the gold particles increases, the colour of the solution varies from deep red solution to purple as the as shown in Figure 3. The different colours of the gold nanoparticles solution are due to its SPR properties. Nanoparticles can experience SPR in the visible portion of the electromagnetic spectrum. This means that a certain portion of visible wavelengths will be absorbed, while another portion will reflected. The portion reflected will lend the material a certain color. Small nanoparticles absorb light in the blue-green portion of the spectrum (400 - 500 nm) while red light (700 nm) is reflected, yielding a deep red color. As particle size increases, the wavelength of surface plasmon resonance related absorption shifts to longer, redder wavelengths. This means that red light is now adsorbed, and bluer light is reflected, yielding particles with purple colour.
Figure 2: Absorption spectra of gold nanoparticle solutions for samples S1-S6.
Figure 3: Photographs of colloidal dispersions of gold nanoparticles with increasing size for samples S1-S6.
Surface Plasmon Scattering of Gold Nanoparticles Figure 4 shows a photograph of the gold nanoparticles observed under dark-field microscopy. Gold nanoparticles display a variety of plasmon resonance colours due to different size and shape of the particles. The blue particles
λmax = SPR S1
S2
S3
S4
S5
S6
1.0 0.9
420 500 580 660 740
1.1
0.8 0.7 0.6 0.5 0.4 0.2 0.1 0.0
Wavelength (nm)
Abs
orba
nce
527 nm 533 nm 538 nm 541 nm 542 nm 543 nm
0.3
20 nm 180 nm
S1 S2 S3 S4 S5 S6

Sasha Md. Nasir and Hadi Nur / Journal of Fundamental Sciences 4 (2008) 245-252 249
(scattering between 400 – 480 nm) are roughly spherical, green particles (500 – 550 nm) are typically hexagonal (larger diameter) and red particles (600 – 700 nm) have a triangular cross section, varying in thickness from platlets to tetrahedrons [12].
Figure 4: Photograph of gold nanoparticles viewed under optical microscope. The different colours correspond to different shape of the particles. Surface Morphology of Gold Nanoparticles Figure 5 illustrates FESEM micrographs of the synthesized gold nanoparticles with increasing diameters (images (a) – (f) for samples S1 - S6). The FESEM images show that the gold nanoparticles formed in all samples were in a homogeneous form. Other than that, it was observed that smaller sized particles are almost spherical in shape and as the size grew larger, the particles are more elongated.
The insets in Figures 5 (a) – (f) are corresponding TEM images of gold nanoparticles. TEM study of gold nanoparticles confirmed that the particles are almost spherical in shape with an average size ranging from 20 - 180 nm. From the TEM study, the average diameters for samples S1 – S6 were determined to be 27, 56, 83, 100, 102 and 116 nm, respectively.
Figure 5 : FESEM images of gold nanoparticles prepared from different concentration of citrate. Images (a) – (f) correspond to samples S1 – S6. The inset in images (a) – (f) shows the TEM images of gold nanoparticles.
4 mm
(a) (b)
20 nm
(c)
(d) (e) (f)
20 nm 20 nm
50 nm 50 nm 20 nm
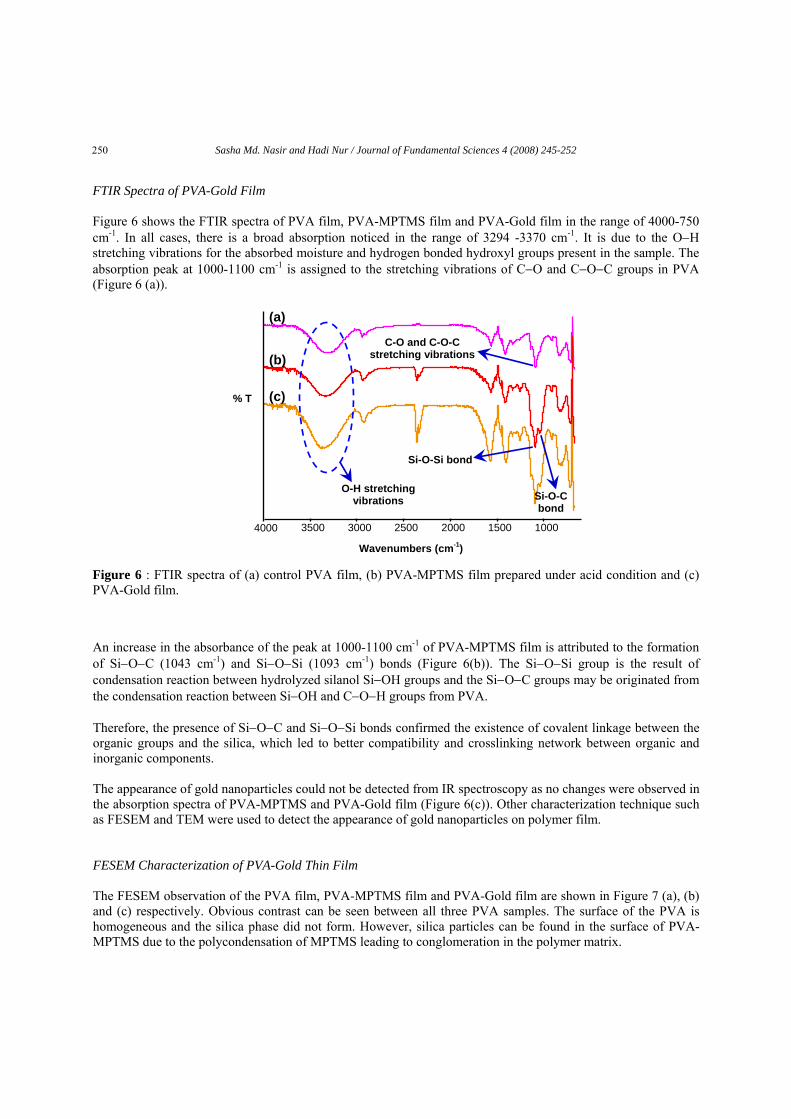
Sasha Md. Nasir and Hadi Nur / Journal of Fundamental Sciences 4 (2008) 245-252
250
FTIR Spectra of PVA-Gold Film Figure 6 shows the FTIR spectra of PVA film, PVA-MPTMS film and PVA-Gold film in the range of 4000-750 cm-1. In all cases, there is a broad absorption noticed in the range of 3294 -3370 cm-1. It is due to the O−H stretching vibrations for the absorbed moisture and hydrogen bonded hydroxyl groups present in the sample. The absorption peak at 1000-1100 cm-1 is assigned to the stretching vibrations of C−O and C−O−C groups in PVA (Figure 6 (a)).
Figure 6 : FTIR spectra of (a) control PVA film, (b) PVA-MPTMS film prepared under acid condition and (c) PVA-Gold film.
An increase in the absorbance of the peak at 1000-1100 cm-1 of PVA-MPTMS film is attributed to the formation of Si−O−C (1043 cm-1) and Si−O−Si (1093 cm-1) bonds (Figure 6(b)). The Si−O−Si group is the result of condensation reaction between hydrolyzed silanol Si−OH groups and the Si−O−C groups may be originated from the condensation reaction between Si−OH and C−O−H groups from PVA. Therefore, the presence of Si−O−C and Si−O−Si bonds confirmed the existence of covalent linkage between the organic groups and the silica, which led to better compatibility and crosslinking network between organic and inorganic components. The appearance of gold nanoparticles could not be detected from IR spectroscopy as no changes were observed in the absorption spectra of PVA-MPTMS and PVA-Gold film (Figure 6(c)). Other characterization technique such as FESEM and TEM were used to detect the appearance of gold nanoparticles on polymer film. FESEM Characterization of PVA-Gold Thin Film The FESEM observation of the PVA film, PVA-MPTMS film and PVA-Gold film are shown in Figure 7 (a), (b) and (c) respectively. Obvious contrast can be seen between all three PVA samples. The surface of the PVA is homogeneous and the silica phase did not form. However, silica particles can be found in the surface of PVA-MPTMS due to the polycondensation of MPTMS leading to conglomeration in the polymer matrix.
1000 1500 2000 2500 3000 3500 4000
O-H stretching vibrations
C-O and C-O-C stretching vibrations
Si-O-Si bond
Si-O-C bond
% T
Wavenumbers (cm-1)
(a)
(b)
(c)

Sasha Md. Nasir and Hadi Nur / Journal of Fundamental Sciences 4 (2008) 245-252 251
Figure 7 : FESEM micrograph of (a) PVA film, (b) PVA-MPTMS film and (c) PVA-Gold film.
TEM Characterization of PVA-Gold Thin Film Figure 8 shows TEM micrograph of PVA-Gold film. The existence of gold nanoparticles on the surface of the polymer was evidenced by detection of dark spots. TEM micrograph of gold nanoparticles showed that the average size of the nanoparticles vary in between 30 nm – 150 nm.
Figure 8 : TEM micrograph of PVA-Gold film.
UV-Vis Diffuse Reflectance (UV-Vis DR) of PVA-Gold Thin Film Figure 9 displays UV-Vis DR spectrum of PVA-Gold film. The spectrum shows an absorbance peak at 527 nm, which confirmed that gold nanoparticles are embedded on the surface of the polymer.
Figure 9 : UV-Vis DR spectrum of PVA-Gold film.
4. Conclusion Gold nanoparticles embedded on the surface of PVA were successfully synthesized and characterized by FTIR, FESEM and TEM. Unlike the methods reported in previous literatures, the present method involves a facile
407 500 600 700 0.6
1
2
34
5
66.4
K-M
527 nm
Wavelength (nm)
(a) (b) (c)
fabrication route for the attachment of gold nanoparticles on the surface of PVA. Firstly, gold nanoparticles with diameters ranging from 20 to 180 nm were synthesized by the conventional Turkevitch method, which is the

Sasha Md. Nasir and Hadi Nur / Journal of Fundamental Sciences 4 (2008) 245-252 252
5. Acknowledgement This research was supported by the Ministry of Science, Technology and Innovation (MOSTI), Malaysia under Sciencefund Grant no. 03-01-06-SF0326 and the Ministry of Higher Education (MOHE), Malaysia under Fundamental Research Grant Scheme (FRGS) Vot. 78070. 6. References [1] Jain, P. K., El-Sayed, I. H., El-Sayed, M. A. (2007). Au nanoparticles target cancer. Nanotoday. 2(1), 18-
29. [2] El-Sayed, I. H., Huang, X., El-Sayed, M. A. (2005). Surface Plasmon Resonance Scattering and Absorption
of anti-EGFR Antibody Conjugated Gold Nanoparticles in Cancer Diagnostics: Applications in Oral Cancer. Nano Letters. 5(5), 829-834.
[3] Hu, M., Chen, J., Li, Z., Au, L., Hartland, G. V., Li, X., Marquez, M., Xia, Y., (2006). Gold nanostructures: engineering their plasmonics properties for biomedical applications. Chem. Soc. Rev. 35.1084-1094.
[4] Huang, X., El-Sayed, I. H., Qian, W., El-Sayed, M. A. (2006). Cancer Cell Imaging and Photothermal Therapy in the Near-Infrared Region by using Gold Nanorods. J. Am. Chem. Soc. 128. 2115-2120.
[5] Durr, N. J., Larson, T., Smith, D. K., Korger, B. A., Sokolov, K., Ben-Yakar, A., (2007). Two-Photon Luminescence Imaging of Cancer Cells Using Molecularly Targeted Gold Nanorods. Nano Letters. 7(4). 941-945.
[6] Kimling, J., Maier, M., Okenve, B., Kotaidis, V., Ballot, H., Plech, A. (2006). Turkevitch Method for Gold Nanoparticles Synthesis Revisited. J. Phys. Chem. 110. 15700-15707.
[7] Zou, X., Ying, E., Dong, S. (2006). Seed-mediated synthesis of branched gold nanoparticles with the assistance of citrate and their surface-enhanced Raman scattering properties. Nanotechnology. 17(18). 4758-4764.
[8] Corbierre, M. K., Cameron, N. S., Sutton, M., Laaziri, K., and Lennox, R. B. (2005). Gold Nanoparticle/Polymer Nanocomposites: Dispersion of Nanoparticles as a Function of Capping Agent Molecular Weight and Grafting Density. Langmuir. 21(13). 6063 -6072.
[9] Bai, J., Li, Y., Yang, S., Du, J., Wang, S., Zheng, J., Wang, Y., Yang, Q., Chen, X. (2006). A simple and effective route for the preparation of poly(vinylalcohol) (PVA) nanofibers containing gold nanoparticles by electrospinning method. Solid State Communications. 141. 292-295.
[10] Tseng, J.-Y., Lin, M.-H., Chau, L.-K. (2001). Preparation of colloidal gold multilayers with 3-(mercaptopropyl)-trimethylsilane as a linker molecule. Colloids and Surface A: Physichochemical and Engineering Aspects. 182. 239-245.
[11] Kimling, J., Maier, M., Okenve, B., Kotaidis, B., Ballot, H. and Plech, A. (2006). “Turkevitch Method for Gold Nanoparticles Synthesis Revisited”. J. Phys. Chem. B. 110(32). 15700-15707.
[12] Gergo Szakmany (2005). “Optical Properties of Metal Nanoparticles”. University of Notre Dame, Notre Dame.
thiol tailored end-groups. Lastly, the gold nanoparticles were embedded on the functionalized PVA surface by annealing methods. This study is significant as the gold nanoparticles are not only bound to the thiol groups but also embedded in the polymeric layer which makes it a strong attachment. This study is also significant as it is also possible to incorporate other metal nanoparticles such as Pd, Pt, Ag and Cu having strong affinity for thiols.
citrate reduction of gold salt in water. Then, the surface of PVA was functionalized with MPTMS which gives

Alkylsilylated Gold Loaded Magnesium Oxide Aerogel Catalystin the Oxidation of Styrene
Hadi Nur Æ Izan Izwan Misnon Æ Halimaton Hamdan
Received: 24 October 2008 /Accepted: 5 January 2009 / Published online: 30 January 2009
� Springer Science+Business Media, LLC 2009
Abstract Aerogel-prepared magnesium oxide (A-MgO)
was modified by attachment of gold particles. Subsequent
modification of its surface with alkylsilylation of n-octa-
decyltrichlorosilane and chlorotrimethylsilane exhibits
a high catalytic activity for oxidation of styrene with
tert-butyl hydroperoxide in liquid phase. Catalytic results
show that the introduction of gold on the surface of A-MgO
gives a higher catalytic activity in styrene oxidation com-
pared to titanium dioxide. The effect of surface modification
of A-MgO was studied with XRD, UV–Vis DR, FTIR and
nitrogen adsorption analysis.
Keywords Styrene oxidation � A-MgO � Gold �Titanium dioxide � Octadecyltrichlorosilane �Chlorotrimethylsilane
1 Introduction
It has been generally accepted that the overall chemical
transformation in a catalytic reaction depend on the nature
of the active site; its accessability and surroundings.
Therefore, the important properties of a heterogeneous
catalyst are an active site with the correct ensemble of
metal atoms, metal ions, or other active components such
as oxides, carbides, etc., a cavity around the active site that
may change its configuration to facilitate binding of a
specific reactant to the active site and expulsion of the
product, and a cavity wall that facilitates passage of the
desired reactants and products from the ambient to the
active site [1]. Due to the importance of active sites, there
is a need to design a system where these sites are located at
the surface, which enable them to freely directly interact
with every substrate. Recently, Patil et al. [2] demonstrated
that commercial MgO loaded with gold tested as a catalyst
in the oxidation of styrene to styrene oxide with tert-butyl
hydroperoxide (TBHP) as an oxidant, showed an excellent
activity.
Here, we report the use of gold particles loaded aerogel-
prepared magnesium oxide (A-MgO) as catalyst in
oxidation of styrene with TBHP in liquid phase. The phys-
icochemical properties of A-MgO have been studied
previously by Klabunde et al. [3–5]. The fact that MgO was
easily transformed to Mg(OH)2 in the presence of water, the
catalyst was then modified with alkylsilylation of n-octa-
decyltrichlorosilane (OTS) and chlorotrimethylsilane
(CTMS). It is expected that the hydrophobic alkylsilyl group
protects the surface and active sites from being attacked by
water and side product of the oxidation reaction. A-MgO
modified by attachment of titanium dioxide and surface
modified with alkylsilylation of OTS and CTMS were also
prepared for a comparison. The activity of catalysts was
examined in the oxidation of styrene using TBHP as an
oxidant.
2 Experimental
2.1 Preparation of Catalysts
2.1.1 Synthesis of Aerogel-prepared Magnesium Oxide
Synthesis of A-MgO is divided into three consecutive
steps, i.e., alkoxide preparation, gel preparation and
H. Nur (&) � I. I. Misnon � H. Hamdan
Ibnu Sina Institute for Fundamental Science Studies, Universiti
Teknologi Malaysia (UTM), 81310 Skudai, Johor, Malaysia
e-mail: [email protected]; [email protected]
URL: http://www.hadinur.com
123
Catal Lett (2009) 130:161–168
DOI 10.1007/s10562-009-9843-z

supercritical drying. The steps are described in the fol-
lowing sections.
2.1.2 Alkoxide Preparation
Typically, 4.8 g of magnesium ribbon (BDH Laboratory)
was cleaned using acetone and cut into small pieces. The
magnesium was then added to a 250 mL round bottom
round flask (double neck) and fitted with a valve. The flasks
were then flushed with nitrogen for 10 min in order to
remove water vapor. Solution of 1 M was then prepared
with addition of 206 mL methanol into the round bottom
flask with continuous nitrogen flow until the reaction was
complete. Nitrogen flow was needed in this reaction in
order to facilitate the removal of hydrogen gas and prevent
increase of pressure. In this stage, the reaction was highly
exothermic. Ice bath was used to reduce heat during
reaction. Finally, the reaction vessel was sealed and stored
at room temperature for future use.
2.1.3 Gel Preparation
One Molar Mg(OCH)3 solution (43 mL) in methanol was
removed from the flask using a syringe and transferred to a
400 mL Teflon beaker and was mixed with 200 mL toluene.
The solution was homogenized by stirring with a magnetic
bar for 15 min. After that, distilled water used for hydro-
lysis was added dropwise to the solution. A total amount of
3.2 mL of water was slowly added at approximately 1 drop
every 2–3 s with vigorous stirring. Upon addition of the
water, tiny white globules were formed, which slowly dis-
appeared turning the solution milky white. With continuous
stirring, the solution became clear. The solution was cov-
ered with aluminum foil in order to prevent evaporation of
the solvent and was allowed to stir overnight prior to being
subjected to supercritical extraction.
2.1.4 Supercritical Drying
The aerogel was prepared by high temperature supercritical
extraction of the gel using Parr instrument autoclave fitted
with a thermocouple, a pressure gauge and a temperature
controller. The autoclave with the gel was first flushed with
nitrogen for 10 min. Then, it was filledwith nitrogen at initial
pressure of about 100 psi and sealed. The reactor was slowly
heated up to 265 �C at a heating rate of about 50 �C h-1.
When the reactor condition reached the temperature of
265 �C, it was maintained for 1 h. After completion of the
procedure, the pressure was quickly released by venting of
solvent vapor and collected in the condenser. The sample
was again flushed with nitrogen for 10 min at controlled
pressure of 34–35 psi and allowed to cool down overnight.
The resultant white powder, Mg(OH)2 from the supercritical
extraction was calcined in furnace at 500 �C and maintained
for 2 h. The sample was cooled down to room temperature
and stored in a bottle in a desiccator.
2.2 Preparation of Titanium Containing A-MgO
A series of titanium loadings were prepared (%w/w: 2.5, 5,
7.5, 10, and 15). Impregnation process was carried out
according to the method reported previously [6, 7]. Typi-
cally, titanium isopropoxide [Ti(OPr)4, Fluka Chemika]
was impregnated from absolute ethanol solution into
A-MgO by vigorous stirring at ambient condition in fume
cupboard until the absolute ethanol was dried. The powder
resultant was dried in an oven at 100 �C overnight. Finally,
the dried sample was calcined at 500 �C for 2 h. The cat-
alysts were labeled as xTiO2/A-MgO where x refers to
titanium dioxide loadings.
2.3 Preparation of Gold Containing A-MgO
Typically, 100 mL of an aqueous solution of HAuCl4 with a
concentration of 4.2 9 10-3 Mwas prepared. To the yellow
clear solution, urea [CO(NH2)2] was added to achieve a
concentration of 0.42 M with the initial pH *2. The gold
concentration corresponds to a theoretically Au loading of 8
wt.% in case of a complete deposition. Then, 1 g of dried
A-MgO was dispersed in the gold solution and the suspen-
sion was thermostated at 80 �C with vigorous stirring for
16 h. At the end of the reaction, the pH of the solution
increased to*10. After deposition of gold onto A-MgO, the
solid was separated from the precursor solution by centri-
fugation (3,500 rpm for 20 min). The solid underwent
washing process where it was suspended in water (100 mL)
and shaken for 10 min at room temperature and centrifuged
again. The washed solid was dried in an oven at 100 �Covernight and finally, the solid was calcined at 400 �C for
2 h with a heating rate of 2 �C min-1.
2.4 Preparation of Alkylsilylated TiO2/A-MgO
and Au/A-MgO
Two types of alkylsilane were used: Octadecyltrichlorosi-
lane (OTS) (Aldrich) and CTMS (Fluka). Typically, an
amount of 500 lmol of alkylsilane per gram of catalyst
was used for alkylsilylation. 10 cm3 of toluene (dried over
molecular sieve) was dispersed with OTS and 1 g of TiO2/
A-MgO was immersed into OTS solution.
The suspension was shaken for 15 min at room tem-
perature and the powder was collected by centrifugation
(3,000 rpm, 10 min). The catalyst powder was dried at
110 �C overnight. The catalyst was labeled as OTS-TiO2/
A-MgO. The same method was used for alkylsilylation
prepared using CTMS, labeled as CTMS-TiO2/A-MgO.
162 H. Nur et al.
123

For Au/A-MgO catalyst, the modification for alkylsilylated
catalyst was the same for TiO2/A-MgO catalysts and
denoted as OTS-Au/A-MgO and CTMS-Au/A-MgO.
2.5 Characterizations
The X-ray diffraction patterns were obtained using Bruker
D8 Advance X-ray diffractometer using Cu Ka radiation
k = 1.5418 A, operated at 40 kV and 40 mA. Approxi-
mately 1 g sample, in fine powder form was put into a
sample holder. Then, pressed between two glass slides to
get a thin layer, locked in a proper place of analyzer before
it was measured. The measurement took place at room
temperature in the range of 2h = 20�–70� and step interval
0.02� at a rate of 1 s per step.
Diffused reflectance ultraviolet–visible (DRUV–VIS)
spectra measurement was performed on a Perkin Elmer
Lambda 900 UV/VIS/NIR Spectrometer equipped with a
diffused reflectance attachment and 76 mm integrating
sphere. BaSO4 was used as a reference. Finely ground
catalyst was spread flat over the sample holder window.
The holder was tightened and smoothen before placing it in
the spectrometer holder. The sample was analyzed in the
wavelength range of 190–700 nm.
Infrared spectra of the sample were collected on a
Perkin Elmer Spectrum One spectrometer. The sample and
KBr powder (1:100) was mixed using mortar and pressed
into a thin pellet under vacuum (ca. 6 tons). The KBr pellet
was then put into a sample holder and scanned in the
wavenumber region of 4,000–400 cm-1.
The specific surface areas for all samples were obtained
using Quantachrome Autosorb surface area analyzer.
2.6 Catalytic Test
To examine the activity of the catalysts, oxidation of sty-
rene was chosen as a model reaction. In the oxidation
reaction, styrene (5 mmol, Fluka), anhydrous TBHP
(8 mmol, Fluka), acetonitrile (5 mL) and 50 mg catalyst
was put in a magnetically stirred round bottom flask
(capacity 10 cm3), under reflux (at 80 �C) for a period of
8 h. The resulting product was withdrawn and analyzed
periodically with gas chromatograph (GC). Gas chro-
matograph-mass spectrometer (GC-MS) was also used to
verify the resulting product.
3 Results and Discussion
3.1 Physical Properties of Catalysts
Figure 1 shows the XRD diffractograms of A-MgO, TiO2/
A-MgO and Au/A-MgO, respectively. The X-ray
diffractogram shows that A-MgO consists of a crystalline
structure with characteristic peaks at 42.9� and 62.5� due to(200) and (220) planes. After loading of Au, it clearly
shows three new peaks centered at 2h = 38.2�, 44.3�, and64.5� for all samples which are ascribed to metallic gold
[8]. These peaks correspond to Au(111), Au(200) and
Au(220), respectively. There was no appreciable change to
the X-ray pattern of TiO2/A-MgO samples, besides a slight
decrease in the intensity of peaks relative to A-MgO,
confirming that A-MgO was stable towards impregnation
of TiO2. Furthermore, no TiO2 phase was detected on all
samples. This suggests that TiO2 is either deposited in
amorphous form or very well dispersed with very small
crystallite size which cannot be observed by XRD [9].
DRUV–VIS spectra of A-MgO, Au/A-MgO and TiO2/
A-MgO samples are presented in Fig. 2. High surface area
MgO absorbs UV light and emits luminescence, which is
not observed with MgO single crystal [10]. Absorption
is observed for A-MgO at wavelengths 210 nm, which is
considerably lower in energy than the band at 163 nm for
bulk ion pairs. The bands at 210 nm are assigned to be due
to the surface O2- ions of coordination number of 4.
DRUV–VIS spectra for Au/A-MgO are depicted in Fig. 2b.
According to the picture, Au/A-MgO exhibits a band at
537 nm, which is characteristic of the plasmon resonance
of metallic metal particle [8, 11]. This brings to the
assumption that gold species present in the samples consist
of metallic Au. For Ti-containing catalysts, the electronic
spectra of the catalysts showed absorption associated with
the ligand metal charge transfer (LMCT) from the oxygen
to an empty orbital of the Ti(IV) ion. Figure 2c depicts the
DRUV-VIS spectra for TiO2/A-MgO. The presence of
Rel
ativ
e in
tens
ity /
a.u.
20 30 40 50 60 70
a
c
b
2-Theta - Scale
Fig. 1 X-ray diffractograms of (a) A-MgO, (b) Au/A-MgO, and (c)
10TiO2/A-MgO
Alkylsilylated Gold Loaded Magnesium Oxide Aerogel Catalyst 163
123

octahedral titanium species in the catalysts are indicated by
the appearance of intense bands centered at 280 nm.
The IR spectra of modified catalysts with OTS (OTS-
TiO2/A-MgO, OTS-Au/A-MgO) and CTMS (CTMS-TiO2/
A-MgO, CTMS-Au/A-MgO) are shown in Fig. 3a–d. The
spectra demonstrate the various C–H stretching vibrations
at 2,924 cm-1 for anti-symmetry stretching and 2851 cm-1
for symmetry stretching [12]. These C–H groups are from
the alkyl chain of hydrophobic-inducing agent, i.e., the
OTS and CTMS.
Table 1 lists the surface properties data for all the
samples that have been analyzed using nitrogen adsorption
analysis. Untreated A-MgO shows high surface area and
pore diameter. After impregnation with TiO2, the surface
area was gradually decreased. As shown in Table 1, the
surface area of catalysts containing Au was also reduced
after Au deposition. However, the surface area reduction is
more intense in Au deposition compared to TiO2 impreg-
nation. After modification by OTS and CTMS, significant
decrease in the surface area was recorded. One possible
reason for this is the covering effect of the internal surface
area of the catalyst by alkylsilyl groups [13]. Based on the
above results, it is suggested that the deposition of Au and
attachment of functional groups (OTS and CTMS) occur on
the surface of the A-MgO.
3.2 Catalytic Activity
3.2.1 Catalytic Activity and Selectivity of Modified
A-MgO in Oxidation of Styrene
Figure 4 presents the catalytic activity of the catalysts in
the oxidation of styrene with TBHP as the oxidant at 8 h
reaction. The catalytic activity was compared at 8 h
because the rate of reaction saturated after 7 h reaction. As
shown in the figure, the conversion of styrene is relatively
low in the absence of catalyst. TiO2 catalyst gives a con-
version of 15.9% compared to only 13.8% by A-MgO. The
presence of TiO2 increases the catalytic activity of A-MgO.
It is observed that the higher is the TiO2 loading, the higher
is the conversion of styrene. This suggests that TiO2 plays a
role as catalytic active site in this reaction.
During impregnation process, the dispersion of TiO2 in
A-MgO support may lead to situation where Ti4? ions are
coordinated to –O–Mg entities. The presence of Ti4? ions
of this kind on the surface of A-MgO is believed to play an
important role in the oxidation of styrene where Ti4? ions
is needed to activate the neighboring peroxide ligands by
withdrawing the electron cloud and reducing the electron
density of the oxygen atoms [9]. As another example, in the
oxidation of olefin to olefin oxide using hydrogen peroxide
as an oxidant, the ions (Ti4?) are known to be catalytically
active [6, 7, 14].
Over the catalysts, the oxidation of styrene is improved
with benzaldehyde, styrene oxide and phenylacetaldehyde
being the major products. As shown in Fig. 4, the selec-
tivity towards benzaldehyde is slightly increased when the
TiO2 loading is increased. However, this trend is reversed
for the selectivity of styrene oxide, where it is decreased
when TiO2 loading is increased. Selectivity towards phe-
nylacetaldehyde on the other hand is nearly the same for all
190 300 400 500 600 700
Inte
nsity
/ a.
u.
a
c
b
Wavelength / nm
Fig. 2 DRUV–Vis spectra of (a) A-MgO, (b) Au/A-MgO, and (c)
10TiO2/A-MgO
4000 3000 2000 1500 1000 400
Wavenumber / cm-1
Tra
nsm
ittan
ce /
a.u
b
c
d
a
Fig. 3 FTIR spectra of (a) OTS-TiO2/A-MgO, (b) CTMS-TiO2/A-
MgO, (c) OTS-Au/A-MgO, and (d) CTMS-Au/A-MgO
Table 1 Surface properties of aerogel prepared magnesium oxide
(A-MgO) catalysts by nitrogen adsorption analysis
Sample Surface area
(m2 g-1)
Total pore
volume
(cc g-1)
Average
pore
diameter (A´)
MgO-A 241 1.347 223
Au/MgO-A 169 1.088 257
OTS-Au/MgO-A 97 0.602 248
CTMS-Au/MgO-A 123 0.755 245
15TiO2/MgO-A 187 1.423 304
OTS-15TiO2/MgO-A 138 0.962 278
CTMS-15TiO2/MgO-A 139 1.112 320
164 H. Nur et al.
123

catalysts except for 15TiO2/A-MgO where it gives a
slightly higher selectivity. One can see that the selectivity
for benzaldehyde from styrene for all catalysts is higher
than for styrene oxide and phenylacetaldehyde, particularly
for the catalyst with higher TiO2 loading (15TiO2/A-MgO).
One would expect that TiO2 nano-particles are formed
during modification. The TiO2 nano-particles favored the
carbon–carbon bond cleavage [15]. Therefore, with the
increase in the amount of the TiO nano-particles, bond
scission reaction is preferred, leading to the formation of
more benzaldehyde (path I). Another way to form benz-
aldehyde from styrene is by oxidation reaction to form
styrene oxide, which further forms benzaldehyde in the
presence of peroxide (path II). A scheme of the possible
pathway in styrene oxidation is depicted in Fig. 5. The two
different pathways may occur in parallel; however, for this
catalyst, TiO2 promotes the oxidative cleavage of styrene
[9, 16].
As shown in Fig. 4, Au/A-MgO catalyst shows much
higher activities than all TiO2/A-MgO series. It is sug-
gested that Au provides a better active sites for oxidation of
styrene, compared to TiO2. Au/A-MgO gives a conversion
of 64.8%. Besides, Au/A-MgO increased the selectivity of
styrene oxide to 36%, compared to only 19.2%
with 15TiO2/A-MgO. It also reduced the benzaldehyde
selectivity (42%) and increased selectivity towards phe-
nylacetaldehyde (22%).
For styrene oxidation, the smaller gold particles are the
most active [2]. Haruta reported that, the formation of large
particles results from the fact that the interaction of
HAuCl4 with the support is weak, and that the chlorides
present in the samples promotes the sintering of the Au
particles during thermal treatment [17]. The gold particle
size also depends on the calcination temperature. For
example, Date and coworkers [18] showed that gold
particles in Au/TiO2 sample prepared by deposition-pre-
cipitation, grow when the calcination temperature
increases. Kozlov and coworkers [19] showed that the
calcination heating rates significantly alter the perfor-
mances of supported gold catalysts in CO oxidation, such
that low heating rates produce smaller gold particles. The
calcination temperature throughout this study was set at
400 �C and the size of gold particle was big, which is ca.
15.9 nm (calculation using Scherer equation on XRD).
Therefore the size of gold particles should remain the same
and not be a controlling factor to the catalytic performance.
However, in this study, it can be concluded that modi-
fication of A-MgO with TiO2 and Au helps to increase the
activity of styrene oxidation. Evidently, the creation of
TiO2 and Au active sites reduce the benzaldehyde selec-
tivity. Styrene oxide selectivity is reduced by TiO2 and
increased by Au active sites. On the other hand, TiO2
and Au active sites increased the phenylacetaldehyde
formation.
Blank A-MgOTi2O
Con
vers
ion
/ mol
%
79
21
60.5
32
7.5
59.2
32.9
7.9
52.1
33.3
14.6
54.3
31.8
13.9
56.2
30.7
13.1
59.6
27.4
13
60
19.2
20.8
42
36
22
0
10
20
30
40
50
60
70
styrene oxide
phenylacetaldehyde
benzaldehyde
2.5TiO2/A-MgO
5TiO2/A-MgO
7.5TiO2/A-MgO
10TiO2/A-MgO
15TiO2/A-MgO
Au/A-MgO
Fig. 4 Influence of titanium
loading of TiO2/A-MgO and
Au/A-MgO catalysts on styrene
conversion and selectivity
O
O
O
I
II
TBHP
C C
Fig. 5 Pathway in styrene oxidation reaction
Alkylsilylated Gold Loaded Magnesium Oxide Aerogel Catalyst 165
123

3.2.2 The Effect of Alkylsilylation
Figure 6 summarizes the conversion and selectivity of
products from oxidation of styrene with anhydrous TBHP
by using TiO2 and Au series with stirring for 8 h at 80 �C.As shown in the figure, catalyzed oxidation of styrene
produces benzaldehyde, styrene oxide and phenylacetal-
dehyde. Besides, TiO2 and Au series enhance the styrene
conversion, compared with catalysis by using A-MgO and
TiO2 alone. Furthermore, modification of support materials
with hydrophobic alkylsilane groups, which is OTS and
CTMS, led to a remarkable enhancement of the styrene
conversion.
The improvement of catalysis result may be attributed to
hydrophilicity-hydrophobicity effects. As discussed in
previous reports, OTS and CTMS are effective hydropho-
bic inducing agents [6, 7]. During the oxidation process,
decomposition of TBHP releases alcohol as a side product,
known as hydrophilic substance. The hydrophilic catalyst
(15TiO2/A-MgO and Au/A-MgO) have an affinity to
interact with alcohol molecules. If this were to take place,
TiO2 and Au active sites would be poisoned by alcohol
molecules which consequently reduced the catalytic
activity. So, there was a need to protect the active sites by
using OTS and CTMS. Evidently, the hydrophobic carbon
chain of alkylsilyl groups is proven to prevent the alcohol
from deactivating TiO2 and Au active sites. The major
effect of hydrophobic behavior in the catalyst is to con-
tinuously attract more substrates and oxidizing agent
towards the active sites in order to catalyze the reaction.
This is because, the substrates (styrene) are hydrophobic
and TBHP also have certain degree of hydrophobicity
which arises from the tert-butyl alkyl chains. On the other
hand, the hydrophilic catalyst is poisoned by the strong
adsorption of water or other donating compound. Hence
adsorption of hydrocarbon less occurs. Generally, as indi-
cated in Fig. 6, modifications of TiO2/A-MgO and Au/A-
MgO catalysts with alkylsilyl groups created a high styrene
conversion and their selectivities towards the formation of
products are almost similar to each other.
3.2.3 Specific Catalytic Activity for A-MgO
Figures 4 and 6 represent the activity and the selectivity of
the catalysts towards the oxidation of styrene. The defini-
tion of catalytic activity used in this considers the
conversion of styrene per gram of catalyst. All catalysts
were active towards the styrene oxidation reaction. How-
ever, one showed different performances, depending on the
surface modification and the type of metals impregnated on
the surface of A-MgO. As tabulated in Table 1, the surface
areas of the catalysts are different. It implies that the cat-
alytic activity site for the oxidation of styrene over the
modified A-MgO depends on the surface area of catalysts.
With respect to specific activity (i.e., catalytic activity
based on the surface area of catalyst), alkylsilylated
A-MgO having a smaller surface area showed better per-
formance than TiO2/A-MgO and Au/A-MgO (see Fig. 7).
From these results, it can be concluded that alkylsilylated
Au/A-MgO catalysts are more active compared to alkyl-
silylated TiO2/A-MgO and unalkylsilylated A-MgO.
3.2.4 The Effect of Addition of Base and Drying Agent
During modification with OTS, CTMS and gold precursor,
the formation of chlorine ions is favored. OTS consists of
three chlorine ions while CTMS has only one chlorine ion.
Although, the catalysts have been washed in order to
eliminate the chlorine ions, apparently, this procedure
could not completely remove the chlorine ions. Unfortu-
nately, the presence of chlorine ions in large amount is
believed to poison catalysis in many reactions [20]. In
addition, if there were cations (H? or NH4?) present in the
reaction system, it may bind with chlorine ions to form
Au/A-MgOOTS-15TiO2/CTMS
OTS-Au/ A-MgO
CTMS- A-MgO-A
60
19.2
20.849.3
21
29.7
38.7
34
27.3
42.4
35.7
21.9
40.5
29.6
29.9
43.4
32.2
24.4
0
10
20
30
40
50
60
70
80
90
100
Con
vers
ion
/ mol
%
15TiO2/A-MgO
OTS-15TiO2/A-MgO
phenylacetaldehyde
benzaldehyde
styrene oxideFig. 6 The effect of alkylsilane
modification on A-MgO
catalysts
166 H. Nur et al.
123

acidic condition. Thus, a small amount of 4-nitrotoluene,
an indicator used for the measurement of acid strength, was
added in the catalytic system in order to deactivate the acid
site. The interaction of 4-nitrotoluene with various acidic
zeolites has been studied spectroscopically [21]. By con-
sidering the data tabulated in Table 2, the addition of a
small amount of 4-nitrotoluene increased the activity and
altered the selectivity of the reaction. OTS modified cata-
lyst is chosen because it contains more chlorine ions than
CTMS. Addition of 4-nitrotoluene gave 100% conversion
for both OTS-15TiO2/A-MgO and OTS-Au/A-MgO cata-
lysts. Besides, the selectivity towards styrene oxide is
highest compared to other products. Contrary to what has
been reported where benzaldehyde selectivity is increased
after base addition, that phenomenon obviously did not
occur in this case. Evidently, phenylacetaldehyde forma-
tion is compressed as the acid is neutralized [15].
TBHP decomposition gave hydrophilic alcohol as the
side product. This substance has the capabilities to reduce
the catalyst performance. Although alkylsilane is intro-
duced to reduce the deactivation effect, in this segment,
drying agent was added in order to investigate the effect of
water on the catalytic performance; as done by other
researchers using Dean-Stark apparatus to eliminate the
water from the reaction system. The presence of hydro-
philic substances is also believed to promote substrate
diffusion from active sites due to the different nature of
hydrophilic-hydrophobic behaviors. Table 2 shows the
catalyst performance after addition of drying agents.
Generally, the addition of drying agent reduces the sub-
strate diffusion, resulting in absorption of hydrophilic
substance followed by a decrease in formation of phenyl-
acetaldehyde. However, selectivity of OTS-TiO2/A-MgO
towards benzaldehyde and styrene oxide is increased. As
discussed earlier, TiO2 active sites are selective towards
double bond cleavage to form benzaldehyde. On the other
hand, OTS-Au/A-MgO catalyst increases the selectivity of
styrene oxide and reduces the selectivity of benzaldehyde.
4 Conclusion
The catalytic potential of alkylsilylated catalysts for oxi-
dation-catalyzed reactions is demonstrated in the liquid
phase oxidation of styrene. It is observed that the catalyst is
active in the oxidation of styrene with anhydrous TBHP to
form benzaldehyde, styrene oxide and phenylacetaldehyde;
the amount of which in decreasing order is as the follow-
ing: benzaldehyde[ styrene oxide[ phenylacetaldehyde.
The increase in oxidation activity of alkysilylated TiO2/
A-MgO and alkysilylated Au/A-MgO may be explained on
the basis of an increase in hydrophobicity of the catalyst.
OTS-Au/ A-MgO
CTMS-TiO2/A-MgO
OTS-TiO2/A-MgO
0
10
20
30
40
50
60
A-MgO TiO2/A-MgO
Au/ A-MgO
Yie
ld o
f pro
duct
per
sur
face
are
a /
µmol
m-2
CTMS-Au/A-MgO
Fig. 7 Specific activity of
modified A-MgO catalysts
Table 2 The effect of addition
of base and drying agent on
product selectivity of styrene
oxidation
a Addition of 4-nitrotoluene
(200 lmol)b Addition of molecular sieve
as drying agents (100 mg)
Catalyst Conversion
(mol%)
Selectivity (%)
Benzaldehyde Styrene oxide Phenylacetaldehyde
OTS-Au/MgO-A 90.5 40.5 29.6 29.9
OTS-Au/MgO-Aa 100 37.7 39.0 23.3
OTS-Au/MgO-Ab 100 38.7 39.0 22.3
OTS-15TiO2/MgO-A 80 49.3 21.0 29.7
OTS-15TiO2/MgO-Aa 100 37.6 44.5 17.9
OTS-15TiO2/MgO-Ab 100 60.3 27.6 12.1
Alkylsilylated Gold Loaded Magnesium Oxide Aerogel Catalyst 167
123

Deactivation of the acid and reduction of water from the
catalytic system improve the catalytic activity and selec-
tivity of styrene oxidation.
Acknowledgments This research was supported by the Ministry of
Science Technology and Innovation Malaysia (MOSTI), under the
Sciencefund grant No. 03-01-06-SF0326 and the Ministry of Higher
Education (MOHE), Malaysia under the Fundamental Research
Scheme Grant Vot. 78070.
References
1. Kung HH, Kung MC (2003) Appl Catal A 246:193
2. Patil NS, Uphade BS, Jana P, Bharagava SK, Choudhary VR
(2004) J Catal 223:236
3. Utamapanya S, Klabunde KJ, Schlup JR (1991) Chem Mater
3:175
4. Stark J, Klabunde KJ, Schlup JR (1993) Chem Mater 5:71
5. Klabunde KJ, Stark J, Koper O, Mohs C, Park DG, Decker S,
Jiang Y, Lagadic I, Zhang D (1996) J Phys Chem 100:12142
6. Nur H, Hau NY, Misnon II, Hamdan H, Muhid MNM (2006)
Mater Lett 60:2274
7. Hau NY, Misnon II, Nur H, Hamdan H, Muhid MNM (2007)
J Flour Chem 128:12
8. Qian K, Jiang Z, Huang W (2006) J Mol Catal 264:26
9. Nie L, Xin KK, Li WS, Zhou XP (2007) Catal Commun 8:488
10. Hattori H (1995) Chem Rev 95:537
11. Philip D (2008) Spectro Chim Acta A 71:80
12. Dong J, Wang A, Simon-Ng KY, Mao G (2006) Thin Solid Films
515:2116
13. Mirji SA, Halligudi SB, Sawant DP, Jacob NE, Patil KR, Gaik-
wad AB, Pradhan SD (2006) Appl Surf Sci 252:4097
14. Laha SC, Kumar R (2001) J Catal 204:64
15. Zhuang J, Ma D, Yan Z, Liu X, Han X, Bao X, Zhang Y, Guo X,
Wang X (2004) Appl Catal A 258:1
16. Nur H, Hayati F, Hamdan H (2007) Catal Commun 8:2007–2011
17. Haruta M (2002) Cattech 6:102
18. Date M, Ichihashi Y, Yamashita T, Chiorino A, Boccuzzi F,
Haruta M (2002) Catal Today 72:89
19. Kozlov AI, Kozlova AP, Asakura K, Matsui Y, Kogure T, Shido
T, Iwasawa Y (2000) J Catal 196:56
20. Zanella R, Giorgio S, Henry CR, Louis C (2002) J Phys Chem B
106:7634
21. Umansky B, Englehardt J, Hall WK (1991) J Catal 127:128
168 H. Nur et al.
123