
VOL 3 ISSUE 5 APRIL 2018 - Techno Science
76
Transcript of VOL 3 ISSUE 5 APRIL 2018 - Techno Science


VOL 3 ISSUE 5APRIL 2018


TECHNO SCIENCEInternational Scientific Journal ofTechnical SciencesVol. 3, Issue 6 November 2018ISSN 2490-2330e-ISSN 2490-2438Catalogued in COBISS BH
IndexationIndexation in internationaldatabases is in progress.
PublisherAssociation for Research,Education and Development “NIA”Aleja konzula No. 5, Travnik,Bosnia and Herzegovina
Editor in ChiefAmra Tuzović(Travnik, Bosnia and Herzegovina)
DEPUTY EDITORS FOR SPECIFICSCIENTIFIC FIELDSBožo Soldo, the field ofcivil engineeringMuharem Kozić, the field ofinformation technologyMarin Milković, the field of graphictechnologyNermina Mujezinović, the field ofarchitectureSamir Pačavar, the field of textileHimzo Popović, the field ofoccupational safety and health,and fire protectionHrustem Smailhodžić, the field ofnatural sciences
ConsultantNihad Selimović(Travnik, Bosnia and Herzegovina)Executive EditorsMaid Omerović(Travnik, Bosnia and Herzegovina)Aljo Delić(Travnik, Bosnia and Herzegovina)
Scientific AdviserHrustem Smailhodžić(Travnik, Bosnia and Herzegovina)
DesignJasmir Smailbegović(Travnik, Bosnia and Herzegovina)
Technical EditorsAldin Obućina(Travnik, Bosnia and Herzegovina)
Public relationsMarija Garić(Travnik, Bosnia and Herzegovina)
Editorial BoardDarko Babić(Zagreb, Croatia)Elvedin Bečić(Travnik, Bosnia and Herzegovina)Nevzudin Buza$ija(Travnik, Bosnia and Herzegovina)Alisa Čaber(Travnik, Bosnia and Herzegovina)Ivan Damjanović(Travnik, Bosnia and Herzegovina)Marija Garić(Travnik, Bosnia and Herzegovina)Gorazd Golob(Ljubljana, Slovenia)Lovorka Gotal DmitrovićKrešimir Hajdarović(Zagreb, Croatia)(Varaždin, Croatia)Salim Ibrahimefendić(Travnik, Bosnia and Herzegovina)Abdulkerim Ilgun(Konya, Turkey)Suleyman Kamil Akin(Konya, Turkey)Stana Kovačević(Zagreb, Croatia)Muharem Kozić(Travnik, Bosnia and Herzegovina)Milorad Krgović(Belgrade, Serbia)Nevzet Merdić(Zenica, Bosnia and Herzegovina)Dalibor Misirača(Travnik, Bosnia and Herzegovina)Marin Milković(Zagreb, Croatia)Nikola Mrvac(Zagreb, Croatia)Faruk Muharemović(Sarajevo, Bosnia and Herzegovina)Nermina Mujezinović(Travnik, Bosnia and Herzegovina)Aldin Obućina(Travnik, Bosnia and Herzegovina)Maid Omerović(Travnik, Bosnia and Herzegovina)Sedat Ondaral(Trabzon, Turkey)Samir Pačavar(Travnik, Bosnia and Herzegovina)Klaudio Pap(Zagreb, Croatia)Gligorije Perović(Podgorica, Montenegro)Vasilije Petrović(Zrenjanin, Serbia)Himzo Popović(Travnik, Bosnia and Herzegovina)Mehmed Sarić(Sarajevo, Bosnia and Herzegovina)Alen Savatić(Sarajevo, Bosnia and Herzegovina)Nihad Selimović(Travnik, Bosnia and Herzegovina)Hilmija Skorupan(Travnik, Bosnia and Herzegovina)Hrustem Smailhodžić
(Travnik, Bosnia and Herzegovina)Božo Soldo(Varaždin, Croatia)Jovan Stepanović(Leskovac, Serbia)Jun Sugawara(Tokyo, Japan)Almir Šabović(Tuzla, Bosnia and Herzegovina)Ifet Šišić(Bihać, Bosnia and Herzegovina)Amra Tuzović(Travnik, Bosnia and Herzegovina)Darko Ujević(Zagreb, Croatia)Raša Urbas(Ljubljana, Slovenia)Mustafa Zafer Balbag(Eskisehir, Turkey)Milorad Zrilić(Belgrade, Serbia)Predrag Živković(Belgrade, Serbia)
PrintFTS- odsjek GiDCirculation: 300 copies
CommunicationAssociation for Research, Educationand Development “NIA”Aleja konzula No. 5, Travnik,Bosnia and HerzegovinaTel: +387 30 540876;GSM: +387 61 225299Fax: +387 30 540876e-mail: [email protected]: [email protected]
PublishingTechno Science publishes twice a yearin English with Bosnian abstracts.Full journal text available athttp://www.technoscience.ba


ContentAdis RahmnovićManaging water resources using information and communication technologies
Hrustem Smailhodžić, Almir Bečirović, Azra Bečirović, Admir ŠupićBroadening of stellar spectral lines due to the thermal motion of atoms
Ifet ŠišićA modified SPACE method for determining the product and market position of the industrial product on an example of raw material grinding machines
Admir Šupić, Almir Bečirović, Milorad Zrilić, Aldin ObučinaRadiation e!ects in aircraft and the impact on human body
Maid Omerović, Aljo Delić, Ahmed PalićRandom number generators and their application
Maid Omerović, Aljo Delić, Ahmed PalićOLAP technology and its application through business data analysis and database multidimensionality
Ahmed Palić, Mirela Abidović Salkice, Šejla SmajićEconomics of the education sector investment through the it sector development
Dragan Gnjatić, Dalibor MisiračaIT sector challenges in the education system
Dragan Gnjatić, Mirela Abidović SalkicaThe impact of technology on the relationship between labour and unemployment
10
17
22
34
40
45
55
62
68

SadržajAdis RahmanovićUpravljanje vodenim resursima koristeći informaciono komunikacione tehnologije
Hrustem Smailhodžić, Almir Bečirović, Azra Bečirović, Admir ŠupićŠirenje spektralnih linija zvijezda uslijed termičkog kretanja atoma
Ifet ŠišićModifikovana SPACE metoda za utvr%ivanja proizvodno-tržišne pozicije industrijskog proizvoda na primjeru mašina za usitnjavanje sirovina
Admir Šupić, Almir Bečirović, Milorad Zrilić, Aldin ObučinaEfekti zračenja u letjelicama i njihov uticaj na ljudsko tijelo
Maid Omerović, Aljo Delić, Ahmed PalićGeneratori slučajnih brojeva i njihova primjena
Maid Omerović, Aljo Delić, Ahmed PalićOLAP tehnologija i primjena istih kroz poslovnu analizu podataka i višedimnezionalnost baze podataka
Ahmed Palić, Mirela Abidović Salkice, Šejla SmajićEkonomija ulaganja u obrazovni sektor kroz razvoj IT sektora
Dragan Gnjatić, Dalibor MisiračaIzazovi IT sektora u sistemu obrazovanja
Dragan Gnjatić, Mirela Abidović SalkicaUticaj tehnologije na odnos izme%u rada i nezaposlenosti
10
17
22
34
40
45
55
62
68

Dear reader,
By supporting the youth who want to engage in professional and scientific work, we have provided an opportunity for several young people to distinguish and promote themselves through their work, as well as to motivate others to take courage in their professional and scientific work.
The members of the Editorial Board are prompt and responsible in their approach to recognising originality and quality of the work done by authors, ensuring the value and creating an environment in which the magazine will be recognised.
Our Editorial Board would like to promote new values being discovered through research, to make the space available for research to all who have the potential to become visible in that area, and thus connect researchers through their ideas, results and discoveries.
We believe that the papers published in this issue will find their way to the readers and that they will be useful to other authors in their future work.
We would like to invite all of you who wish to be a part of our project, professional and research team to contact us, send your CV and a short cover letter to the e-mail address of the magazine, so as to familiarise ourselves with your spheres of interest. Through this call, we would like to strengthen our Team and provide a chance for people who would like to work, research and prove themselves in the area of technical sciences, as well as to provide a scientific contribution to that development.
Amra Tuzović, PhD Editor in Chief

Dragi čitatelju,
Podržavajući mlade ljude koji se žele baviti stručnim i naučnim radom, dali smo priliku nekolicini mladih da se svojim radovima istaknu i promovišu, te motivišu druge da se ohrabre u svom stručnom i naučnom radu.
Članovi recenzentskog odbora su ažurni i odgovorni u pristupu prepoznavanja orginalnosti i kvalitete autorskog djela čime žele osigurati vrijednost i stvarati okruženje u kojem će časopis biti priznat.
Naš urednički odbor želi da promoviše nove vrijednosti koje se otkrivaju kroz istraživanje, da učini dostupnim prostor istraživanjima svima koji imaju potencijal da u tom prostoru postanu vidljivi i da tako spajaju istraživače kroz njihove ideje, rezultate i otkrića.
Vjerujemo da će radovi objavljeni u ovom broju naći put do čitalaca i da će koristiti drugim autorima u njihovom budućem radu.
Pozivamo sve vas koji želite da budete dio našeg projektnog, stručnog i istraživačkog tima da nam se javite; pošaljete svoj CV na e-mail adresu časopisa i kratko motivaciono pismo kako bi znali vaše sfere interesovanja. Ovim pozivom želimo jačati naš Tim i pružiti šansu ljudima koji žele raditi, istraživati i dokazivati se u oblasti tehničkih nauka i dati stručni i naučni doprinos u tom razvoju.
doc. dr. sc. Amra TuzovićGlavna urednica

10
Techno ScienceInternational Scientific Journal of Technical Sciences
ADIS RAHMANOVIĆ
ABSTRACT
FACULTY OF TECHNICAL STUDIES, UNIVERSITY OF TRAVNIK, BOSNIA AND HERZEGOVINA
Managing water resources using information and communication technologies
Introduction
A wareness about the importance of water as a resource and its adequate use and management, regardless of all the challenges
from the aspect of deficiency and quality, is still not su'ciently developed and we must emphasise that it is not managed in the way that it represents not only a resource but also a blessing which can be taken away if we have an unsuitable relationship towards it, making life on this planet impossible. Therefore, a change of awareness from the aspect of using and managing the existing resources, among which we emphasise water, is becoming an imperative for sustainable development. Resource management is increasingly challenging due to the ever-growing need for it, a lack of the same, further development, an increasing cost of the stated resources, its usage possibilities, etc. In this context, the use of contemporary information and communication technologies in the function of optimal water resource management is applauded.
The purpose of this paper is to present the possibilities of applying information and communication technologies in the function of water resource management. Information and communication technologies record a significant development dynamics, so their application should be greater in the function of better management and use of the resources at our disposal, among which water plays an important role. For the management segment, apart from the analysis and planning process, the key role is to provide timely and accurate information, which is the primary task of information and communication technologies, and it is estimated that the application of ICT in the function of resource management will be increasingly used. Throughout the paper, apart from basic information on applied ICT technologies, an example of their application in the function of better water resource management is described.
Keywords: Information and communication technologies, application of ICT, resource management using ICT, sensors, digital switchboard, alarm panel, computer network, video surveillance, telemetry centre.
The possibilities of applying ICT technologies in the function of managing water resource quantity and quality are primarily seen in fast delivery of precise information, their analysis and undertaking adequate measures, so the application of ICT technologies represents only one of the measures necessary for managing water as a resource in the best possible way. We live in a time of change where the most significant change dynamics is seen in information and communication technologies, and it would be necessary to continuously observe and analyse the possibilities of applying them in the function of improving usage and managing the quality of life, and therefore managing the resources directly influencing not only the quality, but also their existence. The aim of improving and developing the water resource management process using ICT is to improve monitoring, speed and accuracy of information acquisition, and using them in real time, all in the function of more e'cient and e(ective management of this resource.

11
Techno ScienceInternational Scientific Journal of Technical Sciences
Water level visual surveillance mode of operation and over#ow alarmingIn the brown coal mine Banovići, a need for better water management arose due to the increasing necessity of both the drinking and technical water for their own use, as well as for other users utilising the stated infrastructure, and due to the appearance of landslides detected in the vicinity of the reservoir overflow which, in the experts’ opinion, could potentially impact the adequate reservoir overflow stream management. In order to remedy the consequences, it was important to alleviate the causes thatpossibly lead to them, so one of the suggestions was to try introducing ICT equipment and infrastructure, as well as improve the process of managing the water in the reservoir and thus, provide a greater amount of water in the system and remove the negative consequences. Equipment for visual control, surveillance and reservoir overflow alarming was installed and built in at the site of the brown coal mine Banovići water reservoir. At the relay station facility, an alarm-detection unit connected to a waterlevel sensor by a Cat6E UTP cablewas installed together with a warning light located at the water reservoir facility. In case of a reservoir overflow, the water level sensor enters the alarm state and signals the alarm unit which, through a GSM warning device, calls the previously memorised telephone number (pump station) and delivers a voice message that there is a high water level in the reservoir. An IP high resolution camera which visually monitors the water reservoir is installed in the water reservoir facility. The IP camera is connected to the network infrastructure in the relay station facility by a Cat6E UTP cable from where the video signal is, through the existing wireless network infrastructure, connected to the main network infrastructure of the brown coal mine Banovići. The pump station is also connected through a wireless infrastructure with the Čubrić warehouse facility and, in this way, it is linked with the main network infrastructure of the brown coal mine Banovići, thus enabling access to the camera installed at the water reservoir. Through the main network infrastructure, the telemetry department will also have visual surveillance for observing the water reservoir.
The main characteristics of water resource managementWater resource management is a process of managing a complex system where attention must be paid to a lot of parameters impacting the quantity and quality of the distributed water. The system contains a spring, water preparation and treatment plants, supply lines, distribution lines, filtering stations, pump stations, reservoirs, measuring points and access points for connecting end users. In order to manage such a system, it is necessary to provide a series of precise real-time information from di(erentparts of the system, coordinate activities and undertake preventive and corrective measures.
Through an implemented example, this article aims at illustrating how applying contemporary ICT technologies on a restricted segment of reservoir management canprovide timely and accurate information and e'cient and e(ective management with the goal to rationally use and save water resources.
The implemented ICT technologies can also be used in the function of introducing systematic water resource surveillance and management which would surely contribute to more significant results, both in economic benefits, and in saving the increasingly important clean water resource. The following shows a visual surveillance system for observing the water level and overflow alarming, implemented for monitoring and control in large reservoirs of water inflow and outflow. The example presents not only the application possibilities, but also the benefits arising from implementing such projects, as well as a potential for systematic usage and implementation of ICT equipment and infrastructure in the function of more e'cient and e(ective resource management.
Due to the high intensity of changes in the field of ICT, it is necessary to continually improve the possibilities of applying them in the function of preserving and using available resources in a better way.

12
Techno ScienceInternational Scientific Journal of Technical Sciences
Image 1: The schematics of water #ow and water accumulation surveillance, management and control
The connection mode for the pump station and reservoir, as well as the telemetry centre, pump station and the reservoir, using the implemented
ICT infrastructure and ancillary facilities, is shown in the following image.
Using such a way to manage the water flow is shown in the following steps:
1. In case the water level in the reservoir reaches the overflow point, the sensor detects the water level and warns the unit which, through a GSM warning device, calls the control station (pump station Čubrić), as well as the telemetry centre Bešin.
2. In addition to the telephone signal, there is a signal warning in the pump station facility and the water level in the reservoir is monitored in real time through video surveillance in the telemetry centre.
3. Upon receiving the telephone call with the message “high water level” being heard,
the pump is shut down by signalling, an additional call.
4. After the pumps are shut down, they are not restarted until the water level drops below the sensor detection level.
5. When the water level drops below the limit covered by the sensor, the alarm unit returns to the idle state until the next rise of the water level in the reservoir.
6. At the reservoir site, apart from the alarm unit and ancillary equipment which is designated to call, i.e. report that there is an overflow, that is, to state that the water reservoir inflow should be shut down, an IP camera transmitting a video signal to the telemetry centre is installed, enabling monitoring of the water level in real time.
DIGITAL SWITCHBOARD
SENSOR
IP
CAMERA
RESERVOIR ALARM PANEL
WARNING DEVICE
RELAY STATION
CONTROL / SURVEILLANCE
TELEMETRY CENTRE
COM.
MOBILE POWER-UP/SHUTDOWN
PUMP STATION
DISPLAY SENSORS
COMPUTER NETWORK
WAREHOUSE

13
Techno ScienceInternational Scientific Journal of Technical Sciences
ICT equipment and infrastructureWithin the above mentioned company where the described case study was implemented, there is a series of information systems and ICT services communicating through the implemented ICT infrastructure, so, for the purpose of managing the reservoir function and water flow at the stated location, a large part of the existing ICT infrastructure was used, greatly reducing investments and stating its justification. Brown coal mine Banovići has a telemetry centre for managing the production process, so the existence of the equipment and personnel at the telemetry centre was used for introducing water state monitoring in real time through implementing a part of the equipment, as well as the option of surveying and coordinating the activities with the pump station related to the water flow management process and possible overflow.
A better part of ICT computer network infrastructure, optical, Ethernet and wireless technology which was established between and within buildings was used to implement the project managing and monitoring the reservoir water level in real time. In addition to the computer network infrastructure and associated cabinets, backup power supply systems were implemented through UPS, as well as protection against atmospheric and switching overvoltage.
7. The real-time system indicates the water level in such a way that, in case of an overflow detection by the camera which forwards the information in video format to the telemetry centre in Bešin, those on call at the organisational unit (OU) Površinska should telephone the supervisor at the pump station Čubrić in case the overflow is not stopped in a short period of time (e.g. several minutes).
8. Through this integral solution, apart from the insight into the state of the reservoir by both informing the pump station via an automatic call and monitoring the state in real time at the telemetry centre, the ability to communicate between the telemetry centre and the pump station Čubrić is provided.
Image 2: Water level sensor
Image 3: IP video camera for visual surveillance
The water level sensor is placed in the reservoir at the position for detecting an overflow, functioning as a detection device for water appearance at the position after which excess water will appear in the reservoir and overflow, being lost in the system. Through the Ethernet infrastructure and Cat6E STP cable, it is connected for transferring information and powered by the Power over Ethernet module. It is important that the sensor is implemented in line with the protection standards, including the IP67 standard, in order to provide dust and water protection which can negatively influence its functionality and a(ect the safety of people with access to the reservoir, At the reservoir site, an IP video camera is installed and connected to the relay station by using Ethernet, and, throughthe Wi-Fi AC standard compatible APs, it is connected to the building where the telemetry centre is located, enabling monitoring of the water level in real time.
The relay station site is, apart from installing and powering the below stated devices, also used for establishing a data transfer connection through a Wi-Fi connection towards the telemetry centre and a GSM/3G signal towards the pump station Čubrić. Apart from this connection, the existing ICT infrastructure (optics-Ethernet) is used between the telemetry centre and Čubrić warehouse from where the Wi-Fi connection is implemented towards the pump station Čubrić.

14
Techno ScienceInternational Scientific Journal of Technical Sciences
Based upon the information delivered by the video surveillance, it is possible to configure a warning system and manage it in real time through a mobile or radio connection. In addition to the IP67 standard, it is important to provide the standard IK10 protection against mechanical impacts for the IP camera in order to minimalize the negative e(ects of vibration and extend its operating lifetime. In case the IP camera is disconnected or the connection with the computer network is severed for whatever reason, there is a possibility of saving the content on a Micro SD/SDHC/SDXC card, with the corresponding memory even up to 128 GB.
The IP camera is chosen in such a way that it can operate in real, extreme temperature conditions, that it has the option of high-quality recording even in reduced visibility conditions (IR diodes), as well as that is supports H.264/MJPEG video compression standards for compatibility with reproduction and recording devices. At the location where real-time data necessary for the telemetry surveillance is recorded, saving and backup is conducted at the defined time of the video produced by the camera recording the state of the water in the reservoir. Introduction of GSM/3G communications provides communication between the transmitter, switchboard, telemetry centre and pump station.
Image 5: Audible warning device
The alarm panel continuously monitors the state, connects to the sensor on one side and, on the other side, to the warning device to which it forwards the information when it needs to be activated. Upon receiving the information by the alarm-warning panel, the audible warning device calls the predefined numbers and sends generated messages stating that the water rose to the monitored level and what the operator should do. The audible warning device could be programmed to perform several functions and it can generate multiple di(erent messages which are most frequently used in the function of protecting material goods in its immediate vicinity.
Bene$ts from ICT usage in water resource managementThe value of clean water as a resource, both because of the increasing demand and due to the ever growing number of negative “contamination” e(ects, is becoming all the more pronounced, so managing such a resource not only provides economic benefits but also becomes an imperative for the sustainability
of life on earth since clean water represents one of the prerequisites for life on earth, not just for people, but generally, for life on our planet. Application and implementation of ICT equipment and infrastructure on a relatively small project have clearly produced the following results. In relation to the previous period of providing the service to the same number of users, the demands were lowered by approximately 25 percent which could be redirected towards building a water supply network and supplying an additional number of users with clean water. In addition to the satisfaction expressed by new users for having access to drinking water, the existing users have had regular water supply, even during the period when water shortages used to happen. It is clear that, in the water supply system for the end users, there was an additional 25% of water which could have been charged, so the whole investment in introducing ICT technologies in the water resource management process has, for the illustrated example, provided an economic benefit from the 25% of chargeable water, which is the basic measure for economically assessing an investment, resulting in the fact that it was paid according to the payment dynamics for the period spanning 14 months.
Image 4: Alarm panel

15
Techno ScienceInternational Scientific Journal of Technical Sciences
Apart from social and economic benefits, benefits are also expressed through an increase of responsibility from the aspect of management representatives, improved communication and an insight into everyday activities, the delivery of timely and accurate information for making the right decisions which can later be used for needs analysis, further planning and introducing improvements, etc. In addition to the stated benefits, the landslide problem is solved, and its further escalation could have caused significant damage for both the transportation infrastructure and ancillary facilities which would, apart from impacting the everyday life of citizens and the economy, cause great material damage that would have to be repaired and there would be legal repercussions for those held accountable.
We can only imagine the results that would arise from the introduction and adequate usage of ICT equipment and infrastructure, as well as telemetry surveillance and management into the water resource management systems where a larger amount of water resources are at disposal and it is necessary to manage several parameters and at several points starting from the spring to the end user, both in terms of quantity and quality. When it comes to quality measures, if we would implement certain sensors for measuring quality and design real-time information distribution, we could act in case the water quality is below the expected level and undertake corrective steps, but if we acquired the information on time, we could also undertake some corrective steps, add a corresponding additive measure, etc. and avoid minimal water distribution below the quality defined by the standards. In this way, apart from the stated responsibility towards the system users for providing them with the quality and quantity of the agreed upon service defined by the contract, we protect the health of the end users which is of immeasurable significance, and ultimately, we can provide drinking water to a larger number of people and living beings which is, even if we exclude the above mentioned benefits, in a way some sort of mission and obligation.
By applying data in the analysis and planning process, we can obtain significant savings and benefits both in the optimal planning and in the process of managing these resources in real time.
If we introduce the practice of implementing the best technical solutions in this area and raise awareness of both the end users and public goods concession holders, we could reach the goal of rational consumption and usage of water and other resources which would ultimately result in improving the quality of life, a sustainable development in this implementation segment, cost-e(ective solutions, a larger number of satisfied users, etc. Introducing automation technologies and artificial intelligence in certain segments would further emphasise all of the above stated benefits, both in the short-term and long-term. From the above illustrated example, it is clear that a series of negative consequences can arise by inadequate water resource management, including landslides, and by applying the most e(ective practices, methods and management techniques, it is possible to avoid unprecedented consequences, both material, those impacting the flora and life in general. What is continuously needed is building and developing awareness of not only the end users, but also people responsible for exploiting water resources, both through stimulative and penal policy in order to place the relationship towards the resources (blessings) put at our disposal and in our custody at a higher level on a daily basis.
Concluding remarks• Due to the importance of managing water
and other resources, it would be necessary to implement certain legal and incentive legislations that would encourage the introduction and use of ICT technologies and a contemporary management concept.
• On a simplified example, it is clear that the social benefits are seen in a larger number of users with access to water, and the economic ones are seen through savings and collecting more funds, avoiding potential damage, a prospect for a better analysis and planning, preserving resources and complying with the element of sustainable development.
• By introducing a larger number of di(erent sensors, actuators and automating the process in a certain segment of artificial and business intelligence, the systems could be provided with complete manageability, both in real time and in the process of analysis and planning.

16
Techno ScienceInternational Scientific Journal of Technical Sciences
References1. DSC PowerSeries PC1404, (2012), Specifikacija alarmnog panela, DSC.2. DSC Security products, (2016), Protuprovalna centrala PC 585 - upute za upotrebu, Alarm automatika.3. HIKVision, (2014), Specifikacija primjenjene IP kamere, HIKVISION.4. Rilevatore di liquidi, (2017), Specifikacija senzora vode, Italija.5. Internet.
Upravljanje vodenim resursima koristeći informaciono komunikacione tehnologije
Received: October 18, 2018 / Accepted: November 16, 2018Correspondence to: Adis Rahmanović, PhD, University of Travnik, Faculty of Technical Studies, Travnik, Bosnia and HerzegovinaE-mail: [email protected]
Ključne riječi: infomaciono komunikacione tehnologije, primjena IKT-a, upravljanje resursima koristeći IKT, senzori, digitalna centrala, alarmni panel, računarska mreža, video nadzor, telemetrijski centar
• By examining the above stated benefits of adequately using ICT technologies in the water resource management process, we can conclude that they are manifold, both for the state, the manager and water resource distributer, as well as for the end users, not only through a cheaper and more available litre of drinking and technical water,
but also due to the possibility of providing more e(ective water delivery.
• It is necessary to continuously work towards developing the awareness of all the actors starting from the state, concession holders and end users through the legislation, incentives, the media, providing positive examples of its application, etc.
SAŽETAKZadatak ovog članka je prikazati mogućnosti primjene informaciono komunikacionih tehnologija u funkciji upravljanja vodnim resursom. Informaciono komunikacione tehnologije bilježe načajanu dinamiku razvoja,pa bi primjena istih morala biti veća u funkciji boljeg upravljanja i korištenja resursa koji su na nam na raspolaganju, me)u kojima voda imaznačajnu ulogu. Za segment upravljanja osim postupka analize i planranja, ključnu ulogu ima dostavljanje pravovremnih i tačnih informacija, što informaciono komunikacionim tehnologijama je prvoshodni zadatak, te je procjena da će primjena IKT-a u funkciji upravljanja resursima se sve više koristiti. Kroz članak su osim osnovnih informacija o primjenjenim IKT tehnologijama opisan i primjer primjene istih u funkciji boljeg upravljanja vodnim resursom.

17
Techno ScienceInternational Scientific Journal of Technical Sciences
HRUSTEM SMAILHODŽIĆ, ALMIR BEČIROVIĆ, AZRA BEČIROVIĆ, ADMIR ŠUPIĆ
ABSTRACT
FACULTY OF TECHNICAL STUDIES, UNIVERSITY OF TRAVNIK, BOSNIA AND HERZEGOVINA
Broadening of stellar spectral lines due to the thermal motion of atoms
Kinetic theory of gases
Starting from a simple model, the kinetic theory of gasses quantitatively describes the behaviour and properties of gasses, connecting
the macroscopic properties of gasses (e.g. pressure and temperature) with their microscopic properties (e.g. mass, diameter and velocity). It allows constructing an equation of state, molecular velocity distribution, and gas heat capacity values without considering the quantum e(ects, and, among other things, it also enables us to understand thermodynamic properties on a molecular level. Through e'cient collision cross sections, it enables us to calculate the number of collisions and the mass and energy velocity distributions, as well as the angular momentum for the ideal gaseous state.
The only information we receive from the stars is their radiation. By studying this radiation with the help of spectroscopic methods we can be familiarised with the physical characteristics of stars. One of the extremely important tasks of spectroscopy is to study and analyse the spectral line profiles. Astrophysics observes starlight, i.e. the frequency of the light, which implies the application of the Doppler e(ect on electromagnetic waves. Doppler broadening of spectral lines is the consequence of thermal, chaotic motion of atoms (absorbers/emitters). It is the result of the Doppler e(ect, i.e. the apparent change of the absorbed radiation wavelength in relation to the radiation wavelength absorbed/emitted by the atom moving relative to us as observers. In case of thermal motion, in the approximation of the local thermodynamic equilibrium, we deal with the Maxwell distribution. Maxwell distribution of molecules by velocities is a Gaussian curve identical to the intensity distribution in Doppler broadening. We will demonstrate that the half-width of spectral lines is directly proportional to the temperature and wavelength, and inversely proportional to the emitter’s mass. This means that, for heavier emitters (higher atomic number), the broadening of lines arising from the Doppler e(ect will be less pronounced, but it will be more prominent for warmer stars.
Keywords: Doppler broadening, Kinetic theory of gases, Spectral analysis in astronomy, Line spectrum, Stellar spectrum
Gas molecules have a chaotic motion in all the courses and directions. Each of the gas molecules moves with a certain velocity intensity, and each one’s velocity changes in time. In addition, a change in velocity also occurs after a collision with the walls of a container when their speed depends upon the intensity and velocity direction before the collision. Even if all the molecules had the same velocities before the collision, they will subsequently have diverse velocities, especially since the small gas volume contains a large number of molecules, so the collision frequency is greater. In 1860, Maxwell concluded that, regardless of the disorganised movement and diverse velocity values of the molecules, there is still a proper distribution of molecules by velocity.

18
Techno ScienceInternational Scientific Journal of Technical Sciences
Using statistical methods, he deducted a law of molecule distribution by velocities. Molecule distribution by velocities depends upon temperature. Heating gas increases the kinetic energy, i.e. molecular velocity. Based upon the distribution function, we will notice that when the temperature increases, the value of the most probable velocity also increases, but the number of molecules having precisely that velocity decreases. In addition, heating increases the number of molecules with large velocity values. This new representation did not signify a rejection of the previous thermodynamic concepts, but a better basis for thermodynamics in explaining observations and experiments. In real gasses, the velocities of individual molecules encompass a wide area, with constant collisions which continually change the molecular velocities. Maxwell has demonstrated that the distribution of molecules by velocities can be shown through an analytic equation:
Spectral analysisin astronomyThe main source of information on objects outside the Solar System is their light that reaches Earth. Since light represents electromagnetic waves, based upon electromagnetic radiation emitted from or reflected o( celestial bodies, we can obtain data regarding the position, movement of celestial bodies, their chemical composition, temperature, etc. Distribution of radiant energy over wavelengths in the stellar spectra is specified in Wien’s displacement law.Intensity and the profile of the spectral line depend upon various factors such as:
• temperature - determines the wavelength
• particle concentration determining the Doppler broadening of the spectral line
• the strength of the present magnetic and electric fields which cause the Zeeman e(ect and Stark broadening
• the macroscopic movements in the object
Identifying the chemical composition of cosmic objects is performed by comparing their line spectra with the laboratory-obtained spectra of the known elements. This method is called spectroscopic or spectral analysis of the celestial body, implying the determination of the celestial body’s main characteristics on the basis of comparing electromagnetic radiation emitted from the body with the emission and absorption spectra of the known substances. Spectral analysis is a contactless method enabling the identification of the cosmic substance’s chemical composition.
Line spectrumThe emission line spectrum occurs by emitting photons from the stimulated electrons during de-excitation in superheated gasses. As opposed to the continuous spectrum, the line spectrum occurs in greatly-diluted gasses. Radiation that is then emitted represents the radiation in the form of bright emission lines corresponding to the atoms of a substance. The lines are superposed on the continuous radiation generated simultaneously.The line spectrum, i.e. the intensities, positions and mutual distances between its lines provide specific characteristics of each atom. One atom emits or absorbs photons of the same wavelength. Atomic spectra of a certain element created in the Cosmos must coincide with the laboratory-obtained spectra of the same atoms.
Image 1: Balmer lines a and ß are clearly visible in the continuous emission spectrum of radiation.
Stellar spectrumFor stars, the continuous spectrum is emitted from the photosphere, i.e. a star's outer shell. The absorption spectrum occurs in the colder layers of a star’s atmosphere, in the cold clouds of the interstellar gas or in the planet’s atmosphere.

19
Techno ScienceInternational Scientific Journal of Technical Sciences
At the continuous spectrum of the photosphere we can, in certain cases, detect bright emission lines when the continuous radiation passes through the layers of atmosphere which are warmer than the photosphere.
The Doppler e&ectThe Doppler e(ect is the appearance where, due to the radial movement of emitters in relation to an observer, there is an apparent change of the emitted wavelength towards the red (in case the emitter is moving away) or towards the blue (in case it is approaching) (Image 2). This e(ect enables us to calculate the emitter’s radial velocity.
Image 2: Red and blue shifts.
A direct consequence of the Doppler e(ect is seen in the Doppler broadening of spectral lines occurring due to the thermal, chaotic motion of atoms in gasses, as well as because of the turbulent movement of atmospheric masses or gas clouds. In a substance, atoms move in di(erent directions and at di(erent velocities, and their kinetic energy depends upon the temperature of the matter. This thermal, chaotic motion of atoms emitted at a certain wavelength results in the fact that the lines will have a certain width, i.e. they will be broadened towards the red (atoms moving away from us) and towards the blue (atoms moving towards us) in relation to the central frequency.
Thermal Doppler broadeningAs previously stated, Doppler broadening is a consequence of the thermal motion of atoms (absorbers/emitters).
It is the result of the Doppler e(ect, i.e. the apparent change of the absorbed radiation wavelength in relation to the radiation wavelength absorbed/emitted by the atom moving relative to us as observers. At the moment of absorption/emission, some atoms move towards the observer and some move away from them, and the change, being negative in the first case, is positive in the second. Wavelength (frequency) displacement originating from the atom with a radial velocity of vr is provided by the Doppler formula:
Since radiation from a large number of atoms moving in di(erent directions and with di(erent vr is received, the broadening of spectral lines will occur. Even if atoms were to absorb/emit radiation only on a central frequency f=f0 in the line (neglecting the final width of the energy levels), the observer will perceive the radiation in its final frequency band.
Distribution of atoms by radial velocities is the Maxwell distribution described in detail in the previous chapter, represented by:
In order to calculate the Doppler broadening of lines occurring as a consequence of the particles’ thermal motion, we will assume that the distribution of particle radial velocities is the Maxwell distribution, described in detail in the previous chapter:
where the most likely velocity is:
The line width will then be equal to:
By observing the above formula, we can see that the Doppler width of spectral lines is proportional to the central frequency, resulting in the fact that the thermal Doppler broadening e(ect is more prominent in lines with higher frequencies.
20
Techno ScienceInternational Scientific Journal of Technical Sciences
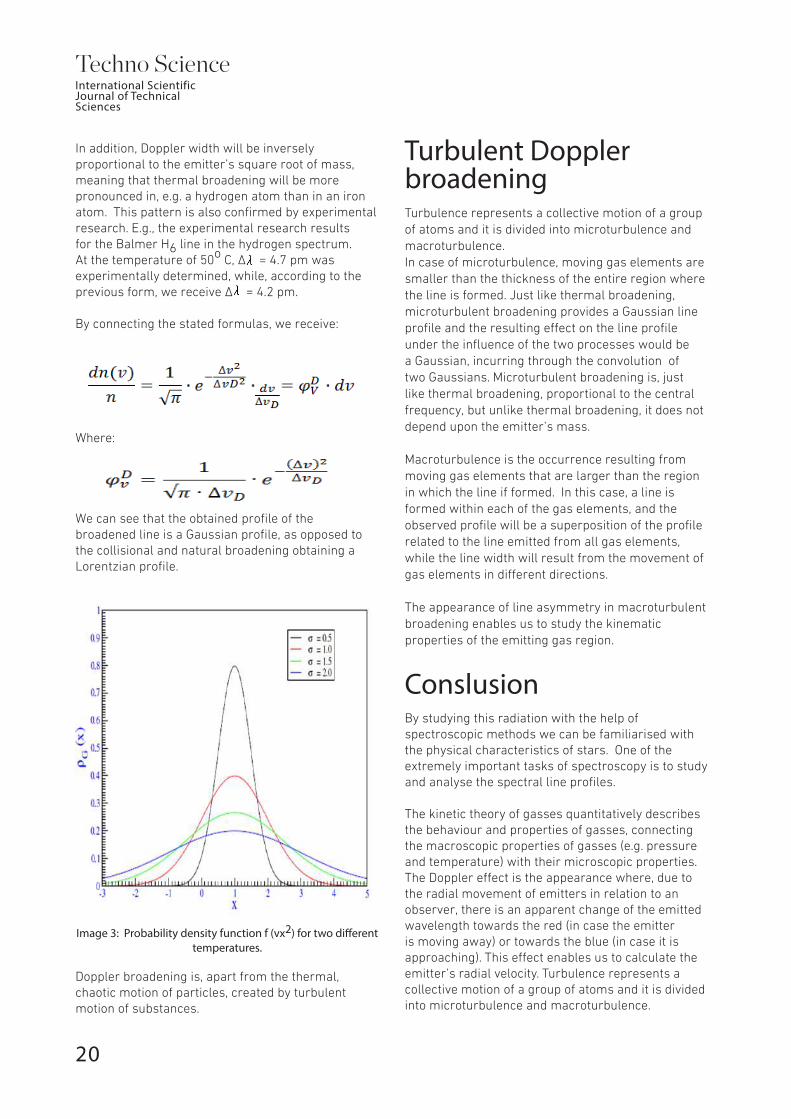
In addition, Doppler width will be inversely proportional to the emitter’s square root of mass, meaning that thermal broadening will be more pronounced in, e.g. a hydrogen atom than in an iron atom. This pattern is also confirmed by experimental research. E.g., the experimental research results for the Balmer H6 line in the hydrogen spectrum.At the temperature of 50o C, ∆ = 4.7 pm was experimentally determined, while, according to the previous form, we receive ∆ = 4.2 pm.
By connecting the stated formulas, we receive:
Where:
We can see that the obtained profile of the broadened line is a Gaussian profile, as opposed to the collisional and natural broadening obtaining a Lorentzian profile.
Image 3: Probability density function f (vx2) for two di&erent temperatures.
Doppler broadening is, apart from the thermal, chaotic motion of particles, created by turbulent motion of substances.
Turbulent Doppler broadeningTurbulence represents a collective motion of a group of atoms and it is divided into microturbulence and macroturbulence. In case of microturbulence, moving gas elements are smaller than the thickness of the entire region where the line is formed. Just like thermal broadening, microturbulent broadening provides a Gaussian line profile and the resulting e(ect on the line profile under the influence of the two processes would be a Gaussian, incurring through the convolution of two Gaussians. Microturbulent broadening is, just like thermal broadening, proportional to the central frequency, but unlike thermal broadening, it does not depend upon the emitter’s mass.
Macroturbulence is the occurrence resulting from moving gas elements that are larger than the region in which the line if formed. In this case, a line is formed within each of the gas elements, and the observed profile will be a superposition of the profile related to the line emitted from all gas elements, while the line width will result from the movement of gas elements in di(erent directions.
The appearance of line asymmetry in macroturbulent broadening enables us to study the kinematic properties of the emitting gas region.
ConslusionBy studying this radiation with the help of spectroscopic methods we can be familiarised with the physical characteristics of stars. One of the extremely important tasks of spectroscopy is to study and analyse the spectral line profiles.
The kinetic theory of gasses quantitatively describes the behaviour and properties of gasses, connecting the macroscopic properties of gasses (e.g. pressure and temperature) with their microscopic properties.The Doppler e(ect is the appearance where, due to the radial movement of emitters in relation to an observer, there is an apparent change of the emitted wavelength towards the red (in case the emitter is moving away) or towards the blue (in case it is approaching). This e(ect enables us to calculate the emitter’s radial velocity. Turbulence represents a collective motion of a group of atoms and it is divided into microturbulence and macroturbulence.

21
Techno ScienceInternational Scientific Journal of Technical Sciences
References1. Dragiša M.Ivanović; Vlastimir M.Vučić. (1989), Atomska i nuklearna fizika, Beograd.2. Nenad Milovanović (2001), Doprinos Štarkovog širenja interpretaciji spektara CP zvijezda, Beograd.3. Dejan Raković (2008), OSNOVI BIOFIZIKE, Beograd .4. Ana He)i (2016), Doplerov efekat i njegove primjene, Osijek5. Zvonko Glumac (2016), Statistička fizika kratak uvod, Zagreb.6. A. Čerkić, S. Odžak, D. Hadžiahmetović (2012), Statistička fizika, Sarajevo.7. D. K. Sunko (2016) Statistička fizika i termodinamika, Zagreb.
Širenje spektralnih linija zvijezda uslijed termičkog kretanja atoma
Received: October 21, 2018 / Accepted: November 17, 2018Correspondence to: Almir Bečirović, University of Travnik, Faculty of Technical Studies, Travnik, Bosnia and HerzegovinaE-mail: [email protected]
Ključne riječi: Dopplerovo širenje, Kinetička teorija gasova, Spektralna analiza u astronomiji, Linijski spektar, Spektar zvijezda
Jedina informacija koja nam dolazi sa zvijezda predstavlja njihovo zračenje. Proučavanjem ovog zračenja spektroskopskim metodama, možemo se upoznati sa fizičkim karakteristikama zvijezda. Jedan od veoma važnih zadataka spektroskopije predstavlja proučavanje i analizu profila spektralnih linija. U astrofizici se posmatra svjetlost zvijezda, odnosno frekvencije te svjetlosti, što podrazumjeva primjenu Dopplerovog efekta na elektromagnetne talase. Doplerovo širenje spektralnih linija je posljedica termalnog, haotičnog kretanja atoma (apsorbera/emitera). Rezultat je Doplerovog efekta, tj. prividne promjene talasne dužine primljenog zračenja u odnosu na talasnu dužinu zračenja koje apsorbuje/emituje atom koji se kreće u odnosu na nas kao posmatrača. U koliko je riječ o termalnom kretanju, u aproksimaciji lokalne termodinamičke ravnoteže raspodjela je Maxwellova. Maxwellova raspodjela molekula po brzinama je Gaussova kriva i identična je kao raspodjela intenziteta kod Doplerovog širenja. Pokazat ćemo da je poluširina spektralnih linija direktno proporcionalna temperaturi i talasnoj dužini a obrnuto proporcionalna masi emitera. Što znači da će za teže emitere (veći atomski broj) širenje linija uslijed Doplerovog efekta biti manje izraženo dok će za toplije zvijezde ono biti izraženije.
SAŽETAK

22
Techno ScienceInternational Scientific Journal of Technical Sciences
IFET ŠIŠIĆ
ABSTRACT
UNIVERSITY OF BIHAĆ, BOSNIA AND HERZEGOVINA
A modi$ed SPACE Method for Determining the Product and Market Position of the Industrial Product on an Example of Raw Material Grinding Machines
Possible Modi$cation of the SPACE (Spatial) Matrix
The market di(erentiation process for products and technologies specifies the course of achieving a favourable market position through
the company’s business reputation and the brand of the industrial product. Di(erentiation elements rely on the dimension of product design, essence, quality,
The SPACE (Strategic Position and Action Evaluation) method is an analytical technique used in the companies’ strategic management and planning, encompassing the object of analysis through two internal dimensions (financial strength and competitive strength) and two extreme dimensions (environmental stability and industry strength) [3,5,7]. The analysis evaluates the internal and external environment in order to obtain an appropriate idea regarding the business strategy and development directions of a company [2, 6]. By modifying the methodological flows of the SPACE method and in accordance with the research problem, as well as by selecting the assessment dimensions and a set of parameters encompassing each of the four selected dimensions, the paper has, on an example of grinding machines, identified its position from the aspect of technical, technological, cost-related and environmental parameters. In the subsequent analysis, in order to strengthen the decision on machine assessment, additional criteria for assessing the machine were introduced, taking into account the three most significant parameters from each group. Apart from the raw material grinding machines, the modified SPACE method enables the analysis of machine manufacturer’s references or those belonging to the industrial plant for raw material processing, and the obtained assessment data can be used by investors and companies for making decisions on procuring a new machine (facility), as well as reconstructing or modernising the existing one.
Keywords: parameters, dimensions, matrix, assessment, decision-making
shaping, product price and brand [2, 3]. Determining the strategic position of [1]: 1.The grinding machine manufacturers and technology holders from the area of the mining and machinery industry and 2.The grinding machine as an industrial product.

23
Techno ScienceInternational Scientific Journal of Technical Sciences
The method for determining the strategic position is actually a modified SPACE matrix which could not have been applied in its original form for assessing grinding machines because:
- the vector directions illustrate only two variables in the coordinate system,
- we are determining the strategic position of an industrial branch, i.e. financial strength and competitive advantage of a business, the strength of the company’s branch and
- of the stability of the surrounding business environment.
It represents a useful methodological analysis whose result can complement the decision making process regarding machine selection.
New Dimensions as the Basis for Conducting the AnalysisThe SPACE matrix is based on 4 dimensions (factors): the environment, advantages or strengths, market or competitive position and the company’s financial position [2, 7]. Upon professional methodological modification, the new matrix has four dimensions through which we obtain the corresponding fields. Namely, the modified SPACE matrix of an industrial product and its manufacturer is based on four dimensions or variables [1]:
the first, competitive advantage or market position, TrDthe second, economic dimension, EDthe third, technological dimension, TeDthe fourth, dimension of maintenance and environmental protection, Doe
These dimensions illustrate the stability and strategic determination of the position (vector directions) related to several machine manufacturers (or machines) on the basis of set criteria expressed through the values of parameters and dimensions (points) plotted on the coordinates. Based on this,we can recognise the di(erences in field surface sizes and vector directions, and therefore, the strength of the strategic position. Through preliminary and experimental research, we obtained significant indicators (as seen throughout the example) based upon which we can assess and select the machine manufacturer or the grinding machine, depending on how the analysis parameters
are placed on the dimensions (groups). Within each dimension, we review and select the parameters which we can assess and which, by their nature, mostly belong to that dimension and realistically reflect each one.
Considering the importance of this methodological analysis and the method of valuating the machine as an industrial product, as well as defining the competitive position of a machine manufacturer in relation to others, additional research could be directed towards the prominent world manufacturers, creating favourable conditions and a basis for quality application of the method.
In all the methods, we can detect certain steps and gradation, so the strategic position method for machine manufacturers or the machine as an industrial product will have several steps.
A group of experts, engineers and economists participate in creating the parameter list for all four dimensions, alongside a recommendation that another “freely chosen expert” with a general education profile participates as a member.The classification of parameters according to importance in each group, as well as the selection of three preferential parameters from each group is determined in the same way. During their work, an expert or a group of experts use the documentation according to the tasks of the analysis (the project task) in consultation with the client, as well as parameters and indicators from the manufacturer’s o'cial documentation, professional newsletters, statistical reports, technical documentation and those obtained in other ways. The method enables parameter processing in a graphic and analytic way.
Designing a Parameter List According to the Dimensions
The approach to Method Development with Research DirectionsThe procedure in the modified SPACE method takes place in four stages:• specifying the four dimensions of the area
with field and direction determinants where the grinding machine’s graphic position can be identified in relation to the chosen dimensions,

24
Techno ScienceInternational Scientific Journal of Technical Sciences
• drawing the coordinate system with the axes (+x, -x, + y, -y ) and plotting the dimensions: competitive advantage or market position TrD, economic dimension ED, technological dimension TeD, and the fourth dimension of maintenance and environmental protection Doe,
• quantifying (valuating) the dimensions and determinants, and
• defining the product position of the grinding machine and determining the strategic direction for making a decision on machine assessment.
The research on method application was conducted in two directions, namely:a) preliminary research andb) experimental research
The operational analysis according to preliminary and experimental results is reflected in the following steps [1]:
1. establish a set of parameters (factors), VpNs (min. 5), included in the 4 dimensions,
2. rank the variables from 1 to 10 in the corresponding dimension of the matrix system,
3. calculate the variable values for all dimensions according to the provided formulae,
4. add the obtained scores individually for each dimension and calculate average mean values,
5. the average score values for all 4 dimensions have to be plotted on the corresponding axes in the matrix, obtaining 4 points with a position in the x and y axes,
6. by connecting the four points we obtain a corresponding geometrical form with four characteristic fields (max. and min.) marked by di(erent crosshatch lines and vector directions of the dimensions,
7. from the intersection point of the x and y matrix axes we draw vector directions with the corresponding points uncovering the strategic positions of machine manufacturers, machines or processing facilities.
The field sizes with vector directions provide the characteristics of positions for the four dimensions, specifying certain advantages among the machine dimensions. Depending on the size (surface area)
of the fields I, II, III and IV, according to the demand set by the buyer or investor, a preference for the analysed criteria i.e. dimensions is established, following the selection of a machine or facility[1]. The procedure is conducted in several “samples”.
Image 1. Matrix of the indicator assessment plan showing ±6 points (ideal $elds) and ±1 point (critical $elds)
The meaning of abbreviations:TrD- market dimensionED- economis dimensuonTeD- technological dimensionDoe- dimension of maintenance an environmental protection
Characteristics of the fields I, II, III and IV (Image 1.) give priority to one of the valuated dimensions in relation to the other ones (ranking). Those are indicators functioning as logical combinations of the following [1]:• cost-e(ectiveness, as a combination of the TrD
and ED dimensions,
• productivity, as a combination of ED and TeD dimensions,
• e'ciency, as a combination of TeD and Doe dimensions, and
• competitiveness, as a combination of TrD and Doe dimensions.
Examining the Grinding Machine’s PositionAccording to the modified SPACE method, the intensity of dimensions is estimated according to the set 6-degree scale where 1 is the lowest and 6 is the highest score for the (TrD) and (ED) values, while -6 is the lowest and (-1) the highest score for (TD) and (Doe).

25
Techno ScienceInternational Scientific Journal of Technical Sciences
Within each dimension, we have parameters which have to be reviewed and assessed, and which, by their nature, mostly belong to that dimension of the machine or facility. In order to consider the impact of each parameter, we introduce the so-called weighting coe'cients kt so as to, by using the weighted values of parameters, decrease subjectivity of participants during the application of the modified method for machine assessment. Then, the corrected value of awarded points (PNke) will be relevant for determining the rank of each selected indicator from the dimension Dn, which is important in the process of machine assessment.
It is assumed that the sum of all weights for one dimension is 1, and the total indicator for the given dimension is equal to the sum of weighted assessments for each variable. 10 significant parameters have been chosen for each of the dimensions (economic dimension ED, technological dimension TeD, competitive advantage or market position TrD, and the dimension of maintenance and environmental protection Doe). A representation of the established table matrices with an overview of valuation results for the four assessment dimensions of the machine as an industrial product [1]:
MATRIX DIMENSION RANKCompetitive advantage of the machine and manufacturer, market dimension TrD
PARAMETER niN
Description Point value Vpi
Description
1. Market competitiveness and participation in machine production 1 small 123456 high
2. Quality of the industrial product 123456 2 good extremely good
3. Technology and experience 3 exists 123456 noticeable and strong
4. References 4 common 123456 considerable
5. Compatibility and modularity
6. User satisfaction with the machine
7. Competitive strength development
5
6
7
di'cult to accomplish
good
weak
123456
123456
123456
123456
123456
123456
possible and feasible
commendable
strong
8. E(ective advancements, success in product designing
9. Modernisation
10. Degree of vertical integration
8
9
10
limited
limited
classic
possible
applied
functional
RESULT PNk 38 points
Classification of parameters according to importance
Table 1
26
Techno ScienceInternational Scientific Journal of Technical Sciences
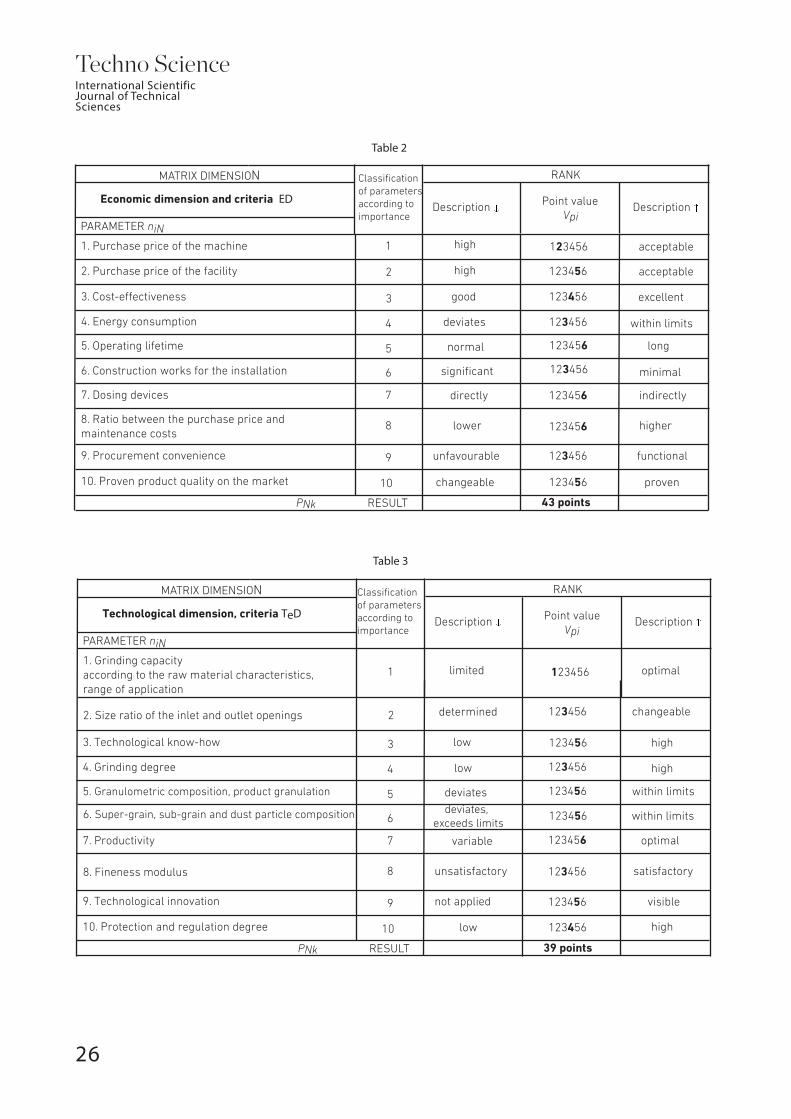
MATRIX DIMENSION RANK
Economic dimension and criteria ED
PARAMETER niN
Description Point value Vpi
Description
1. Purchase price of the machine 1 123456high
2. Purchase price of the facility 123456 2
good
acceptable
3. Cost-e(ectiveness 3 123456 excellent
4. Energy consumption 4 123456 within limits
5. Operating lifetime
6. Construction works for the installation
7. Dosing devices
5
6
7
123456
123456
123456
123456
123456
123456
long
minimal
indirectly
8. Ratio between the purchase price and maintenance costs
9. Procurement convenience
10. Proven product quality on the market
8
9
10
higher
functional
proven
RESULT 43 points PNk
high
deviates
normal
significant
directly
lower
unfavourable
changeable
acceptable
MATRIX DIMENSION RANK
Technological dimension, criteria TeD
PARAMETER niN
Description Point value Vpi
Description
1. Grinding capacityaccording to the raw material characteristics, range of application
1 123456limited
2. Size ratio of the inlet and outlet openings 123456 2
low
optimal
3. Technological know-how 3 123456 high
4. Grinding degree 4 123456 high
5. Granulometric composition, product granulation
6. Super-grain, sub-grain and dust particle composition
7. Productivity
5
6
7
123456
123456
123456
123456
123456
123456
within limits
8. Fineness modulus
9. Technological innovation
10. Protection and regulation degree
8
9
10
satisfactory
visible
RESULT 39 points PNk
determined
low
deviates deviates, exceeds limits
variable
unsatisfactory
not applied
low
changeable
within limits
optimal
high
Classification of parameters according to importance
Classification of parameters according to importance
Table 2
Table 3

27
Techno ScienceInternational Scientific Journal of Technical Sciences
MATRIX DIMENSION RANK
Maintenance and environmental protection Doe
PARAMETER niN
Description Point value Vpi
Description
1. Plant stability 1 123456low
2. Plant reliability 123456 2
classic
high
3. Plant e'ciency 3 123456
4. Surveillance and management 4 123456 networked
5. Convenient and suitable maintenance
6. Supplying spare parts, servicing
7. Protection against metal objects
5
6
7
123456
123456
123456
123456
123456
123456
facilitated
timely
e'cient and reliable
8. Cleaning the openings and grinding elements
9. Environmental impacts on the working and living environments (noise, dust, vibrations)
10. Industrial product’s ergonomic properties
8
9
10
occasional
moderate and within limits
improved
RESULT 33 points PNk
low
hampered
with waiting time
classic
frequent
noticeable
common
low
The methodological procedure according to the presented method starts by summarising the points awarded for each parameter per group.
Group Dimension PNkp VpNs
PNkp
max min
Point values Vpk
1 2 3 4 5 6
npk
niN
1
2
3
4
TrD
Doe
ED
TD
38
43
39
33
3.8 (x)
4.3 (y)
3.9 (-x)
3.3 (-y)
60 10
1 3 0 0 5 1 10
0 1 3 1 2 3 10
1 0 3 1 5 0 10
0 3 5 0 0 2 10
N=4N=1
4
N=1PNkp
1-NVpNs
240 4044
N=1npkN
4niN
N=1
153 3,825 2 7 11 2 12 6 40The number of awarded points for each group is within the limits of maximum and minimum.
2 14 33 8 60 36 4
N=1npkN . npk
Where:npk – the number of the same point occurrences Vpk, k= 1,2,…,6niN – the number of ranked parameters for N groups, i= 1,2,3,…,10N – the number of dimensions, groups
PNkp = npk . Vpk6
k=1– the number of points awarded
by the experts per groups N and per parameters Nin – total sum of awarded points per N dimensions – arithmetic mean of points awarded for
VpNs =1-nin
. PNkp
1-NVpNs N=1
4
Classification of parameters according to importance
The number of the same point occurences
high
high
Table 4
Table 5

28
Techno ScienceInternational Scientific Journal of Technical Sciences
4
N=1
npkN – total sum of the same point occurrences for
N=1
4
4niN
N=1 – total number of parameters for
N=1
4
Pnkpmax-min – the extreme point values set
Pnkmax-min , statistical values of points
a) calculating the weighing coe(cients, ktktk= , k=1,2,.....6
General form: Calculating extreme values and the range of points, as well as distribution (concentration) coe'cients:
for: Vpk = 1 > kt1 = = 0.166 ;
for: Vpk = 2 > kt2 = = 0.333 ;
for: Vpk = 3 > kt3 = = 0.050 ;
for: Vpk = 4 > kt4 = = 0.666 ;
for: Vpk = 5 > kt5 = = 0.833 ;
for: Vpk = 6 > kt6 = = 0.100
where: max Vpk- maximal point value in a rank
b) preliminary point and coe(cient values max PN6p=np6 . Vp6= 10 . 6 = 60 poena min PN6p=np1 . Vp1= 10 . 1 = 10 poena
Corrective preliminary coe'cient per dimensions: kkn(p)=
max k6N(p)= = =1.0
min k1N(p)= = =0.166
c) experimental point and coe(cient valuesFor the N group:
PNke = , the corrected experimental
value of the awarded points
Kkn(e)= , experimental distribution coe'cient per dimensions
max PN6e=np6 . Vp6 . kt6= 10 . 6 . 1.0 = 60 poenamin PN3e=np3 . Vp3 . kt3= 10 . 3 . 0.5 = 15 points
VpkmaxVpk
1626
63
46
65
66
PNkp60
PN6p60
6060
PN1p60 60
10
npkk=1
. Vpk6 . ktk
PNke60
max k6N(e)= = =1.0
min kr3kp= = = 0.25
PN6e60
6060
PN3e60
1560
d) calculating experimental values of the awarded points in line with the report submitted by the expert or a group of experts
For the N dimension groups: N=1 TD P16e=1.0•1.0•0,166+3•2•0,333+5.0•5.0•0,833+1.0•6•1.0=28,939 points
28.93960
kr6e = = 0.482
»experimental distribution coe'cient N=2 ED P26e=1•2•0.333+3•3•0.5+1•4•0.666+2•5•0.833+3•6•1.0=37,160
kr6e = = 0.619 37.1660
» experimental distribution coefficient N=3 TD P36e=1•1•0.166+3•3•0.5+1•4•0.666+5•5•0.833=28,105
kr6e = = 0.468 28.10560
» experimental distribution coe'cient N=4 DoeP46e= 3•2•0.333+5•3•0.5+2•6•1.0= 21,498
kr6e = = 0.35821.49860
e) setting and marking the limits of experimental coe(cients
max kkN(e) - min kkN(e)Vp6
= 1.0 - 0.256
= 0.125
From the quotient: we receive the amount of the increase (growth) which is distributed from the number 0.25 to 1.0 as follows:
kkN(e)
Symbol
>0.25min>0.375 >0.50>0.625 >0.75 >0.875 (1.0max)

29
Techno ScienceInternational Scientific Journal of Technical Sciences
Group Dimension PNkp
PNkpmax min
1
2
3
4
TrD
Doe
ED
TD
38
43
39
33
60 10
N=4N=1
240 404
153
kknN(p)
0.633
0.716
0.65
0.55
kknN(p)max min
1.0 0.166
PNke
37.160
28.939
28.105
21.498
PNkemax min
60 15
kkN(e)
0.619
0.482
0.468
0.358
1.0
max min
kkN(e)
0.25
kkN(p) within limits
115.702 240 60 KkN(e) within limits
A COMPARISON OF DIMENSIONS ACCORDING TO EXPERIMENTAL INDICATORS WITH SCORE SYMBOLS
INITIAL
NEWSYMBOL
N=1 TrD N=2 ED N=3 TD N=4 Doe N=1 ED N=2 TrD N=3 TD N=4 Doe
PRELIMINARY INDICATORS EXPERIMENTAL INDICATORS
COMPARATIVE SCORE INDICATORS
f ) setting an additional assessment criterion kdN(e)
Gro
up
Dim
ensi
on
Pi(nNd)
Vpk max
Vpd (Vpi)
kdN max min kdN=
Vpd . ktk max Vpk Pa
ram
eter
sco
re
13
3
kdN
d=1
GR
OU
P S
COR
ETrD1.
p2p5p6
655
6
1.0 0.6940.6940.6941.0
0.796
p1p3p5
2. ED 6466
0.444 1.01.0
1.0 0.694 0.815
3. TDp2p5p7
6356
1.0 0.6940.2500.6941.0
0.648
4. Doep3p6p9
6 36
21.0 0.694
0.694
1.00.250 0.454
- the reduced groups TrD and ED satisfy the set criterion
- the reduced group Doe does not satisfy the set criterion
- the reduced group TD is at the limit of the set criterion and can be found in the group satisfying the given criterion
Introducing the additional assessment criterion for the machine is conducted in order to additionally a'rm the obtained result for the product and market position of the grinding machine or the manufacturer, depending on the elements set for analysis. Three most significant parameters from each group, dimension are taken into consideration.
Table 6
Table 7

30
Techno ScienceInternational Scientific Journal of Technical Sciences
Namely, in relation to the much more significant ones, the less significant parameters determined according to the degree of importance can be given a high score by the experts, placing the group in a better ranking position and obtaining a seemingly good result. Being familiar with the set criteria of assessing and selecting the grinding machine results in facts stating that, for example, without satisfying the technological and economic parameters of quality related to ground products, the grinding machine (grinder or mill) cannot be selected. . Based upon these facts, a conclusion can be drawn regarding the need to satisfy the basic parameters ( nNd ), functionally related in the following way: machine-raw material-product. The new lower limits of the distribution coe'cient in modified conditions (the criterion of the selected parameters’ importance) are being set:
min kdn=
nNd . Vpk . Ktk
max Vpk
3
d=1
=nN3 . Vp5 . kt5
max Vp6
3
d=1
=3.5.0.833
18= 0.694
The published preliminary research on assessing the selected grinding machine can, in most cases, provide positive indicators since the assessment parameters are placed within widely set criterion limits (min 10 and max 60 points or ranging from 0.166 to 1.0). Experimental research set the new, extreme parameter limits (points and concentration coe'cients) where the weighing coe'cients preferred higher point values. In this way, the detected preliminary research weaknesses were removed. By introducing an additional criterion for assessing the most significant parameters [1], this method gained quality in its approach to the analysis procedure. By designing a chart placed on the x, y, -x and –y axes and plotting the coordinate points for TrD: VpNs=3.8; for ED: VpNs=4.3; for TD: VpNs=-3.9 and for Doe: VpNs= –3.3 we obtained 4 characteristic field surface areas:
PI =16.34 PII = 16.77 PIII = 12.87 PIV = 12.54
situated within the maximum, Pmax=36 and minimum, Pmin=1.0 limits.
Analysis of the obtained assessment results
Calculating the intensity of dimensions
The value VpNs of coordinates for each dimension ED, TrD, TD, Doe, is calculated as the average value (average mean) of the sum of dimension points that belong to a certain axis. - the y axis coordinate is calculated as: y = VpNs(ED) + VpNs(Doe)
- for determining the x axis coordinate, we use the formula: x = VpNs(TrD) + VpNs(TD).
By entering the numeric values into the given formulae, we obtain the coordinate points P:
for the x axis, x=1 for the y axis, y = -0.1
which, with the zero point, create the vector direction of the grinding machine’s position and its assessment position. The methodological procedure for determining the strategic position of a machine or a grinding machine manufacturer is detailed in the provided example (Image 2.).
The meaning of abbreviations:TrD- market dimensionED- economis dimensuonTeD- technological dimensionDoe- dimension of maintenance an environmental protection
Image 2. A diagram, a systematic overview of the awarded points VpNs with $eld surface sizes (I, II, III, IV) and vector
directions of dimension movements

31
Techno ScienceInternational Scientific Journal of Technical Sciences
The vector directions Ek cost-e(ectiveness, Pr productivity, Ef e'ciency and Kk competitiveness mark the proportionate directions and intensity of improvements for one dimension in relation to another, associated one.
The selected point P, with the coordinates (x, y) and the preferred field, shows the product and market position of a grinding machine according to which we can set a strategy for deciding whether to keep the machine in the production process or procure a new one. By observing the pictorial representation (Image 2), we can see that the vector direction (0,P) provides an overview of the powerful product and economic position of the grinding machine, while its less
e(ective and competitive ability can be compensated by attractive o(ers of machines at the global market, and its position in the technological scheme of processing rock and waste materials depends upon the type and properties of the materials and the performance construction demands set for the machine. The team of experts, based upon the results obtained from the analysis, gives suggestions, opinions and recommendations to the user or investor as to which part and in what volume they should act in order to accomplish a successful investment procedure. Image 3. provides a graphic overview of the experimental results for assessing the grinding machine according to the 4 dimensions and the linear regression equation model [1].
Image 3. A graphic overview of experimental results for assessing the grinding machine according to the 4 dimensions and the model y=bo + b1x
Assessment of the Modi$ed SPACE Method Applicability
The method for determining the strategic position of grinding machines or machine manufacturers is based on a large number of parameters classified into four groups, dimensions. The selection of dimensions and parameters depends on the assessment task set and the investment procedure (existing machine or a new one), as well as the structure of participants taking part in the task of assessing the machine, facility or machine manufacturer.
Each parameter in the dimension is valuated, and based upon that, the vector direction and field size are calculated and determined in the matrix-diagram where the production, technological, economic and competitive positions of an industrial product (machine) are identified. In this way, we accomplished a comprehensive approach towards perceiving the research problem, i.e. the options for selecting the best solutions have increased. The proficiency in choosing and selecting parameters according to their significance was left to the experts who, upon inspecting the project task, created a parameter plan matrix and assessed each parameter which was supported by valid proof and explanations. Overviews of assessment results were provided in several numerical and graphic ways (e.g. Image 3.), pointing at the sought after solution of the problem.
kkN(e)=0,482
Pnke=28,939kkN(e)=0,619Pnke=37,160kkN(e)=0,468Pnke=28,105kkN(e)=0,358Pnke=21,498

32
Techno ScienceInternational Scientific Journal of Technical Sciences
ConslusionFrom the modified SPACE analysis conducted on a specific example of a mineral raw material grinding machine, we can conclude that it is completely applicable in practice. Subsequent research regarding this method can use the SWOT (Strengths, Weaknesses, Opportunities and Threats) method as the basis for the technical and economic assessment of internal strengths and weaknesses, as well as external opportunities and threats. In order to diagnose the current or future product position of a machine or facility in strengthening the investment decision-making process, special attention is paid to the selection of the type and number of analysis dimensions encompassing a certain feature or characteristic. With the purpose of strengthening the decision on machine assessment, we introduced additional criteria for machine assessment, taking into account the three most significant parameters from each group, dimension, in order to additionally confirm the obtained result regarding the product position of the grinding machine or machine manufacturer.
The issue of application and volume of parameter review, whether they can be supplemented or corrected according to the circumstances and new information, as well as the team of experts’ objectivity in deciding on scores (awarding points) are the potential problems that can a(ect the assessment objectivity and result in obtaining di(erent movement directions.
The modified SPACE method is applicable only in the area of the same rank or similar group (type) of production units or technical systems. The methodology of entering and processing the selected parameters through this methodological procedure remains the same in case of additional assessments of the machine’s position:
- through the SWOT method for technical and economic assessment of internal strengths and weaknesses, as well as external opportunities and threats[4], and
- through “the machine’s pros and cons method” [1].
References1. Šišić I. Prilog razvoju metodologije za ocjenu i izbor mašina za usitnjavanje nemetalnih mineralnih sirovina,
doktorska disertacija, Univerzitet u Zenici, Mašinski fakultet Zenica 2005.2. Bišćević I.: Ekonomika u tržišno poduzetničkim uslovima poslovanja, Univerzitet u Bihaću, Viša ekonomska
škola Bihać, Bihać 1998. 3. Berberović Š., Šunjić-Beus M.: Troškovi i poslovna politika preduzeća, Sarajevo-Banja Luka 1999. 4. Piuković-Babiĉković B., Vojinović Ž.: Faktori od uticaja na poslovni sistem - SPACE i SWOT metode analize,
Nauĉno-struĉni ĉasopis SVAROG br. 15., Banja Luka oktobar 2017. (120-129) Online sources (retrieved in December 2018):
5. http://delibra.bg.polsl.pl/Content/39906/BCPS_43802_2001_Metoda-SPACE---narze.pdf6. http://www.resulto.pl/zarzadzanie-strategiczne-przykladowa-analiza-pozycji-strategicznej-
przedsiebiorstwa/7. http://bojankrstic.net/wp-content/uploads/2013/clanci/19/space%20matrica.pdf8. https://fmtu.lumens5plus.com/sites/fmtu.lumens5plus.com/files/25-a65e991(1034c70090cf0c5f9dfdcb4
By processing more “samples” of the position assessment, it is possible to compare results and make the right decision regarding machine manufacturer selection.
33
Techno ScienceInternational Scientific Journal of Technical Sciences
Received: October 29, 2018 / Accepted: November 25, 2018Correspondence to: Ifet Šišić, PhD University of Bihać, Bosnia and HerzegovinaE-mail: [email protected]
Ključne riječi: parametri, dimenzije, matrica, ocjena, odlučivanje
SPACE (Strategic Position and Action Evalution) metoda je analitička tehnika koja se koristi u strateškom upravljanju i planiranju kompanija, koja zahvata objekt analize preko dvije interne dimenzije (finansijska snaga i konkurentska snaga) i dvije ekstremne dimenzije (stabilnost okruženja i snaga grane poslovanja) [3,5,7].Analiza procjenjuje unutrašnje i spoljašnje okruženje da bi se dobila odgovarajuća ideja o poslovnoj strategiji i razvojnim pravcima kompanije [2,6]. Modifikacijom metodoloških tokova SPACE metode a prema zadatku istraživanja i izborom dimenzija ocjene i seta parametara koji pokrivaju svaku od četiri odabrane dimenzije, u radu je na primjeru mašina za usitnjavanje izvršena identifikacija njene pozicije sa aspekta tehničkih, tehnoloških, troškovnih i ekoloških parametara. U nastavku analize, a radi jačanja odluke o ocjeni mašina uvedeni su dopunski kriteriji ocjene mašine koji uzimaju u obzir po tri najznačajnija parametra iz sveke od grupa. Osim mašina za usitnjavanje sirovina modificirana SPACE metoda omogućava i analizu referenci proizvo)ača mašina ili industrijskog postrojenja prerade sirovina, koji dobiveni podaci ocjene mogu poslužiti za donošenje odluke investitorima i preduzećima o nabavci nove mašine (postrojenja), rekonstrukciji ili modernizaciji postojeće.
Modifikovana SPACE metoda za utvrđivanja proizvodno-tržišne pozicije industrijskog proizvoda na primjeru mašina za usitnjavanje sirovina
SAŽETAK
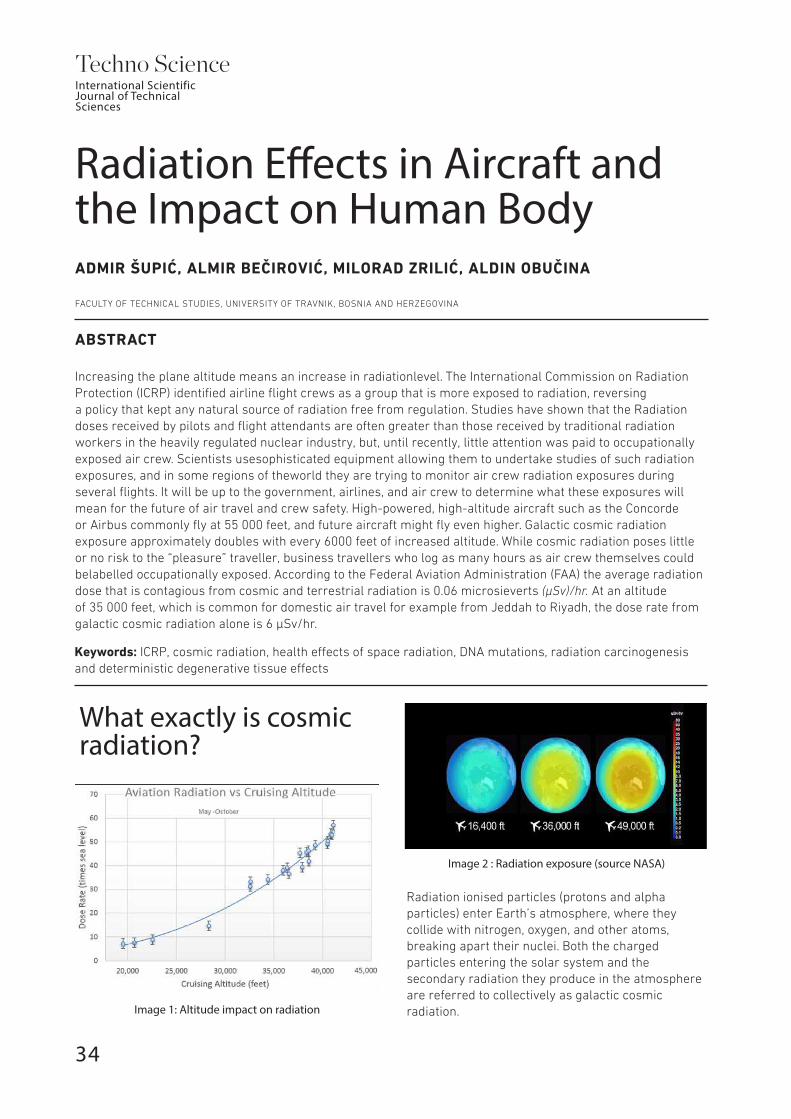
34
Techno ScienceInternational Scientific Journal of Technical Sciences
ADMIR ŠUPIĆ, ALMIR BEČIROVIĆ, MILORAD ZRILIĆ, ALDIN OBUČINA
ABSTRACT
FACULTY OF TECHNICAL STUDIES, UNIVERSITY OF TRAVNIK, BOSNIA AND HERZEGOVINA
Radiation E&ects in Aircraft and the Impact on Human Body
Increasing the plane altitude means an increase in radiationlevel. The International Commission on Radiation Protection (ICRP) identified airline flight crews as a group that is more exposed to radiation, reversing a policy that kept any natural source of radiation free from regulation. Studies have shown that the Radiation doses received by pilots and flight attendants are often greater than those received by traditional radiation workers in the heavily regulated nuclear industry, but, until recently, little attention was paid to occupationally exposed air crew. Scientists usesophisticated equipment allowing them to undertake studies of such radiation exposures, and in some regions of theworld they are trying to monitor air crew radiation exposures during several flights. It will be up to the government, airlines, and air crew to determine what these exposures will mean for the future of air travel and crew safety. High-powered, high-altitude aircraft such as the Concorde or Airbus commonly fly at 55 000 feet, and future aircraft might fly even higher. Galactic cosmic radiation exposure approximately doubles with every 6000 feet of increased altitude. While cosmic radiation poses little or no risk to the “pleasure” traveller, business travellers who log as many hours as air crew themselves could belabelled occupationally exposed. According to the Federal Aviation Administration (FAA) the average radiation dose that is contagious from cosmic and terrestrial radiation is 0.06 microsieverts (μSv)/hr. At an altitude of 35 000 feet, which is common for domestic air travel for example from Jeddah to Riyadh, the dose rate from galactic cosmic radiation alone is 6 μSv/hr.
Keywords: ICRP, cosmic radiation, health e(ects of space radiation, DNA mutations, radiation carcinogenesis and deterministic degenerative tissue e(ects
Image 1: Altitude impact on radiation
What exactly is cosmic radiation?
Radiation ionised particles (protons and alpha particles) enter Earth’s atmosphere, where they collide with nitrogen, oxygen, and other atoms, breaking apart their nuclei. Both the charged particles entering the solar system and the secondary radiation they produce in the atmosphere are referred to collectively as galactic cosmic radiation.
Image 2 : Radiation exposure (source NASA)

35
Techno ScienceInternational Scientific Journal of Technical Sciences
Human health e&ectsThe potential acute and chronic health e(ects of space radiation, as with other ionizing radiation exposures, involve both direct damage to DNA, indirect e(ects due to generation of reactive oxygen species, and changes to the biochemistry of cells and tissues, which can alter gene transcription and the tissue microenvironment along with producing DNA mutations. Acute (or early radiation) e(ects result from high radiation doses, and these are most likely to occur after solar particle events (SPEs).
Each disruptednucleus can itself yield multiple ionizing particles, which can interact with other nuclei and produce still more particles, until, after several interactions, they have lost the energy to cause disruptions. The sun is also a considerable source of radiation; solar radiation and galactic cosmic radiation are commonly referred to jointly as cosmic radiation. The e(ect of the Earth’s magnetic field is greatest at the geomagnetic equator, which is located near the geographic equator. For an example an airplane at an altitude of 20 000 feet at 70° North latitude (near the Arctic circle) would receive galactic cosmic radiation a factor of 2.0 higher than at the same altitude at the equator. At every latitude, the altitude at which the dose rate is highest is di(erent. The initial interaction of galactic cosmic radiation with the Earth’s atmosphere can be so intense that a unique phenomenon is observed at high altitudes above the equator: The intensity of the radiation is lower at 80 000 feet than at 60 000 feet, where particle interactions reach their peak. At every latitude, the altitude at which the dose rate is highest is di(erent. The initial interaction of galactic cosmic radiation with the Earth’s atmosphere can be so intense that a unique phenomenon is observed at high altitudes above the equator: The intensity of the radiation is lower at 80 000 feet than at 60 000 feet, where particle interactions reach their peak. The solar wind (a plasma of solar radiation— mostly protons and electrons—ejected from the sun) carries a convoluted magnetic field throughout the solar system. This wind contains more irregularities at solar maximum, which makes the magnetic field change and become unusually tortuous and strong.Since the ionized particles making up galactic radiation are electrically charged, they can be a(ected by the highly ionized particles in the solar wind.
Likely chronic e(ects of space radiation exposure include both stochastic events such as radiation carcinogenesis and deterministic degenerative tissue e(ects. To date, however, the only pathology associated with space radiation exposure is a higher risk for radiation cataract among the astronaut corps.
The health threat depends on the flux, energy spectrum, and nuclear composition of the radiation. The flux and energy spectrum depend on a variety of factors: short-term solar weather, long-term trends (such as an apparent increase since the 1950s), and position in the Sun's magnetic field. These factors are incompletely understood.The Mars Radiation Environment Experiment (MARIE) was launched in 2001 in order to collect more data.
Estimates are that humans unshielded in interplanetary space would receive annually roughly 400 to 900 mSv (compared to 2.4 mSv on Earth) and that a Mars mission (12 months in flight and 18 months on Mars) might expose shielded astronauts to roughly 500 to 1000 mSv. These doses approach the 1 to 4 Sv career limits advised by the National Council on Radiation Protection and Measurements (NCRP) for low Earth orbit activities in 1989, and the more recent NCRP recommendations of 0.5 to 2 Sv in 2000 based on updated information on dose to risk conversion factors. Dose limits depend on age at exposure and sex due to di(erence in susceptibility with age, the added risks of breast and ovarian cancers to women, and the variability of cancer risks such as lung cancer between men and women.
The quantitative biological e(ects of cosmic rays are poorly known, and are the subject of ongoing research. Several experiments, both in space and on Earth, are being carried out to evaluate the exact degree of danger. Additionally, the impact of the space microgravity environment on DNA repair has in part confounded the interpretation of some results. Experiments over the last 10 years have shown results both higher and lower than predicted by current quality factors used in radiation protection, indicating large uncertainties exist. Experiments in 2007 at Brookhaven National Laboratory's NASA Space Radiation Laboratory (NSRL) suggest that biological damage due to a given exposure is actually about half what was previously estimated: specifically, it turns out that low energy protons cause more damage than high energy ones. This is explained by the fact that slower particles have more time to interact with molecules in the body.

36
Techno ScienceInternational Scientific Journal of Technical Sciences
This may be interpreted as an acceptable result for space travel as the cells a(ected end up with greaterenergy deposition and are more likely to die without proliferating into tumors. This is in contrast to the current dogma on radiation exposure to human cells which considers lower energy radiationof higher weighting factor for tumor formation.
Relative biological e(ectiveness (RBE) depends on radiation type described by particle charge number, Z, and kinetic energy per amu, E, and varies with tumor type with limited experimental data suggesting leukemia's having the lowest RBE, liver tumors the highest RBE, and limited or no experimental data on RBE available for cancers that dominate human cancer risks including lung, stomach, breast, and bladder cancers. Studies of Harderian gland tumors in a single strain of female mice with several heavy ions have been made, however it is not clear how well the RBE for this tumor type represents the RBE for human cancers such as lung, stomach, breast and bladder cancers nor how RBE changes with sex and genetic background.
Part of the ISS year-long mission is to determine the health impacts of cosmic ray exposure over the course of one year spent aboard the International Space Station.
However, sample sizes for accurately estimating health risks directly from crew observations for the risks of concern (cancer, cataracts, cognitive and memory changes, late CNS risks, circulatory diseases, etc.) are large (typically >>10 persons) and necessarily involve long post-mission observation times (>10 years). It will be di'cult for a su'cient number of astronauts to occupy the ISS and for the missions to continue long enough to make an impact on risk predictions for late e(ects due to statistical limitations. Hence the need for ground-based research to predict cosmic ray health risks. In addition, radiation safety requirements mandate that risks should be adequately understood prior to astronauts incurring significant risks, and methods developed to mitigate the risks if necessary.
In September 2017, NASA reported radiation levels on the surface of the planet Mars were temporarily doubled, and were associated with an aurora 25-times brighter than any observed earlier, due to a massive, and unexpected, solar storm in the middle of the month.
Image 3: Shielding
Material shielding can be e(ective against galactic cosmic rays, but thin shielding may actually make the problem worse for some of the higher energy rays, because more shielding causes an increased amount of secondary radiation, although thick shielding could counter such too. The aluminium walls of the ISS, for example, are believed to produce a net reduction in radiation exposure. In interplanetary space, however, it is believed that thin aluminium shielding would give a net increase in radiation exposure but would gradually decrease as more shielding is added to capture generated secondary radiation.
Studies of space radiation shielding should include tissue or water equivalent shielding along with the shielding material under study. This observation is readily understood by noting that the average tissue self-shielding of sensitive organs is about 10 cm, and that secondary radiation produced in tissue such as low energy protons, helium and heavy ions are of high linear energy transfer (LET) and make significant contributions (>25%) to the overall biological damage from GCR. Studies of aluminum, polyethylene, liquid hydrogen, or other shielding materials, will involve secondary radiation not reflective of secondary radiation produced in tissue, hence the need to include tissue equivalent shielding in studies of space radiation shielding e(ectiveness.

37
Techno ScienceInternational Scientific Journal of Technical Sciences
Several strategies are being studied for ameliorating the e(ects of this radiation hazard for planned human interplanetary spaceflight:
• Spacecraft can be constructed out of hydrogen-rich plastics, rather than aluminium.
• Material shielding has been considered: 0
0
0
• Magnetic deflection of charged radiation particles and/or electrostatic repulsion is a hypothetical alternative to pure conventional mass shielding under investigation. In theory, power requirements for a 5-meter torus drop from an excessive 10 GW for a simple pure electrostatic shield (too discharged by space electrons) to a moderate 10 kilowatts (kW) by using a hybrid design. However, such complex active shielding is untried, with workability and practicalities more uncertain than material shielding.
Special provisions would also be necessary to protect against a solar proton event, which could increase fluxes to levels that would kill a crew in hours or days rather than months or years. Potential mitigation strategies include providing a small habitable space behind a spacecraft's water supply or with particularly thick walls or providing an option to abort to the protective environment provided by the Earth's magnetosphere. The Apollo mission used a combination of both strategies. Upon receiving confirmation of an SPE, astronauts would move to the Command Module, which had thicker aluminium walls than the Lunar Module, then return to Earth. It was later determined from measurements taken by instruments flown on Apollo that the Command Module would have provided su'cient shielding to prevent significant crew harm. None of these strategies currently provide a method of protection that would be known to be su'cient while conforming to likely
limitations on the mass of the payload at present (around $10,000/kg) launch prices. Scientists such as University of Chicago professor emeritus Eugene Parker are not optimistic it can be solved anytime soon. For passive mass shielding, the required amount could be too heavy to be a(ordably lifted into space without changes in economics (like hypothetical non-rocket spacelaunch or usage of extraterrestrial resources) — many hundreds of metric tons for a reasonably-sized crew compartment.
For instance, a NASA design study for an ambitious large spacestation envisioned 4 metric tons per square meter of shielding to drop radiation exposure to 2.5 mSv annually (± a factor of 2 uncertainty), less than the tens of millisieverts or more in some populated high natural background radiation areas on Earth, but the sheer mass for that level of mitigation was considered practical only because it involved first building a lunar mass driver to launch material. Several active shielding methods have been considered that might be less massive than passive shielding, but they remain speculative. Since the type of radiation penetrating farthest through thick material shielding, deep in interplanetary space, is GeV positively charged nuclei, a repulsive electrostatic field has been proposed, but this has problems including plasma instabilities and the power needed for an accelerator constantly keeping the charge from being neutralized by deep-space electrons. A more common proposal is magnetic shielding generated by superconductors (or plasma currents). Among the di'culties with this proposal is that, for a compact system, magnetic fields up to 10–20 teslas could be required around a manned spacecraft, higher than the several teslas in MRI machines. Such high fields can produce headaches and migraines in MRI patients, and long-duration exposure to such fields has not been studied. Opposing-electromagnet designs might cancel the field in the crew sections of the spacecraft, but would require more mass. It is also possible to use a combination of a magnetic field with an electrostatic field, with the spacecraft having zero total charge. The hybrid design would theoretically ameliorate the problems, but would be complex and possibly infeasible. Part of the uncertainty is that the e(ect of human exposure to galactic cosmic rays is poorly known in quantitative terms. The NASA Space Radiation Laboratory is currently studying the e(ects of radiation in living organisms as well as protective shielding.
Liquid hydrogen, which would be brought along as fuel in any case, tends to give relatively good shielding, while producing relatively low levels of secondary radiation. Therefore, the fuel could be placed so as to act as a form of shielding around the crew. However, as fuel is consumed by the craft, the crew's shielding decreases.Water, which is necessary to sustain life, could also contribute to shielding. But it too is consumed during the journey unless waste products are utilized. Asteroids could serve to provide shielding

38
Techno ScienceInternational Scientific Journal of Technical Sciences
ConclusionDue to the nature of their work, the flight crew is increasingly exposed to radiation as opposed to people who work on the ground. Even though many research on radiation prevention and improving materials and equipment has been conducted, unfortunately, complete protection for people has not been created yet. The consequence of long flights and exposure to cosmic radiation is reflected in faster aging of the organism, continuous fatigue, drowsiness, leading up to the most serious medical conditions such as leukaemia and cancer. In order to avoid this, many airlines restrict flight hours for their employees with the goal to protect their health and ultimately prevent disease occurrence.
References1. Schimmerling, Walter. "The Space Radiation Environment: An Introduction" (PDF). The Health Risks of
Extraterrestrial Environments. Universities Space Research Association Division of Space Life Sciences. Archived from the original (PDF) on 26 April 2012. Retrieved 5 December 2011.
2. Chang, Kenneth (27 January 2014). "Beings Not Made for Space". New York Times. Retrieved 27 January 2014.
3. Fong, MD, Kevin (12 February 2014). "The Strange, Deadly E(ects Mars Would Have on Your Body". Wired. Retrieved 12 February 2014.
4. "Can People go to Mars?". science.nasa.gov. Archived from the original on 19 February 2004. Retrieved 2 April 2017.
5. Shiga, David (16 September 2009), "Too much radiation for astronauts to make it to Mars", New Scientist (2726)
6. Virts, Terry (2017). View From Above: An Astronaut Photographs The World. National Geographic. p. 101. ISBN 9781426218644. Whenever the ISS flew through the South Atlantic Anomaly, we were exposed to a much greater flux of [galactic cosmic radiation].
7. Dunn, Marcia (29 October 2015). "Report: NASA needs better handle on health hazards for Mars". AP News. Retrieved 30 October 2015.
8. Sta( (29 October 2015). "NASA's E(orts to Manage Health and Human Performance Risks for Space Exploration (IG-16-003)" (PDF). NASA. Retrieved 29 October 2015.
9. "Biomedical Results From Apollo - Radiation Protection and Instrumentation". lsda.jsc.nasa.gov. Archived from the original on 15 May 2013. Retrieved 2 April 2017.
10. Evaluation of the Cosmic Ray Exposure of Aircraft Crew11. Sources and E(ects of Ionizing Radiation, UNSCEAR 200812. Phillips, Tony (25 October 2013). "The E(ects of Space Weather on Aviation". Science News. NASA.13. Earth's Radiation Belts with Safe Zone Orbit". Goddard Space Flight Center, NASA. Retrieved 27 April 2009.14. Weintraub, Rachel A. "Earth's Safe Zone Became Hot Zone During Legendary Solar Storms". Goddard Space
Flight Center, NASA. Retrieved 27 April 2009.15. Schwadron, N. (8 November 2014). "Does the worsening galactic cosmic radiation environment observed
by CRaTER preclude future manned deep space exploration?". Space Weather. 12 (11): 622–632. Bibcode:2014SpWea..12..622S. doi:10.1002/2014SW001084.
16. NASA (2005). "Flashes in the Sky: Lightning Zaps Space Radiation Surrounding Earth". NASA. Retrieved 24 September 2007.
17. Robert Roy Britt (1999). "Lightning Interacts with Space, Electrons Rain Down". Space.com. Archived from the original on 12 August 2010. Retrieved 24 September 2007.
Image 4

39
Techno ScienceInternational Scientific Journal of Technical Sciences
Efekti zračenja u letjelicama i njihov uticaj na ljudsko tijelo
Received: November 20, 2018 / Accepted: Novembar 29, 2018Correspondence to: Aldin Obucina, University of Travnik, Faculty of Technical Studies, Travnik, Bosnia and HerzegovinaE-mail: [email protected]
Povećanje visine na kojoj se avion kreće predstavlja povećanje nivoa zračenja. Me)unarodna komisija za zaštitu od zračenja (ICRP) je identifikovala posadu aviona avio kompanija kao grupu koja je više izložena zračenju, poništavajući politiku prema kojoj bilo koji prirodni izvor zračenja ne podliježe propisima. Studije su pokazale da su doze primljenog zračenja za pilote i kabinsko osoblje često veće od onih koje prime radnici izloženi zračenju u strogo regulisanoj nuklearnoj industriji, ali, sve donedavno, malo se pažnje posvećivalo profesionalno izloženoj posadi aviona. Naučnici koriste sofisticiranu opremu koja im omogućava provo)enje studija o takvoj izloženosti zračenju, a, u nekim regijama svijeta, oni nastoje pratiti posadu aviona koja je izložena zračenju tokom nekoliko letova. Na vladama, avio kompanijama i posadi aviona ostaje da odrede šta će ova izloženost podrazumijevati za budućnost zračnog transporta i sigurnost posade. Letjelice velike snage koje se kreću na velikim visinama poput Concorde ili Airbus aviona obično lete na 55 000 stopa, a buduće letjelice bi mogle letjeti čak i na većim visinama. Izloženost galaktičkom kosmičkom zračenju se udvostručuje sa svakim povećanjem visine od 6000 stopa. Dok kosmičko zračenje predstavlja mali ili nikakav rizik za putnike koji putuju iz "zadovoljstva", osobe koje putuju zbog posla, te provedu jednako mnogo sati u avionu kao i njegova posada, bi se mogle smatrati profesionalno izložene zračenju. Prema Federalnoj upravi za civilnu avijaciju SAD-a (FAA), prosječna doza zračenja koja se prenosi kosmičkim i zemaljskim zračenjem iznosi 0,06 mikrosiverta na sat (μSv/h.) Na visini od 35 000 stopa, koja je uobičajena za domaći zračni transport, na primjer iz Jeddaha do Riyadha, stopa doze samog galaktičkog kosmičkog zračenja iznosi 6 μSv/h.
Ključne riječi: ICRP, kosmičko zračenje, zdravstveni učinci svemirskog zračenja, mutacije DNA, karcinogeneza zračenja i deterministički degenerativni učinci tkiva
SAŽETAK

40
Techno ScienceInternational Scientific Journal of Technical Sciences
MAID OMEROVIĆ, ALJO DELIĆ, AHMED PALIĆ
ABSTRACT
FACULTY OF TECHNICAL STUDIES, UNIVERSITY OF TRAVNIK, BOSNIA AND HERZEGOVINA
Random Number Generators and Their Application
Random Number Generators
This paper will address random number generators. At the beginning, we will define and classify them. Subsequently, we will introduce the methods, and then the algorithms for random number generation. It is important to note that, in this paper, we will state one of the random number generation algorithms, provide details about it, and then compare a histogram of the ideal generator with those stated in this paper. At the end of the paper, the highly important application of random number generators will be described through certain methods and algorithms.
Keywords: random number generators, algorithms, physical methods, computational methods, Lehmer LCG, entropy, histogram
Random Number Generation MethodsPhysical Methods
A random number generator (RNG) is a device or an algorithm which, as its output, provides statistically, completely independent and
unpredictable values in the form of a number sequence. Random number generators are generally divided into: true random number generators and pseudo-random number generators.The fundamental di(erence between them is as follows: the output of pseudo-random number generators becomes repetitive after some time, while it is not the case with true random number generators. We will make use of pseudo-random number generators in the case when the system we are making is less complex. True random number generators are almost impossible to design for computing since computers are deterministic machines.
With the goal to generate (true) random numbers, it is necessary to observe and note some unpredictable natural phenomena.
Designing a circuit device and/or a computer programme which would gather sampled values of a measurable quantity related to an observed phenomena, free from correlations and predictability, is an extremely di'cult task. For cryptographic applications, it is also necessary that such a generator is resistant to possible observations and manipulations of the internal state. Circuit random number generators use unpredictability appearing in the following physical phenomena: thermal noise of a semiconductor diode or an electric resistor, the time between two particle emissions during radioactive decay, free oscillator frequency instability, the charge of a capacitor after the set charging period, changes in the latent readout time caused by air turbulence within the hard disk drive enclosure, the sound from a microphone or an image from a camera.
However, physical phenomena and the tools used for their measurements typically have both asymmetric and systematic deviations due to which their outputs and not uniformly random. Another frequent and interesting source of entropy can be the behaviour of a human as the user of a system.

41
Techno ScienceInternational Scientific Journal of Technical Sciences
Humans cannot be considered good random generators when it is demanded of them, but, when they use a system, their unconscious behaviour can surely be put to good use.
The best example for this is a new trend in programmes dealing with computer security. They demand that their users move the mouse or press the keys on the keyboard for a time in order to create enough entropy to generate a random key or initialise a pseudo-random number generator.
There are also other processes upon which we can base software random number generators: system clock reading, the contents of input-output storage of certain computer components, RAM contents, contents of processor registers, and the state of the operating system.
Computational Methods
Due to the deterministic nature of computers, the term random number generation on a computer is usually attributed the prefix pseudo. A pseudo-random number generator (PRNG) is a deterministic algorithm that, for the given random value of the k bit quantity, renders a number sequence of the value l >> k which behaves as if it is random. The input value is usually called seed, while the output sequence is termed pseudorandom number sequence. It is important to mention the reproducibility of PRNG results, that is, for equal seed values, we receive identical output sequences, and, after a period of time, the results start repeating.
One of the first methods for random number generation was developed by John Von Neumann.
It is called the middle-square method which is so simple that it can be calculated without the use of a computer, but its output is of extremely low quality. It should be noted that almost all programming languages o(er ready-made functions and libraries for random number generation.It most frequently boils down to generating random bytes or words.
However, one should be cautious because such functions often have poor statistical properties and some will repeat patterns after only tens of thousands of trials.
That is why many operating systems o(er built-in random number sources of much higher quality.
Random Number Generation AlgorithmsThe following will list only one of the random number generation algorithms.
Lehmer LCG
It is sometimes also referred to as the Park–Miller random number generator since this variation is most frequently used. The algorithm belongs to the type of multiplicative linear congruential generator (LCG). LCGs are extremely easy for implementation.
There are several types of LCGs and each has distinct demands. Lehmer’s algorithm requires a selection of two integers:
1. modulus m, which has to be a prime number;
2. a multiplier a, which is an integer from the interval 2, 3, ..., m – 1.
A sequence of random numbers {zn} is obtained by the following recursion relation:zn+1 = f(zn) n 2 Nf(z) = az mod m
The first number of the sequence is also the generator seed which can be selected from the interval 1, 2, ..., m − 1. Likewise, the stated random number generator generates a number sequence {zn} in the stated interval. That is why it is necessary to scale the sequence in order to obtain numbers distributed in the interval [0, 1]. The final sequence {un} is defined by the expression {un} = {zn}/m. Then, by selecting the parameters a and m, we strive to accomplish the best possible generator properties.
Image 1. Park–Miller LCG Histogram
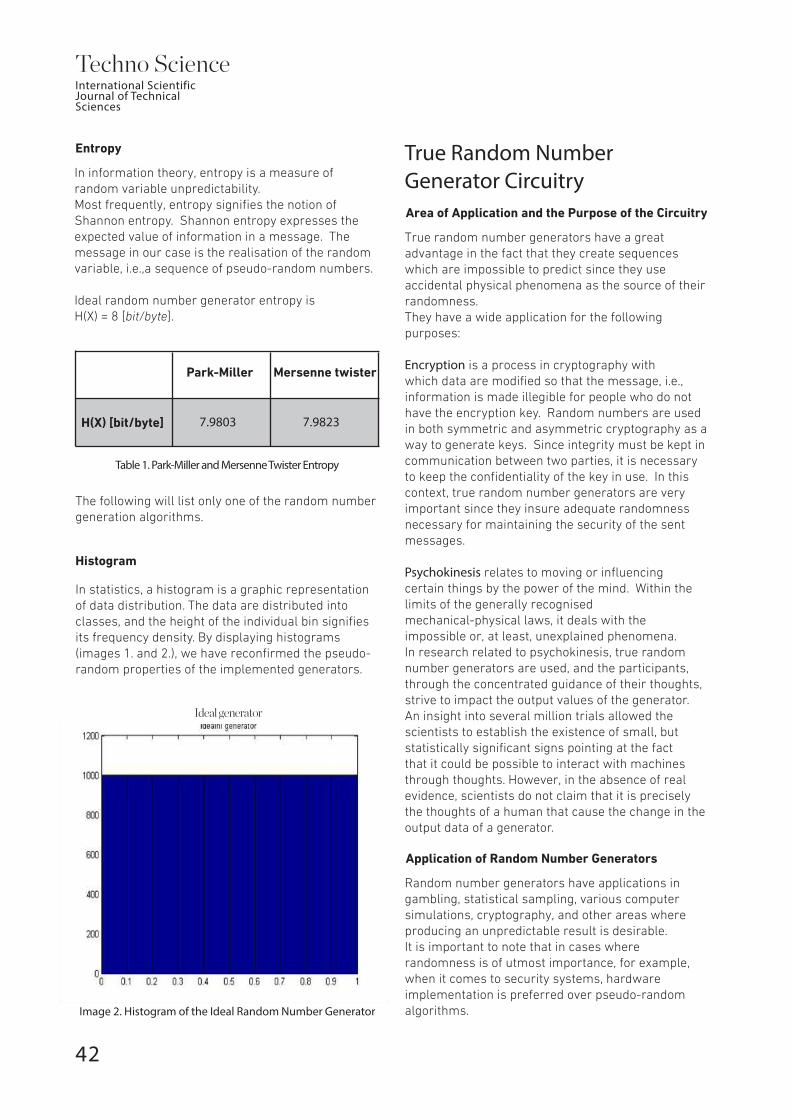
42
Techno ScienceInternational Scientific Journal of Technical Sciences
Entropy
In information theory, entropy is a measure of random variable unpredictability. Most frequently, entropy signifies the notion of Shannon entropy. Shannon entropy expresses the expected value of information in a message. The message in our case is the realisation of the random variable, i.e.,a sequence of pseudo-random numbers.
Ideal random number generator entropy is H(X) = 8 [bit/byte].
Park-Miller Mersenne twister
H(X) [bit/byte] 7.9803 7.9823
Table 1. Park-Miller and Mersenne Twister Entropy
The following will list only one of the random number generation algorithms.
Histogram
In statistics, a histogram is a graphic representation of data distribution. The data are distributed into classes, and the height of the individual bin signifies its frequency density. By displaying histograms (images 1. and 2.), we have reconfirmed the pseudo-random properties of the implemented generators.
Image 2. Histogram of the Ideal Random Number Generator
Ideal generator
True Random Number Generator CircuitryArea of Application and the Purpose of the Circuitry
True random number generators have a great advantage in the fact that they create sequences which are impossible to predict since they use accidental physical phenomena as the source of their randomness. They have a wide application for the following purposes:
Encryption is a process in cryptography with which data are modified so that the message, i.e., information is made illegible for people who do not have the encryption key. Random numbers are used in both symmetric and asymmetric cryptography as a way to generate keys. Since integrity must be kept in communication between two parties, it is necessary to keep the confidentiality of the key in use. In this context, true random number generators are very important since they insure adequate randomness necessary for maintaining the security of the sent messages.
Psychokinesis relates to moving or influencing certain things by the power of the mind. Within the limits of the generally recognisedmechanical-physical laws, it deals with the impossible or, at least, unexplained phenomena. In research related to psychokinesis, true random number generators are used, and the participants, through the concentrated guidance of their thoughts, strive to impact the output values of the generator. An insight into several million trials allowed the scientists to establish the existence of small, but statistically significant signs pointing at the fact that it could be possible to interact with machines through thoughts. However, in the absence of real evidence, scientists do not claim that it is precisely the thoughts of a human that cause the change in the output data of a generator.
Application of Random Number Generators
Random number generators have applications in gambling, statistical sampling, various computer simulations, cryptography, and other areas where producing an unpredictable result is desirable.It is important to note that in cases where randomness is of utmost importance, for example, when it comes to security systems, hardware implementation is preferred over pseudo-random algorithms.

43
Techno ScienceInternational Scientific Journal of Technical Sciences
Random number generators are extremely useful in developing Monte Carlo simulations, as well as for debugging since they provide the option of starting the same sequence of random numbers beginning with the same random seed. In addition, they are frequently used in cryptography as long as the seed is kept secret. Today, information security is an extremely important issue which is heavily invested in, with random number generators playing a key role, especially in generating passwords and asymmetric keys. Generating pseudo-random numbers is an important and frequent task in computer programming. For example, while cryptography and other numerical algorithms require a high degree of randomness, most algorithms can still function properly with a significantly smaller one. We have already encountered such algorithms, and they are frequently used (search and sort algorithms). It is important that a generator is optimally adjusted to the system requirements, and it should be primarily ensured that the very generation procedure is fast, e'cient and precise. In fact, it could be stated that we have made a quality generator if the manner in which numbers are generated cannot be detected.The complexity of the very notion of randomness should be reemphasised.
ConclusionIn conclusion, it is important to state that a random number generator is a device or an algorithm which, as its output, provides statistically, completely independent and unpredictable values in the form of a number sequence. Random number generators are generally divided into: true random number generators and pseudo-random number generators. Random number generators have applications in gambling, statistical sampling, various computer simulations, cryptography, and other areas where producing an unpredictable result is desirable. In addition, they are frequently used in cryptography as long as the seed is kept secret. Today, information security is an extremely important issue which is heavily invested in, with random number generators playing a key role, especially in generating passwords and asymmetric keys.
References1. The Art of Computer Programming, Volume 2: Seminumerical Algorithms, 2nd Edition, Donald E. Knuth,
1981.2. Laboratorijska vježba 1. – Generiranje slučajnih brojeva (LCG), generiranje slučajnih procesa, uzoračka
srednja vrijednost, devijacija te autokorelacijska i kroskorelacijska funkcija, Tomislav Petkovic, 20093. Testing Random Number Generators, Dr. John Mellor-Crummey, Department of Computer Science Rice
University, 2005.4. Pseudo-Random Number Generators, Vivien Challis, Part of the postgraduate journal club series,
Mathematics, UQ, 2008.
One of the frequent applications which we encounter on a daily basis is on our MP3 player or iPod where we select the option shu#e instead of directly choosing the song we want to listen to. Even though the choice should be completely random, it is definitely not desirable that a song is reproduced two or several times in a row.
SAŽETAKU ovom radu biti će riječi o generatorima slučajnih brojeva. Na početku ćemo definisati nevedeno, izvršiti odre)enu podjelu. Nakon svega toga biti će uvedeni postupci za genenerisanje slučajnih brojeva, a potom algo-ritmi za generisanje slučajnih brojeva. Bitno je napomenuti da ćemo mi u ovom radu navesti jedan od algorita-ma za generisanje slučajnih brojeva, navesti neke detalje o istom, a potom usporediti histogram idealnog gener-atora sa nekim navedenim u ovom radu. Na kraju rada, veoma važna, primjena generatora slučajnih brojeva biti će opisana kroz pojedine metode i algoritme.Ključne riječi: Generatori slučajnih brojeva, fizički postupci, računarske metode, algoritmi, Lehmerov LCG, entropija, histogram
Received: November 29, 2018 / Accepted: December 03, 2018Correspondence to: mr.Maid Omerović, University of Travnik, Faculty of Technical Studies, Travnik, Bosnia and HerzegovinaE-mail: [email protected]
Generatori slučajnih brojeva i njihova primjena

44
Techno ScienceInternational Scientific Journal of Technical Sciences
MAID OMEROVIĆ, ALJO DELIĆ, AHMED PALIĆ
ABSTRACT
FACULTY OF TECHNICAL STUDIES, UNIVERSITY OF TRAVNIK, BOSNIA AND HERZEGOVINA
OLAP Technology and Its Application through Business Data Analysis and Database Multidimensionality
Quality and timely information is the basis for making business decisions by the company’s management. In their day-to-day work, managers are surrounded by an abundance of di(erent data and information that can be more or less useful. It is only by using modern software tools for business data analysis that managers can have quality and fast insight into business activities. Analytical data processing systems (OLAP) enable managers to, independently, without programming knowledge, and in real time, preform a multidimensional data analysis, while obtaining information in clear tabular and graphic forms. Likewise, the significance of this paper lies in presenting the practical application of analytical data processing tools on an example of a business activity related to calculating incomes.
Keywords: data analysis, data warehouse, query, OLAP cube, multidimensional approach, pivot table, pivot chart
OLAP Systems
Online Analytical Processing (OLAP) is intended for online analyses and reporting, and it should enable the end user to ask any
business question, use any data from the company for analysis, as well as provide the option of unlimited reporting. They enable a simple synthesis, analysis and consolidation of data. They are used for an intuitive, fast and flexible manipulation of transaction data. They support complex analyses conducted by analysts and enable data analysis from di(erent perspectives (business dimensions). OLAP systems as data warehouses use multidimensionality and denormalisation. Data are placed in the so-called
data cubes where each side of the cube is called a dimension (data category). The OLAP system interface enables the user to independently perform analytical operations and obtain an overview and business graphics without being familiar with programming and the database structure. According to their architecture, OLAP systems are divided into: MOLAP – multidimensional OLAP, ROLAP – relational OLAP and HOLAP – hybrid OLAP. MOLAP and ROLAP di(er in the way they physically store data. In MOLAP systems, data are stored in a multidimensional structure (data cube), while in the case of ROLAP systems, data are stored in relational databases.
Indicating the significance of OLAP technology, E. F. Codd, PhD, states that: “Structure without corresponding operators or inferencing techniques is rather like anatomy without physiology.”

45
Techno ScienceInternational Scientific Journal of Technical Sciences
ROLAP systems are open systems since they provide direct access to data from tables, and there is no need for data duplication. The advantage of MOLAP systems lies in the fact that they provide excellent system performance when it comes to previously calculated data (aggregations).
Preparing Data for Business AnalysisIn the previous part of the paper, we have seen that analytical data processing can be conducted directly on the relational database (ROLAP) or over the prepared data warehouse (MOLAP). At this point in the paper, we will present the manner in which the data warehouse is formed by using the programme Microsoft Query, with the goal to conduct an analysis of the data prepared in such a way. Prior to forming a query, it is necessary to primarily know what kind of data (information) we wish to receive on the basis of the observed business process (Income calculation).
Having in mind the available structure of the income calculation database, and for the company’s management purposes, we can request, among other things, the following synthetic data: an overview of summed income per years and months, an overview of summed income per qualifications, departments and municipalities, an overview of average income per qualifications and departments, income structure (income on the basis of the labour cost and the time spent
Creating a Data Warehouse - OLAP CUBECreating OLAP cubes as data warehouses accomplishes the following advantages in data analysis: easier access to large databases by working with their subsets, a reduction of time necessary for data processing by performing the necessary data aggregations in advance, facilitated creation of reports due to the previously defined dimensions and levels of data overview.Based upon the created query, we can create OLAP cubes by activating the option CreateOLAP Cube from the MS Query menu. Creating OLAP cubes is conducted in three steps:
1. Selecting Summarised Data Fields. The fields forming summarised data and mathematical operations which will be conducted on the fields are determined. The fields which are not used for summarised data represent the candidates for cube dimensions.
at work, compensations, remunerations) per months, departments, cost centres, remuneration structure (night work, work during holidays, overtime, ...) per departments, divisions, etc.The above stated examples of the requested data can be combined, obtaining a much higher number of possible data which can be of interest for the observed business process. Likewise, other reports can be generated by introducing new dimensions and aggregations.
Image 1. Selecting Summarised Data Fields
Cijena rada zaposlenika – employee labour cost, PIO – pension and disability insurance, Zdravstvo – health care,
Nezaposlenost – unemployment, Godina – year, Zarada – income, Poreza – taxes, Doprinos – contribution, Isplata – payment, Stepen ID –Degree ID

46
Techno ScienceInternational Scientific Journal of Technical Sciences
2. De$ning the Dimensions of the OLAP Cube. Selecting the fields which will form the cube dimensions out of the remaining ones (candidates for the dimensions). In this step, the
dimension hierarchy is also formed. The dimension hierarchy should enable multiple levels of specificity, depending on the user’s needs in the process of data analysis.
Image 2. De$ning the Dimensions of the OLAP Cube.
Cijena rada zaposlenika - employee labour cost,Prezime – last name. Ime – first name,Stručna sprema – qualification,Opština – municipality,
Stepen – degree,Godina – year,Naziv mjeseca – month name,Radna jedinica – department
3. Selecting the type of the OLAP Cube. The option of keeping a cube file with all the data was selected, forming the data warehouse. When saving, a special file of the .OQY (OLAP query) type keeps the information on the defined
Data Analysis Management in ExcelUpon preparation, the data analysis management can be performed in the Excel programme by applying Pivot tables and Pivot charts, where Excel is attributed the role of OLAP interface. A pivot table serves as a tabular representation of multidimensional data within which summarised data can be shown at any level of specificity. The user has the option to form reports for a certain point of view reading the data (the selected level of specificity and dimension arrangement). Creating pivot tables is performed through the menu Data/PivotTable and PivotChart Report. By activating this option, we start the Wizard and select the data source, type and data file, as well as the position of the pivot table in the Excel worksheet. Namely, there is a choice between three di(erent types of databases as source data for the analysis by way of a pivot table:
aggregations and cube dimensions, and, in an individual file of the .CUB (cube) type, the data warehouse is kept for the needs of the multidimensional analysis.
• Databases – selecting one of the provided relational databases with a collection of primitive data sorted into tables (normalised data);
• Queries – selecting a query formed in the MS Query programme (denormalised table);
• OLAP Cubes – selecting a cube file with the defined summarised data and candidates for the dimensions
The first two options, Databases and Queries, represent the application of a ROLAP system where there is no formation of a data warehouse and the “live data” are accessed from the database. By selecting the option OLAP Cubes, we perform a multidimensional analysis over the data warehouse, representing the MOLAP system.

47
Techno ScienceInternational Scientific Journal of Technical Sciences
Image 3. Selecting the Data Source for the Analysis
Image 4. provides the appearance of a formed pivot table where the employees’ income distribution is presented per months and qualifications.
Year
Sum of Income Degree
Month name
January February
March
April
May
JuneJuly
August
NK KV VKV SSS VŠS VSS MR Grand Total
2005
30,775.5033,340.1324,368.7525,413.13
36,485.00 20,340.00 42,162.0052,972.50 149,265.00 58,185.00 390,160.5022,035.00 57,386.66 45,675.50 161,698.88 63,033.75 422,673.8839,503.75
42,542.50 23,730.00 61,801.25 49,189.00 174,137.25 67,882.50 443,651.2544,365.75 24,747.00 64,449.88 51,297.10 208,537.28 70,791.75 489,601.88
27,858.0026,979.6927,153.7528,242.34
48,620.0047,100.6347,404.5049,304.93
27,120.0026,272.5026,442.0027,502.05
86,630.0083,922.8184,464.2587,850.40
56,216.0054,459.2554,810.6057,007.94
228,534.00221,392.31222,820.65231,753.47
77,580.0075,155.6375,640.5078,672.91
552,550.00535,282.81538,736.25560,334.05
Grand Total 224,123.27 355,307.06 198,188.55 579,477.96 410,817.39 1,598,134.34 566,942.03 3,932,990.61
A graphic overview of the data from the table can often be a better way of providing an insight into the data, and it can help in analysing data and drawing conclusions. When working with pivot tables through the PivotTable toolbar, clicking the option Chart Wizard automatically provides a ready-made chart, predefined as a Column type.
Image 5. provides an example of a pivot table with an overview of the employees’ average and total income per departments and qualifications. The data are sorted according to the average income per department in a descending order - from the highest to the lowest.
Image 4. Pivot Table of the Income Distribution per Months and Quali$cations

48
Techno ScienceInternational Scientific Journal of Technical Sciences
Year Month
2005 (All)
Degree
Companymanagement
Department of development
Finances and commerce
Accounting
Manufacture
General a!air
Transportation
Department Data Grand TotalNK KV VKV SSS VŠS VSS MR
Average of income2
Sum of income
Average of income2
Average of income2
Average of income2
Average of income2
Average of income2
Average of income2
Totak Average of income2
Sum of income
Sum of income
Sum of income
Sum of income
Sum of income
Sum of income
Total Sum of income
32,148.09514,369.45
37,982.49303,859.88
34,092.89818,229.33
27,367.85218,942.81
32,885.27263,082.15
30,126.56482,024.96
29.070.58
1,282,983.05
232,564.6223,326.96
23,071.45553,714.85
20,617.24329,875.78
19,466.50233,598.01
25,374.13
3,932,990.61
12,451.29
224,123.27
22,206.69
355,307.06
24,773.57
198,188.55
20,695.64
579,477.96
25,676.09
410,817.39
30,153.48
1,598,134.34
35,433.88
566,942.03
29,070.58232,564.62
30,455,54395,921.99
25,372.81202,982.49
24,773.57198,188.55
22,206.69355,307.06
13,058.30130,582.95
25,979.36
207,834.90
21,617.50
345,879.9511,692.54
93,540.3219,466.50
233,598.01
29,541.93236,335.46
Image 5. Pivot Table of the Total and Average Income per Departments and Qualifications
A Summary of the OLAP Technology Application-Related AnalysisThis paper provides an overview of the business data analysis by applying an OLAP system on an example of a business activity related to calculating the employees’ income, which is mandatory for all legal entities. The activity of calculating incomes is an especially sensitive issue in companies which have limited funds at their disposal for payments on a monthly level: companies under the jurisdiction of municipal authorities, public companies and budget users. Due to the legal form of calculating incomes in the part related to compensations, remunerations for night work, work during holidays and overtime, abuse on part of some employees can occur, directly reflecting the income of other workers since the funds are limited. In such cases, data analysis is of special significance for the management on both the synthetic and analytic levels. The above mentioned issue in the part related to income calculation can be interesting from the aspect of a deeper, highly specialised analysis which can serve as the subject of a future paper.
Considering the spatial limitation, this paper depicts one of the possible approaches in the data analysis management. It should be noted that, in the business process of income calculation, a legal form dominates and has to be fulfilled both in the calculation and in the system of standardised, prescribed reporting. Analytical data processing with the goal of providing the company’s management with a more complete illustration of the structure and cost allocation from di(erent aspects represents one upgrade. It is possible to further expand and develop it by introducing new attributes on a primitive level and by applying other analytical processing systems (Data mining).
Database multidimensionalityData warehouse is based on a multidimensional model which represents data in the form of the so-called n-dimensional data cubes.Data cubes are defined with:
• a fact table: mostly contains numerical data and foreign keys to dimension tables;• dimension tables: enable a representation of data in several ways.

49
Techno ScienceInternational Scientific Journal of Technical Sciences
2-D data cube
3-D data cube

50
Techno ScienceInternational Scientific Journal of Technical Sciences
4-D data cube
5-D data cube
locationBelgradeNovi Sad
time K1
K2HD
keyboardproduct
DICE FOR (location="Belegrade"OR "Novi Sad") AND (time="K1" OR "K2") AND (product="keyboard"OR "HD")
location
MontenegroSerbia
time
K1K2K3K4
HD mousekeyboard monitor
product
ROLL-UP ON location (from the city to the country)
location
time
K1K2K3K4
HD mousekeyboard monitor
product
SLICE FOR time="K1"
Belgrade
PodgoricaBudva
Novi Sad
Podgorica
loca
tion Budva
Belgrade
Novi Sad
HD mousekeyboard monitor
product
PIVOT
prod
uct
keyboardHD
monitormouse
location
Budva Novi Sad
Podgorica Belgrade
loca
tion Podgorica
BudvaBelgrade
Novi Sad
time
HD mousekeyboard monitor
product
JanuaryFebruaryMarchAprilMay
JuneJulyAugust
SeptemberOctober
NovemberDecember
DRILL-DOWN ON time (from the quarters to the months)

51
Techno ScienceInternational Scientific Journal of Technical Sciences
Data Warehouse System Architecture
other sources
databases
meta data
selectioncleansing
transformation transformation
loading
DataWarehouse
Data Marts
Data Data Warehouse server OLAP server User interface
monitoring
administration
output
AnalysisQueriesReports Data mining tools
Pivot Tables and Microsoft Analysis ServicesThe notion of pivot tables implies a tool for performing di(erent types of aggregations according to di(erent levels and, most frequently, we encounter them as an additional strength in the programmes for cross calculations, typically represented by MS Excel. Pivot tables can easily be transformed into visual reports. By applying pivot tables, one can materialize their e(ort in forming data structures and processing that data by delivering an e(ective report. In fact, a pivot table is a technical term for one of the implementations related to the OLAP concept which is, in everyday life, drawn nearest to the user. There are hardly any people who spend their working day without an installed programme for cross calculations. A pivot table illustrates aggregations related to a data set. If you make a change in the data, the pivot table should reflect it.
The changes will not happen automatically. You need to select the whole area of the pivot table, right-click somewhere on the surface of the pivot table and, from a context menu, instruct the pivot table to refresh the data. Rest assured that the pivot table mechanism will perform with complete accuracy. The data will be modified in accordance with the changes made. If you are prepared to deal with macros, then the following part of the programme code could be of benefit:
Sub RefreshData()

52
Techno ScienceInternational Scientific Journal of Technical Sciences
Microsoft o(ers a significantly stronger weapon in implementing the OLAP concept. The solution is called Microsoft Analysis Services. In line with the complete demands of the OLAP concept, Microsoft provides an OLAP solution in the form of a classic OLAP sever.
Within the relational database Microsoft SQL server 2005, a software placed at the central layer of the three-tier architecture is delivered. The commercial name is Microsoft SQL Server Analysis Services (SSAS). This product enables a complete OLAP and Datamining functionality which is demanded of a product belonging to the business intelligence applications.
Microsoft SQL Server Analysis Services (SSAS) provides the application of OLAP by allowing the user to design, create and manage multidimensional structures containing aggregate data taken from other data sources, primarily transaction relational databases.
ConclusionOLAP enables a simple synthesis, analysis and consolidation of data. They are used for an intuitive, fast and flexible manipulation of transaction data. They support complex analyses conducted by analysts and enable data analysis from di(erent perspectives (business dimensions). The example of applying OLAP technology in practical life is clearly and precisely stated which is most important nowadays, especially its application in business activities where each of us should at least know the basics. Afterwards, the database multidimensionality is illustrated in a very interesting way. We can clearly conclude that we have accomplished the goal of this paper which is to demonstrate to the reader, without providing superfluous data and information, what the multidimensional database and OLAP technology really are. OLAP is not an expense, OLAP is a necessity.
References1. Business Data Analysis Using OLAP Systems, International Scientific Conference MANAGEMENT2010,
Kruševac (Serbia), 17th – 18th March 2010.2. Lectures from FER (Faculty of Electrical Engineering and Computing, Zagreb), link: https://www.fer.unizg.
hr/_download/repository/OSP1_Skocir.pdf, University of Zagreb, Faculty of Electrical Engineering and Computing (Accessed 24thJuly 2019).
Image 6. Microsoft Analysis Services

53
Techno ScienceInternational Scientific Journal of Technical Sciences
OLAP tehnologija i primjena istih kroz poslovnu analizu podataka i višedimnezionalnost baze podataka
SAŽETAKKvalitetna i pravovremena informacija je osnov za donošenje poslovnih odluka od strane menadžmenta preduzeća. Menadžeri su u svom svakodnevnom radu okruženi mnoštvom različitih podataka i informacija koje mogu biti manje ili više upotrebljive. Samo uz korišćenje savremenih softverskih alata za poslovnu analizu po-dataka menadžeri mogu imati kvalitetan i brz uvid u poslovanje. Sistemi za analitičko procesiranje podataka (OLAP) omogućavaju menadžerima da, samostalno, bez znanja programiranja, u realnom vremenu, obavljaju višedimenzionu analizu podataka dobijajući pritom informacije u preglednim tabelarnim i grafičkim formama. Značaj ovog rada je isto tako u prikazu praktične primjene alata za analitičku obradu podataka na primjeru poslovne aktivnosti obračuna zarada.
Ključne riječi: analiza podataka, skladište podataka, upit, OLAP kocka, višedimenzionalni pristup, pivot tabela, pivot grafikon
Received: November 29, 2018 / Accepted: November 30, 2018Correspondence to: mr. Aljo Delic, University of Travnik, Faculty of Technical Studies, Travnik, Bosnia and HerzegovinaE-mail:[email protected]

54
Techno ScienceInternational Scientific Journal of Technical Sciences
AHMED PALIĆ, MIRELA ABIDOVIĆ SALKICA, ŠEJLA SMAJIĆ
ABSTRACT
FACULTY OF TECHNICAL STUDIES, UNIVERSITY OF TRAVNIK, BOSNIA AND HERZEGOVINA
Economics of the Education Sector Investment through the IT Sector Development
Introduction
The education sector has been placed at the top of the priorities for all economic education policies in the world and, as such, it is considered an indispensable element when it comes to any innovation, improvement, and reform. In recent years, through the expansion of science, technology and other branches of science, education, that is, education systems have been modernised by the introduction of IT. Profitability of such ventures and their purpose are an important issue that was imposed just before the modernisation itself. Thus, numerous studies have been conducted with the purpose to verify how e(ective and necessary the introduction of information technology in teaching really is. In the last twenty years, the development of IT has enabled not only the development of a new branch of science, but also the development of all other segments of society and education, which is also the subject of this paper. The development of the IT sector is profitable in every respect, and the economics of the education investment has been followed by the development of IT, combining these two elements into a single, functional, cost-e(ective and, above all, useful unit.
Keywords: economics, education, information technology, investment
I n recent years, education has been a burning issue in almost all economic policies and systems in the world, and consequently, the issue of education, i.e., the quality of educational systems and the cost-e(ectiveness of investing in the education sector, has come to us in Bosnia and Herzegovina. The economy of a country as well as its competitive position depends primarily on the quality of the available human resources. Education in the 21st century is gaining a new, important role that involves the acquisition of new skills, learning through practice and improving the training process as the labour market is crying out for new and adaptable workforce. Education is a process that does not last only up to the moment of completing formal education, but it also involves informal education and informal lifelong learning.
What is particularly interesting about this issue is actually the quality of education in BiH, that is, education in the Central Bosnia Canton, which has recently been largely targeted by numerous critics. Speaking about quality education, which is not present in Bosnia and Herzegovina, Suzić (2005) states that the analysis of educational systems in the twentieth century shows that we must seek an optimal relationship of frontal or plenary, cooperative, individual and individualized learning and teaching, and the relations between these forms and methods of work are best combined (Suzić, 2005).
Given that the topic is relatively untested, especially at the state level, this paper will include the analysis of the situation in BiH with a brief overview of some investments and their benefits through the development of the IT sector.

55
Techno ScienceInternational Scientific Journal of Technical Sciences
Theoretical problem analisysBefore the theoretical processing of the topic itself, we will explain the meaning of the stated key terms. According to an American economist Paul A. Samuelson, out of the many the definitions of economy, the most accepted one defines it as the study of how men and society choose, with or without the use of money, to employ scarce productive resources which could have alternative uses, to produce various commodities over time and distribute them for consumption now and in the future amongst various people and groups of society (Samuelson, 1969). According to Pastuovic (1999), education is a process of organized learning related to the cognitive and psychomotor characteristics of a person. Information Technology (IT) is defined by the American Information Technology Association as "the study, design, development, implementation and support or management of computer information systems, software applications and hardware.”
Information technology, as a consequence of general scientific and technological development, had an extremely rapid development, which had a reverse influence on the development of science and technology. Speaking of investment, i.e., the concept of investment, Bašić (2005) considers that, in the widest sense, this term denotes any investment that is essentially directed towards achieving a certain useful e(ect, while in the more meaningful sense of this term, it implies investing in the construction of new capacities. At the level of Bosnia and Herzegovina, as the highest relevant authority, i.e., institution or administrative body, the Ministry of Civil A(airs of Bosnia and Herzegovina is, among other things, responsible for education. Its authority is regulated by the Law on Ministries and Other Administrative Bodies, and it has the following tasks:
1. Performing duties concerning the preparation and implementation of regulations, a(airs and tasks which are under the jurisdiction of Bosnia and Herzegovina and which relate to the establishment of the basic principles for coordinating the activities, harmonising the plans made by entity authorities and defining the strategy on the international level;
2. Participating in the work of international organizations;
3. Executing international obligations and preparations for concluding international agreements or agreements in the part related to education in Bosnia and Herzegovina.
4. Although the Ministry of Civil A(airs coordinates this field at the state level, education falls under the jurisdiction of the cantons at the level of
the Federation of BiH, the entity in Republika Srpska, and under the jurisdiction of the Brčko District. In the Federation of Bosnia and Herzegovina, each of the 10 cantons has its own law on pre-school, primary and secondary education, and the cantons with universities established in them have their own laws on higher education. In Republika Srpska, all levels of education are also regulated by entity legislation. Brčko District, as a separate organizational unit in BiH, has its own laws regulating each of the four levels of education.
This decentralized system prevents a uniform approach to educational policies, enhances di(erences in the development of human resources in di(erent parts of Bosnia and Herzegovina, and generates a series of problems in the hierarchy of competencies, responsibilities and coordination.
A more rational design of the educational system at di(erent levels, respecting the character of socio-economic relations, the contribution to overcoming the negative implications of the division of labour (specialization and super-specialization) in scientific activity may lead to the fact that research in a particular sector neglects the common average and complementarity with related disciplines. The basic forms of complementarity between education economics and other scientific disciplines and areas of social reproduction are formed under the influence of many factors such as the level of economic development, the number and structure of the population, social, political and cultural factors, personal and social standards, the natural environment, etc. In order for the educational activity to achieve the expected results in the socio-economic development and the development of democracy, it is necessary to:
1. introduce more fully the so-called principle of working income;
2. directly link education with its service users, which can be achieved through: a'rming the principle of working income, respecting the specifics of the educational, as well as any other activity, and the economic cost of educational services that should and may be the basis for forming the income of educational organizations;
3. The economic price of education (ECO) is di(erent for individual levels of education and is very exposed to changes;

56
Techno ScienceInternational Scientific Journal of Technical Sciences
4. ECO elements are the same for all levels and can be considered unchangeable;
5. ECO in our terms has the most e(ective form of calculation if it is determined per student or pupil, because each student or pupil should know how much his education costs (and every organization should be familiar with it), employers of the education sta( should know the cost of education per pupil, i.e., student, the price of education per student or pupil should serve the "donors" of the funds as the basis for drafting the enrolment policy, such a fixed price can serve in regulating mutual obligations between various social institutions that care about education and, based on this price, it is possible to conceive the policy of lending to students who did not fulfil the mandatory enrolment requirements and for whom no regular funds were provided (Bašić, 2005).
Looking at the parameters of the labour market from the education level aspect, it is visible that the structure of the working-age population is dominated by the category of persons with secondary-school and specialization levels amounting to 52.6%, followed by the category of primary school and lower levels with a share of 37.9%, and the smallest share is composed of those having associate degrees, academic degrees, master's degrees and doctorates with 9.5%.
In numerous education debates in Bosnia and Herzegovina, the view is that the principal limiting factors for increasing the quality of education are the availability of financial resources and low investment in the education sector.
Apart from introducing IT, virtually nothing else has been changed. The education reform itself, viewed from any aspect, actually implies a content reform that encompasses all parts of the education system, programmes and resources.
Therefore, the question arises as to whether the financial resources are really too low or the problem lies in their distribution. In this regard, table No. 2 brings forth an overview of investments and the budget by individual users, including the Central Bosnia Canton.
Structure of the total workforce according to their professional quali$cation (%)
Activity rate by education level
Employment rate by education level
Unemployment rate by education level
Primary school and lower levels
Secondary school and specialization
Associate degrees, academic degrees, master's degrees and doctorates
16.5% 18.6% 15.2% 18.25%
67.7% 54.8% 42.6% 22.3%
15.8% 71.1% 60.1% 15.4%
Table 1: labour market parameters according to the education level (source: Bosnia and Herzegovina’s Labour Force Survey 2017, DEP calculations)

57
Techno ScienceInternational Scientific Journal of Technical Sciences
67.7% 54.8% 42.6% 22.3%
15.8% 71.1% 60.1% 15.4%
Ordinalnumber The name of the bene$ciary
Appropriations (in millions) Year
1.Federal Ministry of Education (employee salaries and compensations, expenditures for materials, consumables and services, current transfers and other expenses)
4.52 2018
2.
3
4.
Ministry of Education and Culture (employee salaries and compensations, total expenditures, primary and secondary schools, University of Banja Luka, University of East Sarajevo)
178.16 2017
3.Sarajevo Canton; Ministry of Education, Science and Youth (current expenditures, current transfers, capital transfers (alongside higher education), pre-school and primary education, secondary education)
127.79 2018
Zenica-Doboj Canton; Ministry of Education, Science, Culture and Sports (current expenditures, current transfers, capital transfers, grants, primary, secondary and higher education
70.27 2018
5.Una-Sana Canton; Ministry of Education, Science, Culture and Sports (current expenditures, current transfers, capital transfers, grants, primary, secondary and higher education)
53.37
40.54
2018
6.Herzegovina-Neretva Canton; Ministry of Education, Science, Culture and Sports (current expenditures, current transfers, capital transfers, grants, primary, secondary and higher education)
2018
7.Bosnian-Podrinje Canton; Ministry of Education, Youth, Science, Culture and Sports (current expenditures, primary and secondary schools)
5.76 2018
8.Canton 10 - Livno; Ministry of Science, Education, Culture and Sports (current expenditures, current transfers, capital transfers, primary and secondary education)
14.24 2018
9.Posavina Canton; Ministry of Science, Education, Culture and Sports (current expenditures, current transfers, capital transfers, grants, pre-school, primary, secondary and higher education)
6.96 2018
10.Central Bosnia Canton; Ministry of Education, Science, Culture and Sports (current expenditures, current transfers, capital transfers, primary and secondary education)
43.37 2018
11.West Herzegovina Canton; Ministry of Education, Science, Culture and Sports (current expenditures, current transfers, capital transfers, primary and secondary education)
17.81 2018
12.
Tuzla canton; from 2018, Ministry of Education and Science, former Ministry of Education, Science, Culture and Sports (current expenditures, current transfers, capital transfers, grants, preschool, primary, secondary and higher education)
86.97 2018
Table 2: Budget allocation overview

58
Techno ScienceInternational Scientific Journal of Technical Sciences
In 2009, total expenditures for education in BiH amounted to about 1,200 million KM. The indicator pointing at the adequacy of total allocations for education is the share of total education costs in the GDP of the country. In 2009, this share accounted for 4.5% in BiH, while this indicator for the region of Central Europe and Asia (ECA) was (on average) 4.2%. In 2009, Croatia's total public expenditure for education amounted to 4.3% of the GDP, for Slovenia, it was 5.7% and for Serbia 5.0%. Thus, according to this indicator, BiH allocates approximately the same amount for education as other countries in the region. In addition to these indicators, the problem of (in)equality in education represents the next factor responsible for this situation in both the canton and the country. World Bank experts have provided a set of recommendations that would result in a reduction of education costs, but, above all, they would increase the e'ciency of spending the available funds and create investment funds for those educational factors that can lead to an increase in the quality of education. Some of these recommendations are as follows:
• limit further salary increases and create a space for increasing other items and capital investment in education,
• change the salary structure to attract and retain the highest quality teachers. For example, salaries in education are not dependent upon the achievements accomplished by students of individual teachers,
• reallocate expenditure for salaries and other items for primary and secondary education in order to improve the quality of education,
• introduce school-based funding resting on the number of students (output) rather than on inputs, in line with contemporary trends. The experiences of many countries show that this reform results in increased e'ciency, e(ectiveness and transparency of school funding; this would lead to a reduction in the number of teachers in line with the decrease in the number of students and the increase in the average class size, establish an education management information system - information that will enable the measurement of school e'ciency and e(ectiveness, resulting in a more equitable distribution of educational resources, increasing the e'ciency and e(ectiveness of schools (Education Database, World Bank, data published on the Internet:
http://porodicnamedicina.com/download/Izazovi-Preporuke-Za-Reforme.pdf).
The IT sector occupies an important place in the economic trends of BiH and the region, and it is identified in all development documents as one of the key sectors of the economy. The IT sector has great potential for investment and has the opportunity to be one of the carriers of the economic development for the whole country. According to the o'cial classification of activities, information and communication technologies are classified among those whose structure, breadth and significance exceed the borders of BiH. According to the study on the development of the IT sector in the Sarajevo Canton from 2017, representatives of the private sector (IT companies) agreed that the systemic support was missing up until the present moment, and that there was no significant progress in the implementation of the strategic development plans for the IT sector at the level of BiH (which were developed and adopted in 2004). (The Study on the Development of the IT Sector in the Sarajevo Canton, 2017).
Soros (1999) indicates that, in an open society, people have di(erent freedoms as well as the freedom of their own choice, although they do not necessarily have to know what they want. In circumstances where the influence of tradition is lost even in conditions of rapid change, people are subject to di(erent suggestions. The ability of the country to ensure the well-being of its citizens is diminished by the capital's ability to avoid taxation and, consequently, unfavourable employment conditions for the workforce. It is very di'cult to analyse the global economic system that does not have a global political system as its counterpart (Soros, 1999). According to the World Bank data, in all countries, education is seen as the means of increasing the country's economic strength (World Bank, 1990), while Reich (1991) considers it as the means to facilitate access to new technologies and to increase international competitiveness.
ConclusionThe characteristic of modern society in recent years is the exchange of knowledge and information through information technologies, which we have written about in this paper. Information technologies o(er tools for the production, creation, collection, organization, use and storage of information and knowledge.

59
Techno ScienceInternational Scientific Journal of Technical Sciences
Referring to the interaction of economics, information technology and education, the European Employment Strategy has determined and supported the placement of education at the very top of the economic policy priorities, and thus the development of the education economy, through the development of the IT sector, would be logical. Ideas and knowledge should achieve economic progress in BiH alongside the natural resources and under the globalisation conditions, as well as technical and technological progress. Using this advancement with the investments in improving education systems, equipment and human resources, it is possible to achieve faster, better and more secure development of the economy. It is precisely the development of information technologies that would support products, services and the industry to attain stable economic growth, as well as the integration of Bosnia and Herzegovina into the European Union and the global economic processes. To summarize, the most profitable investments, considering education in general, are the investments in elementary education for the duration of 4 to 6 years, regardless of the economic development of the country and the social context.
Furthermore, secondary education has gained importance due to the technological development of certain sectors of the economy and the growing importance of higher education for the national economy. The economic benefit of higher education depends on the economic development of the country and the extent of the population enrolled in higher education (Pastuović, 1999). The school must change in order to better meet the new needs, and change can be innovation or may have a reformative character. For the success of the so-called innovations (innovations can be the result of the teachers' creativity and school leadership, while reform policies are initiated by the government), external support is important (Louis, Miles, 1990). Looking at all that has been said, we can conclude that any economic policy, investment in the education sector, as well as the development of IT, would not make IT development possible without the cooperation of all factors of society, starting with the students, all the way to the governments and those responsible for the reallocation of budgets and investments in the economic development of a country.
References1. Bašić, M., Economy of BiH. Sarajevo: Faculty of Economics, 2005.2. Louis, K. S., Miles, M. B., Improving the Urban High School: What Works and Why. New York: Teacher College
Press, 1991.3. Pastuović, N. , Edukology: integrative science on the system of lifelong education and upbringing, Zagreb:
Znamen, 1991.4. Reich, R.B. , The Work of Nations. New York: Alfred E. Knopf, 1991.5. Samuelson, P.A.,Economics introductory analysis, Belgrade: Contemporary Administration, 1969.6. Soros, G. ,The crisis of global capitalism. Sarajevo: Rabic, 1999.7. Suzić, N., Pedagogy for the XXI century, Banja Luka: TT-Centar. 2005.8. World Bank,Primary Education. A World Bank Policy Paper. Washington, DC: World Bank, 1990.9. Strik Consulting d.o.o. Sarajevo. (2017). Development of the IT sector in the Sarajevo Canton, 2017.10. Agency for Statistics of Bosnia and Herzegovina http://www.bhas.ba/?option=com_
content&view=article&id=113=ba(Downloads: 20th June 2019)11. TV station Balkans Aljazeera http://balkans.aljazeera.net/vijesti/obrazovanje-u-bih-zakone-i-budzete-ne-
prati-njihova-implementacija (Downloads: 21st June 2019)12. Education database, World Bank, data published on the Internet: http://porodicnamedicina.com/download/
Izazovi-Preporuke-Za-Reforme.pdf (Downloads: 21st June 2019)13. The Council of Ministers of Bosnia and Herzegovina and the United Nations Development Programme BiH-
UNDPhttp://www.mkt.gov.ba/bos/dokumenti/zakoni/default.aspx?id=1499&langTag=bs-BA (Downloads: 22nd June 2019)

60
Techno ScienceInternational Scientific Journal of Technical Sciences
Ekonomija ulaganja u obrazovni sektor kroz razvoj IT sektora
SAŽETAKObrazovni sektor stavljen je u vrh prioriteta svih ekonomskih politika obrazovanja u svijetu i kao takav smatra se neizostavnim elementom kada su u pitanju bilo kakve inovacije, unaprije)enja ali i reforme. Posljednjih godina, ekspanzijom nauke, tehnologije i drugih grana nauka, došlo je do modernizacije obrazovanja, odnosno obrazovnih sistema, uvo)enjem IT-a. Bitno pitanje koje se nametalo neposredno prije same modernizacije jeste isplativost ovakvih poduhvata i njihova svrha. Samim time provele su se brojne studije čija je svrha bila da se provjeri koliko je učinkovito i neophodno uvo)enje informacionih tehnologija u nastavu. Razvoj IT-a posljednjih dvadesetak godina omogućio je, ne samo razvoj nove grane nauke, nego i razvoj svih drugih segmenata društva pa i obrazovanja a što je i predmet ovog rada. Razvoj IT sektora isplativ je u svakom pogledu a ekonomija ulaganja u obrazovanje pratila je i razvoj IT-a spojiviši ova dva elementa u jednu funkcionalnu, isplativu i nadasve korisnu cjelinu.Ključne riječi: ekonomija, obrazovanje, informacione tehnologije, ulaganje
Received: November 02, 2018 / Accepted: November 08, 2018Correspondence to: mr. Ahmed Palic, University of Travnik, Faculty of Technical Studies, Travnik, Bosnia and HerzegovinaE-mail:[email protected]

61
Techno ScienceInternational Scientific Journal of Technical Sciences
DRAGAN GNJATIĆ, DALIBOR MISIRAČA
ABSTRACT
FACULTY OF TECHNICAL STUDIES, UNIVERSITY OF TRAVNIK, BOSNIA AND HERZEGOVINA
IT sector challenges in the education system
Introduction
I n the area of information and communications technology, the significance of education is proportional to the technological development
of a society. It is precisely why, starting from this fact, an increasing number of universities in the world have recognised the significance of acquiring knowledge through the Internet. This type of education is considerably developed worldwide under di(erent names: “learning through the Internet”, “distance learning” and “virtual learning”. In that regard, today, there are numerous organisations bringing together such higher education institutions. One of the characteristics related to the contemporary information society is that, upon mainstream education, people have the need to further improve themselves through various forms of formal, non-formal and informal learning. Due to the very dynamics of life and their obligations, many
Building a knowledge society requires a modified method of management and knowledge which will a(ect the future production owing to the information and scientific education system, di(erent from the polytechnic, dualistic education system. Information and knowledge as the new, dominant topics transform a global society into an educational and scientific system. Nowadays, education is considered as the requirement for survival and development of modern societies, and knowledge is frequently perceived as the most powerful weapon of a society. In the area of information and communications technology, the significance of education is proportional to the technological development of a society. It is precisely why, starting from this fact, an increasing number of universities in the world have recognised the significance of acquiring knowledge through the Internet. This type of education is considerably developed worldwide under di(erent names: “learning through the Internet”, “distance learning” and “virtual learning”. In that regard, today, there are numerous organisations bringing together such higher education institutions. In this paper, the author talks about the significance and challenges of the IT sector in the education system, especially in the higher education system, with an emphasis on distance learning which is today no longer a trend, but a necessity.
Keywords: electronic learning, information and communications technology, the Internet
strive towards professional training and acquiring new knowledge and skills through methods that do not disturb their daily responsibilities. For such people, the need to acquire knowledge through educational activities, regardless of the place and time, arises in and of itself. Such a need points at the fact that distance learning is becoming an inevitability in this day and age.
E-learningDistance learning is a type of education which originated in the first half of the 19th century. It is believed that an Englishman called Isaac Pitman was its pioneer. It was created in order to overcome di(erent obstacles like time, space or modest financial means, as well as meet the needs of marginalised groups, primarily women, who in the

62
Techno ScienceInternational Scientific Journal of Technical Sciences
education system of the day did not have adequate access to educational contents. If we want to determine the beginning of this type of education more precisely, we should accept the year 1858 as its starting point, when the University of London, through their decision to allow people to take exams without previously attending lectures, laid the foundations for the first o'cial type of distance learning in the form of correspondence courses.
When we talk about the contemporary notion of education, the goal is no longer to simply reproduce knowledge, but to strive, as much as possible, to actively include students in the knowledge acquisition process using various sources of knowledge.1
“Learning through the Internet”, that is, the so-called e-learning is related to such a form of teaching where the teaching contents are presented to students through the Internet. Thereby, it is important to keep in mind that this is not only about publishing teaching materials from a certain area of the Internet, but an e(ort is made to resemble classical teaching as much as possible when it comes to its social and other aspects. Likewise, by “teaching through the Internet”, we often strive to avoid some deficiencies present in classical teaching like limited availability of information necessary for successful subject matter acquisition, low quality of presenting teaching contents, etc.
Under the notion e-learning we imply the execution of the educational process with the help of information and communications technology, i.e., a series of procedures with which it is possible to individually exchange information and acquire knowledge.
It comprises numerous learning strategies and requires support from various technologies taking part in the student-content-teacher interaction.Technological support has been continually developed from the learning systems based on large computers, through television, applications adapted to various operating systems on personal computers, as well as videoconferences, up to the Web-based systems, intelligent tutoring systems and learning management systems.
1 Branković D., Mandić D., Metodika informatičkog obrazovanja, Faculty of Philosophy in Banja Luka, Banja Luka 2003, p. 35.
M-learning, e-learning, d-learningAt every turn, the Internet and information technologies change many aspects of life in BiH and the world. Thus, everyone is familiar with the fact that, today, information technology is one of the most powerful and flexible technologies ever made. It is precisely why we say that computer science, i.e., technology changed everything: the way we work, communicate, spend our leisure time, learn and acquire new information. And for that reason precisely, we can deem the information revolution not only as technological but also largely sociological and ethical.2
The continuous development and achievements of information technology have significantly raised not only the level of education and information exchange, but also the level of job performance in the business and production functions of companies. It could be pointed out that the most important component of information technology is represented by the computers themselves. They represent the possibility of a fast, easy, e'cient and inexpensive way of exchanging di(erent information both in the education and the business sphere, as well as in daily interpersonal communication. The usage of computer information technology enables a completely new organisation of scientific and educational work which is appropriate for the students’ individual abilities and interests, provides fast and e'cient emission, transfer and absorption of knowledge, connects students with the database, stimulates activity, independence, as well as brainpower and student creativity. Such an opportunity to mobilise students and their independent work is the main characteristic of computer-supported teaching and learning.3The technical, scientific and technological progress that ensued has had a significant impact on the changes in education and teaching. The changes have arisen in the organisation of educational contents, as well as in introducing and applying new procedures, methods, techniques, resources and media. Contemporary educational technologies have become an integral part of the teaching process with a tendency to not only improve the teaching process, but also fundamentally change it.
2Bogdanović M., Obrazovni so%veri, obrazovanje i nacionalno vaspi-tanje, Tematski zbornik: Mogućnost nacionalnog vaspitanja u vreme globalizacije, pp. 265-282, Teacher Training Faculty, Vranje, 2010.
3Vilotijević M., Didaktika 3 – organizacija nastave, Školska knjiga, Belgrade, 2007.

63
Techno ScienceInternational Scientific Journal of Technical Sciences
Multimedia, as a part of information technology, is often applied in teaching, and therefore, it can be concluded that multimediality is an important feature of the contemporary education system. Considering the fact that the focus of the teaching process has already started to shift (away from the teaching contents and the teachers towards the student), there is no doubt that multimedia greatly contribute in modernising traditional teaching. 4
When it comes to education and acquiring knowledge, it always started with traditional learning, learning through audio lessons, video lessons, electronic learning, distance learning, up to today’s mobile learning - m-learning. Mobile learning is a type of distance learning (d-learning) and electronic learning (e-learning). Application of multimedia is an imperative of contemporary teaching. The e(ects multimedia have on the teaching process depend upon its usage. If they are implemented and chosen in the right way, multimedia have the capacity to enrich and enhance learning in a way that makes it pleasant for students. The potential of multimedia in a teaching environment is enormous. However, even the cutting-edge multimedia can lead to didactic failures in teaching.
Therefore, it is necessary to properly select, organise and apply technology in teaching based upon the necessities, capabilities and goals we have at a given moment in the education system. It is clear that multimedia significantly a(ect the teaching process. Nevertheless, their application should not be approached in a restrictive manner. It is best to combine multimedia with other means, sources, approaches, and the teacher should manage, organise and monitor the e(ects of teaching, as well as perform corrections by proportioning certain multimedia. This will lead to more e'cient and e(ective teaching. 5
Distance learning (DL) has crossed international borders and our country is already entering the international market of electronic learning. The USA are a competitive market in electronic learning and education. The experience of America, Canada and Australia in this field dates back to the 1880s.
4 Ibid.
5 Krneta D., Metode učenja u svjetlu promena u obrazovanju, Inovacije u nastavi, Belgrade, 2007, 1, pp. 79-89.
Today, electronic learning is a completely natural phenomenon even at the most famous universities (Harvard, Stanford, and MIT) which, in their virtual classrooms, o(er a large selection of the most versatile, accredited academic courses. 6
In the second half of the nineties, there was an expansion of information and communications technology (ICT), resulting in a rapid development of the Internet. Distance learning has transitioned from paper into an electronic form. Such a change has brought forth a new name - electronic learning (e-learning). Lessons are now sent to the user exclusively in electronic form (via electronic mail or FTP (File Transfer Protocol). The completed tests are returned by the user to the educational institution via electronic mail. 7
Mobile learning (m-learning) represents electronic learning where access to study materials is enabled by using a PDA device (Personal Digital Assistant) and a mobile phone. Typically, electronic learning is described as learning “anytime” and “anywhere”, but, with access to a computer and an Internet connection. Mobile learning does not require these connections. Everything a student needs is a PDA device or a mobile phone and a wireless network.
6 Bogdanović, M., Elektronsko učenje, učenje na daljinu, Zbornik radova i deo- peti Međunarodni simpozijum tehnologija, informatika i obrazovanje za društvo učenja i znanja, pp. 299-308, Faculty of Techni-cal Sciences, Čačak, 2009.
7Bogdanović, M., Elektronsko učenje, učenje na daljinu, Zbornik radova i deo- peti Međunarodni simpozijum tehnologija, informatika i obrazovanje za društvo učenja i znanja, pp. 299-308, Faculty of Techni-cal Sciences, Čačak, 2009.
8 Shank, P., Precht, L. W., Everidge, J., Bozarth, J. Infrastructure for Learning: Options for Today or Screw – Ups for Tomorrow, The e-Learning Handbook, Pfeiffer, San Francisco, 2008, pp. 113-166.
9 Ellis, R. K., Field Guide to Learning Management Systems, ASTD Learning Circuits, 2009.
Technology infrastructureImplementing e-learning at higher education institutions implies the usage of corresponding infrastructure comprised of both the necessary hardware and software components. Some authors point out that the success of the entire e-learning is largely dependent upon the used infrastructure. 8The key component of this infrastructure is the Learning Management System (LMS). LMS is a complex software system for administration, documenting, tracking, reporting and delivering online courses.9

64
Techno ScienceInternational Scientific Journal of Technical Sciences
Therefore, it represents software support for all aspects of the learning and teaching process.
Apart from a large number of commercial LMS, several open source systems are also in use and the most popular are as follows 10 :
• Moodle (an abbreviation for Modular Object-Oriented Dynamic Learning Environment) has been around since 2002 and, after over ten years of existence, it is very popular among educators throughout the world. Out of all open source systems, this one is dominant in Serbia
• LRN was developed at the Massachusetts Institute of Technology (MIT) and it has over 500,000 users in institutions in over 18 countries.
• eFront o(ers both a free and a commercial version of the software.
• Apart from a free basic version, Dokeos o(ers a commercial one, as well as a third version exclusively intended for the field of medicine. Sakai was designed by MIT, Berkeley and Stanford with the idea to create an LMS which they will also use, so that it completely satisfies the needs of a university.
Considering the large number of software solutions, to find the best LMS for your needs, make sure you’ve considered these factors 11 :
1. Who will be the system users? There are di(erences between the solutions intended for corporate and those intended for academic institutions. So, for example, higher education institutions can immediately eliminate half of the o(ered software solutions since they will not suit their needs. They should take into consideration only those systems that enable monitoring student progress, grading, etc.
2. Determine the budget. One should know how much money is available for LMS in order to see which software solutions are a(ordable.
10 Chaudhari, S., Top Open Source Learning Management Systems, 2012, http://elearningindustry.com/topopen-source-learning-manage-ment-systems
11 Barrish, J. How To Choose A Learning Management System, 2013, http://www.teachthought.com/technology/how-to-choose-a-learning-management-system/
3. Prioritise functional features. Since LMS has to cover various functions, it is best to create a list of the features the system should possess. Then the LMS solutions should be compared according to those features.
4. Plan further growth. You should always chose the LMS that can grow with the number of system users in the future.
LMS is not the only software solution used for e-learning. Most LMSs do not have the option to create or change the teaching content, so Content Management Systems (CMS) are used for that purpose. Learning Content Management Systems (LCMS) are also available. These systems focus on teaching contents, their creation, reuse, management and delivery. 12
Distance learning challenges of a technological natureIntroducing distance learning in higher education institutions represents a sort of a challenge for all employees, with concern and even resistance often occurring among them. In order to remove them, it is necessary to understand the professors’ doubts in relation to this new form of education. Wilson and Christopher point out that they are usually worried about the following issues 13:
• Poor technology infrastructure: What kind of infrastructure does my institution have available?
• Internet access: Do students have high-speed Internet connections and other required technology?
• Unreliable technology: How reliable is the technology at our disposal?
• Variable technology requirements: Will I be able to keep up with the always-changing requirements and standards related to distance education technologies?
12Advanced Distributed Learning (ADL) Co-Laboratories (2011) Choosing a Learning Management System, http://www.adlnet.gov/wp-content/uploads/2011/07/Choosing-LMS-v.2.4_201104132.pdf
13 Wilson, B. G., Christopher, L., Hype Versus Reality on Campus, 5e e-Learning Handbook, Pfei6er, San Francisco, pp. 29-54.

65
Techno ScienceInternational Scientific Journal of Technical Sciences
Distance education, then, raises numerous questions, and all of them have to be kept in mind when introducing such a form of teaching and learning which greatly di(ers from the traditional ones.14
14 Ćamilović, D., Visokoškolsko obrazovanje na daljinu, Vitez-Tuzla-Zagreb-Belgrade-Bucharest, Vol. XV, No. 31, 2013.
ConclusionOver the past decade, electronic learning has experienced a sudden expansion primarily because of the advancements in the field of information and communication systems. By keeping up with the global trends and also striving to improve work quality in the domain of education, a large number of accredited higher education institutions in Bosnia and Herzegovina have included this form of learning in their regular programmes at all study levels.
The results of this and other related research indicate that there is great interest and necessity for further expansion and development of such programmes.
Their introduction primarily requires the institution to possess technical equipment, however, training and working in the field of general awareness are even more important when it comes to the teaching sta( since teachers carry out the process and it is important for them to be familiarised with new technologies and teaching methods (i.e. the advantages that come with them).
References1. Advanced Distributed Learning (ADL) Co-Laboratories (2011) Choosing a Learning Management System,
http://www.adlnet.gov/wp-content/uploads/2011/07/Choosing-LMS-v.2.4_201104132.pdf2. Barrish, J. How To Choose A Learning Management System, 2013, http://www.teachthought.com/
technology/how-to-choose-a-learning-management-system/3. Bogdanović M., Obrazovni softveri, obrazovanje i nacionalno vaspitanje, Tematski zbornik: Mogućnost
nacionalnog vaspitanja u vreme globalizacije, pp. 265-282, Teacher Training Faculty, Vranje, 2010.4. Bogdanović, M., Elektronsko učenje, učenje na daljinu, Zbornik radova i deo- peti Me)unarodni simpozijum
tehnologija, informatika i obrazovanje za društvo učenja i znanja, pp. 299-308, Faculty of Technical Sciences, Čačak, 2009.
5. Branković D., Mandić D., Metodika informatičkog obrazovanja, Faculty of Philosophy in Banja Luka, Banja Luka 2003, p. 35.
6. Chaudhari, S., Top Open Source Learning Management Systems, 2012, http://elearningindustry.com/topopen-source-learning-management-systems
7. Ćamilović, D., Visokoškolsko obrazovanje na daljinu, Vitez-Tuzla-Zagreb-Belgrade-Bucharest, Vol. XV, No. 31, 2013.
8. Ellis, R. K., Field Guide to Learning Management Systems, ASTD Learning Circuits, 2009.9. Krneta D., Metode učenja u svjetlu promena u obrazovanju, Inovacije u nastavi, Belgrade, 2007.10. Shank, P., Precht, L. W., Everidge, J., Bozarth, J. Infrastructure for Learning: Options for Today or Screw –
Ups for Tomorrow, The e-Learning Handbook, Pfei(er, San Francisco, 2008.11. Vilotijević M., Didaktika 3 – organizacija nastave, Školska knjiga, Belgrade, 2007.12. Wilson, B. G., Christopher, L., Hype Versus Reality on Campus, The e-Learning Handbook, Pfei(er, San
Francisco.
Izazovi IT sektora u sistemu obrazovanjaSAŽETAKIzgradnja društva znanja zahtjeva izmjenjen način upravljanja i znanja koji će uticati na buduću proizvodnju, zahvaljujući informacijskom i naučnom obrazovnom sistemu koji se razlikuje od politehničkog dualističkog obrazovnog sistema. Informacija i znanje kao novi vladajući predmet rada pretvaraju globalno društvo u

66
Techno ScienceInternational Scientific Journal of Technical Sciences
Received: November 03, 2018 / Accepted: November 10, 2018Correspondence to: prof.dr Dalibor Misirača, University of Travnik, Faculty of Technical Studies, Travnik, Bosnia and HerzegovinaE-mail:
obrazovni i naučni sistem. Obrazovanje se danas smatra uslovom opstanka i razvoja modernih društava, a znan-je se često posmatra kao najmoćnije oružije jednog društva. U oblasti informacione-komunikacione tehnologije značaj obrazovanja je u proporcionalnoj vezi sa tehnološkim razvojem društva. Upravo polazeći od ove činjenice sve veći broj univerziteta u svijetu prepoznao je značaj sticanja znanja putem interneta. Ovaj vid edukacije je uveliko razvijen u svijetu pod različitim imenima: „učenje putem interneta”, „učenje na daljinu” i „virtuelno učen-je”. S tim u vezi, danas postoje brojne organizacije koje okupljaju upravo ovakve visokoškolske ustanove. Autor u radu govori o značaju i izazovima IT sektora u sistemu obrazovanja, a posebno u visokom obrazovanju sa akcen-tom na učenje na daljinu koje u današnje vrijeme više nije trend nego potreba.
Ključne riječi: elektronsko učenje, informaciono komunikacione tehnologije, internet

67
Techno ScienceInternational Scientific Journal of Technical Sciences
DRAGAN GNJATIĆ, MIRELA ABIDOVIĆ SALKICA
ABSTRACT
FACULTY OF TECHNICAL STUDIES, UNIVERSITY OF TRAVNIK, BOSNIA AND HERZEGOVINA
The impact of technology on the relationship between labour and unemployment
Introduction
According to the guidelines of the International Labour Organisation (ILO), the standard international definition of unemployment
encompasses all persons older than the age limit determined for measuring the economically active population who were (1.) without work during the reference period, (2.) at any time, available for employment during the reference period, and (3.) seeking work (had taken specific steps with the goal to seek employment). Therefore, the criteria upon which the standard definition of unemployment is based on only relate to the individual’s activity during the reference period. All three criteria have to be met simultaneously. The only exception is related to people who have an employment contract to commence work after the reference period and no longer seek employment, but satisfy the other two criteria. Nevertheless, such people shall be classified as unemployed since they are now available for work, but they do not work, that is, they are a part of the unutilised labour resource in the economy. 1
The notion of unemployment can have di(erent meanings depending on the context in which it is used. It can describe a legal and administrative status, that is, registration at the employment o'ce or the right to receive unemployment benefits. At the same time, it can indicate an attitude, that is, preparedness to accept a job o(er under certain conditions. It can also be related to social di'culties within an economic system, as well as the imbalance between the labour supply and demand in certain parts or the entire labour market, and the lack of technological development in a specific society. This paper deals with the impact of new technologies on unemployment.
Keywords: unemployment, technology, positions
Unemployment as a Macroeconomic Notion in the Age of Developed TechnologiesUnemployment is a condition where a proportion of the working-age members of society cannot get employment according to their competences and qualifications, and with a standard salary. The unemployed include all members of a society who are partially employed, but their labour is not fully utilised, they do not have full-time jobs and su'cient income for normal subsistence.Unemployment represents one of the greatest economic issues of the contemporary world. It a(ects both the developed countries with a high standard of living and a developed economy, and the least developed, poor countries, as well as developing countries.
1 http://mjesec.6zg.hr/

68
Techno ScienceInternational Scientific Journal of Technical Sciences
In societies in which most people manage to survive by working for others, losing a job and being unemployed for a longer period of time represents a serious issue. Underutilisation of human resources in a country directly a(ects its economy and national income which, among other things, results in a low standard of living and ultimately, poverty.2
2Veselinović, P., Ekonomija, Univerzitet Singipedium, Belgrade, 2010, p. 224.
3 Ibid.
In January 2009, the number of unemployed people in the world reached a record high amounting to 200 million which represents 7% of the total working-age population on the planet, and it will likely grow. A deceleration of economic activities, which has been noted in the last two years, has brought about a 20-million increase in unemployment and helped it reach a record level. Today, the industrialised countries in Latin America are the worst a(ected ones, and the economic crisis raised their unemployment rate by 10%. This trend has also a(ected Europe where unemployment, after a minor fall recorded in 2003, rose again, amounting to 8.8% of the working-age population in 2009 3.
The aforementioned facts go in favour of the previously stated thesis that unemployment is taking on alarming proportions and becoming one of the major global issues, and the International Labour Organisation believes that, in the next ten years, it will be necessary to provide a billion new positions if the goal of the United Nations in halving the number of those who live in poverty is to be achieved.
Each modern economy has had, and it will have unemployment, more or less. In fact, a certain level of unemployment is inevitable since people change careers and companies change their production in order to achieve new goals and employ new technology. If the government would guarantee steady employment for all, companies would have di'culties in finding new employees for new ventures and the employees would not have su'cient incentives to adapt to economic changes. Nevertheless, unemployment represents an issue for the unemployed and their families. The actual political problem is the question of how much unemployment can be tolerated in order to enable economic growth, how would that unemployment be distributed among the population, etc.
We actually strive to ensure vacancies for all who want to work. This requires that we di(erentiate the total population form the smaller number of those who are prepared and willing to work, that is, those who belong to the labour force. The labour force encompasses people over 16, people who actually work and those who do not work, but actively seek employment 4.
The unemployment rate represents the ratio between the unemployed and the size of the labour force. The unemployment rate is a(ected by both the number of unemployed people and the total labour force. If there is an increase in the number of unemployed people during several months, the unemployment rate increases too. If the unemployment increase happens during those months when the size of the labour force grows significantly, the unemployment rate will decrease. This leads to the following measure of employment: labour force participation rate. It represents the labour force as the percentage of the entire working-age population called “non-institutional population” or “adult population”.
In the economies of the world, each one has only half of the total population participating in the labour force. The rest of the population is either too young, of school age, studying, at home, retired or otherwise unable to work. Outside the labour force, the unemployed are those who are not employed on a full-time basis and those who do not actively seek employment.
Unemployment was, is, and will be one of the most severe and frequently hardest issues related to the labour market. Why is the unemployment rate such an important indicator of a country’s economic stability? There are several reasons.
The unemployment rate is an indicator of the cyclic performance of an economy. This rate indicates which part of the total labour force does not have a job and seeks employment. On the other hand, the growth of the unemployment rate represents a precursor of recession since companies decrease the wages, begin dismissing employees or force annual leave as a response to the decreased demand. It sounds somewhat paradoxical, but it is nevertheless true, that employment and unemployment cannot grow at the same time.
4Jedinak, J., Osnovi ekonomije, PA, Belgrade, 2000, pp. 270-274.

69
Techno ScienceInternational Scientific Journal of Technical Sciences
The explanation lies in the fact that a contingent of new employment seekers who are entering the labour force surpasses the number of the newly-established positions. Therefore, the total employment increases but, in relative terms, unemployment further increases.
The main goal of each economic system is to use a limited amount of land, labour and capital, as e'ciently as possible, maximising the production of goods and services. When unemployment emerges, some labour inputs available to the economy are left unused, resulting in production loss.
Unemployment gains such significant attention which, as a phenomenon, costs certain employees and members of their families a great deal.
This burden is manifested in at least three forms 5:
• loss of income which goes hand in hand with unemployment,
• fear that the loss of employment will have negative consequences on finding a new job, career growth, contacts, or training and developing at work,
• unemployment brings about significant psychological and emotional consequences for the workers and members of their families which are further manifested in increasing crime frequency, mental illnesses, suicides and divorce.
For some, unemployment is relatively short and related to the normal process of transitioning from one job, or school, to the next. For others, unemployment may last for months or years due to the inability to find employment.
In order to understand why unemployment and the lack of labour force exist, it is very important to perceive economy as a dynamic and changing variable. The labour force market is not simply a market. It is composed of the market comprising people who continuously transfer from one market to another. At any time, people determine their alternatives and change their employment status. The labour force market is very busy, having great dynamics of people and positions.
5 Veselinović, P., Ekonomija, Univerzitet Singipedium, Belgrade, 2010, p. 227.
Each month, millions of working-age people change their employment status - around 5-6% in developed countries. In order to function, the economy also has to keep up with the changes of taste and technology. The old mode of operation has to be replaced with new technologies. Millions of positions are being created and destroyed each year. Fortunately, changes in technology have, historically, created more positions, rather than eliminating them.This does not imply that changes in the labour force market bring good luck to everyone. When new technologies replace the production process or the economy manufactures di(erent goods, many workers have to make a career change or improve their abilities.
The Impact of TechnologyThe concept of technological unemployment is regaining momentum in the discourse of economistsand economic sociologists. However, when analysing the debate, what is most surprising is the substantial absence of agreement on the very existence of technological unemployment as a phenomenon6. Carl Benedikt Frey, an economist, and Michael A. Osborne, an engineer, have researched how the development of technology and employing automation and robotics impacts job reductions and how it affects the need for certain qualifications. Some observers present technological unemployment as a sprawling monster that is completely subverting the global economy, while others conclude that this picture is just a mirage of doomsayers 7. The authors consider that new technologies will affect vocations and employment, and recognising these trends will provide guidelines, especially a change of education, as well as the socio-economic relations 8.
The Oxford Dictionary of Economics defines technological unemployment as follows: “Unemployment due to technical progress. This applies to particular types of worker whose skill is made redundant because of changes in methods of production, usually by substituting machines for their services.Technical progress does not necessarily lead to a rise in overall unemployment. 9
6Campa, R., Technological unemployment: A Brief History of an Idea. ISA eSymposium for Sociology, 2017, 7.1.
7Nikolić, G., Nove tehnologije donose promjene, Andragoški glasnik, Vol. 18, No. 2, 2014, p. 27.
8Nikolić G., Cjeloživotno učenje, potrebne promjene u obrazovanju odraslih; predavanje na IV. Susretu ustanova zaobrazovanjeodraslih, Opatija, April 15-16, 2013.

70
Techno ScienceInternational Scientific Journal of Technical Sciences
9Black, J., Hashimzade, N., Myles, G., A Dictionary of Economics, Oxford: Oxford University Press, 2012, p. 405.
However, throughout history, certain other data have shown an opposite viewpoint. Namely, wiping out jobs in the primary industry of the United States of America shows impressive numbers:in 1900, 41% of the workforce was employed in agriculture, and a century later, in 2000, only 2% of Americans were still employed in the same sector. 10
Popular opinions on technological progress often di(er significantly. Since the dawn of the Industrial Revolution, workers have been afraid that technological progress will make their jobs obsolete, resulting in unemployment. At the beginning of the 19th century, a group of English textile workers known as the Luddites destroyed new machinery which was seen as a direct threat to their positions. Similar events occurred in other countries. The word “sabotage” derives from one of the ways French workers destroyed machines: they put their sabots (heavy wooden shoes) into the machines.
The topic of technological unemployment often emerges whenever unemployment is high.During the Great Depression, supporters of the movement called technocracy movement claimed that unemployment is the result of machine introduction and the situation will only get worse if further technological progress is allowed. In Europe today - with high unemployment - in many countries, there is widespread support for a shorter 35-hour, or even 30-hour working week. Due to technological process, there is insu'cient work so as to enable full-time employment for all employees. The proposed solution hypothesises that each worker has fewer working hours (with the same hourly wage) in order to hire more workers. In its crudest form, the argument that technological progress causes unemployment is definitely not valid. Very large improvements in the standard of living accomplished by the developed countries during the 20th century have brought forth a major increase in employment and a non-systematic increase in the unemployment rate. In the USA, the gross domestic product per capita has increased 6 times following the year 1900, and, far from a decrease, employment increased 5 times (reflecting the simultaneous increase in the USA population).By observing di(erent countries, there is no evidence of a systematic, positive relationship between the unemployment rate and the level of productivity.
Japan and the USA, the countries with the highest levels of productivity, have the lowest unemployment rates among the OECD member countries.
In order to better understand this issue, it is necessary to di(erentiate between the two related, but separate dimensions of technological progress:
• Technological progress enables the production of a larger quantity of goods with the same number of workers. This can be stated in two ways. Optimistically: technological progress enables the economy to produce even more domestic product with the same number of workers. Pessimistically: technological progress means that the economy can produce the same amount of domestic product with even less workers. Those who consider technological progress as the process which increases the domestic product and the standard of living are being optimistic. Those who worry about technological unemployment are being pessimistic.
• Technological progress leads to producing new goods and the disappearance of the old ones.
• Alongside the technological progress, there is a complex process of creating and wiping out positions. This topic was central in the work of a Harvard economist Joseph Schumpeter who, in the 1930s, emphasised that growth is basically a process of creative destruction. For those who have lost a job and have to find new employment, or those who possess the sills which are no longer sought after, technological progress can represent a curse, not a blessing. And when it comes to consumers, they benefit from the availability of new products.
• Workers will be at a disadvantage due to extended unemployment and will accept lower wages when they find a new job. The concern that technological changes can negatively a(ect certain groups of workers is, nowadays, especially present in the USA. The last 20 years have been characterised by a decrease in relative wages for low-skilled labour force. Most signs indicate that technological development is the main cause.
10 Wladawsky-Berger, I., Technological Unemployment and the Future of Work, Wall Street Journal, November 6, 2015.

71
Techno ScienceInternational Scientific Journal of Technical Sciences
Technological Progress & the Impact on DistributionTechnological progress is the process of structural change. New products are being developed, making the old ones obsolete. New production methods are being presented, requiring new skills and making some old ones less useful. This process is called churning.
For those in the expanding sectors, or the ones possessing the right skills, technological progress leads to new options and higher wages. For those in the declining sectors, or the ones possessing the skills which are no longer sought after, technological progress can signify the loss of employment, a period of unemployment and, most likely, much lower wages.
There is popular opinion that the main wage increase factor for the highly-skilled in relation to the wages of the low-skilled workers is a constant increase in demand for highly-qualified workers in relation to the demand for the low-qualified ones.This trend in relative demand in not new; it was present to a degree even in the 1960s and 1970s.
ConclusionFor workers who have lost their jobs due to the introduction of new technology or owing to the closure of obsolete facilities, opportunities for employment in the same profession and in the local area are few, so that their unemployment can last for months, or even years. One of the solutions is a government intervention or assistance in organising and implementing retraining programmes. Another solution is to stimulate geographical mobility of the unemployed workers outside the local area. The third option for the government is to o(er former employers, who have previously dismissed employees, to create new service industry positions for the workers who have lost their jobs.
However, it was subsequently mitigated by a continual growth in the relative supply of highly educated workers: an increasing proportion of children who graduated from high school, enrolled in studies, completed their studies, etc. Since the early 1980s, the relative supply continued to grow, but not fast enough for it to be equated with the continual growth in relative demand. This resulted in a steady growth of relative wages for highly educated workers as opposed to the low-qualified ones.
References1. Black, J., Hashimzade, N., Myles, G., A Dictionary of Economics, Oxford: Oxford University Press, 2012.2. Campa, R., Technological unemployment: A Brief History of an Idea. ISA eSymposium for Sociology, 2017,7.13. Jedinak, J., Osnovi ekonomije, PA, Belgrade, 2000.4. Nikolić G., Cjeloživotno učenje, potrebne promjene u obrazovanju odraslih; predavanje na IV. Susretu
ustanova za obrazovanje odraslih, Opatija,April 15-16, 2013.5. Nikolić, G., Nove tehnologije donose promjene, Andragoški glasnik, Vol. 18, No. 2, 2014.6. Veselinović, P., Ekonomija, Univerzitet Singipedium, Belgrade, 2010.7. Wladawsky-Berger, I., Technological Unemployment and the Future of Work, Wall Street Journal, November
6, 2015.
Uticaj tehnologije na odnos između rada i nezaposlenosti
SAŽETAKPojam nezaposlenosti može imati različita značenja ovisno o kontekstu u kojemu se koristi. Može opisivati pravno-administrativno stanje odnosno evidentiranost na listi zavoda za zapošljavanje ili pravo na novčanu naknadu za nezaposlene. Ujedno, može označavati stav odnosno spremnost na prihvatanje posla pod odre)enim uslovima.

72
Techno ScienceInternational Scientific Journal of Technical Sciences
Može se odnositi i na socijalne teškoće unutar odre)enog privrednog sistema, kao i na neravnotežu ponude i potražnje rada na pojedinim dijelovima ili na cjelokupnom tržištu rada, kao i ne tehnološki razvoj konkretnog društva. U radu se govori o uticaju novih tehnologija na nezaposlenost.
Ključne riječi: nezaposlenost, tehnologija, radna mjesta
Received: December 05, 2018 / Accepted: December 13, 2018Correspondence to: Mr. Mirela Abidović Salkica, University of Travnik, Faculty of Technical Studies, Travnik, Bosnia and HerzegovinaE-mail: [email protected]

73
Techno ScienceInternational Scientific Journal of Technical Sciences

74
Techno ScienceInternational Scientific Journal of Technical Sciences
Instructions to the authors of papers
Aim and purpose of the journalTechno Science – is an International scientific journal in the field of technology. It is issued twice a year.
The AbstractEach paper is evaluated in relation that it corresponds to the intention of the journal, and then it gets reviewed. The authors are responsible for the content and the ethics of everything that is in the Paper The authors can be requested to give a specific statement that the work has not been published in another publication. Techno Science doesen’t prejudice the copyright of the authors of published papers, but prereserves the right of distribution in accordance with the legal provisions, and without further consultation with the authors, with which the authors sgree when submitting the paper. Authors are not entitled to re-release / reprint, except one copy of the printed journal.
Preparation of attachmentsIt is recommended that the authors keep the structure of the journal that includes: the Abstract, Keywords, the Introduction, the Problem and the Aim, the Methods, the Results, the Discussion, the Conclusion and the Literature. This recommendation does not bind the authors but helps on the way to ease the understanding of the material and the publicaton. The attachements are not limited in size, but should not exceed 7 pages in the journal. The textfont is Times New Roman 11 pt, line spacing is 1,15 created in 2 columns. The Editorial Board reserves the right to edit the text, title, subtitle and fonts of other materials according to the Techno Science Graphics Standards Manual. Expected size is 12 000 characters without tables and images (exceptionally it can be 14 000 characters). All tables should be standardized (eg, MS Excel), images, photographs and other illustrations should be in vector format or resolution that provides quality printing (600 dpi). In case of illustration edit for print purpose, authorswill be consulted via e-mail.
Lists of referencesLists of references, as well as other forms of text formatting, will be accepted if they are made by the APA standard (American Psychological Association), translated into English with an indication of the original language in brackets. The attachment is sent exclusively in electronic form (e-mail, CD, disc etc.).
Delivery addresses for the attachmentsTechno Science – Association for Research, Education and Development, Aleja konzula No. 5, 72270 Travnik, Bosnia and Herzegovina; E-mail: [email protected]
Attachments languageTechno Science publishes the papers in English with abstracts in Bosnian. In case that the attachment is sent in its original form on another international language, the author of the attachment will be consulted.
NoteAttachments that do not fulfill the conditions or if they need further consultation will be returned to the author with the warning about the actions that need to be undertaken.
Publication of the journalThe journal is published in printed and electronic form. The electronic version is available onthe web addresses: www.technoscience.ba

75
Techno ScienceInternational Scientific Journal of Technical Sciences
Instructions to the authors of papers Upute autorima radova
Namjera i svrha časopisaTechno Science – me)unarodni znanstveni časopis iz područja tehnologije. Izdaje se dva puta godišnje.
Opće odredbe o prilozimaSvaki rad se vrednuje u odnosu na to odgovara li intenciji časopisa, a zatim se upućuje na recenzije. Autori snose odgovornost za sadržaj te etičnost svega što je radu. Od autora se može zatražiti posebna izjava da rad nije objavljen u nekoj drugoj publikaciji. Techno Science ne dovodi u pitanje autorska prava autora objavljenih radova, ali zadržava pravo distribucije u skladu sa pravnim odredbama i bez dodatne konsultacije sa autorima,a sa čime autori predajom rada postaju saglasni. Autori nemaju pravo na reizdanje/reprint, osim jednog primjerka štampanog časopisa.
Priprema prilogaPreporučuje se da se autori pridržavaju forme koja uključuje: sažetak, ključne riječi, abstract, keywords, uvod, problem i cilj, metode, rezultati, rasprava i zaključak i literatura. Ova preporuka ne obavezuje autore priloga, ali olakšava put do publiciranja i kasnijeg lakšeg razumijevanja materije. Prilozi nisu ograničeni veličinom, ali ne bi trebali prelaziti 7 stranica u časopisu. Font teksta je Times New Roman Regular 11 pt, proreda 1,15 kreirano u 2 kolone. Urednički kolegij zadržava pravo da vrstu i pismovnu veličinu fonta teksta, naslova, podnaslova i ostalih sadržaja uredi prema Knjizi grafičkih standarda časopisa Techno Science. Očekivana veličina je 12.000 znakova bez tabela i slika (izuzetno 14.000). Sve tabele trebaju biti standardne (npr. MS Excel), a slike, fotografije i druge ilustracije u vektorskom formatu ili rezoluciji koja osigurava kvalitetnu štampu (600 dpi). Radi pripreme za štampu, a u slučaju ure)ivanja ilustracija, autori će biti konsultirani ili informirani putem e-maila.
Navodi referenciNavodi literature, kao i drugi oblici formatiranja teksta, bit će prihvaćeni po APA standardu (American Psychological Association), prevedeni na engleski sa navodom originalnog jezika u zagradi. Prilog se šalje isključivo u elektronskom obliku (e-mail, CD, disk,...).
Adrese za dostavu prilogaTechno Science – Udruženje za istraživanje, edukaciju i razvoj , Aleja konzula br. 5, 72270 Travnik, Bosna i Hercegovina; E-mail: [email protected]
Jezik prilogaTechno Science objavljuje radove na engleskom jeziku uz sažetke na bosanskom jeziku. U slučaju da je prilog poslan u izvornom obliku na nekom drugom me)unarodnom jeziku, autor priloga će u vezi sa tim biti konsultiran.
NapomenaPrilozi koji ne ispunjavaju uslove ili je za njih potrebna dodatna konsultacija bit će istom vraćeni autoru s upozorenjem o radnji koju je potrebno poduzeti.
Objava časopisaČasopis izlazi u printanom i elektronskom obliku. Elektronska verzija dostupna je naweb adresi: www.technoscience.ba

76
Techno ScienceInternational Scientific Journal of Technical Sciences