Vodafone Qatar P.Q.S.C.€¦ · • Service Revenue grew 7.2% due to higher postpaid and fixed...
18
23 April 2020 Vodafone Qatar P.Q.S.C. Financial results: Three months ended 31 March 2020
Transcript of Vodafone Qatar P.Q.S.C.€¦ · • Service Revenue grew 7.2% due to higher postpaid and fixed...

23 April 2020
Vodafone Qatar P.Q.S.C.Financial results: Three months ended 31 March 2020

Disclaimer
2
• The following presentation is made only to, and is directed only at, persons to whom such a presentation may lawfully
be communicated (“relevant persons”). Any person who is not a relevant person should not act or rely on this
presentation or any of its contents.
• This presentation contains forward-looking statements that are subject to risks and uncertainties, including statements
about Vodafone Qatar’s beliefs and expectations.
• These forward-looking statements are based on assumptions that Vodafone Qatar has made in light of its experience in
the industry in which it operates, as well as its perceptions of historical trends, current conditions, expected future
developments and other factors which Vodafone Qatar believes are appropriate under the circumstances. Prospective
investors should understand that these statements are not guarantees of future performance or results.
• Due to these factors, Vodafone Qatar cautions that prospective investors should not place undue reliance on any
forward-looking statements. Further, any forward-looking statement speaks only as of the date on which it is made.
New risks and uncertainties arise from time-to-time, and it is impossible to predict these events or how they may affect
Vodafone Qatar.
• Vodafone and the Vodafone logo are trademarks of the Vodafone Group.

Quarterly highlights
Hamad Al ThaniChief Executive Officer

4
Profitable
Growth
Continues
Nine QuartersConsecutive YoY quarterly
total revenue growth
+10% YoYNet Profit QR 48m
for three months ended
31 March 2020 – Highest ever
quarterly net profit recorded
Healthier
Revenue Mix on
Track
Enterprise
Performance Enterprise performance driving
quarterly service revenue
growth
GigaHome Maintains
MomentumFTTH access network
and 5G investment
yielding positive results
Coverage &
Quality
Enhancements
> 1,000 SitesSurpassed 1k outdoor
sites as we ramp up capacity
and enhance coverage
Meeting New
DemandsDeployed in-building and
outdoor coverage
solutions in critical locations
Capturing
Market Share in
Competitive
Environment*
(4.2%)Total telecom market value
decreased in FY19 vs. FY18
due to lower total ARPU
Executive Summary | Highlights This Quarter
(*) Note: 12 months trailing as of Q4-2019 – 21.3% in FY18 to 22.5% in FY19
RMS +1.2pts YoYDespite headwinds, VQ grew total
RMS to 22.5% in FY19

5
Executive Summary | COVID-19 Operational Business Continuity
People
Retail
Operations
Network
Operations
Contact
Center
Supply
Chain
Critical Elements of Operational Business Continuity
Contact Center operations impacted by offshore lockdowns
have been mitigated through the mobilization of additional
resources onshore
Retail Operations / Distribution initially impacted due to
closure of malls
• Kiosks and store-in-store locations have been deployed in
key partner locations
• Our own online delivery service was launched via web and
app channels
• Employees’ in our retail stores have been provided with hand
sanitizer, latex gloves, facemasks and adhere to social
distancing guidelines
Network Operations have increased capacity to our fixed
broadband and mobile networks to cope with the increased
demand and we have enhanced coverage for new hospitals set
up for COVID-19
Supply Chain increased critical stock reserves, secured
secondary warehousing location for stocks and put joint
business continuity plans with key partners into action
Remote working in place since 17 March and adopted by
roughly ninety percent of our employees
1
2
3
4
5
Commentary
5

Financial review
Brett Goschen
Chief Financial Officer

FY 2020 Q1 | Key points to note and highlights
7
Items impacting YoY
comparisons
Strong Financial
Performance
Steady growth
in net profit
• One-off project revenue
recognized in FY19 Q1 and
related margin amounting to QR
9m (‘one-off’)
• Regulatory license fees paid to
CRA increased from 1% to 1.5%
of adjusted service revenue
impacting QR 2.1m in FY20 Q1
• FY20 Q1 service revenue grows
7.2% YoY driven by continued
growth in postpaid and home
broadband solutions
• Underlying EBITDA for the quarter
grows 17% (highest ever of QR
200m)
• Reported EBITDA margin of 37%,
highest ever. Excluding equipment
business, EBITDA margin is 39.2%
(3.4 ppts higher YoY)
• Underlying net profit (excl. one-
off ) grows 39% YoY in FY20 Q1
to QR 48m, the highest ever

• Total Revenue grew 1% led by service revenue growth 7.2% driven by continued growth in postpaid and fixed broadband (GigaHome)
• Expenses 3.9% lower due to cost optimisation program, lower equipment costs and impact of lower termination rates
• Underlying EBITDA increased 17% (excl. one-off) due to higher service revenue and lower expenses
• Net profit (excl. one-off) 39% higher driven by EBITDA growth partially offset by higher depreciation
Quarterly Financial Performance (Year on Year) (QR m)
FY20 Q1 v FY19 Q1
474508
61
FY19 Q1
33
FY20 Q1
535 541
+7.2%
+1.0%
Total revenue
202 186
152155
FY19 Q1 FY20 Q1
341354
-3.9%
Expenses
OPEX Direct costs
34
48
FY20 Q1
9
FY19 Q1
44
+39%
+10.3%
EBITDA
8
Service revenueEquipment Revenue
Net profit
1
2
3
4
172200
9
181
FY19 Q1 FY20 Q1
200
+17%
+10.7%
One-offUnderlying Net ProfitUnderlying EBITDA One-off
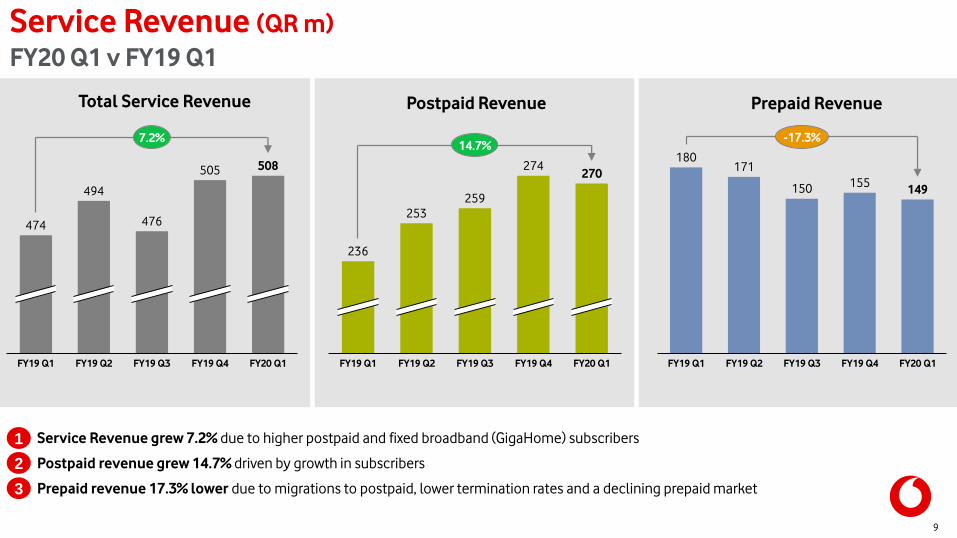
Service Revenue (QR m)
FY20 Q1 v FY19 Q1
9
• Service Revenue grew 7.2% due to higher postpaid and fixed broadband (GigaHome) subscribers
• Postpaid revenue grew 14.7% driven by growth in subscribers
• Prepaid revenue 17.3% lower due to migrations to postpaid, lower termination rates and a declining prepaid market
Postpaid Revenue
FY20 Q1
274
259
FY19 Q1 FY19 Q2 FY19 Q3 FY19 Q4
236
253
270
14.7%180
171
150155
149
FY19 Q4FY19 Q3FY19 Q2FY19 Q1 FY20 Q1
-17.3%
Prepaid RevenueTotal Service Revenue
508
FY19 Q3 FY19 Q4FY19 Q1 FY19 Q2 FY20 Q1
474
494
476
505
7.2%
1
2
3

10
• Total revenue grew 1% due to growth in service revenue offset by lower equipment sales (lower handset and one-off revenue)
• ARPU flat YoY driven by growth in postpaid and broadband offsetting lower prepaid revenue and impact of lower termination rates
Total Revenue (QR m)
FY19 Q2FY19 Q1 FY19 Q3 FY19 Q4 FY20 Q1
571
535541
527
491
+1%
82
FY20 Q1FY19 Q3FY19 Q1 FY19 Q2 FY19 Q4
84
85
86
84
FLAT
Mobility ARPU (QR)
Total
RMS22.6% 22.4% 21.8% 23.3% n/a
Total Revenue & ARPUFY20 Q1 v FY19 Q1
1
2

EBITDA & Underlying EBITDA marginFY20 Q1 v FY19 Q1
11
EBITDA margin % Underlying EBITDA Margin growth QoQ
• Highest ever reported margin of 37%, grows 3.2ppts YoY driven by growth in fixed broadband and postpaid revenue
• EBITDA margin of 39.2% excluding equipment business (growth of 3.4 ppts YoY)
1
2
33.8% 33.6%
34.8%
31.5%
37.0%35.8% 35.8% 36.1%
34.9%
39.2%
FY19 Q1 FY19 Q2 FY19 Q3 FY19 Q4 FY20 Q1
Reported EBITDA margin EBITDA margin excl. eqt
1.2
2.6
0.9
FY19 Q4
U/L EBITDA
Lower OPEXNet Service
Revenue Mix
39.2%
(0.4)
License fee
increase
FY20 Q1
U/L EBITDA
Lower A&R, bad
debt & Other
direct costs
34.9%
+4.3 ppts

21
34
4
12
Quarterly CAPEX MixTotal CAPEX
Capacity run and
maintenance
Coverage &
capacity
expansion
and others
Capabilities & IT
Transformation
CAPEX investment QR 59m focusing on:
• Mobile and fixed coverage expansion
• Investments to maintain the network
• Development of new commercial capabilities and products
CAPEX (QR m)
FY20 Q1 v FY19 Q1
CAPEX
Intensity7.9% 26.8% 43.4% 42.2% 10.8%
1
2
3
42
141
213
241
59
FY19 Q1 FY19 Q4FY19 Q2 FY19 Q3 FY20 Q1
+16.5m

Commentary YoY:
• Revenue increased driven by QR 34m growth in service
revenue (growth in postpaid and GigaHome) offset by lower
equipment sales
• Interconnect and other direct expenses QR 17m lower
due to lower equipment cost, reduction in mobile
termination rates and cost optimization initiatives
• Network, rentals and other operational expenses
increased by QR 4m due to additional fixed operational
and 5G related costs
• Employee salaries and benefits QR 1m lower
• Depreciation and amortization QR 10m higher due to
higher CAPEX incurred in FY 2019
• Financing costs increase by QR 2m due to local
refinancing of group financing facility and higher net debt
13
Consolidated statement of income Period ended 31 March 2020
QR m 31 Mar 20 31 Mar 19 YoY
Revenue 541 535 6
Interconnection and other direct expenses (186) (202) 17
Network, rentals and other operational expenses (101) (97) (4)
Employee salaries and benefits (54) (55) 1
Depreciation of property, plant and equipment (61) (59) (3)
Amortisation of intangible assets (44) (41) (3)
Depreciation of right-of-use assets (24) (20) (4)
Industry fee (5) (4) (1)
Operating profit 65 56 8
Finance cost (10) (8) (2)
Other financing costs (7) (6) (1)
Profit from mudaraba 0 1 (1)
Profit for the period 48 44 4
Basic and diluted earnings per share
(in QR per share)0.011 0.010 0.001
Three months ended

14
Consolidated statement of financial positionAs at 31 March 2020
QR m Mar-20 Dec-19 Var
Property, plant and equipment 1,464 1,484 (20)
Intangible assets 4,444 4,471 (27)
Right-of-use assets 344 358 (14)
Trade and other receivables 34 37 (2)
Total non-current assets 6,286 6,350 (64)
Inventories 30 38 (8)
Trade and other receivables 399 407 (7)
Cash and bank balances 167 303 (136)
Total current assets 596 748 (152)
Total assets 6,883 7,098 (215)
Share capital 4,227 4,227 -
Legal reserve 66 63 3
Retained earnings 62 230 (168)
Total equity 4,355 4,519 (165)
Loans and borrowings 920 820 100
Lease liabilities 258 253 5
Provisions and trade payables 231 229 2
Total non-current liabilities 1,409 1,302 107
Lease liabilities 99 121 (21)
Trade and other payables 1,019 1,155 (136)
Total current liabilities 1,118 1,276 (158)
Total equity and liabilities 6,883 7,098 (215)
Assets
• Property, plant and equipment decreased by QR 20m driven by
depreciation QR 61m offset by CAPEX of QR 41m
• Intangible assets QR 27m lower due to amortization QR44m offset by
CAPEX of QR 17m
• Right of use assets QR 14m lower as a result of depreciation QR 24m
offset by capitalisation for new leases of QR 10m
• Cash and bank balances QR 136m lower following the dividend payment
Equity
• Equity decreased by QR 165m due to dividend for FY19 of QR 211m offset
by the net profit for the period of QR 48m
Liabilities
• Loan and borrowings increased QR 100m on account of drawdown during
the period for settlement of dividend and vendor payments
• Lease Liabilities decreased by QR 16m resulting from payments of QR
31m offset by new capitalization of ROU assets QR 10m and interest unwind
of QR 5m
• Trade and other payables decreased QR 136m primarily driven by
settlement of CAPEX, regulatory and other payables

Questions ?

Appendix

17
1,737
FY19 Q1
1,734
FY19 Q2 FY19 Q3
1,721
FY19 Q4 FY20 Q1
1,743
1,763
-0.5%
Mobile Customers (‘000s) FY20 Q1 v FY19 Q1

Thank You
The Future Is Exciting
For more information visit our website: www.vodafone.qa/en/investor-relations
Or email us: [email protected]