
Visualizing the frequency of transit delays using QGIS and the Leaflet javascript library in R
22
Visualizing the frequency of transit delays using QGIS and the Leaflet javascript library in R Open Data Day Zurich, Hack-a-thon 2017 Peter B. Pearman Thomas Roth Open Data Day Zürich sponsors: Master Program in Biostatistics Our open tools:
-
Upload
zurichrusergroup -
Category
Data & Analytics
-
view
151 -
download
0
Transcript of Visualizing the frequency of transit delays using QGIS and the Leaflet javascript library in R

VisualizingthefrequencyoftransitdelaysusingQGISandtheLeafletjavascriptlibraryinR
OpenDataDayZurich,Hack-a-thon2017
PeterB.PearmanThomasRoth
OpenDataDayZürichsponsors:
Master Program in Biostatistics
Ouropentools:

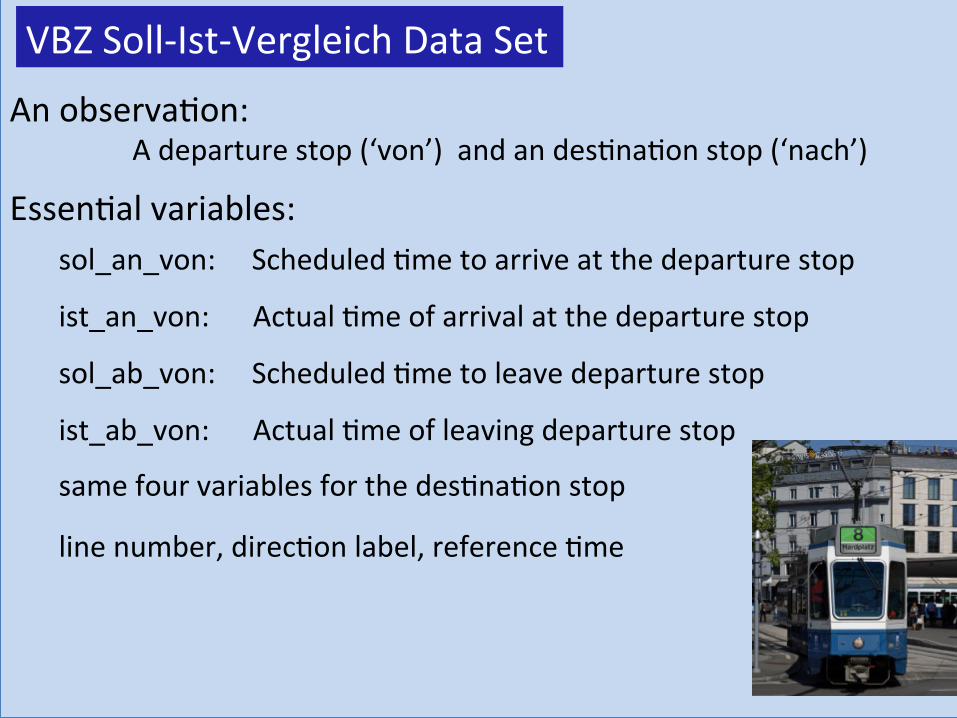
VBZSoll-Ist-VergleichDataSet
AnobservaJon:Adeparturestop(‘von’)andandesJnaJonstop(‘nach’)
EssenJalvariables:sol_an_von:ScheduledJmetoarriveatthedeparturestop
ist_an_von:ActualJmeofarrivalatthedeparturestop
sol_ab_von:ScheduledJmetoleavedeparturestop
ist_ab_von:ActualJmeofleavingdeparturestop
samefourvariablesforthedesJnaJonstop
linenumber,direcJonlabel,referenceJme
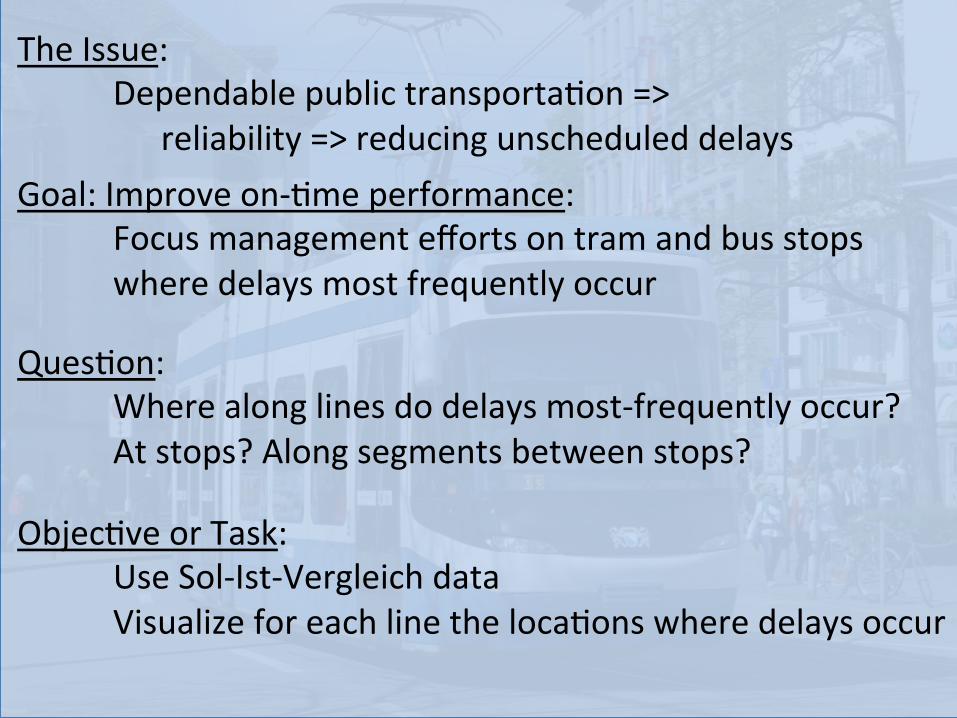
QuesJon:
Wherealonglinesdodelaysmost-frequentlyoccur? Atstops?Alongsegmentsbetweenstops?
TheIssue: DependablepublictransportaJon=> reliability=>reducingunscheduleddelays
Goal:Improveon-Jmeperformance: Focusmanagementeffortsontramandbusstops wheredelaysmostfrequentlyoccur
ObjecJveorTask: UseSol-Ist-Vergleichdata VisualizeforeachlinethelocaJonswheredelaysoccur

IniJalwork:ZürichOpenDataDayHack-a-thon
Lessthan8hourstogetpreliminaryresults(andabendatalkortwo)
78busandtramlines72weeksofdelaydata
eachwith>106linesofdata
Simplifytogetaquickresult:Bus33--afairlylongroute12weeksofdata
Simplemetricofdelay:--exceedscheduledelapsedJmeatstop--exceedscheduledelapsedJmeonstretch
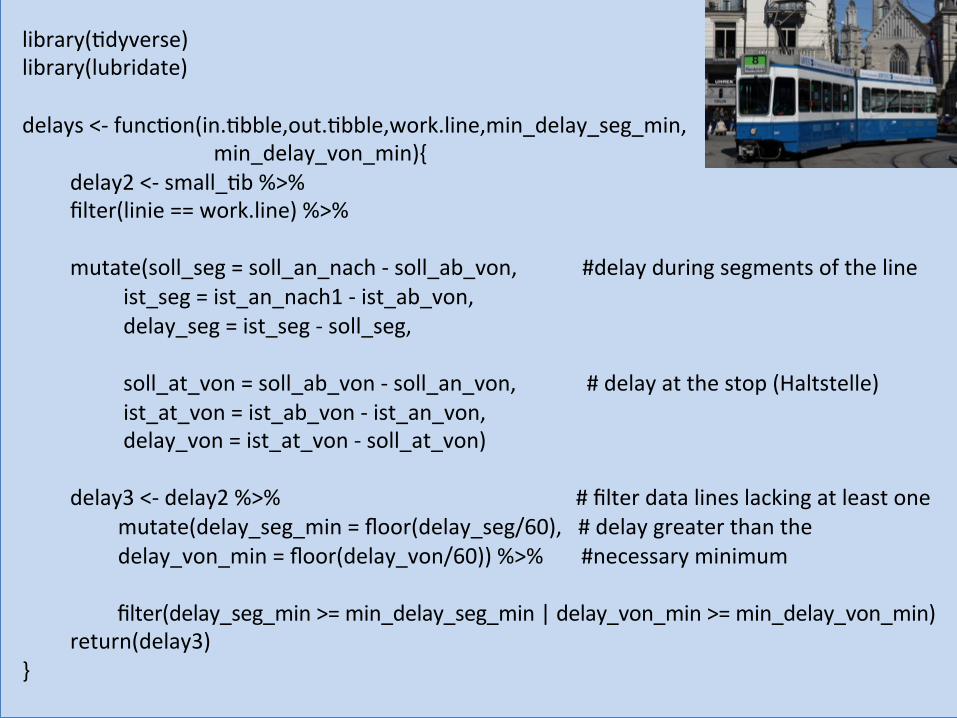
delays<-funcJon(in.Jbble,out.Jbble,work.line,min_delay_seg_min, min_delay_von_min){delay2<-small_Jb%>%filter(linie==work.line)%>%
mutate(soll_seg=soll_an_nach-soll_ab_von,#delayduringsegmentsoftheline ist_seg=ist_an_nach1-ist_ab_von, delay_seg=ist_seg-soll_seg, soll_at_von=soll_ab_von-soll_an_von,#delayatthestop(Haltstelle) ist_at_von=ist_ab_von-ist_an_von, delay_von=ist_at_von-soll_at_von)delay3<-delay2%>% #filterdatalineslackingatleastone
mutate(delay_seg_min=floor(delay_seg/60),#delaygreaterthanthe delay_von_min=floor(delay_von/60))%>%#necessaryminimum
filter(delay_seg_min>=min_delay_seg_min|delay_von_min>=min_delay_von_min)return(delay3)
}
library(Jdyverse)library(lubridate)

out_Jb<-Jbble()temp=list.files('../data/fahrzeiten_data')work.line<-33data_set=0num_datasets=12min_delay_seg_min=0min_delay_von_min=0for(iintemp){data_set<-data_set+1print(i)delay1<-read.csv(paste('../data/fahrzeiten_data/',i,sep=""),stringsAsFactors=FALSE)out_Jb<-delays(delay1,out_Jb,work.line,min_delay_seg_min,min_delay_von_min)if((data_set>=num_datasets)==TRUE)break()}#makeanindexforQGISplorngout_Jb$index<-paste(out_Jb$linie,'-',out_Jb$halt_punkt_id_von,'-',out_Jb$halt_punkt_id_nach,sep='')```

QGIS
QGIS2.18+PostgreSQL9.4DB(fordataloadedfromR)+afewshapefilesfromGISofKantonZürich
QGIS
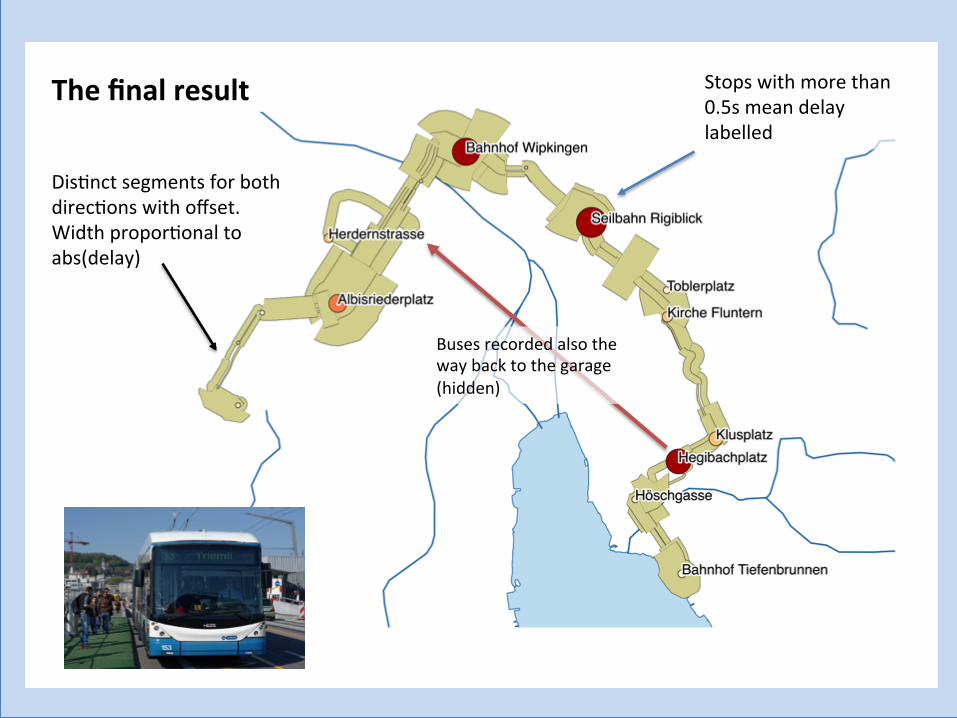
Busesrecordedalsothewaybacktothegarage(hidden)
DisJnctsegmentsforbothdirecJonswithoffset.WidthproporJonaltoabs(delay)
Stopswithmorethan0.5smeandelaylabelled
Thefinalresult

ObservaJonsonHackathonAcJvity• EssenJallygladtohaveasmallresultattheendoftheHackathonJ
• Lotsoffun!• MuchoftheeffortspentwiththeDIVAesquenatureofthedataandtheinterface(thesegmentkey)betweentheCalc-andtheVisualisaJonteam
• NB:Someeffortwentintohavingthecorrectlinecolor:whocareswithonlytheline33displayed?
• NotenoughJmetoverifytheactualvisualizaJondata

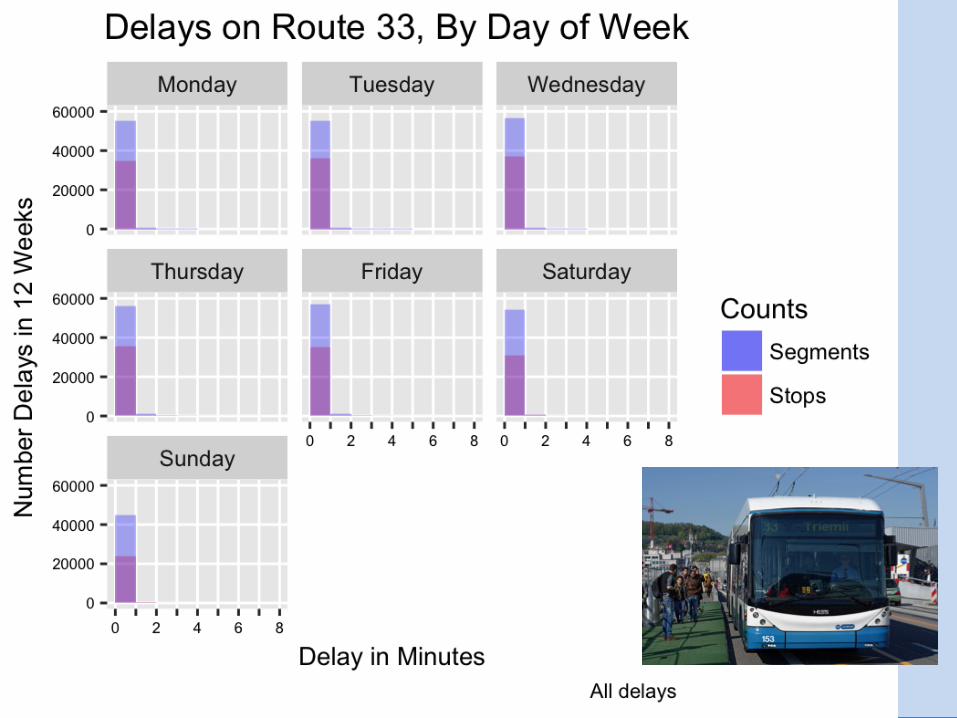
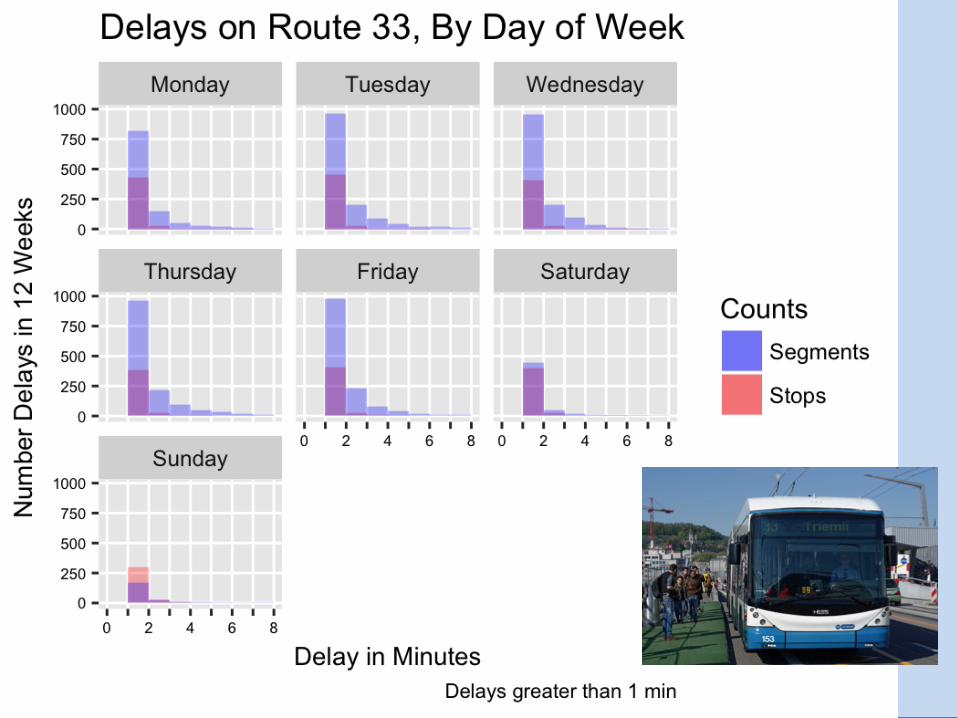
Delaysatstops >< Delaysalongsegments?
Howaboutallthosedelaysof<1minute?
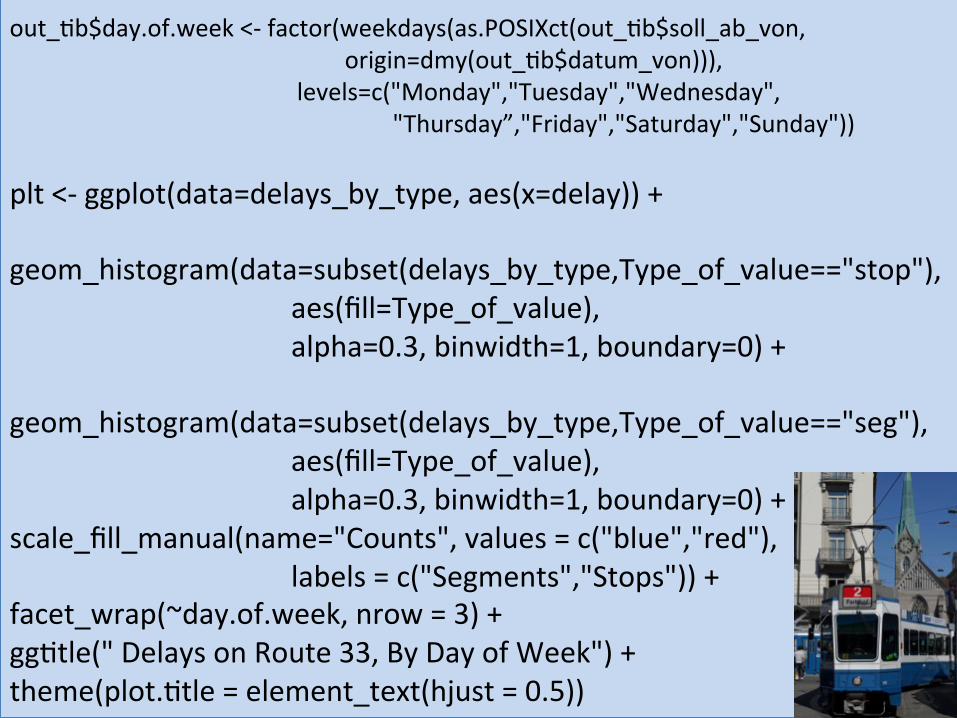
plt<-ggplot(data=delays_by_type,aes(x=delay))+geom_histogram(data=subset(delays_by_type,Type_of_value=="stop"),aes(fill=Type_of_value),alpha=0.3,binwidth=1,boundary=0)+geom_histogram(data=subset(delays_by_type,Type_of_value=="seg"),aes(fill=Type_of_value),alpha=0.3,binwidth=1,boundary=0)+scale_fill_manual(name="Counts",values=c("blue","red"),labels=c("Segments","Stops"))+facet_wrap(~day.of.week,nrow=3)+ggJtle("DelaysonRoute33,ByDayofWeek")+theme(plot.Jtle=element_text(hjust=0.5))
out_Jb$day.of.week<-factor(weekdays(as.POSIXct(out_Jb$soll_ab_von, origin=dmy(out_Jb$datum_von))), levels=c("Monday","Tuesday","Wednesday", "Thursday”,"Friday","Saturday","Sunday"))

IsexceedingJmeatastopreallyadelay?
Tableforeachlineandstop:TallynumberofdelayslongerthanathresholdThresholds:1,2,3,4,5,6minutes
SeparatethetalliesbydirecJon
scheduledarrival
Jme
scheduleddeparture
Don’tcountearlyarrivaltowarddelay

Note:Includesearlyarrivals

Note:Includesearlyarrivals

RinterfacefortheLeafletjavascriptlibrary:interacJvemaps
LeafletforRhbps://rstudio.github.io/leaflet/

GeneratehtmlmapwidgetswithLeafletjavascriptlibraryforR
for(iinlines){df<-#readaline’s.csvfile%>%
#filteroutGaragesandDepots%>%#mutatetocreateavariablethathaslabelinformaJonpal<-colorBin(palebe="Reds",domain=df$del_1_1,6,preby=FALSE)m<-leaflet(df)%>%addTiles2()%>%setView(lng=8.5402,lat=47.3778,zoom=12)%>%addCircles(~lon,~lat,label=~content,radius=150,stroke=TRUE,color="Black",weight=1,fillColor=pal(df$del_1_1),fillOpacity=0.8)%>%addLabelOnlyMarkers(~lon,~lat,label=~content)m<-m%>%addLegend("bobomright",pal=pal,values=~del_1_1,
Jtle='Delays>1min',opacity=0.8)saveWidget(widget=m,file=paste("./line_",i,".html",sep=''),selfcontained=TRUE)}
Let’slookatanRLeafletwidget

callthewidgetinanRStudiohtml_notebook….```{recho=FALSE}m_2 #examplenameofawidgetobject```RenderthenotebookfromRStudiointohtml
Seeitallhere:github.com/OpenDataDayZurich2016/visualizaJon_delays

ThankYou
github.com/OpenDataDayZurich2016/visualizaJon_delays


![QGIS - A bis Z€¦ · QGIS - A bis Z H wie Hardware QGIS Systemvoraussetzungen (qgis-user@lists.osgeo.org vom 10.03.2019) […] I have been running QGIS with a 10 year old dual core](https://static.fdocuments.net/doc/165x107/6080e6597c56b51fd2302842/qgis-a-bis-z-qgis-a-bis-z-h-wie-hardware-qgis-systemvoraussetzungen-qgis-userlistsosgeoorg.jpg)


