Visualize, Analyze, Quantify and Phenotype Immune … Mantra ™ quantitative ... • Reduces...
4
Quantitative Pathology Imaging and Analysis PRODUCT NOTE Key Features: • Visualize, analyze, quantify and phenotype immune cells in situ in solid tissues • Multiplexed biomarker analysis of tumors and tumor microenvironment in situ • Intuitive workflow optimized for the research pathologist • Compact workstation for fluorescence and brightfield • Pathology Views ™ renders immunofluorescence images as H&E, DAB and hematoxylin • Supports PerkinElmer’s Cancer Immunology Research Workflow Solution (staining, imaging and analysis) The Mantra ™ quantitative pathology workstation, with inForm ® image analysis software, enables visualization, quantification and phenotyping of multiple types of immune cells simultaneously in intact FFPE tissue sections for cancer immunology research. Unlike flow cytometry and next generation sequencing methods, which can phenotype and quantify immune cells in homogenized samples, Mantra generates images of FFPE tissue sections that maintain tissue architecture and morphology using multispectral imaging. This provides spatial information for a better understanding of the role and types of immune cells within both the tumor and the tumor microenvironment, so that cancer immunotherapy treatments may be identified and researched. The compact Mantra workstation is ideal for getting started with multispectral imaging and for assay development, freeing up higher throughput systems such as the Vectra ® Polaris ™ for running assays. The Mantra system is a part of PerkinElmer’s Phenoptics ™ research solution for cancer immunology which includes staining reagents, imaging systems, and image analysis software. It comes with the inForm image acquisition and analysis software, which provides powerful tools for tissue and cell segmentation, cell phenotyping and analysis. And it can be used with a variety of stains, including PerkinElmer's Opal ™ reagent kits. Visualize, Analyze, Quantify and Phenotype Immune Cells in situ Mantra For research use only. Not for use in diagnostic procedures. inForm ® Image Analysis Software Vectra ® Polaris ™ , Vectra ® 3 and Mantra ™ Quantitative Pathology Imaging Systems Opal ™ Multiplex IHC Kits PHENOPTICS ™ SOLUTIONS Phenoptics Research Services
Transcript of Visualize, Analyze, Quantify and Phenotype Immune … Mantra ™ quantitative ... • Reduces...

Quantitative Pathology Imaging and Analysis
P R O D U C T N O T E
Key Features:
• Visualize, analyze, quantify and phenotype immune cells in situ in solid tissues
• Multiplexed biomarker analysis of tumors and tumor microenvironment in situ
• Intuitive workflow optimized for the research pathologist
• Compact workstation for fluorescence and brightfield
• Pathology Views™ renders immunofluorescence images as H&E, DAB and hematoxylin
• Supports PerkinElmer’s Cancer Immunology Research Workflow Solution (staining, imaging and analysis)
The Mantra™ quantitative pathology workstation, with inForm® image analysis software, enables visualization, quantification and phenotyping of multiple types of immune cells simultaneously in intact FFPE tissue sections for cancer immunology research.
Unlike flow cytometry and next generation sequencing methods, which can phenotype and quantify immune cells in homogenized samples, Mantra generates images of FFPE tissue sections that maintain tissue architecture and morphology using multispectral imaging. This provides spatial information for a better understanding of the role and types of immune cells within both the tumor and the tumor microenvironment, so that cancer immunotherapy treatments may be identified and researched.
The compact Mantra workstation is ideal for getting started with multispectral imaging and for assay development, freeing up higher throughput systems such as the Vectra® Polaris™ for running assays.
The Mantra system is a part of PerkinElmer’s Phenoptics™ research solution for cancer immunology which includes staining reagents, imaging systems, and image analysis software. It comes with the inForm image acquisition and analysis software, which provides powerful tools for tissue and cell segmentation, cell phenotyping and analysis. And it can be used with a variety of stains, including PerkinElmer's Opal™ reagent kits.
Visualize, Analyze, Quantify and Phenotype Immune Cells in situ
Mantra
For research use only. Not for use in diagnostic procedures.
inForm® Image Analysis Software
Vectra® Polaris™, Vectra® 3 and Mantra™ Quantitative Pathology
Imaging Systems
Opal™ Multiplex IHC Kits
PHENOPTICS™ SOLUTIONS
Phenoptics Research Services
2
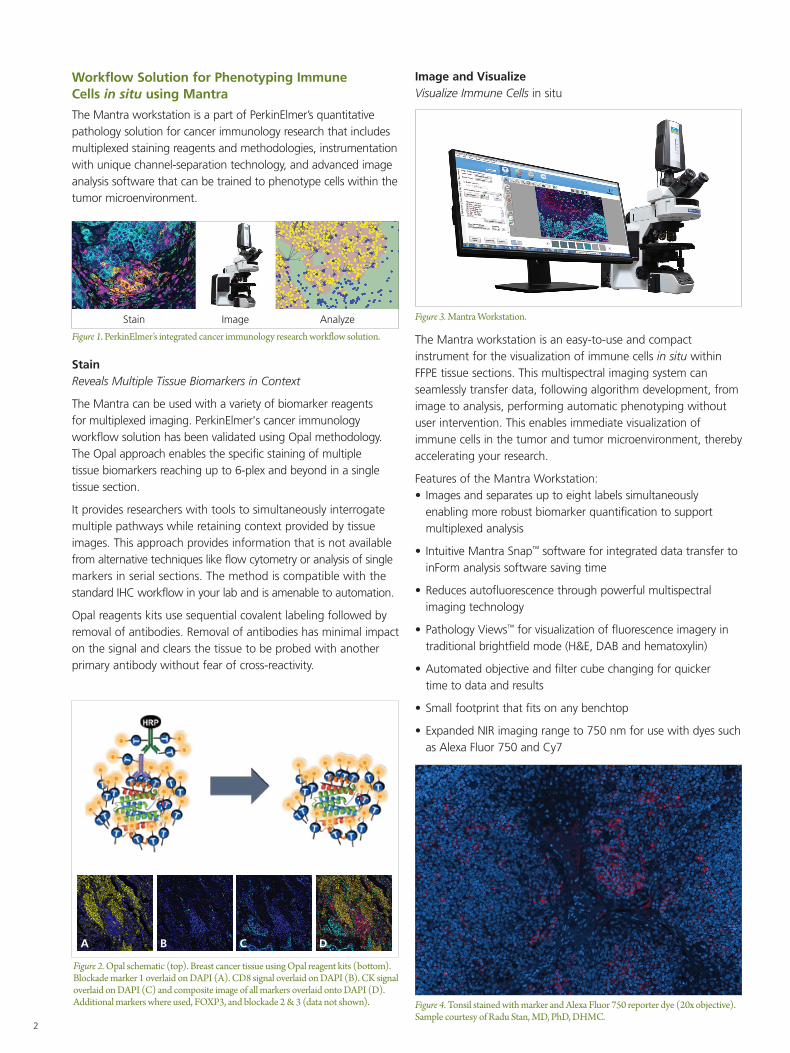
Workflow Solution for Phenotyping Immune Cells in situ using Mantra
The Mantra workstation is a part of PerkinElmer’s quantitative pathology solution for cancer immunology research that includes multiplexed staining reagents and methodologies, instrumentation with unique channel-separation technology, and advanced image analysis software that can be trained to phenotype cells within the tumor microenvironment.
Stain Reveals Multiple Tissue Biomarkers in Context
The Mantra can be used with a variety of biomarker reagents for multiplexed imaging. PerkinElmer's cancer immunology workflow solution has been validated using Opal methodology. The Opal approach enables the specific staining of multiple tissue biomarkers reaching up to 6-plex and beyond in a single tissue section.
It provides researchers with tools to simultaneously interrogate multiple pathways while retaining context provided by tissue images. This approach provides information that is not available from alternative techniques like flow cytometry or analysis of single markers in serial sections. The method is compatible with the standard IHC workflow in your lab and is amenable to automation.
Opal reagents kits use sequential covalent labeling followed by removal of antibodies. Removal of antibodies has minimal impact on the signal and clears the tissue to be probed with another primary antibody without fear of cross-reactivity.
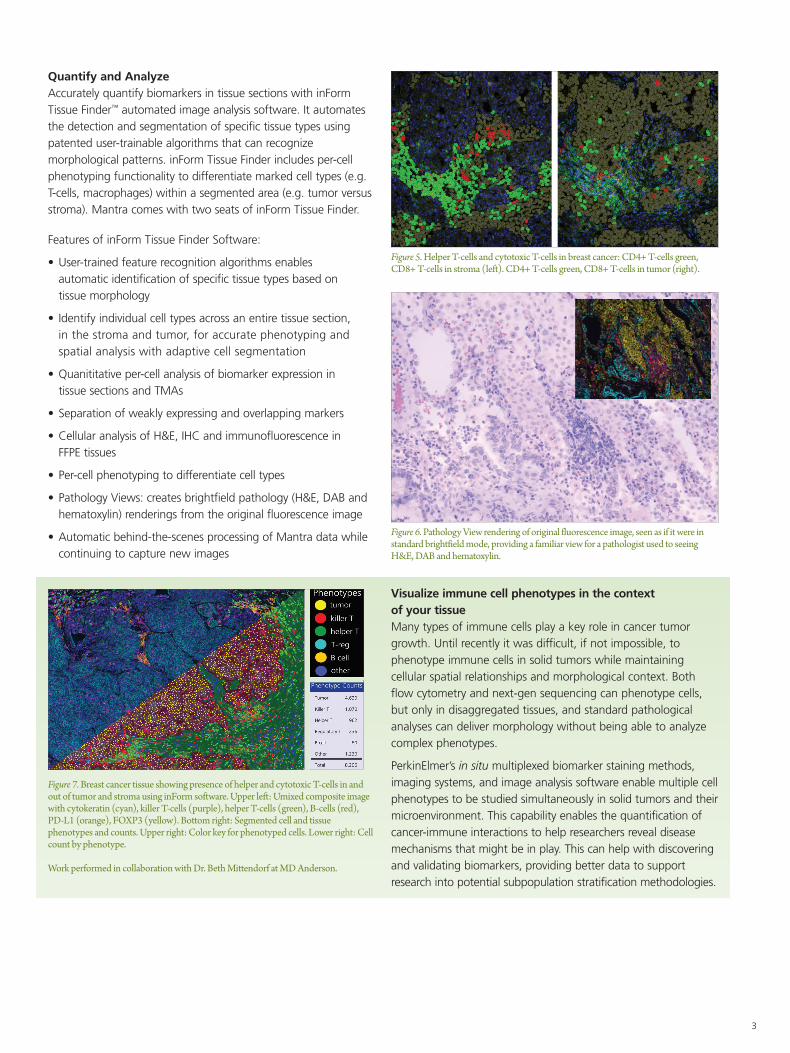
Image and Visualize Visualize Immune Cells in situ
The Mantra workstation is an easy-to-use and compact instrument for the visualization of immune cells in situ within FFPE tissue sections. This multispectral imaging system can seamlessly transfer data, following algorithm development, from image to analysis, performing automatic phenotyping without user intervention. This enables immediate visualization of immune cells in the tumor and tumor microenvironment, thereby accelerating your research.
Features of the Mantra Workstation: • Images and separates up to eight labels simultaneously
enabling more robust biomarker quantification to support multiplexed analysis
• Intuitive Mantra Snap™ software for integrated data transfer to inForm analysis software saving time
• Reduces autofluorescence through powerful multispectral imaging technology
• Pathology Views™ for visualization of fluorescence imagery in traditional brightfield mode (H&E, DAB and hematoxylin)
• Automated objective and filter cube changing for quicker time to data and results
• Small footprint that fits on any benchtop
• Expanded NIR imaging range to 750 nm for use with dyes such as Alexa Fluor 750 and Cy7
Figure 3. Mantra Workstation.
Figure 4. Tonsil stained with marker and Alexa Fluor 750 reporter dye (20x objective). Sample courtesy of Radu Stan, MD, PhD, DHMC.
Figure 1. PerkinElmer’s integrated cancer immunology research workflow solution.
Stain Image Analyze
A CB D
Figure 2. Opal schematic (top). Breast cancer tissue using Opal reagent kits (bottom). Blockade marker 1 overlaid on DAPI (A). CD8 signal overlaid on DAPI (B). CK signal overlaid on DAPI (C) and composite image of all markers overlaid onto DAPI (D). Additional markers where used, FOXP3, and blockade 2 & 3 (data not shown).
3
Quantify and AnalyzeAccurately quantify biomarkers in tissue sections with inForm Tissue Finder™ automated image analysis software. It automates the detection and segmentation of specific tissue types using patented user-trainable algorithms that can recognize morphological patterns. inForm Tissue Finder includes per-cell phenotyping functionality to differentiate marked cell types (e.g. T-cells, macrophages) within a segmented area (e.g. tumor versus stroma). Mantra comes with two seats of inForm Tissue Finder.
Features of inForm Tissue Finder Software:
• User-trained feature recognition algorithms enables automatic identification of specific tissue types based on tissue morphology
• Identify individual cell types across an entire tissue section, in the stroma and tumor, for accurate phenotyping and spatial analysis with adaptive cell segmentation
• Quanititative per-cell analysis of biomarker expression in tissue sections and TMAs
• Separation of weakly expressing and overlapping markers
• Cellular analysis of H&E, IHC and immunofluorescence in FFPE tissues
• Per-cell phenotyping to differentiate cell types
• Pathology Views: creates brightfield pathology (H&E, DAB and hematoxylin) renderings from the original fluorescence image
• Automatic behind-the-scenes processing of Mantra data while continuing to capture new images
Figure 5. Helper T-cells and cytotoxic T-cells in breast cancer: CD4+ T-cells green, CD8+ T-cells in stroma (left). CD4+ T-cells green, CD8+ T-cells in tumor (right).
Figure 6. Pathology View rendering of original fluorescence image, seen as if it were in standard brightfield mode, providing a familiar view for a pathologist used to seeing H&E, DAB and hematoxylin.
Visualize immune cell phenotypes in the context of your tissueMany types of immune cells play a key role in cancer tumor growth. Until recently it was difficult, if not impossible, to phenotype immune cells in solid tumors while maintaining cellular spatial relationships and morphological context. Both flow cytometry and next-gen sequencing can phenotype cells, but only in disaggregated tissues, and standard pathological analyses can deliver morphology without being able to analyze complex phenotypes.
PerkinElmer’s in situ multiplexed biomarker staining methods, imaging systems, and image analysis software enable multiple cell phenotypes to be studied simultaneously in solid tumors and their microenvironment. This capability enables the quantification of cancer-immune interactions to help researchers reveal disease mechanisms that might be in play. This can help with discovering and validating biomarkers, providing better data to support research into potential subpopulation stratification methodologies.
Figure 7. Breast cancer tissue showing presence of helper and cytotoxic T-cells in and out of tumor and stroma using inForm software. Upper left: Umixed composite image with cytokeratin (cyan), killer T-cells (purple), helper T-cells (green), B-cells (red), PD-L1 (orange), FOXP3 (yellow). Bottom right: Segmented cell and tissue phenotypes and counts. Upper right: Color key for phenotyped cells. Lower right: Cell count by phenotype. Work performed in collaboration with Dr. Beth Mittendorf at MD Anderson.

For more information, please visit www.perkinelmer.com/Mantra
Mantra Instrument
Imaging Modes Brightfield and fluorescence, multispectral and color imaging
Microscope
Customized research-grade microscope with:• 8-position motorized epi-fluorescence filter turret• 7-position motorized objective nosepiece• Active management of intensity per-objective in brightfield• Integrated ergonomic controls on microscope base
Camera Type Multispectral 12-bit camera using cooled scientific-grade CCD
Camera Spectral Range• 440 – 720 nm for brightfield imaging and Opal flurophores• 770 nm for NIR dyes such as Cy7, Alexa Fluor 750 and similar
Objectives (Apochromatic) 4X / 0.16 NA, 10X / 0.40 NA, 20X / 0.75 NA (40X / 0.95 NA optional)
Pixel Resolution 0.25 micron (optional 40X), 0.50 micron (20X), 1.0 micron (10X), 2.5 micron (4X)
Filter Cubes• DAPI, FITC, Cy3, Texas Red, Cy5• Cy7, Quad-band (DAPI / FITC / TRITC / Cy5) optional for eyepiece visualization
Fluorescence Illumination Metal halide 200W lamp with liquid light-guide, 2000 hour bulb life
Brightfield Illumination High-output, color-balanced white LED
Physical Dimensions
Width x Height x Depth163 x 76 x 56 cm (Mantra workstation including: monitor, computer, keyboard/mouse, fluorescence illuminator)
Width x Height x Depth 145 x 76 x 56 cm (as above without computer)
Weight 24 kg (Mantra only)
Computer (Minimum Specifications)
General Quad-core, 16 GB RAM, i5 processors, mini-tower style
Hard Disk Drives (2) 500 GB for operating system and programs, 1 TB for data storage
Operating System Windows 7/64
Interfaces 1 Gigabit Ethernet, USB
Monitor 29” flat-panel, 2560 x 1280 pixel resolution
Software
Acquisition Software Mantra Snap (1 seat)
Image Analysis Software inForm Tissue Finder (2 seats)
Power Requirements
Mantra Instrument - AC Input Power 100 - 230 VAC, 1.0A, 50/60 Hz
Fluorescence Illuminator - Input Power 100 - 240 VAC, 2.0A, 50/60 Hz
Table 1. Manta Specifications
For a complete listing of our global offices, visit www.perkinelmer.com/ContactUs
Copyright ©2014-2018, PerkinElmer, Inc. All rights reserved. PerkinElmer® is a registered trademark of PerkinElmer, Inc. All other trademarks are the property of their respective owners. 011947A_01 PKI
PerkinElmer, Inc. 940 Winter Street Waltham, MA 02451 USA P: (800) 762-4000 or (+1) 203-925-4602www.perkinelmer.com