VISUAL AIMING OF EUROPEAN AND U.S. LOW-BEAM HEADLAMPS
31
VISUAL AIMING OF EUROPEAN AND U.S. LOW-BEAM HEADLAMPS Michael Sivak Michael Flannag an Divya Chandra Andrew W. Gellatly Report No. UMTRI-9 1-34 November 199 1
Transcript of VISUAL AIMING OF EUROPEAN AND U.S. LOW-BEAM HEADLAMPS
VISUAL AIMING OF EUROPEAN AND U.S. LOW-BEAM HEADLAMPS
Michael Sivak Michael Flannag an
Divya Chandra Andrew W. Gellatly
Report No. UMTRI-9 1-34 November 199 1

Technical Report Documentatlon Page
I. R ~ O ~ I ~a
UMTRI-9 1-34 2 ~onnmrnt~cuuion~a a ~lrdp*n('r clolq NO.
4. ~wrdshtb VISUAL AIMING OF EUROPEAN AND U.S. LOW-BEAM HEADLAMPS
7. Author(8)
Sivak, M., Rannagan, M., Chandra, D., and Gellady, A.W. a PH~- orpdzalion ~ u n r ud ~ddmr
The University of Michigan Transportation Research Institute Ann Arbor, Michigan 48 109-21 50 U.S.A. 12SponromgAOmyNvnrudAddmr
Motor Vehicle Manufacturers Association 7430 Second Avenue Detroit, Michigan 48202 U.S .A.
15. Suppl*mrtrry NO-
r port^.^
November 199 1 L Mfming CTguJulon M
363864 a PIIfomJng ~ g m l u l l o n Repoll No.
UMTR1-91-34 w. W O ~ I unit NO. (TRUS)
11. Conrrcl or OM( No.
la T y p . o f ~ m d M o d C o v m d
u. s~ocuorlng ~ g m y cob
I & A b r W
This study evaluated the effect of the sharpness of the cutoff (the transition between the lighter and darker portions of the beam) of low-beam headlamps on visual vertical aiming. Out of ten lamps tested, seven had a U.S. type beam pattern and three had a European type beam pattern. Twenty younger and middle-aged subjects of both sexes, along with an experienced lamp aimer, were asked to adjust the aim of the lamps in such a way that the cutoff of the beam was coincident with a horizontal line on a vertical surface. The subjects were instructed to make the alignment using the illumination gradient to the right of vertical for the U.S. type lamps and to the left of vertical for the European type lamps. Each person aimed each lamp ten times.
There were two main results. First, the location of the perceived cutoff was near the location of the maximum contrast between adjacent vertical parts of the beam pattern. Second, the variability of the aiming performance was systematically related to the magnitude of the maximum contrast.
17. K.y W-
headlamps, low beams, visual aiming, European beams, U.S. beams, cutoff, contrast, gradient, nighttime
U. m S b ( w n m (
Unlimited
la 8#.~yaun.(af)1lrmpmq
Unclassified grcu(yaurf(.(dth*prg~)
Unclassified n . l l a d ~ 8 g ~
30 a ~ i a

ACKNOWLEDGEMENTS
Appreciation is extended to the staff and management of GE Lighting in Nela Park, Ohio for providing the goniometer, and Inland Fisher Guide Division of General Motors in
Anderson, Indiana for deriving the photometry information. Special thanks go to Mr. Walter
Kosmatka and Mr. Ken Wiktorowski (both from GE Lighting), and Dr. David Moore and Mr. Monte Vickery (both from Inland Fisher Guide) for wide ranging technical assistance.
Mr. Witorowski also served as the experienced lamp aimer. The authors would like to thank Dr. Douglas Poynter from the General Motors
Technical Center in Warren, Michigan, for several helpful discussions. Also, Figures 8
through 17 of this report follow the format of analogous figures that are included in a manuscript for a journal article that is based on the study by Poynter et al. (1989).
This study was supported by the Motor Vehicle Manufacturers Association
(MVMA). The MVMA Vehicle Lighting Task Group served as an advisory committee to
this project. The assistance of the members of this Task Group is appreciated.

CONTENTS
ACKNOWLEDGEMENTS ...................................................................... ii INTRODUCTION ................................................................................ 1
........................................................................ PREVIOUS RESEARCH 2 METHOD .......................................................................................... 4
RESULTS AND DISCUSSION ................................................................ 10
IMPLICATIONS .................................................................................. 25
CONCLUSIONS ...................... ., .. ... ........,..... 26
REFERENCES ............. .. .................................................................. 27

INTRODUCTION
The European low-beam pattern includes a relatively sharp cutoff (gradient) between
the lighted and unlighted portions. To the left of vertical, the cutoff is perceived as a horizontal line, while to the right of vertical as an inclining line at 15'. The relatively sharp,
extended, and uniform cutoff of the European low-beam pattern is used for visual aiming--
the correct vertical and horizontal alignment of the beam pattern. The U.S. low-beam
pattern, on the other hand, lacks the relatively sharp, extended, and uniform cutoff of the European pattern. The proper alignment of the U.S. pattern is usually achieved using
mechanical h e r s that use a reference plane defined by three small pads extending from the
outer surface of the lamp lens.
These differences in aiming procedure (which are based on the different types of
cutoffs) form one of the main obstacles to international harmonization of low-beam patterns.
The usual arguments are that (1) the Europeans want to retain the visual-aiming capability,
and (2) the U.S. pattern is believed not to be visually aimable to an acceptable degree of precision.
The goal of the present study was to investigate the trade-off between the sharpness of
the cutoff and the reliability of vertical visual aiming.
PREVIOUS RESEARCH
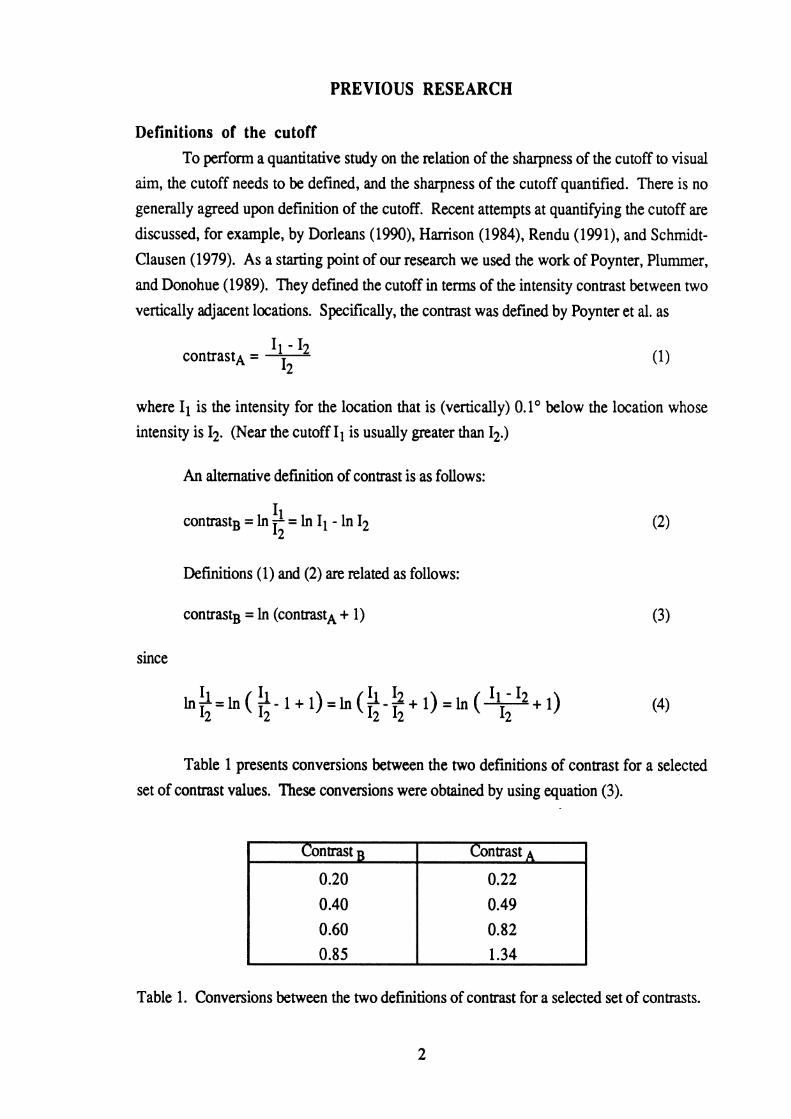
Definitions of the cutoff To perform a quantitative study on the relation of the sharpness of the cutoff to visual
aim, the cutoff needs to be defined, and the sharpness of the cutoff quantified. There is no generally agreed upon definition of the cutoff. Recent attempts at quantifying the cutoff are
discussed, for example, by Dorleans (1990), Harrison (1984), Rendu (1991), and Schrnidt- Clausen (1979). As a starting point of our research we used the work of Poynter, Plummer,
and Donohue (1989). They defined the cutoff in terms of the intensity contrast between two
vertically adjacent locations. Specifically, the contrast was defined by Poynter et al. as
where I1 is the intensity for the location that is (vertically) 0.1' below the location whose
intensity is 12. (Near the cutoff I1 is usually greater than 12.)
An alternative definition of contrast is as follows:
Definitions (1) and (2) are related as follows:
contrastg = In (contrast* + 1) (3)
since
Table 1 presents conversions between the two definitions of contrast for a selected
set of contrast values. These conversions were obtained by using equation (3).
Table 1. Conversions between the two definitions of contrast for a selected set of contrasts.
Conrrast B
0.20 0.40 0.60 0.85
Contrast A
0.22 0.49 0.82 1.34

The range of values shown in Table 1 spans the range that was used in this study
(see Table 3, page 14), and within this range the two definitions of contrast are strongly
related (r = 0.995). Therefore, for use with the present stimuli, there will be no practical difference in the usefulness of these contrast definitions as predictors of visual aiming performance. In the calculations to follow, we used definition (2), because of generally logarithmic relations between physical measures of light and perceived brightness.
Sharpness of the cutoff and visual-aiming performance Poynter et al. (1989) were apparently the fmt to publish a quantitative study relating
the sharpness of the cutoff to vertical aiming of low-beam patterns. They evaluated 14 bands
from actual beams. These illumination bands (each 1 to 2' wide but extending throughout the height of the beam pattern) were selected from five different beam patterns. The beams were adjusted horizontally in such a way that the band of interest was aligned with a vertical
arrow that marked the region that subjects were to attend to during aiming. However, the
nominally irrelevant horizontal portions of the beam (to the left and right of the test band) were not shielded, and thus the whole beam remained visible.
The present research extended the work of Poynter et al. (1989). In the present
study, one half of the visual field was specified as relevant to subjects (to the left of vertical
for the European beams, and to the right of vertical for the U.S. beams), as opposed to a 1 to 2' band in Poynter et al. The obtained relation between contrast and aiming variability was
then used to estimate the minimum contrast needed to assure that a given percentage of visual aims will be within certain tolerance limits.

METHOD
Task The following instructions were read to the subjects:
The purpose of this study is to examine how people visually aim automobile headlamps. This device (point to goniometer) holds the headlamps so that they shine on the screen in front. Your task will be to align headlamps to the horizontal line on the screen by turning this crank (point to crank). Every time you see a lamp, it will be way off from the horizontal line (either too high, or too low), so you will always have to make some correction. When you turn the crank, please do not lean on the table. Also, watch out for the clamp under the wood board. The overhead lights in this room will stay off once the experiment begins.
I will present a total of ten different lamps to you, one at a time. You will be asked to aim each of the lamps ten times. There will be breaks in the experiment in between lamps, while I place a different lamp in the goniometer.
The lamps that you observe will have one of two distinctly different patterns. Some will have a pattern of light that looks like Figure 1, others will look like Figure 2. The shaded area of the figure represents the brightest portion of light. When the lamp is correctly aimed, the top edge of the brightest portion is aligned with the horizontal line. In both of the figures, the pattern is aligned properly to the horizontal line, The beams that you actually see will look like one of these two general types, but there will be some variation. When you see a pattern that looks like Figure 1, you should pay attention to the portion of light that is to the left of the vertical line; when you see a pattern like Figure 2, you should pay attention to the portion of light that is to the right of the vertical line. Each time a new lamp is shown, I will remind you which side to pay attention to.
Because each headlamp pattern is different, you may be unsure about exactly where a particular lamp is supposed to be aimed. In all cases, try to follow the guidelines shown in these figures. However you choose to aim a particular lamp, please try to aim it the same way each of the ten times that you aim that particular lamp. One of the main things we are interested in is how consistently people can aim these lamps. Do you have any questions?
Figure 1 I
Figure 2 I

Equipment A schematic diagram of the experimental setup is shown in Figure 3. The subject
was seated next to one end of a table that had a goniometer securely affixed to it. The
goniometer was equipped with both horizontal and vertical adjustments, but the subject
controlled only the vertical adjustment. At the other end of the table was a grid on which a light that was attached to the goniometer indicated the actual aim of the lamp.
The aiming surface was 7.62 m (25 feet) from the center of the goniometer rotation.
This surface consisted of a white paper mounted on a stud wall that was 2.44 m (8 feet) high
and 3.66 m (1 2 feet) wide. The aiming surface contained a black horizontal and vertical lines
that were 3.2 mm (118 inch) wide. Flat black cloth covered the floor in front of the aiming
surface to prevent reflections from the floor.
Figure 3. A schematic of the experimental setup.

Subjects There were 20 paid subjects in the study--10 younger and 10 middle-aged. The
younger subjects (5 males and 5 females) ranged from 18 to 22 years (mean 19.7). The middle-aged subjects (5 males and 5 females) ranged from 35 to 44 years (mean 38.6).
These subjects were selected from our list of subject volunteers. Each subject was given a brief visual-acuity test using a ~ i tmus@ Vision Tester. (The visual acuities ranged from 20113 to 20130.) None had any affiliation with The University of Michigan Transportation
Research Institute. In addition to the paid subjects, we tested one person who had 30 years of headlamp-aiming experience, His performance was used as the baseline against which we
evaluated the performance of the paid subjects.
Stimuli The goniometer used in this study accepted only the large (200 mm) rectangular
lamps (2B1). In an attempt to have a wide range of the sharpness of the cutoff, we examined 40 low-beam lamps made by 10 different manufacturers. We selected 10 lamps
for testing--7 lamps with a U.S. pattern (referred to as A1 through A7), and 3 lamps with a European pattern (El through E3). Two of the U.S.-type lamps (A 1 and A5) had an H4
light source. Consequently, their gradlents to the right of vertical and below horizontal were sharper than the gradients for the other US.-type lamps and in certain parts of the beam
were comparable to the gradients of the European-type lamps. All lamps were photometered using the same equipment. The photometry yielded,
for each lamp, candela values for points between -10' and +5' horizontally (in 0.2' steps),
and between -1.5' and t1.5' vertically (in 0.1' steps). The corresponding iso-candela
diagrams are shown in Figures 4 through 6.
Design Each subject vertically aimed each of the 10 lamps a total of 10 times. Ten different
orders of lamp presentation were used, obtained from a 10 x 10 Latin-square table. This
design resulted in each of the lamps being in each of the 10 ordinal positions for one younger
subject and one middle-aged subject. There was a total of 100 trials per subject (10 repetitions x 10 lamps).
Procedure The testing was performed in a windowless room, with the tested lamp providing the
only source of illumination. When the lamp was turned on for the subject, it was, alternately, either 4' above or 4' below its nominally correct vertical aim. The actual testing took 45 to 60 minutes to complete.

-10 -8 -6 -4 -2 0 2 4 5 Horizontal Location (degrees)
Figure 4. Iso-candela diagrams of lamps A 1 through A4.
7

- .- -10 -8 -6 -4 -2 0 2
Horizontal Location (degrees)
Figure 5. Isecandela diagrams of lamps A5 through A7.

Horizontal Location (degrees)
Figure 6. Iso-candela diagrams of lamps E 1 through E3.
RESULTS AND DISCUSSION
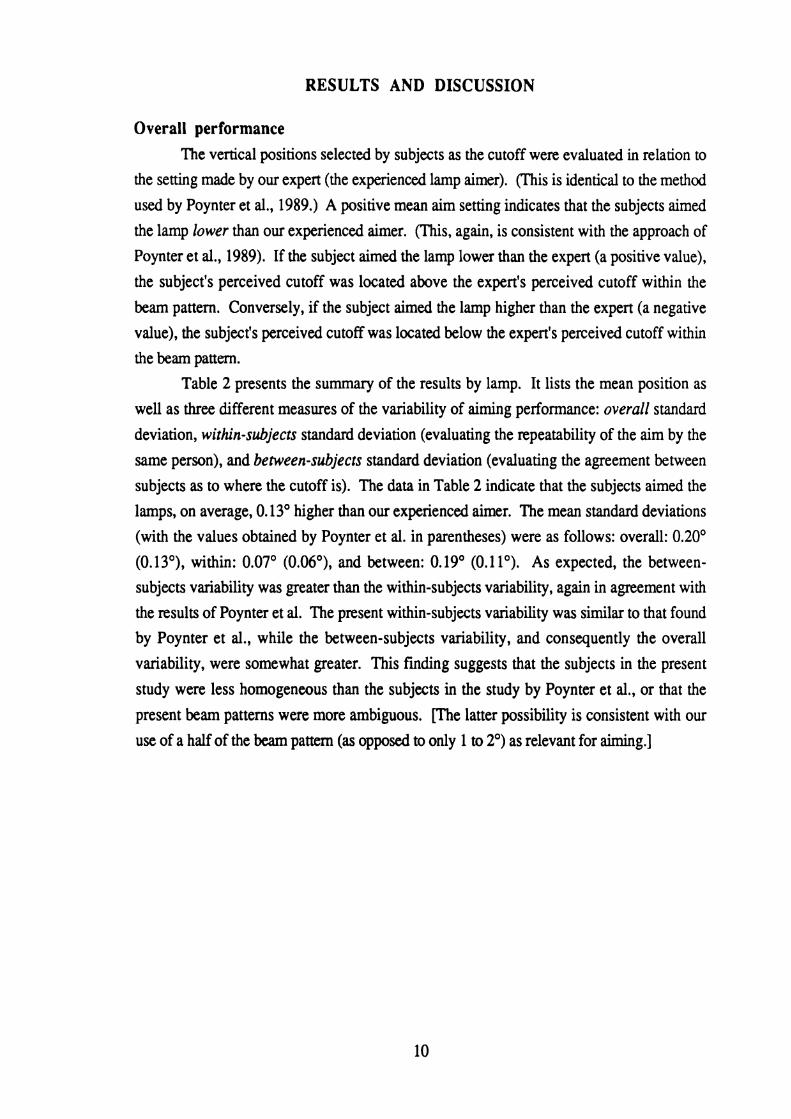
Overall performance The vertical positions selected by subjects as the cutoff were evaluated in relation to
the setting made by our expert (the experienced lamp aimer). (This is identical to the method
used by Poynter et al., 1989.) A positive mean aim setting indicates that the subjects aimed
the lamp lower than our experienced aimer. (This, again, is consistent with the approach of
Poynter et al., 1989). If the subject aimed the lamp lower than the expert (a positive value),
the subject's perceived cutoff was located above the expert's perceived cutoff within the
beam pattern. Conversely, if the subject aimed the lamp higher than the expert (a negative
value), the subject's perceived cutoff was located below the expert's perceived cutoff within
the beam pattern. Table 2 presents the summary of the results by lamp. It lists the mean position as
well as three different measures of the variability of aiming performance: overall standard
deviation, within-subjects standard deviation (evaluating the repeatability of the aim by the
same person), and between-subjects standard deviation (evaluating the agreement between
subjects as to where the cutoff is). The data in Table 2 indicate that the subjects aimed the lamps, on average, 0.13' higher than our experienced aimer. The mean standard deviations
(with the values obtained by Poynter et al. in parentheses) were as follows: overall: 0.20'
(0.13'), within: 0.07' (0.06'), and between: 0.19' (0.11'). As expected, the between- subjects variability was greater than the within-subjects variability, again in agreement with
the results of Poynter et al. The present within-subjects variability was similar to that found by Poynter et al., while the between-subjects variability, and consequently the overall
variability, were somewhat greater. This finding suggests that the subjects in the present
study were less homogeneous than the subjects in the study by Poynter et al., or that the
present beam patterns were more ambiguous. [The latter possibility is consistent with our
use of a half of the beam pattern (as opposed to only 1 to 2') as relevant for aiming.]
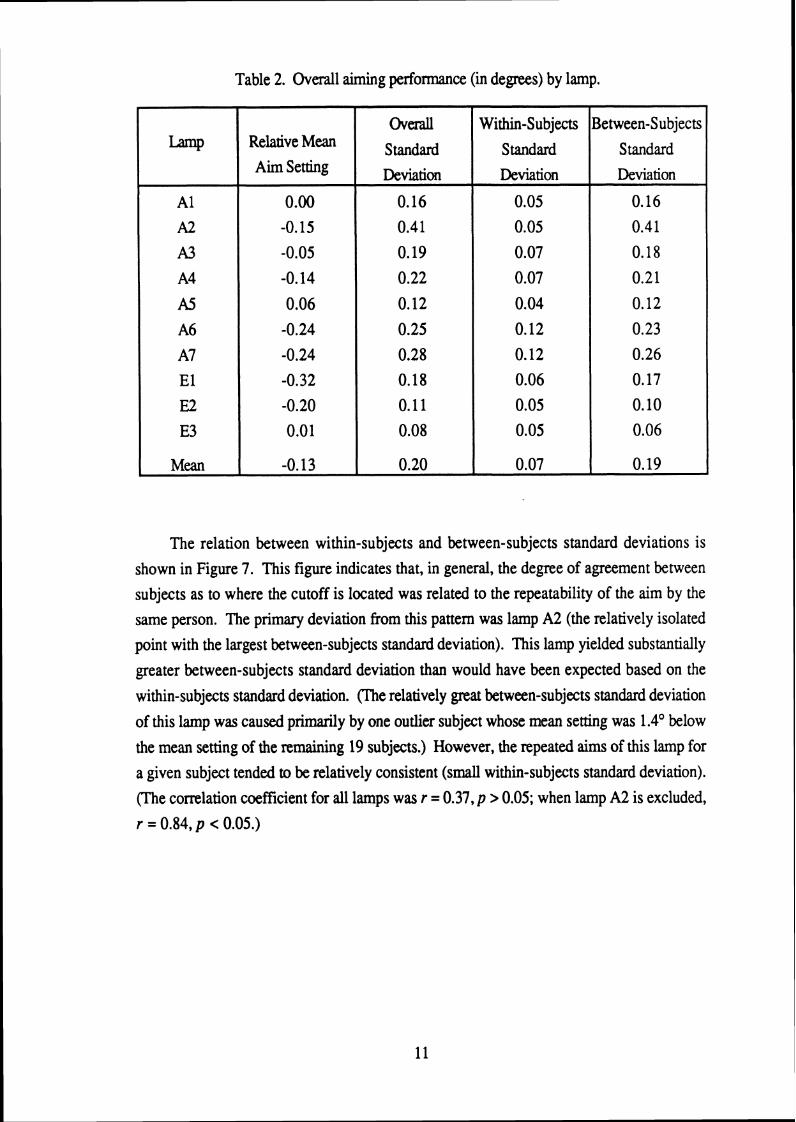
Table 2. Overall aiming performance (in degrees) by lamp.
The relation between within-subjects and between-subjects standard deviations is shown in Figure 7. This figure indicates that, in general, the degree of agreement between subjects as to where the cutoff is located was related to the repeatability of the aim by the same person. The primary deviation from this pattern was lamp A2 (the relatively isolated
point with the largest between-subjects standard deviation). This lamp yielded substantially
greater between-subjects standard deviation than would have been expected based on the
within- subjec ts standard deviation. (The relatively great between-subjec ts standard deviation
of this lamp was caused primarily by one outlier subject whose mean setting was 1.4' below
the mean setting of the remaining 19 subjects.) However, the repeated aims of this lamp for
a given subject tended to be relatively consistent (small within-subjects standard deviation).
(The correlation coefficient for all lamps was r = 0.37, p > 0.05; when lamp A2 is excluded, r = 0.84, p < 0.05.)
Between-Subjects
Standard Deviation
0.16 0.4 1
0.18
0.21
0.12
0.23 0.26 0.17
0.10 0.06
0.19
Within-Subjects
Standard Deviation
0.05
0.05
0.07 0.07
0.04
0.12 0.12 0.06
0.05 0.05
0.07
Overall
Standard Deviation
0.16 0.4 1
0.19 0.22
0.12
0.25 0.28 0.18 0.11 0.08
0.20
Lamp
A1 A2
A3 A4
A5 A6
A7 El E2 E3
Mean I
Relative Mean Aim Setting
0.00 -0.15
-0.05
-0.14
0.06
-0.24 -0.24 -0.32
-0.20 0.01
-0.13

0.02 0.04 0.06 0.08 0.10 0.12 0.14 Within-Subjects Standard Deviation
(degrees)
Figure 7. Relation between within-subjects standard deviations and between-subjects standard deviations.
Effects of age, sex, and visual acuity on aiming performance Age. The relative mean setting averaged over all lamps (relative to the mean setting
by the experienced lamp aimer) for younger subjects was similar to that of middle-aged
subjects (-0.10" versus -0.16"). Both groups aimed the lamps slightly higher than the
experienced lamp aimer. The mean of within-subjects standard deviations of younger
subjects (0.07") was similar to that of middle-aged subjects (0.06"). Sex. The relative mean setting for males was similar to that of females (-0.14"
versus -0.12'). Both groups aimed the lamps slightly higher than the experienced lamp
aimer. The mean of within-subjects standard deviations of males (0.06') was similar to that of females (0.07').
Visual acuity. The relation between visual acuity and aiming performance was evaluated by computing a correlation coefficient (across subjects) between visual acuity and
the mean within-subjects standard deviation (averaged over all ten lamps). This analysis revealed no systematic relation (r = 0.14, p > 0.05).

Contrast values for the tested lamps Contrast (In I1 - In 12, measured over 0.1' vertical increments) was computed for
each location to the right of vertical for the U.S. beams and to the left of vertical for the
European beams (consistent with the half-field that was specified to subjects as relevant for
aiming). For the U.S. lamps, the relevant contrast for each lamp was defined as the maximum contrast within a rectangular area of the beam pattern as follows:
(1) The width of the rectangle extended throughout the relevant (i.e., the right) half-
field,
(2) The vertical center of the rectangle was coincident with the subjects' mean
setting of the cutoff.
(3) The rectangle had a half-height of 0.2'.
The allowance of M.2' around the mean setting was introduced because the data from Poynter et al. (1989) showed that the mean vertical setting was up to about 0.16' away from the maximum contrast. This suggests that while subjects might be using the maximum
contrast information, they are not necessarily overlaying the horizontal line on the aiming
screen with the part of the beam pattern that contains the maximum contrast. For six of the seven U.S. lamps, this procedure for selecting the relevant contrast
resulted in the inclusion of the maximum contrast available anywhere in the relevant half field of the beam pattern. For the seventh lamp the maximum was 0.3' from the mean setting, slightly beyond the 0.2' limit.
We relied on the existence of aiming pads on all U.S.-type headlamps to assure that
for the U.S. lamps the nominal alignment during the photometry would correspond to the
nominal alignment during subject testing. However, the European-type lamps do not contain aiming pads. Consequently, we had no easy way to assure that the nominal alignment for the European lamps during photometry matched the nominal alignment during subject
testing. Because of this consideration, we defined the relevant contrast for the European lamps as the maximum contrast available anywhere to the left of vertical.
The relevant contrast values for each of the lamps are shown in Table 3. Figures 8
through 17 show, for each lamp, the values of contrast along the particular vertical scan that (for that lamp) contains the relevant contrast.
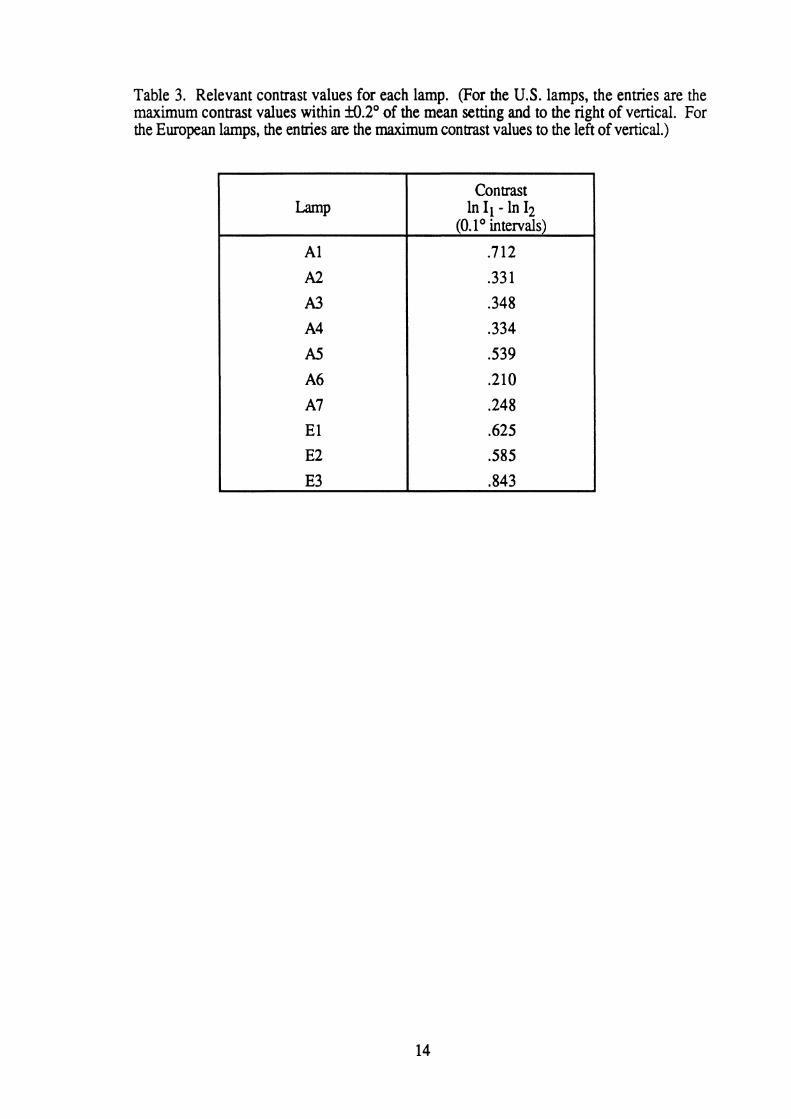
Table 3. Relevant contrast values for each lamp. (For the U.S. lamps, the entries are the maximum contrast values within M.2' of the mean setting and to the right of vertical. For the European lamps, the entries are the maximum contrast values to the left of vertical.)
Lamp
A1
A2
A3 A4
A5
A6
A7 E 1 E2
E3
Contrast In I1 - ln I2
(0.1 O intervals)
,712
.33 1
.348
.334
,539
,210
.248 ,625 ,585
,843 A

Vertical Location (degrees)
Figure 8. Contrast values for lamp A1 at the horizontal location of +5.0°.
-1.5 -1.0 -0.5 0.0 0.5 1 .O 1.5 Vertical Location (degrees)
Figure 9. Contrast values for lamp A2 at the horizontal location of +2.4'.

1 .o
0.8 -
0.6 - Y w
0.4 - Y C
8 0.2 -
-0.2 - . m . ~ m - l w l ~ . r . l . m m m I . r m s I r m m .
-1.5 -1.0 -0.5 0.0 0.5 1 .O 1 Vertical Location (degrees)
Figure 10. Contrast values for lamp A3 at the horizontal location of +2.6'.
-1.5 -1.0 -0.5 0.0 0.5 1 .O 1.5 Vertical Location (degrees)
Figure 11. Contrast values for lamp A4 at the horizontal location of +3.g0.

Figure 12. Contrast values for lamp A5 at the horizontal location of 4.2'.
-1.5 -1.0 -0.5 0.0 0.5 1 .O 1.5 Vertical Location (degrees)
Figure 13. Contrast values for lamp A6 at the horizontal location of +2.0°.
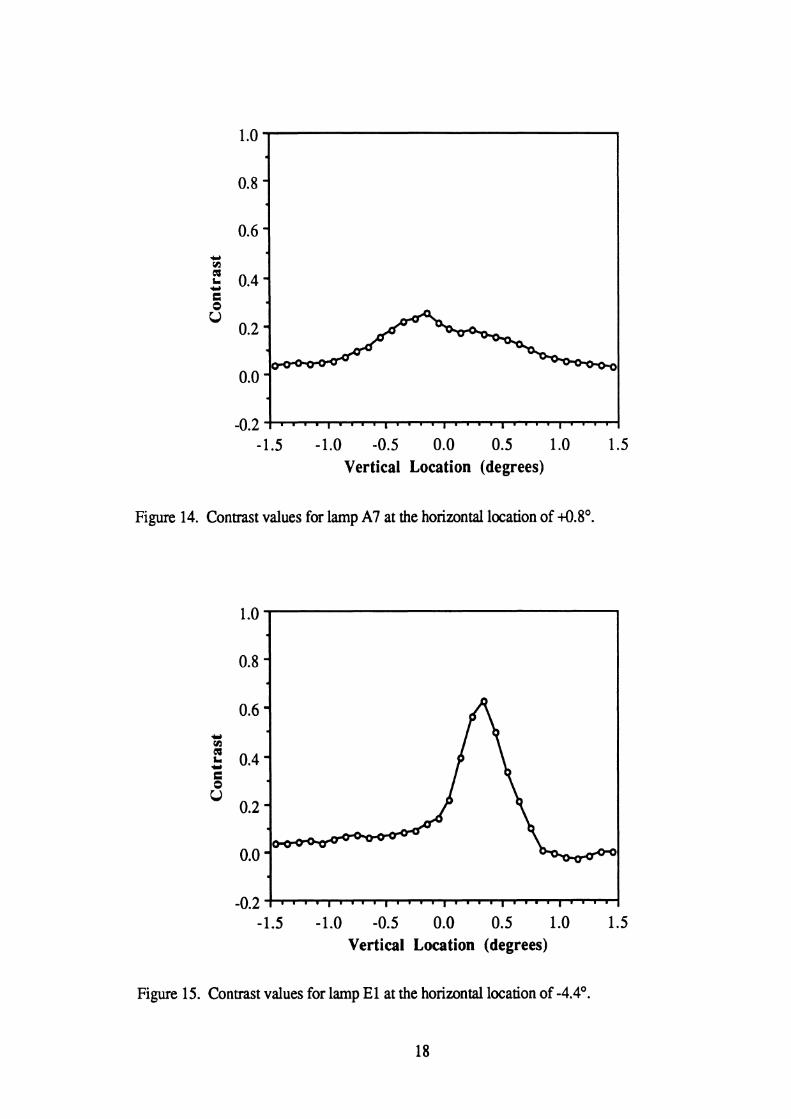
Figure 14. Contrast values for lamp A7 at the horizontal location of +0.8'.
1 .o
0.8 -
0.6 - Y m
2 0.4 - Y C
Vertical Location (degrees)
5
o*2 0.0
-0.2
Figure 15. Contrast values for lamp El at the horizontal location of -4.4'.
:: m m . m l . - . ~ ~ . ~ ~ ~ I . ~ . . ~ . . ~ ~ I ~ m l m
-1.5 -1.0 -0.5 0.0 0.5 1 .O 1.5 Vertical Location (degrees)

Figure 16. Contrast values for lamp E2 at the horizontal location of -2.8'.
Figure 17. Contrast values for lamp E3 at the horizontal location of -3.0'.

Effect of contrast on the variability of aim Figure 18 shows the relation between contrast and overall standard deviation of the
aiming performance.
Figure 18. Relation between contrast and overall standard deviation of aiming.
0.5
0.4 -
0.3 -
0.2 -
0.1 -
0.0
How should we interpret the data in Figure 18? Poynter et al. (1989) interpreted their data as showing that a reduction in contrast from high values has an effect on the
variability of aiming performance only when the contrast reaches a certain critical value. Consequently, Poynter at al. fitted their data with a horizontal line for relatively high levels
of contrast, and a negatively sloping line for relatively low levels of contrast. Such an approach would, in the present case, lead to a relation such as shown in Figure 19.
Alternatively, the data in Figure 18 can be interpreted as evidence for a quadratic or linear relationship between these two variables. The best fitting quadratic relation is shown in
Figure 20 (53.0% of the variance accounted for), while the best fitting linear relation is shown in Figure 21 (52.8% of the variance accounted for). Because the quadratic model has an extra parameter, the fit is mathematically constrained to be at least as good as the fit of the linear model. The improvement in fit provided by the extra parameter of the quadratic model is in fact remarkably small, and does not approach statistical significance (F < 1). [The best fitting inverse relationship (not shown) accounted for only 44.5% of the variance.]
A2
A7
A4 E 1
A6 A 1
A3 A5 * * €3
E2
I I I I
0.0 0.2 0.4 0.6 0.8 1 .O Contrast

Contrast
Figure 19. Relation between contrast and overall standard deviation of the aiming performance. The straight lines assume a critical value of contrast, above which contrast has no effect on performance.
0.0 0.0 0.2 0.4 0.6 0.8 1 .O
Contrast
Figure 20. Relation between contrast and overall standard deviation of the aiming performance. The curved line provides the best quadratic fit.

Contrast
Figure 21. Relation between contrast and overall standard deviation of the aiming performance. The straight line provides the best linear fit.
Since (1) a linear relation is simpler than a quadratic relation or a relation involving
two linear components, (2) the best fitting linear relation accounted for a respectable 52.8%
of the variance, and (3) the best fitting quadratic relation accounted for virtually the same
amount of variance as did the best fitting linear relation (53.0% vs 52.8%), we believe that,
in the range studied, the relation between contrast and variability of performance can be
characterized as a linear relation.
As discussed above, the tested lamps included one lamp (A2) with unusually great between-subjects (and thus also overall) standard deviation because of one outlier subject. If
we exclude lamp A2 from the computation, the best-fitting linear relation accounts for 72.8% of the variance in overall standard deviation (see Figure 22).

0.0 0.0 0.2 0.4 0.6 0.8 1 .O
Contrast
Figure 22. Relation between contrast and overall standard deviation of the aiming performance, with lamp A2 excluded. The straight line provides the best linear fit.
The best-fitting straight line for the range tested (omitting lamp A2) is defined by the
following equation:
y = 0.306 - 0.259~ (5 )
where x = contrast and y = overall standard deviation.
Equation (5) was used to estimate overall standard deviations of aiming performance for a selected set of contrast values covering the tested range of contrast. The results of these
calculations are presented in Table 4.
Table 4. Required contrast to yield selected overall standard deviations of visual aims. (Based on the best-fitting linear relation, with lamp A2 excluded.)
Desired overall standad deviation (O)
0.25 0.20 0.15 0.10
Required contrast lrlI1-ln12
(0.1 O intervals)
0.22 0.4 1
0.60 0.80

Contrast versus other predictors of visual-aim performance In addition to the maximum contrast near the mean vertical setting, we also examined
two other measures of the beam pattern as potential predictors of the variability of visual aim. The fust alternative was a measure of the relevant mean contrast in the foveal (central) part of the visual field. This was quantified as a mean value of contrast for a horizontal cross-
section of the beam, centered at the location of the relevant contrast (the peak values in Figures 8 through 17), and extending 1 to the left and 1 to the right from this location. (For
two lamps--A1 and AS--the relevant contrast was located less than lo from the edge of our
photometric information. For these two lamps the intervals around the relevant contrast were
not symmetrical, but still involved a total of 2 O . ) The mean foveal contrast proved to be highly correlated with the maximum contrast (r = 0.99). Consequently, it is not surprising
that the mean foveal contrast predicted the aiming variability almost as well as did the maximum contrast.
The second alternative was a measure of the degree to which the maximum contrast was an outlier among the other contrasts in its vertical cross-section of the beam. The
computation involved deriving a z-score for the maximum contrast, where the relevant
population for the derivation of the z-score consisted of contrast values in the vertical cross- section of the beam that contained the relevant contrast (see Figures 8 through 17) This
measure was also significantly related to the maximum contrast (r = 0.85). However, its predictive power was less than the predictive power of the maximum contrast.
The sharpness of the cutoff vs. the shape of the cutoff The study by Poynter et al. (1989) used narrow bands of illumination, while the
present study used complete beam patterns. Consequently, the presence of the intersection
between the horizontal section of the cutoff and the 15' inclining section of the cutoff in the
European beam patterns in the present study might have helped the aimability of these patterns, independent of the influence of the sharpness of the cutoff.
Laboratory vs. real-life aiming performance The present data (as well as the data of Poynter et al., 1989) were obtained under
nearly optimal conditions. For example, the aiming surface was uniformly white and clean, and the tested headlamp provided the only illumination in the laboratory. Real-life aiming performance in a service station would presumably lead to more variable performance. However, the magnitude of this difference cannot be predicted in general because it would depend on how well standards for the quality of aiming environment and for the
conscientiousness of personnel are set and maintained in real world.

IMPLICATIONS
The specific aspects of the present findings (e.g., the linear fit to the data, and the slope and intercept of the linear fit) are limited to the conditions tested. These conditions include the range of contrasts studied, the ambient illumination, the distance and reflectivity of the aiming surface, the width of the horizontal line on the aiming surface, etc. With this
important proviso, the data in Table 4 can be used to estimate the required contrast needed to assure that a given percentage of visual aims will be within certain tolerance limits for the
conditions tested, The underlying logic is as follows. Let us assume a linear relation between contrast and overall standard deviation of visual aims. Furthermore, let us assume
that visual aims are normally distributed. In such a case, approximately 95% of visual aims will be within two standard deviations (above and below) of the mean aim. Consequently,
by setting a tolerance limit within which we would like to have, for example, 95% of all visual aims, we can estimate the overall standard deviation that would satisfy such a requirement. For example, if the desired tolerance limits are f0.3', then a normal
distribution with an overall standard deviation of 0.15' would yield 95% of aims to be within f0.3' of the mean aim. Using Table 4, an overall standard deviation of 0.15' can be achieved by a contrast (In Il - In 12) of 0.6. Table 5 lists the required contrast values that
would lead to 95% of visual aims being within various tolerance limits. This table also
presents the corresponding required ratios of adjacent intensity values.
Table 5. Required contrasts and ratios necessary to yield 95% of visual aim to be within selected tolerance limits. (Based on the best-fitting linear relation between contrast and overall standard deviation, with lamp A2 excluded.)
The sample tolerance limits listed in Table 5 are all more stringent than the current
SAE recommended practice for cars leaving assembly (f0.76', or f 4 inches at 25 feet), although a misaim of even -0.4' can lead to a substantial decrement in performance (Bhise, Matle, and Hoffmeister, 1984). In comparison, a recent field study found that the standard deviation of vertical aims of cars on the road in the U.S. is about 0.9' (Olson, 1985).
Desired tolerance limits
f0.5"
f0.4'
f0.3" f0.2O
Required overall standard deviation
0.25' 0.20"
0.15' 0.10"
Required contrast In I1 - ln I2
(0. lo intervals)
0.22
0.41
0.60 0.80
Required ratio 11 112
(0. 1' intervals)
1.25 1.51
1.82 2.23

CONCLUSIONS
The present data are consistent with the hypotheses that (1) the location of the
perceived cutoff of low-beams is related to the location of the maximum intensity contrast measured in the vertical dimension, and (2) the variability of visual-aim performance is related to the magnitude of the maximum contrast.
Within the range tested, the magnitude of the maximum contrast appears to be
linearly related to the variability of visual aims. Consequently, the best-fitting linear equation
for the present data can be used to estimate the minimum contrast that needs to be built into a beam pattern to assure that (under the conditions of the present study) it will be visually
aimed within some predefined tolerance limits a given percentage of times.
Despite the reasonably good linear fit to the present data, the existence of other (non- linear) relations between contrast and aiming performance cannot be excluded based on the present limited data (10 lamps and 20 subjects). Furthermore, as Poynter et al. (1989) have pointed out, it is reasonable to assume that a nonzero minimum aiming variability will be
reached at a certain level of contrast, Because of limitations in visual acuity, an increase
beyond this level of contrast would not lead to a further reduction in aiming variability.
However, a comparison of the lowest overall standard deviation of the aiming performance in the present study (0.08') with the limit of human visual acuity (approximately 1' or
0.017') suggests that the asymptotic level of contrast may be beyond the range used in this study. Similarly, the linear relation might not apply for unrealistically low values of contrast (i.e., contrast of less than 0.2). Finally, the present data were obtained under nearly optimal
conditions. Because of all of these considerations, additional studies under actual aim
conditions in the field are needed to validate that a linear relation does indeed apply in the
contrast range of interest. Until such validation studies are performed, the proposed interpretation of the relation between contrast and aiming performance should be considered
tentative.

REFERENCES
Bhise, D.V., Matle, C.C., and Hoffmeister, D.H. (1984). CHESS model application in
headlamp system evaluation (SAE Technical Paper Series No. 84046). Warrendale, PA: Society of Automotive Engineers.
Dorleans, G. (1990). Low beam cutoff. Paper presented at the Meeting of the SAE
Lighting Committee, Scottsdale, AZ. Harrison, A.L. (1984). Dejining the illuminance cut-offor the E.C.E. low beam headlamp
as a means of analysing the trfects of bulb replacement on headlamp output (Report No. ST-336). Ottawa, Canada: National Aeronautical Establishment, Structures and
Materials Laboratory.
Olson, P.L. (1985). Measurement of crash avoidance characteristics of vehicles in use
(Report No. UMTRI-85-20). Ann Arbor: The University of Michigan
Transportation Research Institute. Poynter, W.D., Plummer, R.D., and Donohue, R.J. (1989). Vertical alignment of
headlamps by visual aim (Report No. GMR-6693). Warren, MI: General Motors Technical Laboratories.
Rendu, R. (1991). Definition of the cut-off in a dipped beam pattern. In Vehicle lighting
design for optimal visibility and peqorrnance, Special Publication SP-857.
Warrendale, PA: Society of Automotive Engineers. Schmidt-Clausen, H.J. (1979). Methoden zur Bestimung der Luge von Hell-Dunkel-
Grenzen. Presented at the CIE Meeting, Kyoto, Japan.