VISSIM-based Simulation Analysis on Road Network of CBD in … · 2017-01-23 · VISSIM-based...
12
Procedia - Social and Behavioral Sciences 96 (2013) 461 – 472 1877-0428 © 2013 The Authors. Published by Elsevier Ltd. Open access under CC BY-NC-ND license. Selection and peer-review under responsibility of Chinese Overseas Transportation Association (COTA). doi:10.1016/j.sbspro.2013.08.054 ScienceDirect 13th COTA International Conference of Transportation Professionals (CICTP 2013) VISSIM-based Simulation Analysis on Road Network of CBD in Beijing, China Dong LIN, Xiaokuan YANG, Chao GAO* Transportation Research Center, Beijing University of Technology, NO.100 Pingleyuan, Chaoyang District, Beijing, 100124, China Abstract Beijing CBD area project involves the evaluation of roadway network. Due to the importance of this project and its special geographical location, it is necessary to analyze the traffic influence in future years. VISSIM is a traffic microscopic simulation software which has been widely used assessing traffic conditions. It is especially useful to evaluate different traffic management scenarios to choose the best alternative and optimization measures before implementation. This paper builds a road network model in VISSIM. Four different traffic organization plans are compared. Since the driving behaviors in Beijing are significantly different from USA or Europe, behavioral studies are conducted to calibrate parameters before model build-up in order to get more accurate results. This paper uses travel time, travel speed, queue length and delay as evaluation indicators to conduct the comparison. The results show that the one-way street organization plan inside CBD area performs the best. Keywords: VISSIM; Simulation; Traffic Evaluation; CBD in Beijing 1. Introduction Beijing Central Business District (CBD) area is located at the intersection of East Third Ring Road and Jianguo Road, to the northeast of Guomao Bridge, covering about 30 hectares. Its specific geographic location is shown in Fig 1. * Dong LIN. Tel.: +86-15811475526. E-mail address: [email protected] Available online at www.sciencedirect.com © 2013 The Authors. Published by Elsevier Ltd. Open access under CC BY-NC-ND license. Selection and peer-review under responsibility of Chinese Overseas Transportation Association (COTA).
Transcript of VISSIM-based Simulation Analysis on Road Network of CBD in … · 2017-01-23 · VISSIM-based...
Procedia - Social and Behavioral Sciences 96 ( 2013 ) 461 – 472
1877-0428 © 2013 The Authors. Published by Elsevier Ltd. Open access under CC BY-NC-ND license.
Selection and peer-review under responsibility of Chinese Overseas Transportation Association (COTA).doi: 10.1016/j.sbspro.2013.08.054
ScienceDirect
13th COTA International Conference of Transportation Professionals (CICTP 2013)
VISSIM-based Simulation Analysis on Road Network of CBD in Beijing, China
Dong LIN, Xiaokuan YANG, Chao GAO*Transportation Research Center, Beijing University of Technology, NO.100 Pingleyuan, Chaoyang District, Beijing, 100124, China
Abstract
Beijing CBD area project involves the evaluation of roadway network. Due to the importance of this project and its special geographical location, it is necessary to analyze the traffic influence in future years. VISSIM is a traffic microscopic simulation software which has been widely used assessing traffic conditions. It is especially useful to evaluate different traffic management scenarios to choose the best alternative and optimization measures before implementation. This paper builds a road network model in VISSIM. Four different traffic organization plans are compared. Since the driving behaviors in Beijing are significantly different from USA or Europe, behavioral studies are conducted to calibrate parameters before model build-up in order to get more accurate results. This paper uses travel time, travel speed, queue length and delay as evaluation indicators to conduct the comparison. The results show that the one-way street organization plan inside CBD area performs the best.
© 2013 The Authors. Published by Elsevier B.V. Selection and/or peer-review under responsibility of Chinese Overseas Transportation Association (COTA).
Keywords: VISSIM; Simulation; Traffic Evaluation; CBD in Beijing
1. Introduction
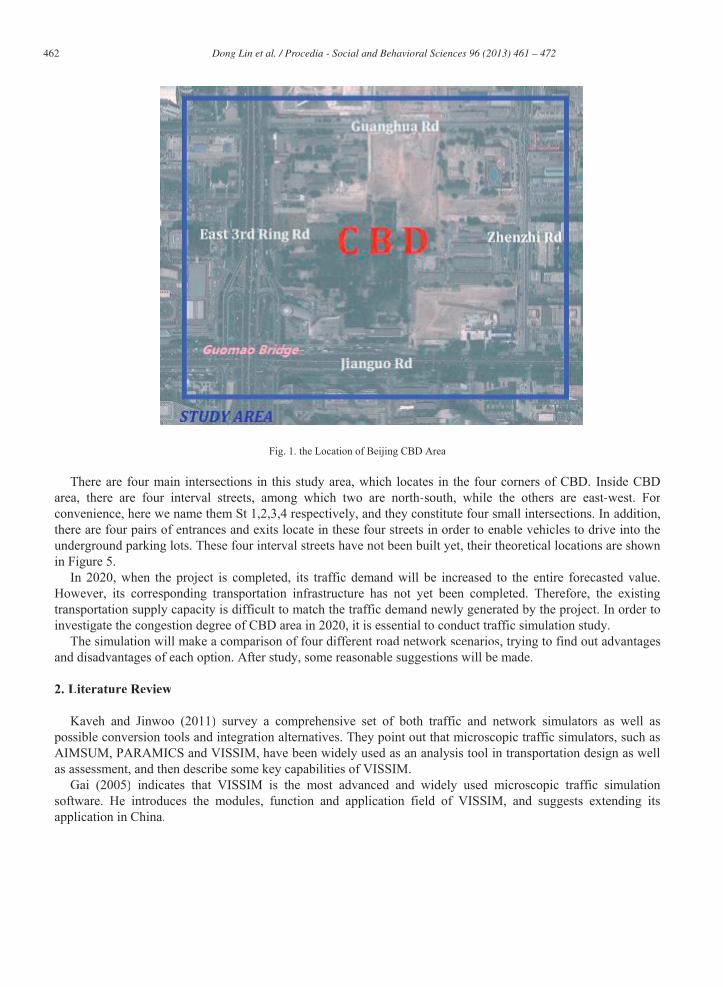
Beijing Central Business District (CBD) area is located at the intersection of East Third Ring Road and Jianguo Road, to the northeast of Guomao Bridge, covering about 30 hectares. Its specific geographic location is shown in Fig 1.
* Dong LIN. Tel.: +86-15811475526. E-mail address: [email protected]
Available online at www.sciencedirect.com
© 2013 The Authors. Published by Elsevier Ltd. Open access under CC BY-NC-ND license.
Selection and peer-review under responsibility of Chinese Overseas Transportation Association (COTA).
462 Dong Lin et al. / Procedia - Social and Behavioral Sciences 96 ( 2013 ) 461 – 472
Fig. 1. the Location of Beijing CBD Area
There are four main intersections in this study area, which locates in the four corners of CBD. Inside CBDarea, there are four interval streets, among which two are north-south, while the others are east-west. For convenience, here we name them St 1,2,3,4 respectively, and they constitute four small intersections. In addition,there are four pairs of entrances and exits locate in these four streets in order to enable vehicles to drive into theunderground parking lots. These four interval streets have not been built yet, their theoretical locations are shownin Figure 5.
In 2020, when the project is completed, its traffic demand will be increased to the entire forecasted value.However, its corresponding transportation infrastructure has not yet been completed. Therefore, the existingtransportation supply capacity is difficult to match the traffic demand newly generated by the project. In order toinvestigate the congestion degree of CBD area in 2020, it is essential to conduct traffic simulation study.
The simulation will make a comparison of four different road network scenarios, trying to find out advantagesand disadvantages of each option. After study, some reasonable suggestions will be made.
2. Literature Review
Kaveh and Jinwoo (2011) survey a comprehensive set of both traffic and network simulators as well aspossible conversion tools and integration alternatives. They point out that microscopic traffic simulators, such asAIMSUM, PARAMICS and VISSIM, have been widely used as an analysis tool in transportation design as wellas assessment, and then describe some key capabilities of VISSIM.
Gai (2005) indicates that VISSIM is the most advanced and widely used microscopic traffic simulationsoftware. He introduces the modules, function and application field of VISSIM, and suggests extending itsapplication in China.
463 Dong Lin et al. / Procedia - Social and Behavioral Sciences 96 ( 2013 ) 461 – 472
VISSIM. 2008. Version 5.1 Manual (2008) shows the characteristics and functions of VISSIM, and indicates its detailed modeling procedures. In this study, our simulation model is in strict accordance with the requirements and announcements of user manual.
Qin and Xiong (2006) use VISSIM to evaluate some schemes in the scientific research of traffic renovation in Kunming, which locates in south China. By the simulation application of one-way schemes, they put forward a new idea to evaluate traffic management schemes under the complex traffic conditions, and prove that VISSIM can offer some decision-making basis for the traffic management departments.
Li and Zheng (2011) indicate that simulation programs should be valid for the traffic situation connected with the relevant traffic, then describe which traffic characteristics should be used for the calibration of parameters for VISSIM, e.g. saturation flow rate distributions, desired speed distributions, speed-acceleration patterns, safety distance and vehicle length. They analyze the characteristics of traffic in Changsha, a city in the middle of China,
with GPS are driving around. Michael P. Hunter and Richard (2006) explore the ability to create an accurate estimation using real-time
roadway data aggregated at various update intervals. In order to determine the impact of how well the local simulation reflects the large network simulation based on the different aggregation intervals under different traffic conditions, they model four un-congested scenarios and four congested scenarios, and then find that the perceived improvements are most pronounced under un-congested conditions while minimal under congested conditions.
Muhammad and Robert (2009) provide a method for including pedestrians in VISSIM model. They define pedestrians as vehicles, and then calibrate various parameters in VISSIM so that pedestrian behavior is calibrated with pedestrian speed-flow models. Using a real traffic network with high pedestrian traffic crossing, their work demonstrates the feasibility of modeling vehicle-pedestrian interactions in a realistic manner.
In summary, based on the literature review, there has been a good deal of research on road network analysis using microscopic software such as VISSIM both in theory and practice. In China, there have been plenty of cases using VISSIM to estimate and evaluate road network conditions, which procedures and results will surely have some reference to our project. In addition, the theoretical study of how to make calibrations and simulation results more accurate will be useful to our further study.
3. Scenario Of Simulation
What the traffic planners most concern with includes traffic management measures that can make road network well performed. Four scenarios are offered in this study by the traffic management department.
As the surrounding road network has been finalized, the main difference of four scenarios is the layout of four internal streets, as well as four pairs of entrances and exits inside CBD area. Scenario 1 and Scenario 2 are two-way layouts, the only difference between them is that reverse settings are used in entrances and exits on the north side of St.3 and St.4 of Scenario 2 compared with Scenario 1. Scenario 3 and 4 are one-way layouts. Scenario 3 uses the same locations and settings of entrances and exits with Scenario 1. St 1 is an east to west setting, while St 2 is west to east. St 3 uses one-way setting from north to south, while St 4 from south to north. Scenario 4 uses the same locations and settings of entrances and exits with Scenario 3. It has the same settings of the two west-east streets, but changes St 3 from southbound to northbound, and St 4 from northbound to southbound.
4. Study Objectives
The main objectives of this study are to use simulation method to analyze the microscopic traffic operational state of CBD area as well as its surrounding road network under most adverse traffic demand. The study attempts to use simulation tool to determine the impact of different traffic organization plans, to confirm the
464 Dong Lin et al. / Procedia - Social and Behavioral Sciences 96 ( 2013 ) 461 – 472
capacity of road network, to find out bottlenecks, and from above all, to provide technical support for the further improvements.
Based on the above objectives the contents of this study include: Road network model buildup Parameters calibration and debugging Simulation evaluation Improvement measures and recommendations
5. DATA COLLECTION AND MODEL CALIBRATION
Driving behavior in China is significantly different from Europe or USA. Therefore, calibration is needed if there are traffic conditions or driving behaviors that are different from the default values offered by VISSIM.
5.1. Speed
The parameter of speed calibration includes two parts: Desired speed and reduced speed. This paper uses laser gun to collect on-site speed data.
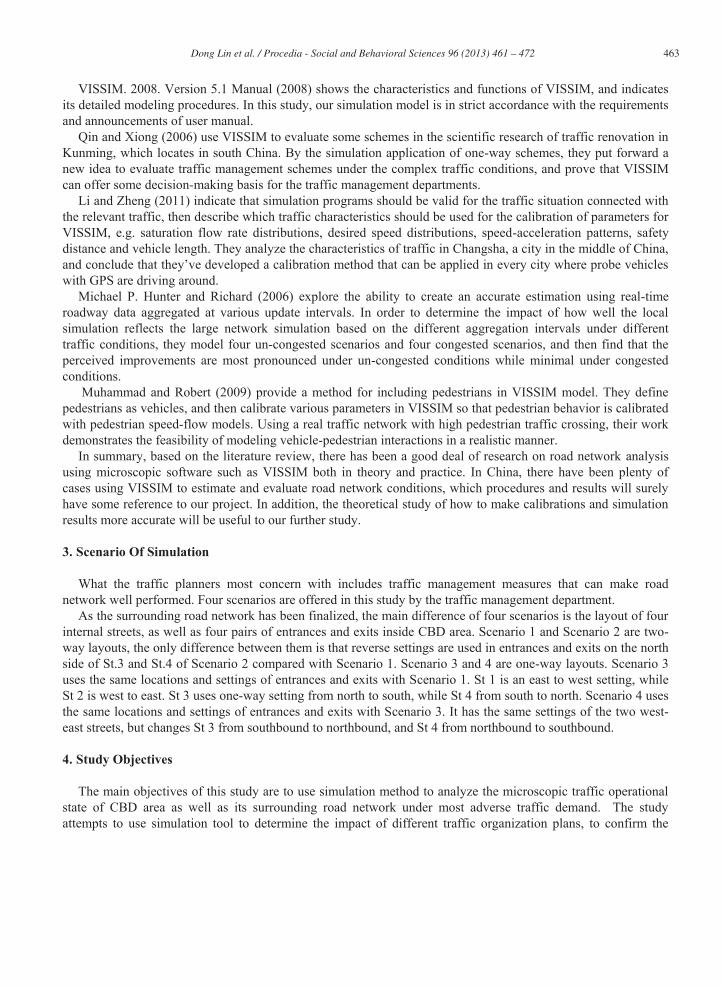
Firstly, surveyors collect 550 samples of running speeds on road network. By analyzing the data set, it is found that speed follows a normal distribution as shown in Fig 2. The average speed is 38.4km/h.
Fig. 2. Speed Frequency Distribution Curve around CBD Area
Moreover, the project needs to set reduced speed areas inside road network. According to the specification requirements, vehicles passing through spiral ramps of underground parking lot should limit their speed under 10km/h. Surveyors collect 60 speed sample values on the spot, obtaining an average speed of 8.3km/h. 85 percentile speed is 10.8km/h as shown in Fig 3 while the statutory speed is 10km/h. Obviously, on-site measured speed values distribution is approximately in accordance with the specifications.

465 Dong Lin et al. / Procedia - Social and Behavioral Sciences 96 ( 2013 ) 461 – 472
Fig. 3. Speed Cumulative Frequency Distribution Curve in Spiral Ramps
5.2. Driving behaviors
On the basis of experimental data in driving simulator from the past traffic characteristics study of Beijing,this project has made further amendment of driving behavior parameters in VISSIM to make it more suitable for Beijing CBD network. Using safety distance as independent variable, relative speed of two cars as dependent variable, we make scatter diagram as indicated in Fig 4 and statistical analysis of safety distance under stablestate as shown in Table 1 Therefore, it is possible to calibrate car following parameters.
Fig. 4. Scatter Diagram of Safety Distance and Relative Speed
Table 1. Statistical Analysis of Safety Distance under Stable State
Index Range Minimum Maximum Mean Std. Deviation Variance
466 Dong Lin et al. / Procedia - Social and Behavioral Sciences 96 ( 2013 ) 461 – 472
Statistic Std. Error
Safety Distance 66.15 2.53 68.68 31.2752 1.49416 17.16653 294.690
Moreover, as different drivers have different driving habits, in this project, we use driving simulationwarehouse as well to determine desired acceleration/ deceleration value from several drivers. 15, 50 and 85percentiles are calculated and defined respectively as minimum, mean and maximum acceleration and deceleration value.
It should be mentioned that some parameters are hard to calibrate in current situation. For these parameters,default values provided by VISSIM are used in this project.
6. Model Buildup
6.1. Road network establishment
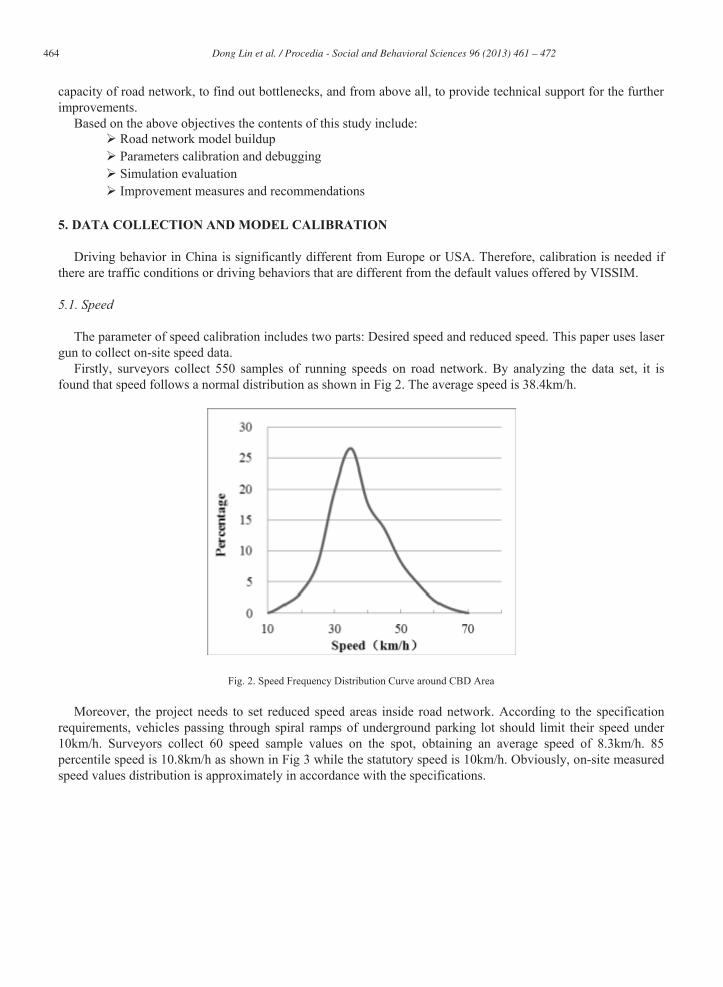
After calibration, it is essential to build road network. Use ready-made CAD file as background image toestablish links and connectors. Every image provides the edges of roadways, edges of buildings, guardrails, medians and street centerlines. Fig 5 shows the profile of Scenario 1 after road network establishment as well asthe locations of St 1 St 4.
Fig. 5. Road Network Establishment (Scenario 1)
6.2. Traffic demand forecast
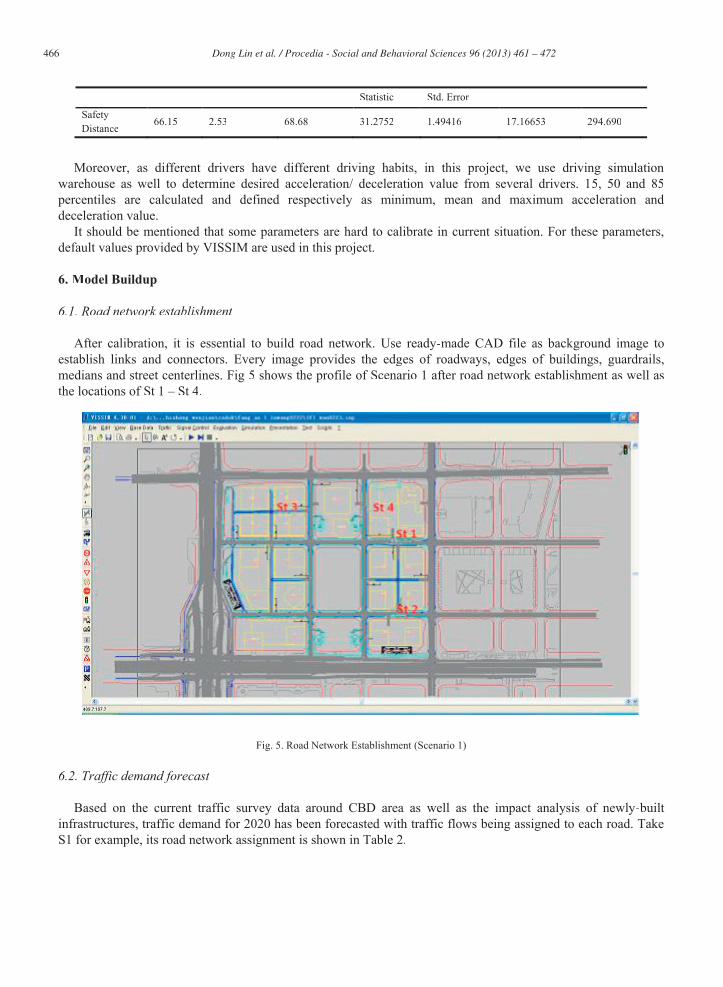
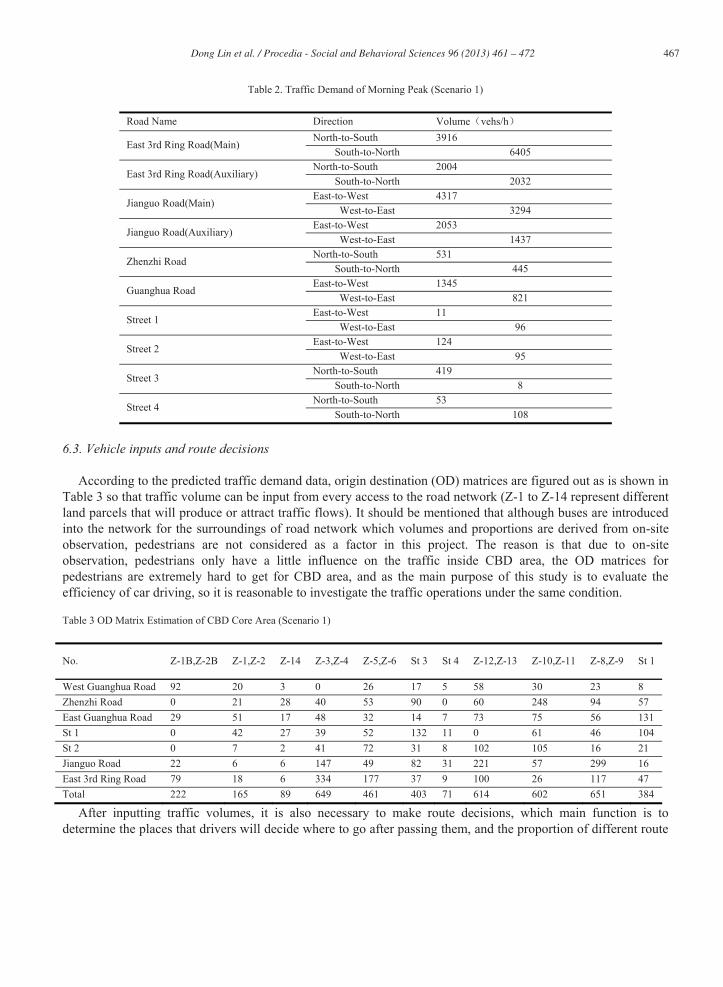
Based on the current traffic survey data around CBD area as well as the impact analysis of newly-built infrastructures, traffic demand for 2020 has been forecasted with traffic flows being assigned to each road. TakeffS1 for example, its road network assignment is shown in Table 2.
467 Dong Lin et al. / Procedia - Social and Behavioral Sciences 96 ( 2013 ) 461 – 472
Table 2. Traffic Demand of Morning Peak (Scenario 1)
Road Name Direction Volume vehs/h
East 3rd Ring Road(Main) North-to-South 3916
South-to-North 6405
East 3rd Ring Road(Auxiliary) North-to-South 2004
South-to-North 2032
Jianguo Road(Main) East-to-West 4317
West-to-East 3294
Jianguo Road(Auxiliary) East-to-West 2053
West-to-East 1437
Zhenzhi Road North-to-South 531
South-to-North 445
Guanghua Road East-to-West 1345
West-to-East 821
Street 1 East-to-West 11
West-to-East 96
Street 2 East-to-West 124
West-to-East 95
Street 3 North-to-South 419
South-to-North 8
Street 4 North-to-South 53
South-to-North 108
6.3. Vehicle inputs and route decisions
According to the predicted traffic demand data, origin destination (OD) matrices are figured out as is shown in Table 3 so that traffic volume can be input from every access to the road network (Z-1 to Z-14 represent different land parcels that will produce or attract traffic flows). It should be mentioned that although buses are introduced into the network for the surroundings of road network which volumes and proportions are derived from on-site observation, pedestrians are not considered as a factor in this project. The reason is that due to on-site observation, pedestrians only have a little influence on the traffic inside CBD area, the OD matrices for pedestrians are extremely hard to get for CBD area, and as the main purpose of this study is to evaluate the efficiency of car driving, so it is reasonable to investigate the traffic operations under the same condition.
Table 3 OD Matrix Estimation of CBD Core Area (Scenario 1)
No. Z-1B,Z-2B Z-1,Z-2 Z-14 Z-3,Z-4 Z-5,Z-6 St 3 St 4 Z-12,Z-13 Z-10,Z-11 Z-8,Z-9 St 1
West Guanghua Road 92 20 3 0 26 17 5 58 30 23 8 Zhenzhi Road 0 21 28 40 53 90 0 60 248 94 57 East Guanghua Road 29 51 17 48 32 14 7 73 75 56 131 St 1 0 42 27 39 52 132 11 0 61 46 104 St 2 0 7 2 41 72 31 8 102 105 16 21 Jianguo Road 22 6 6 147 49 82 31 221 57 299 16 East 3rd Ring Road 79 18 6 334 177 37 9 100 26 117 47 Total 222 165 89 649 461 403 71 614 602 651 384
After inputting traffic volumes, it is also necessary to make route decisions, which main function is to determine the places that drivers will decide where to go after passing them, and the proportion of different route
468 Dong Lin et al. / Procedia - Social and Behavioral Sciences 96 ( 2013 ) 461 – 472
destinations. According to OD data, 25 decision points as well as more than 120 route decision paths are set for the road network of CBD core area.
6.4. Signal set and vehicle inputs
For the intersections of arterial roads on the periphery of CBD area, original signal timing plans are set up from on-site observation. For the four intersections inside core area, as the traffic flow is small (<600 vehicles per hour), we use the same signal timing plan which has two phases. The first phase is for the vehicles from east and west directions to go through, to turn left and to turn right, while the second phase is for north and south vehicles to pass through as shown in Table 4.
Table 4. Signal Timing Plan inside CBD Core Area
Phase Traffic Flow Direction Green Time(s) Red Time(s) Yellow Time(s) Cycle(s)
1 East-West 28 30 2 60
2 South-North 28 30 2
In the intersection place, it is also needed to set priority rules or conflict areas to determine which side has the
priority. In this study, conflict areas are set up in every intersection.
7. Simulation Results Analysis
7.1. Queue length
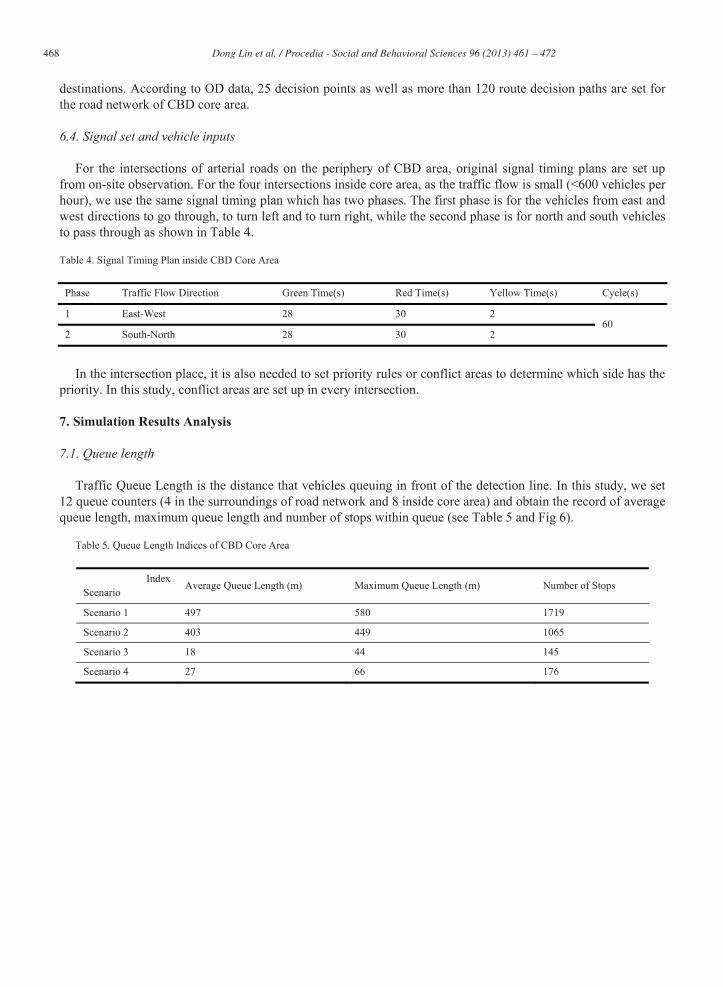
Traffic Queue Length is the distance that vehicles queuing in front of the detection line. In this study, we set 12 queue counters (4 in the surroundings of road network and 8 inside core area) and obtain the record of average queue length, maximum queue length and number of stops within queue (see Table 5 and Fig 6).
Table 5. Queue Length Indices of CBD Core Area
Index Scenario
Average Queue Length (m) Maximum Queue Length (m) Number of Stops
Scenario 1 497 580 1719
Scenario 2 403 449 1065
Scenario 3 18 44 145
Scenario 4 27 66 176
469 Dong Lin et al. / Procedia - Social and Behavioral Sciences 96 ( 2013 ) 461 – 472
Fig. 6. Queue Lengths Statistical Chart
From the table and figure above, traffics in Scenario 3 and Scenario 4 have a better performance. The queue
length of two-way scenarios, especially Scenario 1, is too long that vehicles are nearly at a standstill.
2) Travel time and delay
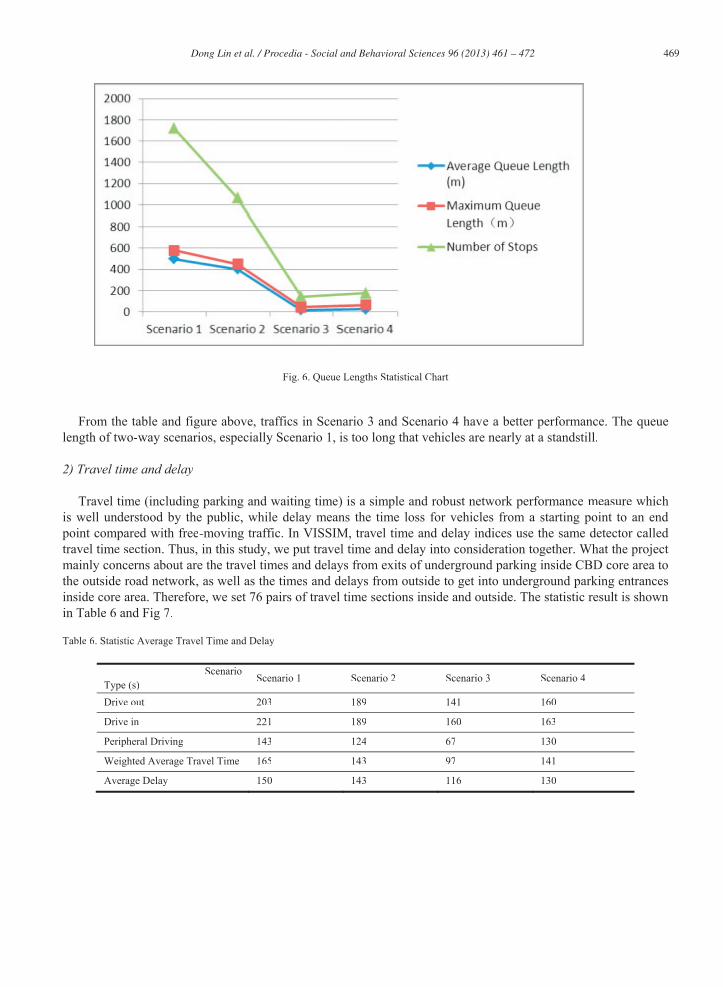
Travel time (including parking and waiting time) is a simple and robust network performance measure whichis well understood by the public, while delay means the time loss for vehicles from a starting point to an end point compared with free-moving traffic. In VISSIM, travel time and delay indices use the same detector called travel time section. Thus, in this study, we put travel time and delay into consideration together. What the project mainly concerns about are the travel times and delays from exits of underground parking inside CBD core area tothe outside road network, as well as the times and delays from outside to get into underground parking entrancesinside core area. Therefore, we set 76 pairs of travel time sections inside and outside. The statistic result is shownin Table 6 and Fig 7.
Table 6. Statistic Average Travel Time and Delay
ScenarioType (s) Scenario 1 Scenario 2 Scenario 3 Scenario 4
Drive out 203 189 141 160
Drive in 221 189 160 163
Peripheral Driving 143 124 67 130
Weighted Average Travel Time 165 143 97 141
Average Delay 150 143 116 130
470 Dong Lin et al. / Procedia - Social and Behavioral Sciences 96 ( 2013 ) 461 – 472
Fig. 7. Travel Time and Delay Statistical Chart
From the table and figure above, it is obvious that one-way organization scenarios, especially Scenario 3 possess an apparent advantage over two-way scenarios.
3) Travel speed
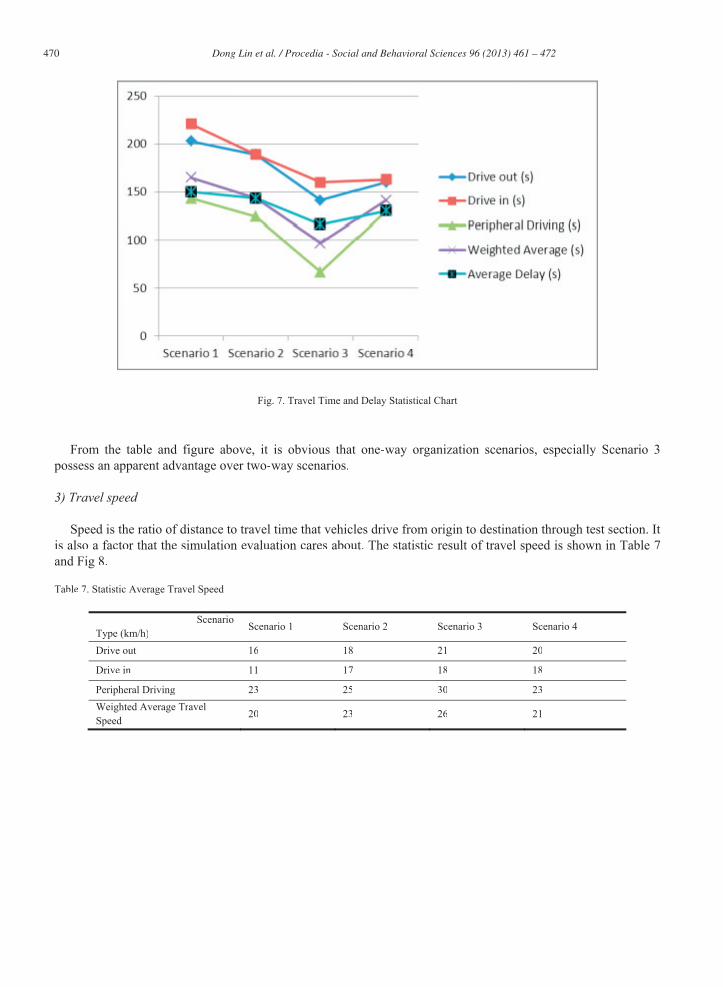
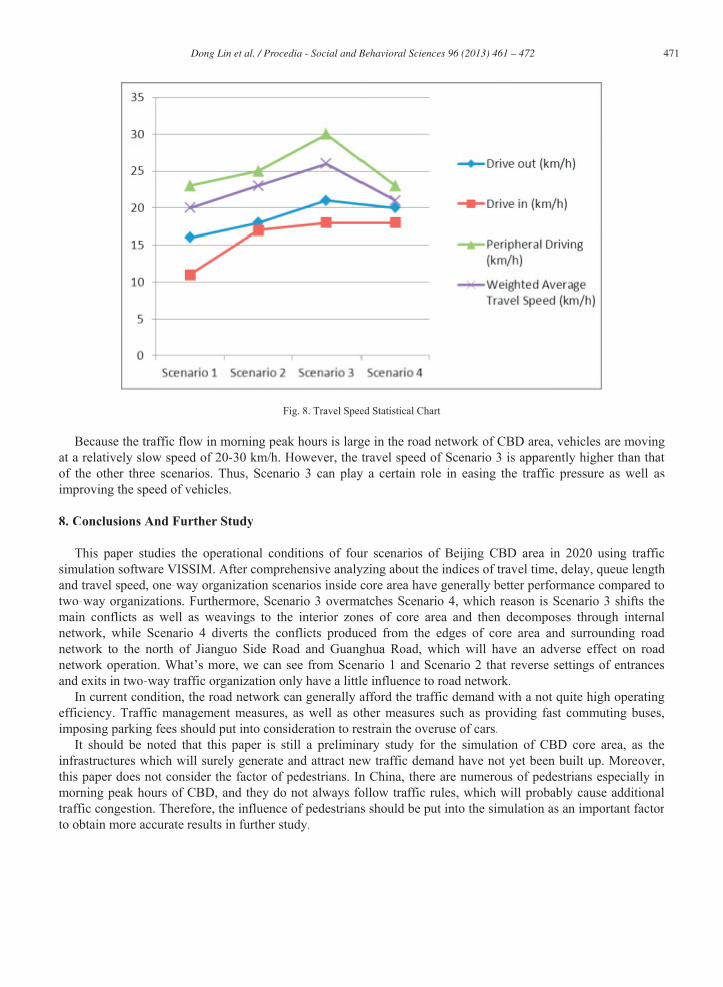
Speed is the ratio of distance to travel time that vehicles drive from origin to destination through test section. It is also a factor that the simulation evaluation cares about. The statistic result of travel speed is shown in Table 7and Fig 8.
Table 7. Statistic Average Travel Speed
ScenarioType (km/h) Scenario 1 Scenario 2 Scenario 3 Scenario 4
Drive out 16 18 21 20
Drive in 11 17 18 18
Peripheral Driving 23 25 30 23Weighted Average TravelSpeed 20 23 26 21
471 Dong Lin et al. / Procedia - Social and Behavioral Sciences 96 ( 2013 ) 461 – 472
Fig. 8. Travel Speed Statistical Chart
Because the traffic flow in morning peak hours is large in the road network of CBD area, vehicles are moving at a relatively slow speed of 20-30 km/h. However, the travel speed of Scenario 3 is apparently higher than that of the other three scenarios. Thus, Scenario 3 can play a certain role in easing the traffic pressure as well as improving the speed of vehicles.
8. Conclusions And Further Study
This paper studies the operational conditions of four scenarios of Beijing CBD area in 2020 using trafficsimulation software VISSIM. After comprehensive analyzing about the indices of travel time, delay, queue lengthand travel speed, one-way organization scenarios inside core area have generally better performance compared totwo-way organizations. Furthermore, Scenario 3 overmatches Scenario 4, which reason is Scenario 3 shifts themain conflicts as well as weavings to the interior zones of core area and then decomposes through internalnetwork, while Scenario 4 diverts the conflicts produced from the edges of core area and surrounding road network to the north of Jianguo Side Road and Guanghua Road, which will have an adverse effect on road
and exits in two-way traffic organization only have a little influence to road network.In current condition, the road network can generally afford the traffic demand with a not quite high operating
efficiency. Traffic management measures, as well as other measures such as providing fast commuting buses,imposing parking fees should put into consideration to restrain the overuse of cars.
It should be noted that this paper is still a preliminary study for the simulation of CBD core area, as theinfrastructures which will surely generate and attract new traffic demand have not yet been built up. Moreover,this paper does not consider the factor of pedestrians. In China, there are numerous of pedestrians especially inmorning peak hours of CBD, and they do not always follow traffic rules, which will probably cause additionaltraffic congestion. Therefore, the influence of pedestrians should be put into the simulation as an important factor to obtain more accurate results in further study.
472 Dong Lin et al. / Procedia - Social and Behavioral Sciences 96 ( 2013 ) 461 – 472
References
gs of the First ACM International Symposium on Design and Analysis of Intelligent Vehicular Networks and Applications. Miami, Florida. 2011.
Aug.2005, pp.118-121. VISSIM. 2008. Version 5.1 User Manual. PTV Planug Transport Verkehr AG, Innovative Transportation Concepts, Inc., July 2008.
Kunming University of Science and Technology. Vol.31, No.6, Dec. 2006, pp.87-90.
ial and Behavioral Sciences, 20 (2011), pp. 263 272.
-time Dynamic Data Driven
Muhammad Moazzam Ishaque and Robert B. NolanJournal of Transportation Engineering, Jun.2009, pp.338-348.