Viscoelasticity, Creep and Fiber-filled Materials...Creep modeling • Creep strain vs. time, fit to...
46
expert material testing | CAE material parameters | CAE Validation | software & infrastructure for materials | materials knowledge | electronic lab notebooks Viscoelasticity, Creep and Fiber-filled Materials Hubert Lobo
Transcript of Viscoelasticity, Creep and Fiber-filled Materials...Creep modeling • Creep strain vs. time, fit to...

expert material testing | CAE material parameters | CAE Validation | software & infrastructure for materials | materials know ledge | electronic lab notebooks
Viscoelasticity, Creep and Fiber-filled
Materials
Hubert Lobo
strengthening the materials core of manufacturing enterprises
Definitions of creep and viscoelasticity
• Creep is the change that occurs to a material due constant load over time
• Depends on applied load
• Depends on temperature/environment
• Stress relaxation is the change that occurs to a material due to constant deformation over time
• Depends on applied strain
• Depends on temperature/environment
• Viscoelasticity is the property consisting of both elastic behavior and flow (plastic) behavior, in which time varies the behavior of each component
• Depends on time/frequency
• Depends on load/strain
• Depends on temperature/environment

strengthening the materials core of manufacturing enterprises
Effect of temperature
• Properties and dependencies change with temperature
• Modulus
• Ductile-brittle
transitions
• Rate dependency

strengthening the materials core of manufacturing enterprises
Effect of environment: in-vivo
• Saline solution at body temperature

strengthening the materials core of manufacturing enterprises
Creep behavior
• Primary
• Short time
• Loading phase transient
• Secondary
• Sustained uniform strain
• Handled by creep models
• Tertiary
• Localization and failure
• Creep rupture

strengthening the materials core of manufacturing enterprises
Creep modeling
• Creep strain vs. time, fit to time hardening model
• Minimum 3 stress levels
• Typically 1000 hours
• Can incorporate temperate but best handled as individual models
for each temperature (more stable/accurate)
• Plastic deformation
• ASTM D2990 / ISO 899
0.0
0.5
1.0
1.5
2.0
2.5
3.0
3.5
4.0
4.5
5.0
1E-02 1E-01 1E+00 1E+01 1E+02 1E+03
Time (Hours)
Str
ain
(%
)
14.3 MPa, 60°C, Replicate 114.3 MPa, 60°C, Replicate 219.1 MPa, 60°C, Replicate 119.1 MPa, 60°C, Replicate 224.1 MPa, 60°C, Replicate 124.1 MPa, 60°C, Replicate 2 tC
cc
cr
32
1

strengthening the materials core of manufacturing enterprises
Stress relaxation
• Stress relaxation
• Stress/Modulus will relax over time
• Logarithmic behavior
• Typically 1000 hours
• Plastic deformation
• ASTM D6147
1E+02
1E+03
1E+04
1E-05 1E-03 1E-01 1E+01 1E+03
Time (hrs)
Mo
du
lus (
MP
a)
Log-Log Scaling
1E+02
3E+02
5E+02
7E+02
9E+02
1E+03
1E+03
2E+03
2E+03
2E+03
2E+03
0E+00 2E+02 4E+02 6E+02 8E+02 1E+03
Time (hrs)
Mo
du
lus (
MP
a)
Linear-Linear Scaling
Instantaneous
Long term

strengthening the materials core of manufacturing enterprises
Viscoelasticity
• In small strain (linear viscoelastic) situations
• Applied strain (stress) is recoverable
• Frequency or time based measurements
• A time-temperature correlation exists
• Higher temperature = longer time
• Lowering temperature = short time
strengthening the materials core of manufacturing enterprises
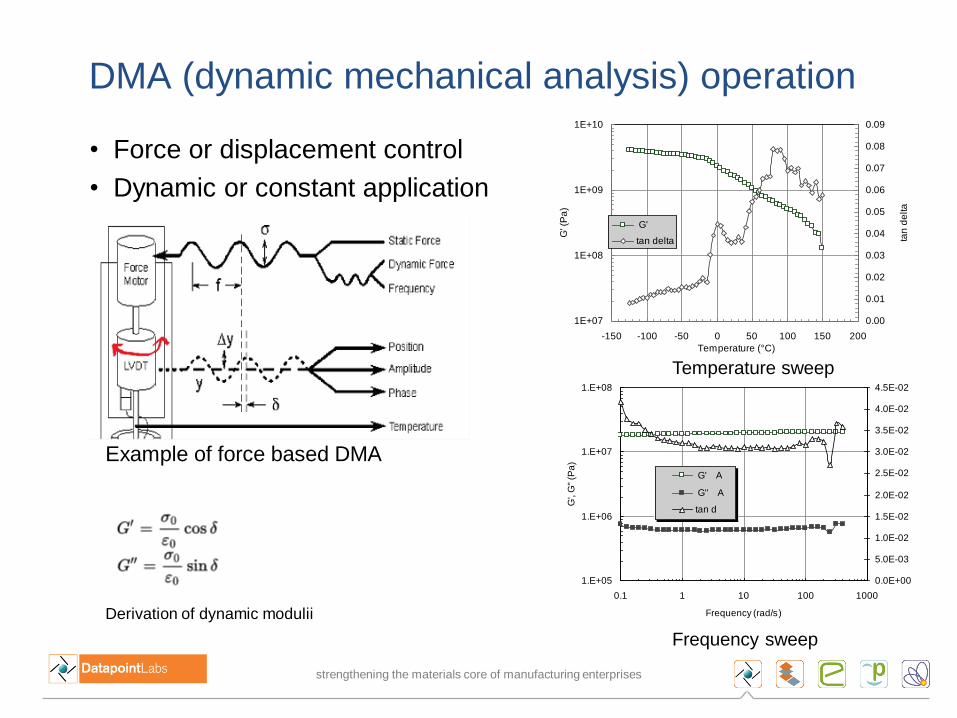
DMA (dynamic mechanical analysis) operation
• Force or displacement control
• Dynamic or constant application
Example of force based DMA
1E+07
1E+08
1E+09
1E+10
-150 -100 -50 0 50 100 150 200
Temperature (°C)
G' (
Pa
)
0.00
0.01
0.02
0.03
0.04
0.05
0.06
0.07
0.08
0.09
tan
de
lta
G'
tan delta
1.E+05
1.E+06
1.E+07
1.E+08
0.1 1 10 100 1000
Frequency (rad/s)
G',
G"
(Pa
)0.0E+00
5.0E-03
1.0E-02
1.5E-02
2.0E-02
2.5E-02
3.0E-02
3.5E-02
4.0E-02
4.5E-02
G' A
G" A
tan d
Frequency sweep
Temperature sweep
Derivation of dynamic modulii
strengthening the materials core of manufacturing enterprises
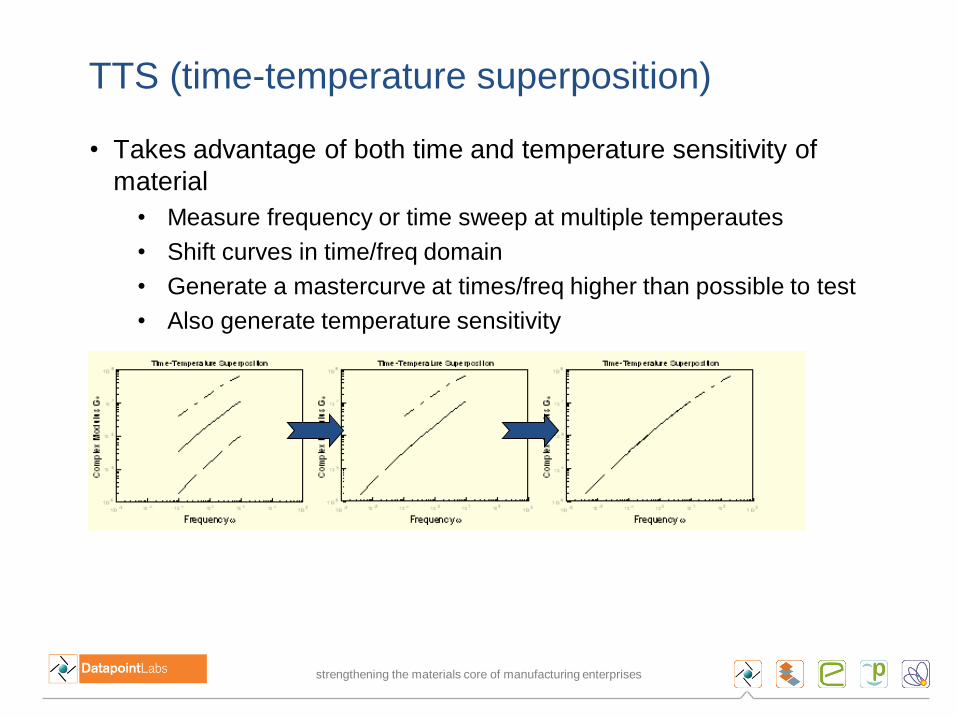
TTS (time-temperature superposition)
• Takes advantage of both time and temperature sensitivity of
material
• Measure frequency or time sweep at multiple temperautes
• Shift curves in time/freq domain
• Generate a mastercurve at times/freq higher than possible to test
• Also generate temperature sensitivity

strengthening the materials core of manufacturing enterprises
Torsional mode
• Torsional DMA
• Temperature: -125 to 600°C
• Frequency: 0.01 to 500 rad/s
• Steady or dynamic modes
• Torque range: 2 to 2000 gm-cm
• Specimens
• 25 mm diam. Disc
• Torsional (flex) bar
• Data
• G’-G” data tan delta
• Shear stress relaxation
strengthening the materials core of manufacturing enterprises
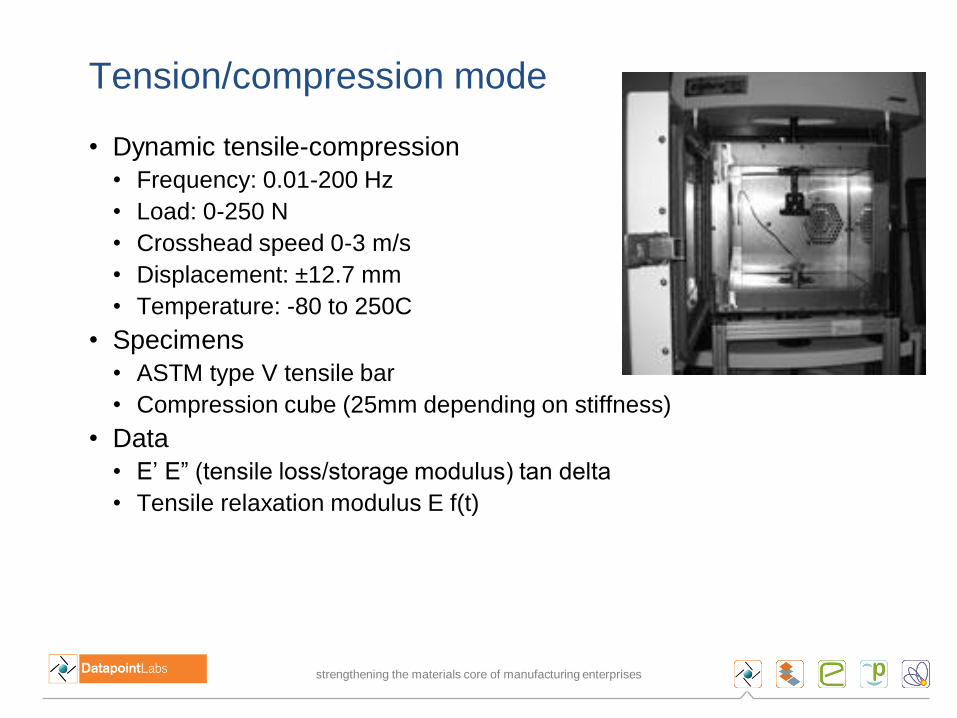
Tension/compression mode
• Dynamic tensile-compression
• Frequency: 0.01-200 Hz
• Load: 0-250 N
• Crosshead speed 0-3 m/s
• Displacement: ±12.7 mm
• Temperature: -80 to 250C
• Specimens
• ASTM type V tensile bar
• Compression cube (25mm depending on stiffness)
• Data
• E’ E” (tensile loss/storage modulus) tan delta
• Tensile relaxation modulus E f(t)
strengthening the materials core of manufacturing enterprises
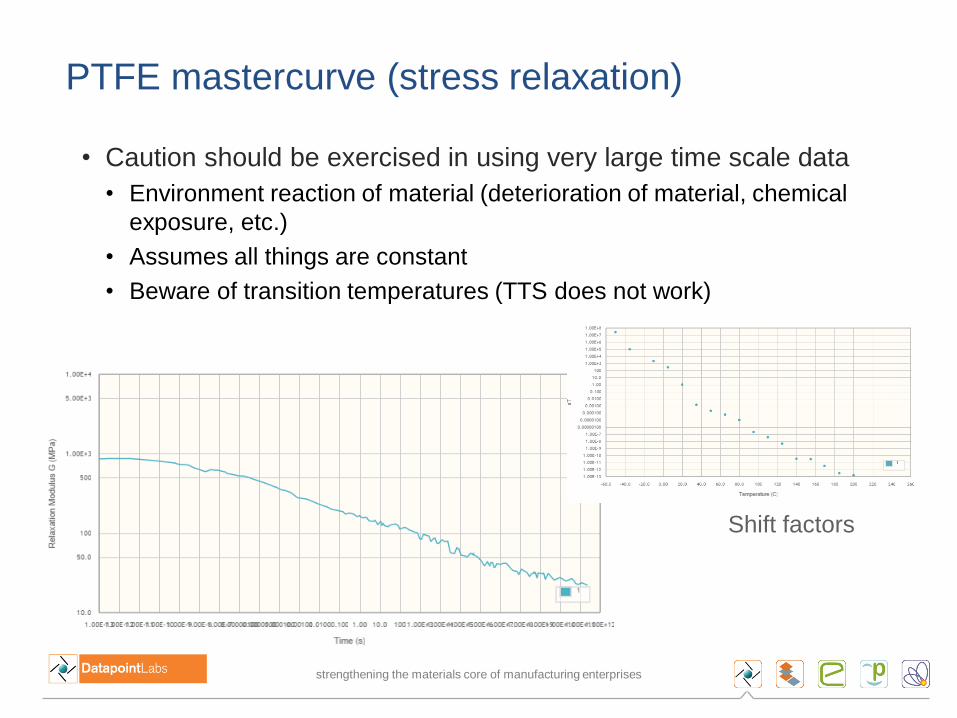
PTFE mastercurve (stress relaxation)
• Caution should be exercised in using very large time scale data
• Environment reaction of material (deterioration of material, chemical
exposure, etc.)
• Assumes all things are constant
• Beware of transition temperatures (TTS does not work)
Shift factors
strengthening the materials core of manufacturing enterprises
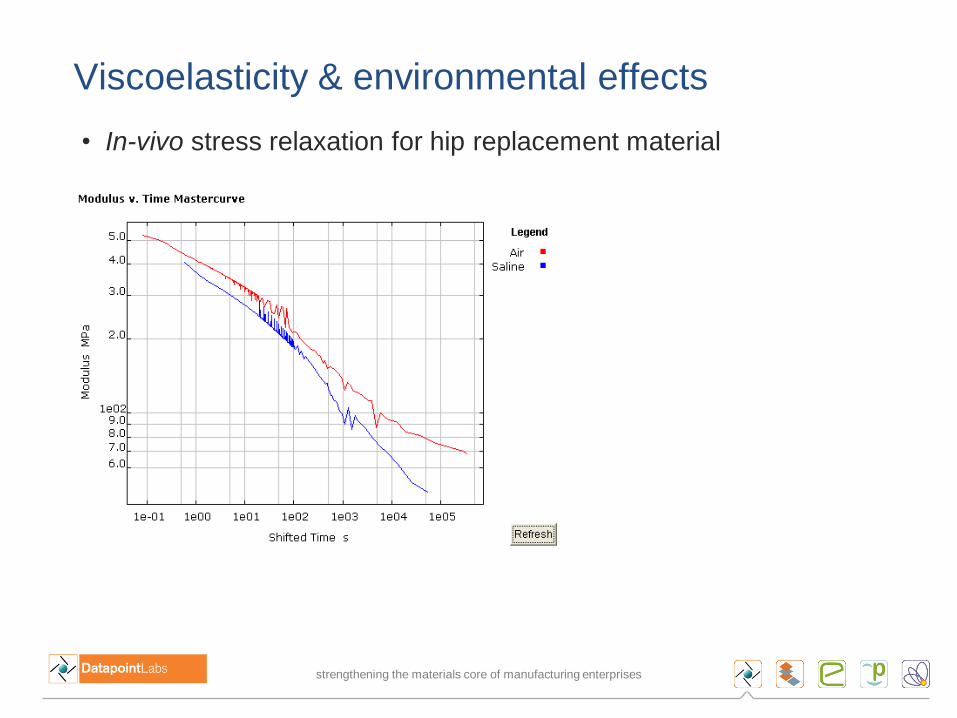
Viscoelasticity & environmental effects
• In-vivo stress relaxation for hip replacement material

strengthening the materials core of manufacturing enterprises
Viscoelastic models
• Time-based Prony series
• Frequency-based
22
22
0
1'
Gi
Gi
G
i
GG
220
1"
Gi
G
i
G
i
GG

strengthening the materials core of manufacturing enterprises
Viscoelastic models
• Normalized modulus data fit
to 6-parameter Prony series
• Used for simulating short or
long term events
• Can apply WLF shift factors
for different temperatures
Prony series
WLF equation
strengthening the materials core of manufacturing enterprises
Limitations
• Depends on linear viscoelastic theory
• Can predict non-linear effects
• Cannot predict large strain deformation
• Cannot predict failure
• Great caution when used with hyperelasticity or other
large deformation model
expert material testing | CAE material parameters | CAE Validation | software & infrastructure for materials | materials know ledge | electronic lab notebooks
Fiber Filled Plastics and the Need for
Injection Molding Simulation
strengthening the materials core of manufacturing enterprises
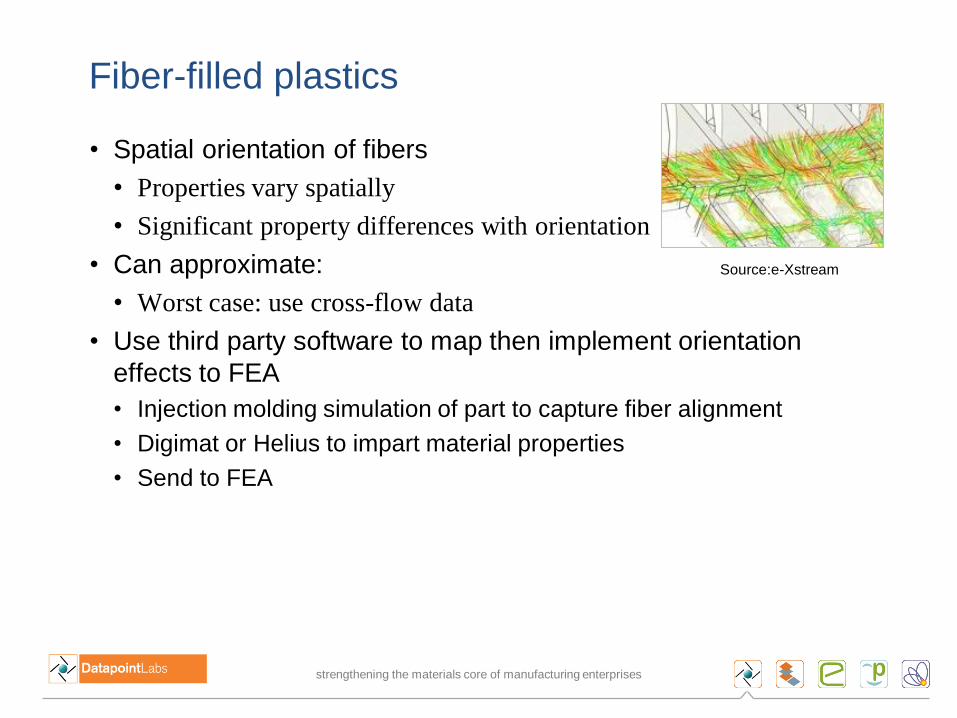
Fiber-filled plastics
• Spatial orientation of fibers
• Properties vary spatially
• Significant property differences with orientation
• Can approximate:
• Worst case: use cross-flow data
• Use third party software to map then implement orientation
effects to FEA
• Injection molding simulation of part to capture fiber alignment
• Digimat or Helius to impart material properties
• Send to FEA
Source:e-Xstream
strengthening the materials core of manufacturing enterprises
Injection molding simulation
• Simulate injection molding process
• Mold design
• Fiber orientation
• Final part geometry (warp/shrink)
• Frozen stresses
• Third party software
• Autodesk Moldflow
• Moldex 3D
• Sigmasoft
strengthening the materials core of manufacturing enterprises
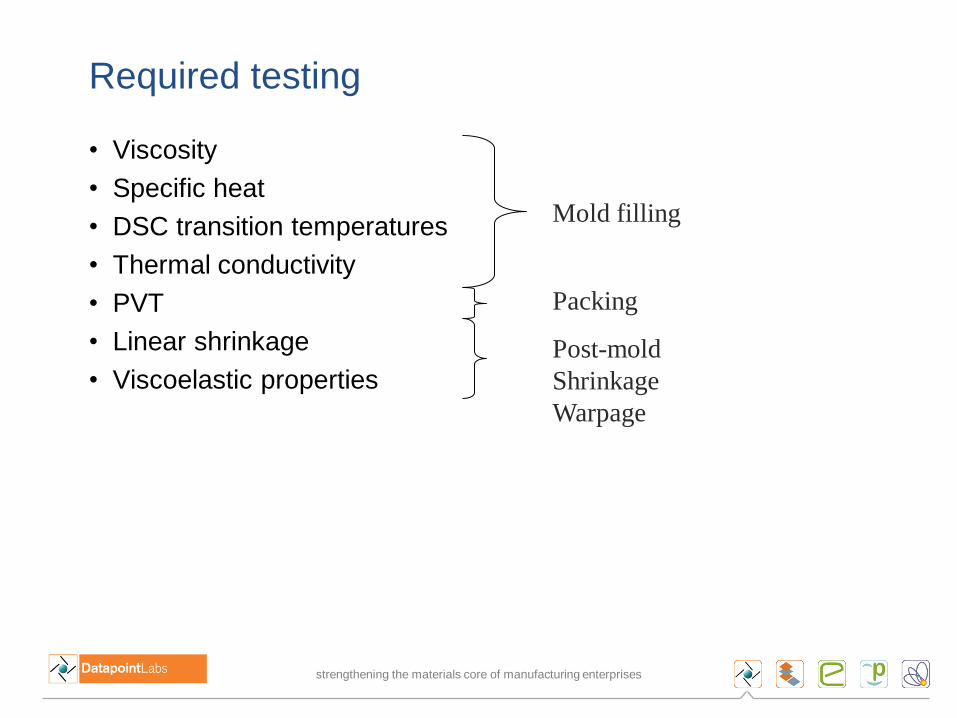
Required testing
• Viscosity
• Specific heat
• DSC transition temperatures
• Thermal conductivity
• PVT
• Linear shrinkage
• Viscoelastic properties
Mold filling
Packing
Post-mold
Shrinkage
Warpage

strengthening the materials core of manufacturing enterprises
Rheometer measurement of viscosity
• Capillary rheometer is used
• Material is extruded through a restriction
of known geometry (extremely high
tolerance dies)
• Temperature and flow rate are controlled
• Pressure drop across the restriction is
used to determine viscosity as a function
of shear rate and temperature

strengthening the materials core of manufacturing enterprises
Viscosity properties
• As shear rate increases, viscosity decreases

strengthening the materials core of manufacturing enterprises
Viscosity properties
• As temperature increases, viscosity decreases

strengthening the materials core of manufacturing enterprises
Viscosity measurements
• Apparent Viscosity
• Shear rate:
• Shear stress:
• Shear viscosity:
• Corrections to viscosity
• Reservoir and friction losses (transducer located at die)
• End pressure drop (Bagley)
• Non-parabolic velocity (Rabinowitsch correction)
3
32a
Q
d
4w
pd
L
wa
a
where: Q = Volume flow rate
p = Pressure drop
d = Capillary diameter
L = Capillary length
strengthening the materials core of manufacturing enterprises
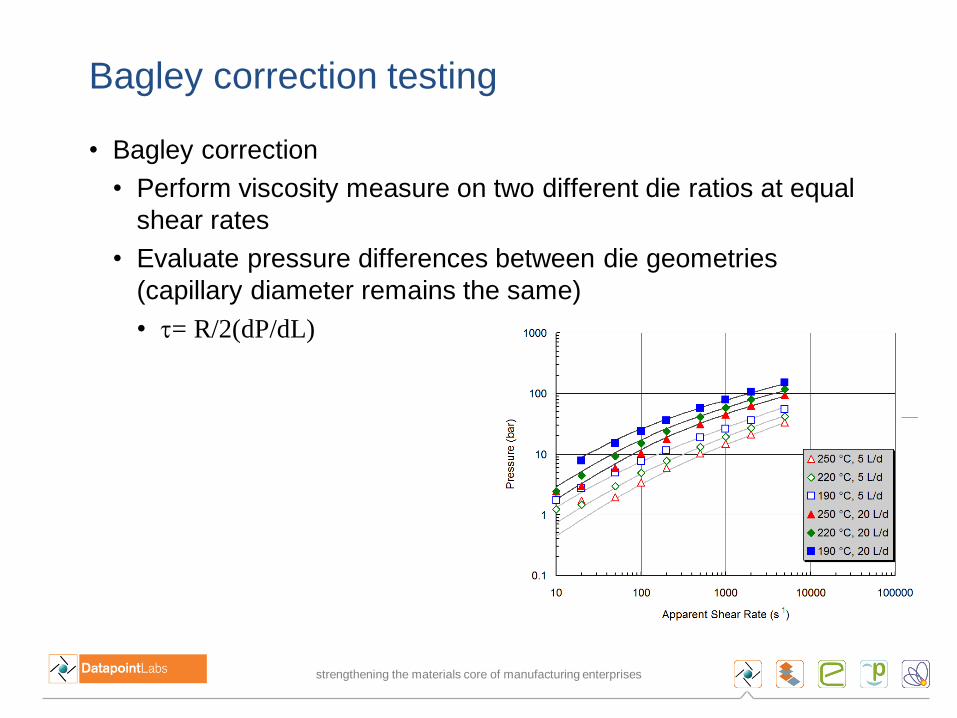
Bagley correction testing
• Bagley correction
• Perform viscosity measure on two different die ratios at equal
shear rates
• Evaluate pressure differences between die geometries
(capillary diameter remains the same)
• = R/2(dP/dL)

strengthening the materials core of manufacturing enterprises
Viscosity modeling
• Very strong rheological models
• Cross WLF, Cross Arrhenius
• Combines a model of shear rate dependency with
temperature dependency
• Allows us to predict beyond testing range
22
2110
1
0
0
exp
,
*1
,
DTA
DTADT
whereT
Tn
n 0.28400
* 32096.1
D1 3.86E+13
D2 263.15
A1 30.87
A2 51.6
strengthening the materials core of manufacturing enterprises
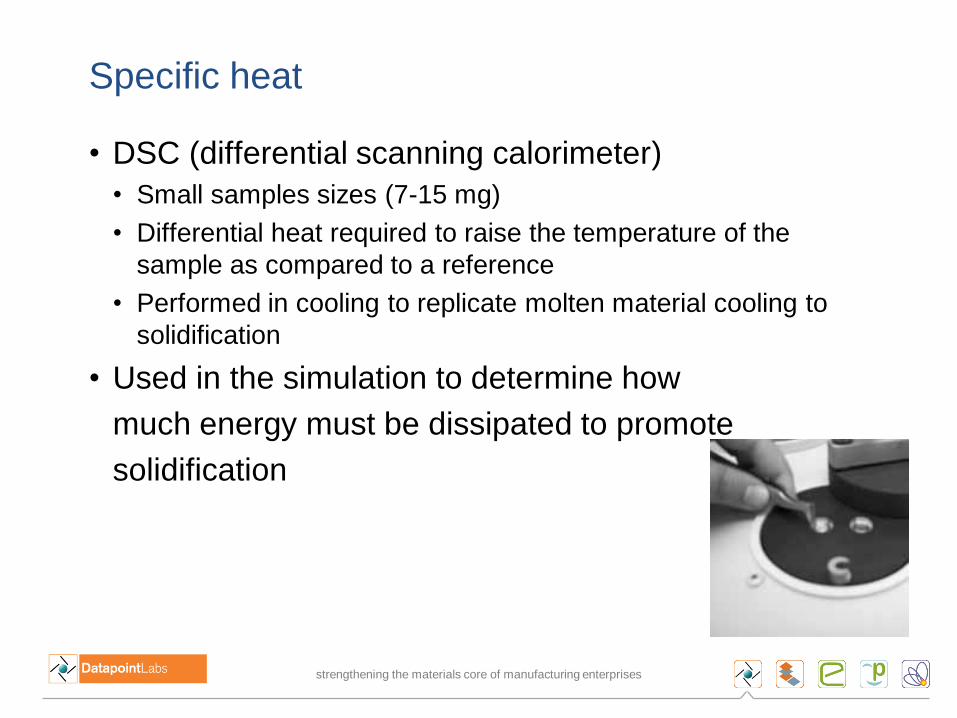
Specific heat
• DSC (differential scanning calorimeter)
• Small samples sizes (7-15 mg)
• Differential heat required to raise the temperature of the
sample as compared to a reference
• Performed in cooling to replicate molten material cooling to
solidification
• Used in the simulation to determine how
much energy must be dissipated to promote
solidification

strengthening the materials core of manufacturing enterprises
Thermal conductivity
• A measure of how well a material transfers heat
• Measured using transient line source
• Measured in melt and solid state
• Different behaviors for semi-crystalline and amorphous
Measure time to
dissipate the heat
pulse away from
probe

strengthening the materials core of manufacturing enterprises
Thermal conductivity
• Semi-crystalline materials show an increase in
thermal conductivity in solid state
• Amorphous materials show a decrease in thermal
conductivity in solid state
• The addition of fillers increase thermal conductivity
• Thermal conductivity of polymers is much lower than
metals
• Copper: 400 W/mK
• ABS: 0.176 W/mK

strengthening the materials core of manufacturing enterprises
Density as a function of PVT (pressure, volume
and temperature)
• Isobaric cooling scan (for semi-crystalline materials)
• Need to accurately capture the onset of crystallization
• Much longer run times
• Isothermal heating scan (for amorphous materials)
• No crystallization so transition is independent of mode
• Much faster (relatively)
• Pressures of 10 – 200 Mpa
• Measure both solid and melt domains
strengthening the materials core of manufacturing enterprises
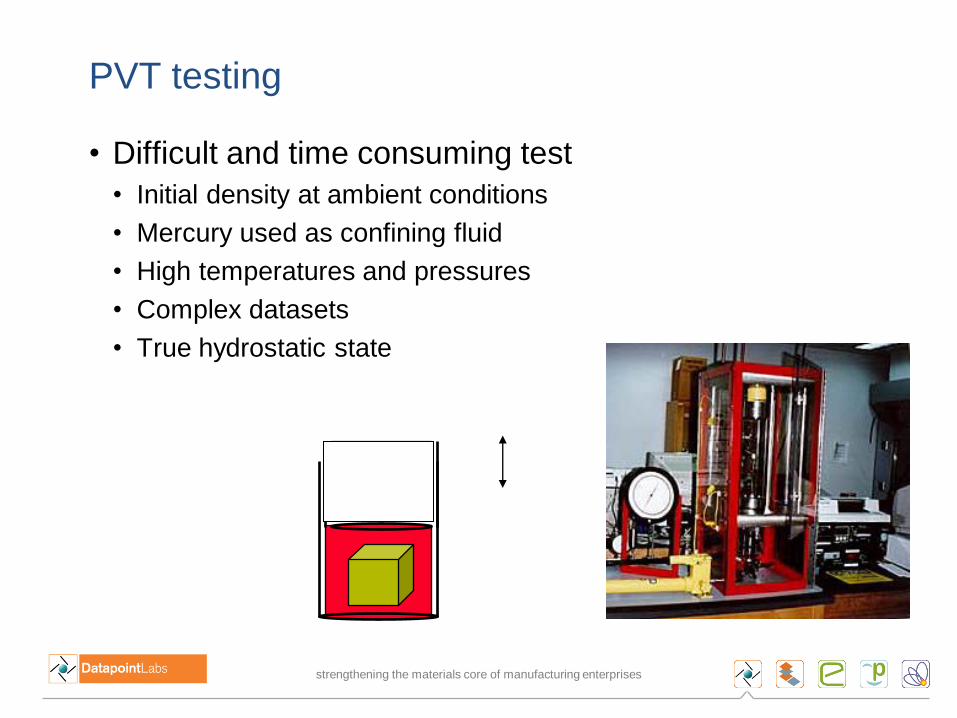
PVT testing
• Difficult and time consuming test
• Initial density at ambient conditions
• Mercury used as confining fluid
• High temperatures and pressures
• Complex datasets
• True hydrostatic state

strengthening the materials core of manufacturing enterprises
PVT test data
• Semi-crystalline material
• Transition region is critical
• Rise in temp. = rise in spec. vol.
• Rise in press. = drop in spec. vol.
Molten
Solid
Transitional

strengthening the materials core of manufacturing enterprises
PVT test data
• Amorphous material
• Transition is not dependent on mode
Molten
Solid
strengthening the materials core of manufacturing enterprises
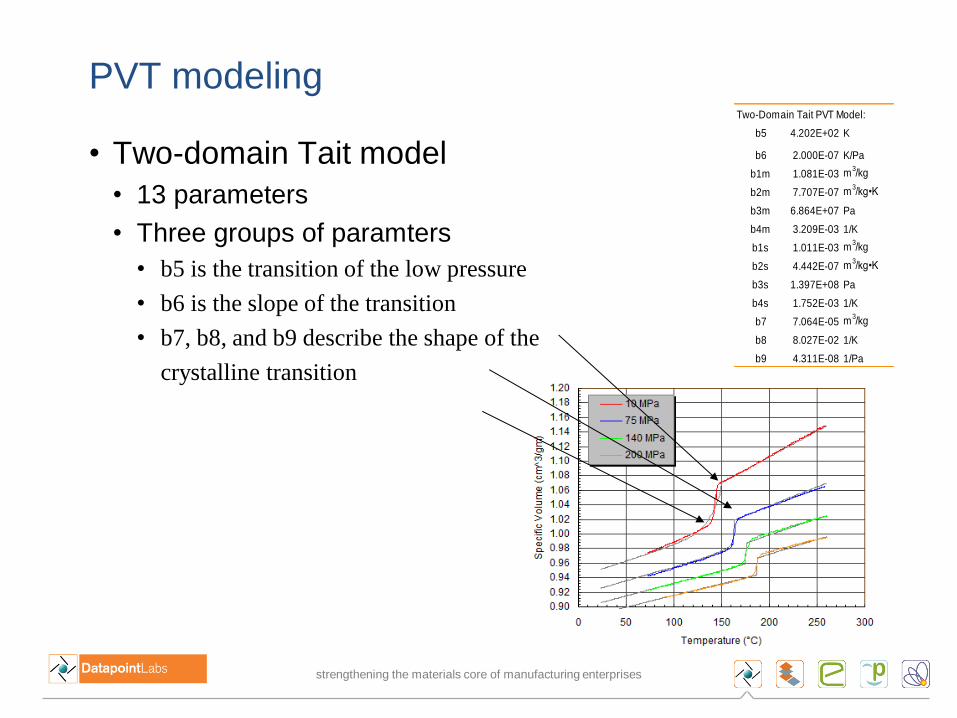
PVT modeling
• Two-domain Tait model
• 13 parameters
• Three groups of paramters
• b5 is the transition of the low pressure
• b6 is the slope of the transition
• b7, b8, and b9 describe the shape of the
crystalline transition
Two-Domain Tait PVT Model:
b5 4.202E+02 K
b6 2.000E-07 K/Pa
b1m 1.081E-03 m3/kg
b2m 7.707E-07 m3/kg•K
b3m 6.864E+07 Pa
b4m 3.209E-03 1/K
b1s 1.011E-03 m3/kg
b2s 4.442E-07 m3/kg•K
b3s 1.397E+08 Pa
b4s 1.752E-03 1/K
b7 7.064E-05 m3/kg
b8 8.027E-02 1/K
b9 4.311E-08 1/Pa

strengthening the materials core of manufacturing enterprises
PVT modeling, cont. Two-Domain Tait PVT Model:
b5 4.202E+02 K
b6 2.000E-07 K/Pa
b1m 1.081E-03 m3/kg
b2m 7.707E-07 m3/kg•K
b3m 6.864E+07 Pa
b4m 3.209E-03 1/K
b1s 1.011E-03 m3/kg
b2s 4.442E-07 m3/kg•K
b3s 1.397E+08 Pa
b4s 1.752E-03 1/K
b7 7.064E-05 m3/kg
b8 8.027E-02 1/K
b9 4.311E-08 1/Pa
b1m b2m
b3m
• b1m is the specific volume at b5
• b2m is the slope of the melt region
• b3m is the pressure sensitivity
or spread of the melt fit
• b4m is the pressure sensitivity
of the melt state slope
• b1s through b4s are the
same but for the solid state
strengthening the materials core of manufacturing enterprises
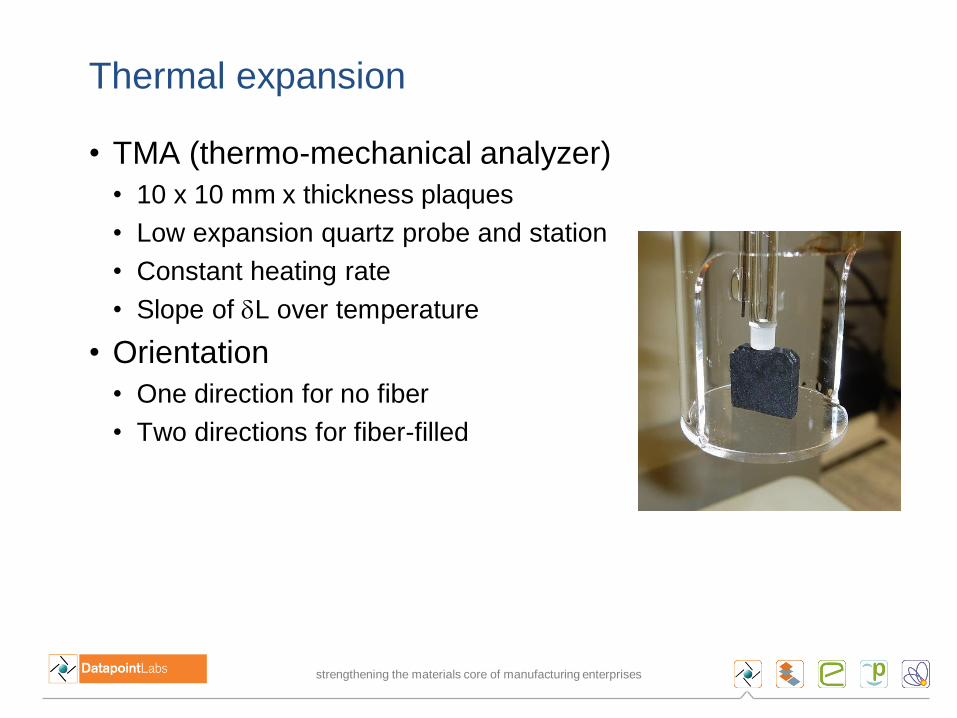
Thermal expansion
• TMA (thermo-mechanical analyzer)
• 10 x 10 mm x thickness plaques
• Low expansion quartz probe and station
• Constant heating rate
• Slope of dL over temperature
• Orientation
• One direction for no fiber
• Two directions for fiber-filled

strengthening the materials core of manufacturing enterprises
Thermal expansion test data
• Data presented as calculated slopes that are constant
over the test range
• Plot of probe position vs. temperature ensures linear
relationship
• Anisotropic materials
• Measurements across the flow always higher
• Fibers have less thermal expansion than polymer
strengthening the materials core of manufacturing enterprises
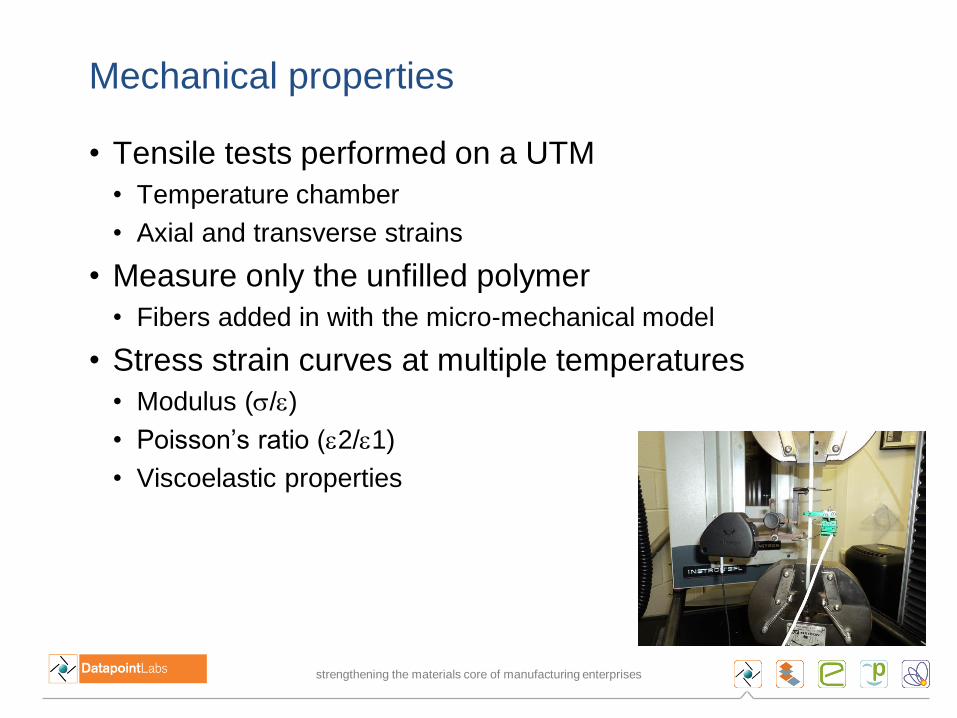
Mechanical properties
• Tensile tests performed on a UTM
• Temperature chamber
• Axial and transverse strains
• Measure only the unfilled polymer
• Fibers added in with the micro-mechanical model
• Stress strain curves at multiple temperatures
• Modulus (/)
• Poisson’s ratio (2/1)
• Viscoelastic properties

strengthening the materials core of manufacturing enterprises
Problematic Materials
• Moisture sensitive materials
• Improperly dried materials cause reduction in viscosity
• Over-dried materials cause a rise in viscosity
• PET, PA, PC, PBT etc.
• Highly filled materials
• Can “log jam” the die entrance
• Special dies must be used
• Higher scatter in test data requires engineering judgment on
behavior
• Thermally unstable materials
• Require very careful attention to residence times
• PVC
strengthening the materials core of manufacturing enterprises
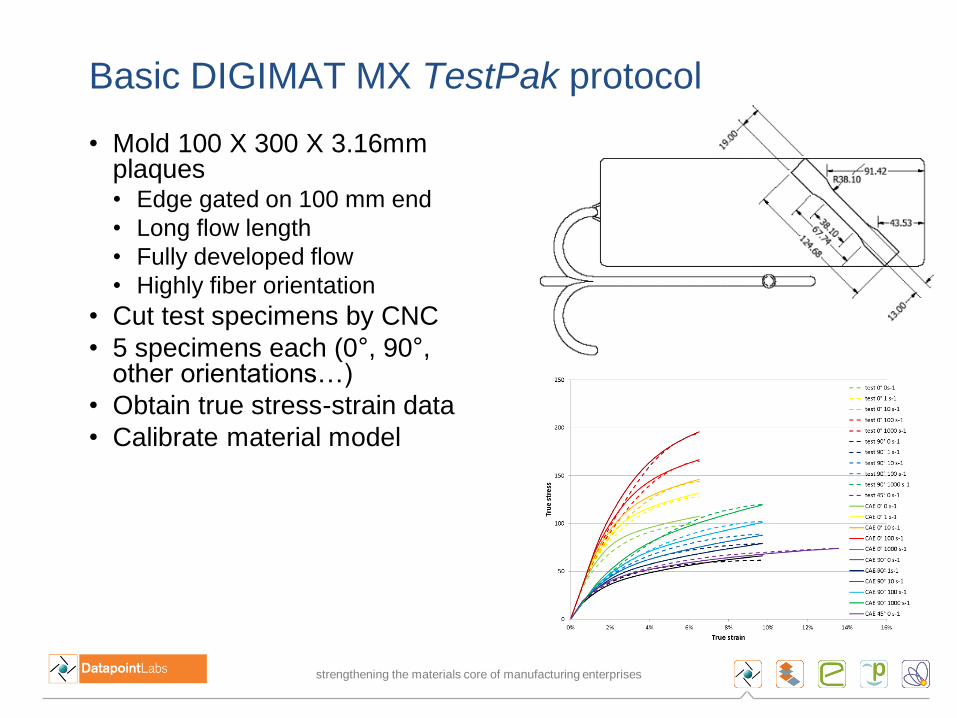
Basic DIGIMAT MX TestPak protocol
• Mold 100 X 300 X 3.16mm plaques • Edge gated on 100 mm end
• Long flow length
• Fully developed flow
• Highly fiber orientation
• Cut test specimens by CNC
• 5 specimens each (0°, 90°, other orientations…)
• Obtain true stress-strain data
• Calibrate material model

strengthening the materials core of manufacturing enterprises
DIGIMAT MX TestPak outputs
• CAD drawings of plaque and specimens
• Plaque molding conditions
• Injection molding material file
• True stress strain data (M-204) at 23°C
• 0°, 90° orientation from plaque
• DIGIMAT MX reverse engineering
• Data is ready for FEA
strengthening the materials core of manufacturing enterprises
DIGIMAT TestPak options
• Additional directions (10°, 20°, 45°)
• Thermomechanical (from –40° to 150°C)
• Strain-rate dependent (0.01 to 100/s)
• 3-point bend data (quasi-isotropy)
• Tensile bar data (coarse fit)
• Viscoelasticity
• Low cycle fatigue (Lemaitre-Chaboche)
• High cycle fatigue (under development)

strengthening the materials core of manufacturing enterprises
Example: airbag housing
Source:e-Xstream

strengthening the materials core of manufacturing enterprises
Impact on failure
Source:e-Xstream
With Fiber Orientation
Isotropic
strengthening the materials core of manufacturing enterprises
Choosing the right properties
• Properties change over product operational temperature
• Properties change with environmental exposure
• Orientation (fiber-filled plastics)
• Viscoelastic (time-based behavior)
• Creep
• Stress relaxation
• Effect of strain rate