
Visa Report - IG UK · Visa Report 2 9th May 2008 Anthony Grech, Research Analyst, IG Index...
10
Visa Report 9th May 2008 Anthony Grech, Research Analyst, IG Index
Transcript of Visa Report - IG UK · Visa Report 2 9th May 2008 Anthony Grech, Research Analyst, IG Index...

Visa Report9th May 2008Anthony Grech,Research Analyst,IG Index

IG Index plc Visa Report 29th May 2008
Anthony Grech, Research Analyst, IG Index
ObjectiveThe report attempts to provide the reader with an overview of Visa, its initial public offering and its value relative to its smaller rival MasterCard. The final section will attempt to identify if there is any upside potential in Visa’s share price.
Valuing Visa: an overview of the payments giantIn March, Visa announced the largest initial public offering in US history; but what is the future for shares in the company?
IG Index plc Visa Report 39th May 2008
Anthony Grech, Research Analyst, IG Index
Overview of Visa IncVisa Inc operates in the global payments industry, which means that it competes against all forms of payment including: paper-based forms (cash and checks); card-based payments (credit, debit, ATM, prepaid, private-label and other types of general purpose cards); and electronic payments (wire transfers, electronic benefits transfers, ACH payments and electronic data interchange).
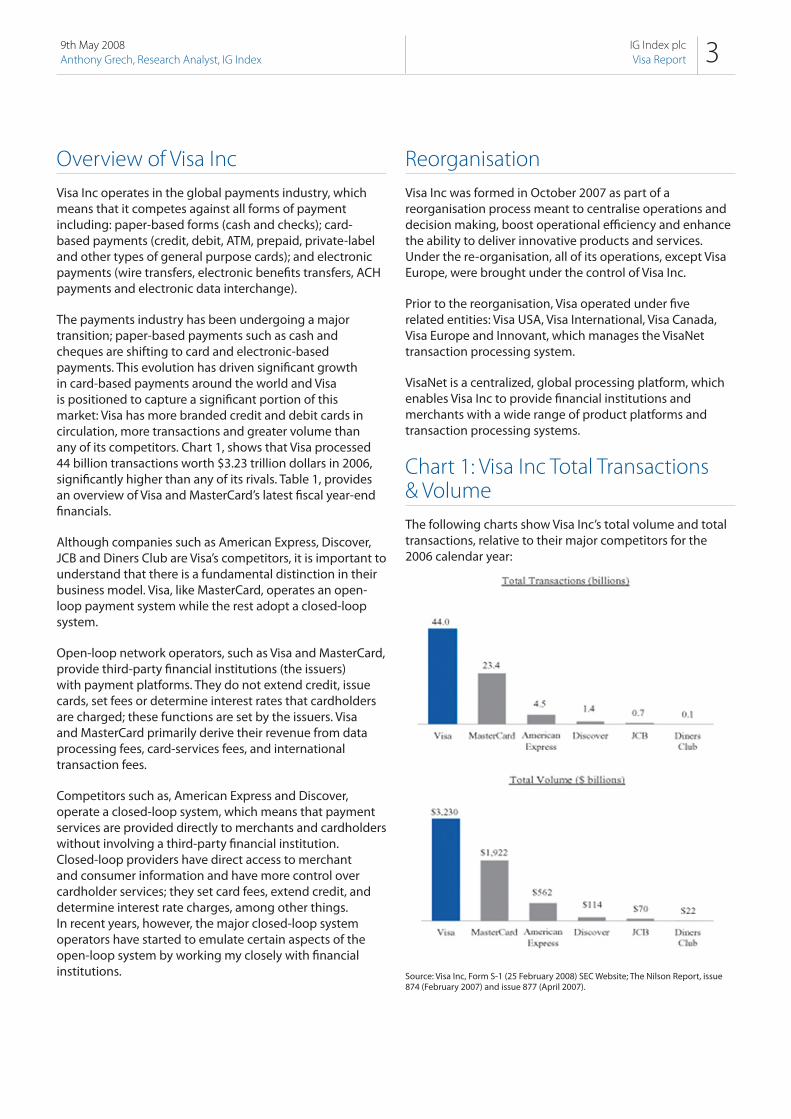
The payments industry has been undergoing a major transition; paper-based payments such as cash and cheques are shifting to card and electronic-based payments. This evolution has driven significant growth in card-based payments around the world and Visa is positioned to capture a significant portion of this market: Visa has more branded credit and debit cards in circulation, more transactions and greater volume than any of its competitors. Chart 1, shows that Visa processed 44 billion transactions worth $3.23 trillion dollars in 2006, significantly higher than any of its rivals. Table 1, provides an overview of Visa and MasterCard’s latest fiscal year-end financials.
Although companies such as American Express, Discover, JCB and Diners Club are Visa’s competitors, it is important to understand that there is a fundamental distinction in their business model. Visa, like MasterCard, operates an open-loop payment system while the rest adopt a closed-loop system.
Open-loop network operators, such as Visa and MasterCard, provide third-party financial institutions (the issuers) with payment platforms. They do not extend credit, issue cards, set fees or determine interest rates that cardholders are charged; these functions are set by the issuers. Visa and MasterCard primarily derive their revenue from data processing fees, card-services fees, and international transaction fees.
Competitors such as, American Express and Discover, operate a closed-loop system, which means that payment services are provided directly to merchants and cardholders without involving a third-party financial institution. Closed-loop providers have direct access to merchant and consumer information and have more control over cardholder services; they set card fees, extend credit, and determine interest rate charges, among other things. In recent years, however, the major closed-loop system operators have started to emulate certain aspects of the open-loop system by working my closely with financial institutions.
ReorganisationVisa Inc was formed in October 2007 as part of a reorganisation process meant to centralise operations and decision making, boost operational efficiency and enhance the ability to deliver innovative products and services. Under the re-organisation, all of its operations, except Visa Europe, were brought under the control of Visa Inc.
Prior to the reorganisation, Visa operated under five related entities: Visa USA, Visa International, Visa Canada, Visa Europe and Innovant, which manages the VisaNet transaction processing system.
VisaNet is a centralized, global processing platform, which enables Visa Inc to provide financial institutions and merchants with a wide range of product platforms and transaction processing systems.
Chart 1: Visa Inc Total Transactions & VolumeThe following charts show Visa Inc’s total volume and total transactions, relative to their major competitors for the 2006 calendar year:
Source: Visa Inc, Form S-1 (25 February 2008) SEC Website; The Nilson Report, issue 874 (February 2007) and issue 877 (April 2007).

IG Index plc Visa Report 49th May 2008
Anthony Grech, Research Analyst, IG Index
Initial Public Offering (IPO)On 18 March 2008, Visa Inc listed its shares on the New York Stock Exchange via an initial public offering. The company listed 406 million class A common stock at a price of $44 per share, higher than the indicative offering price which ranged between $37 and $42 per share. The offer was fully subscribed by the public and the underwriters exercised their overallotment option and acquired an additional 40.6 million class A shares. This means that Visa received $19.6 billion in gross proceeds, $19.1 billion net, making it the largest IPO in US history.
Visa used $13.45 billion of the net proceeds from the IPO to redeem class B and class C (series I) common stock. In addition, the company intends to use an additional $2.65 billion of IPO’s net proceeds to redeem the remaining class C (series II) common stock and a proportion of its class C (series III) common stock in October 2008. The redemption of these shares will be distributed to its shareholders, which consists of a number of banks, such as JPMorgan, Bank of America, National City Corp, Citigroup, and US Bancorp.
A further $3 billion of the IPO proceeds were deposited into an escrow account and reserved for settling liabilities arising from litigations with American Express, Discover and Attridge. Following the IPO, Visa Inc intends to pay a dividend on a quarterly basis. [1]
Additional details may be found on Visa’s Final Prospectus which is listed on the Securities Exchange Commission website.
Table 1: Key Pro-Forma Figures
Risks associated with Visa and MasterCardThere are a number of risks associated with Visa and MasterCard. A few of these risks include: intense competition, reliance on few key customers, non-exclusive contracts, regulatory/legislative changes and litigations.
1) CompetitionCompetition in the payments industry is intense and Visa and MasterCard continue to experience pricing pressures from customers demanding better pricing arrangements, greater rebates and incentives.
2) Reliance on few key clients
Although Visa and MasterCard have a large client base, they derive a large proportion of their revenues from a handful of institutional clients. This means that MasterCard or Visa could experience an impact in earnings if any of their key clients become insolvent, switch to a competitor or develop their own payment system.
JPMorgan and its affiliates contributed $454 million (8.7%) of Visa’s 2007 fiscal year pro-forma revenues and $408 million (10.5%) of its 2006 pro-forma revenues.
MasterCard generated approximately $1.2 billion, circa 30%, of its total revenue from five major customers during its 2007 fiscal year.
3) Non-exclusive agreements with key clientsVisa and MasterCard do not have exclusive contracts with their largest customers:
According to Visa’s Final Prospectus (19 March 2008): ‘Most of our larger customer relationships (including our customer relationships with JPMorgan Chase and Bank of America) are not exclusive and in certain circumstances (including, in some cases, on relatively short notice) may be terminated by our customers. Our customers can reassess their commitments to us at any time in the future and/or develop their own competitive services. Loss of business from any of our largest customers could have a material adverse effect on our businesses [2].
MasterCard’s latest Annual Report states ‘most of our customer relationships are not exclusive and in certain circumstances may be terminated by our customers. Our customers can reassess their commitments to us at any time in the future and/or develop their own competitive services’ [3].
[1] On November 1, 2007, Visa Inc., Visa USA and Visa International agreed to settle litigations with American Express. Under the terms of the settlement agreement, Visa had to pay an initial payment of $1.13 billion and an additional $1.12 billion (payable in 16 quarterly instalments of $70 million) to American Express. Visa intends to fund the payment obligations from the funds deposited into the escrow account.
[2] Visa Inc, Final Prospectus (19 March 2008): http://www.sec.gov/Archives/edgar/data/1403161/000119312508060989/d424b4.htm
[3] MasterCard Inc, 2007 Annual Report (20 February 2008): http://www.sec.gov/Archives/edgar/data/1141391/000119312508034694/d10k.htm
(1) (2) (3): Excludes litigation charges of $2,652 million in 2007 & 23 million in 2006.(4) (5) (6): Excludes charitable contributions of $20 million in 2007 and $414.8 million in 2006; and excludes litigation settlements of $3.4 million in 2007 and $24.9 million in 2006.
Source: Visa Inc, Form S-1 (25 February 2008) SEC Website. MasterCard, 10-K (21 February 2008) SEC Website. The adjustments to operating expense, operating income and pre tax profit (notes 1-6 above) have been made by the author for analytical purposes and do not form part of Visa’s S-1 form and MasterCard’s 10-K form.

IG Index plc Visa Report 59th May 2008
Anthony Grech, Research Analyst, IG Index
4) Regulatory/legislative changes and litigations
Visa and MasterCard are susceptible to regulatory scrutiny in a number of countries. For instance, interchange fees, (which are the fees that a merchant bank pays a customer’s bank for accepting cards), varies in different countries and may be subject to government regulation. According to Visa’s Final Prospectus, Visa and MasterCard have been hit by 50 class actions and individual complaints regarding the breach of interchange fees. Smaller competitors such as Discover and American Express, have also accused MasterCard and Visa of abusing their market dominance.
In another case, in June 2003, Visa passed a bylaw requiring 100 of its largest issuers of debit cards in the US to pay a ‘settlement service fee’ if they reduced their Visa debit volume by more than 10%. A court judgement eventually modified this bylaw, to clarify that the ‘settlement service fee’ would only be imposed if an issuer shifted their entire portfolio of debit cards to MasterCard.
Visa is currently appealing the modification. If the decision is overturned in favour of Visa it would impose a ‘settlement service fee’ on issuers that seek to do debit card business with MasterCard. It would effectively prohibit its members from converting their debit card programs to MasterCard’s programs and prevent MasterCard from acquiring business from current Visa customers.
There is the risk that severe, ongoing and possibly unforeseen litigations arising from regulatory changes or from rivals, could damage the reputation of Visa or MasterCard and impact their financial stability.
Further details of Visa and MasterCard’s ‘risk factors’ may be found on Visa Inc’s Final Prospectus and on MasterCard’s latest Annual Report.
Historic Valuation Multiples - OverviewThis section extracts the historic valuation multiples of MasterCard and Visa Inc in an attempt to understand if Visa’s offer price of $44 per share was attractively valued when compared to MasterCard.
This type of analysis is referred to as ‘relative valuation’ analysis and assumes that the market has fairly valued MasterCard. The reason why I do not compare Visa’s multiples with American Express and other credit card companies, is because they are closed-loop operators and do not have an identical business model. Visa Inc and MasterCard are more alike as they both operate an open-loop network and generate their revenue by processing transactions.
The fundamentals used in my analysis exclude charitable contributions and litigation expenses. Visa Inc’s pro-forma financials for the fiscal year ending September have been adjusted in order to conform to MasterCard’s December fiscal year end. I have calculated Visa’s market capitalisation and per share figures using 959.128 million shares outstanding and MasterCard’s figures are calculated using 131.131 million outstanding shares.
Visa’s IPO price and MasterCard’s share price as at 18 March 2008 will be compared to their adjusted December year end figures in order to produce historic valuation multiples such as the: price to earnings (PE); price to book (PB); price to sales (PS); and enterprise value to earnings before interest, tax, depreciation and amortisation (EV to EBITDA). These valuation multiples have been calculated in order to determine Visa’s value relative to MasterCard’s.
Price to Earnings (PE) The price to earnings multiple compares Visa’s IPO price and MasterCard’s share price with their respective December 2007 adjusted earnings per share. A high ratio may mean that a company is over-valued or could reflect investors’ willingness to pay a premium on every dollar of earnings. Growth companies generally have a high PE because investors expect higher earnings growth.
At the IPO price of $44, Visa’s price to earnings multiple was 35.64x (see Table 2). At a share price of $210.25, MasterCard’’s PE was around 25x. This means that from a PE perspective, Visa Inc’s IPO price was at a premium to MasterCard’s.
Price to Book (PB) This multiple compares a company’s market value of equity with its book value of equity, referred to as ‘shareholders funds’ (total assets less total liabilities). A high PB may mean that a company is over-valued, or, as with the PE, it means that investors are willing to pay a premium over book value as they expect the company to grow rapidly, make higher earnings and generate higher returns on equity.
Visa Inc’s IPO price was 2.52x its book value, significantly smaller than MasterCard’s multiple of 9.11x
Price to Sales (PS)This multiple compares the market value of a company with its revenue. Visa’s price to sales multiple was 7.66x, slightly higher than MasterCard’s multiple of 6.78x.
Enterprise Value to EBITDA (EV/EBITDA)The enterprise value is used by buyout firms in an

IG Index plc Visa Report 69th May 2008
Anthony Grech, Research Analyst, IG Index
attempt to determine the real value of a firm. It is more significant than market capitalisation because it takes into consideration liabilities in a firm’s capital structure: EV is calculated as market capitalisation plus debt, minority interest and preferred shares, minus total cash and cash equivalents. Like the PE, a high EV/EBITDA could mean that a company is over-valued. However, a higher multiple reflects investors’ willingness to pay a premium for growth. A lower multiple is generally given to mature lower growth firms or could mean that a firm is under-valued.
Visa Inc’s EV/EBITDA was calculated at around 19.15x while MasterCard’s multiple was around 20.21x, which means that Visa Inc was intrinsically cheaper at $44 per share.
I have also compiled Visa and MasterCard’s pre and post IPO historic fundamentals. This data may be retrieved on tables 8 and 10 at the end of this report.
Table 2: Relative Valuation Analysis
Interpretation of Visa’s Historic Valuation MultiplesThe previous section highlighted Visa Inc’s relative valuation multiples at IPO stage. The analysis showed that Visa Inc’s shares were listed at a premium to MasterCard’s historic PE multiple of 25x. Consequently, Visa’s PE of 35.6x was reasonable given its dominance in the electronic payment industry. However, since both companies have ongoing litigation costs and charitable contributions, the enterprise value to EBITDA multiple should be given more weight.
Visa Inc’s price to book multiple of 2.52x was at a significant discount to MasterCard’s multiple of 9.11x. This does not necessarily mean that Visa Inc was undervalued or that MasterCard was overvalued, but rather a reflection of their return on equity. Every dollar of MasterCard’s equity returned 36.4% in December 2007 while Visa returned 7.1% on its equity. As a result, I believe that Visa’s lower price-to-book multiple was justified.
The capital structure of MasterCard could also explain why its price to book multiple was higher; MasterCard’s total debt of $230 million is double the amount of debt held by Visa Inc. From a debt to equity perspective, MasterCard’s ratio of 7.6% is negligible but still much higher than Visa’s debt to equity ratio of 0.7% and this could be one of the contributors boosting its return on equity.
When factoring in cash & equivalents, both companies are cash rich. MasterCard’s cash surplus, measured by net debt to equity, is -90%: significantly higher than Visa Inc’s net debt to equity of -16.1%. This means that MasterCard could hypothetically take on further leverage to boost future returns. In turn, expectations of higher return on equity in the future could also be one of the reasons why MasterCard is trading at a higher price to book multiple.
In terms of efficiency, Visa Inc is more cost-effective than MasterCard; when excluding litigation settlements of $2.65 billion, Visa’s operating costs (as a percentage of sales) were 66.8% in December 2007, slightly lower than MasterCard’s ratio of 72.2% (excluding charitable contributions and litigation settlements totalling $23.4 million). Visa’s increased efficiency is reflected in its operating margin, which adjusted for December 2007, was 33.2% compared to MasterCard’s margin of 27.8%.
Visa Inc’s profitability, measured by its adjusted December 2007 annual profit of $1.184 billion (excluding litigation settlements) as a percentage of revenue, produced a net profit margin of 21.5%. This is lower than MasterCard’s net
Source: Visa Inc, Form S-1 (25 February 2008) SEC Website. MasterCard, 10-K (21 February 2008) SEC Website. MasterCard’s analysis excludes charitable contributions and litigation settlements while Visa’s financials exclude the litigation settlements (please view assumptions for other adjustments). These alternations have been made by the author for analytical purposes and do not form part of the Visa’s S-1 form and MasterCard’s 10-K form.
Assumptions:* Visa’s fiscal year end is in September while MasterCard’s fiscal year ends in December. In order to make a direct comparison, I have adjusted Visa Inc’s pro-forma figures to conform to MasterCard’s December year end.
* I have excluded MasterCard’s charitable contributions and litigation settlements and Visa Inc’s litigation settlements.
* Per share figures are calculated using the total number of shares outstanding, in Visa’s case I used 959.128 million and MasterCard 131.131m.

IG Index plc Visa Report 79th May 2008
Anthony Grech, Research Analyst, IG Index
profit margin of 27.1% (excluding charitable contributions and litigation settlements). However, after excluding $391 million from the sale of Redecard S.A., MasterCard’s net profit margin would have fallen to around 20.8%, slightly lower than Visa Inc.
In order to remove the distortions of one-off items, earnings before interest, tax, depreciation and amortisation (EBITDA) is often used. EBITDA is considered to be more accurate because it measures a company’s ability to generate income from its core operations. A closer look at Visa Inc’s adjusted EBITDA for December 2007 showed that the company boasted an EBITDA margin of 37.1%, higher than MasterCard’s 30.2%.
Visa’s EV to EBITDA multiple (given the IPO price of $44) translated to multiple 19.15x. On the same day as Visa’s IPO, MasterCard’s EV to EBITDA multiple was higher at 20.21x, placing Visa Inc’s IPO offer price of $44 per share in a attractive position.
Historic valuation multiples are important because they are concrete figures. However, forward valuation multiples, which are derived from forecasted financials, must also be taken into consideration when determining relative value. Tables 3 through 6 overleaf show Visa and MasterCard’s forward valuation multiples, the data reveals that Visa listed its shares at extremely attractive forward valuation multiples when compared to MasterCard and this helps explain why Visa’s share price rallied after the IPO; Visa’s offer price of $44 was at a 2008 prospective EV to EBITDA multiple of around 14.5x whereas on 18 March MasterCard was trading at a comparable multiple of 15.1x.
OpinionSince listing, Visa’s share price increased from $44 to $70.28, representing a 59.7% rise. I believe that this rally was predictable given Visa’s strong market position and its attractive historic and forward valuation multiples relative to its smaller rival MasterCard.
The fact that Visa’s share price surged in such a short period means that the market was factoring in a premium over MasterCard’s valuations. This brings me to the following question; why was Visa priced at attractive valuation multiples when compared to MasterCard?
Visa could have listed its shares at a higher premium. However, I believe that the economic environment and the circumstances of its shareholders had a lot to do with its valuations; the currently weak economic environment has left some of the banks that own Visa in danger of
suffering from further sub-prime related write-downs and in need of liquidity [4]. In addition, equity market instability contributed to elevated levels of uncertainty and shifted investor preference to safer asset classes such as cash.
Visa could have factored in a premium by staggering the issue and floating a small proportion of its shares during different periods, thus increasing the probability of all the shares being taken up. However, the net proceeds in implementing such a strategy may not have been enough to cover the short term liquidity risks that its shareholders are facing. As a result, it was a better strategy for Visa to float enough shares to make it the largest IPO in US history and in the process of doing so, create the necessary publicity to attract investor attention.
From a valuation perspective, it made more sense for Visa to price its shares at relatively attractive valuations (when compared to MasterCard), in order to maximise the probability of such a large IPO being a success and ensure that sufficient funds were taken in to help its shareholders. In addition, Visa Inc’s susceptibility to litigations could have deterred a certain number of investors, so an attractive valuation would have offset these concerns.
The surge in Visa’s value is a reflection of the market’s perception of its premium over MasterCard. Visa warrants a premium because it is a market leader in an industry which is poised to continue growing at a rapid rate; according to The Nilson Report [5], global card purchase transactions grew at a compound annual growth rate (CAGR) of 14% over the period from 2000 to 2006. In addition, the report forecasted global card transactions to increase at a CAGR of 11% from 2006 to 2012, with particularly strong growth in Asia/Pacific, Latin America and Middle East/Africa.
Visa’s leadership position and geographic presence is important because it can entice customers to migrate to its system. Consequently, the larger Visa becomes the greater the value of its network. In April, HSBC announced that it intends to switch the debit cards of 10 million UK clients from MasterCard’s Maestro to Visa. HSBC stated that while Maestro could be used across Europe, it was not as popular in the US or Asia. As a result, the switch to Visa would allow its customers greater international usage. In addition, HSBC stated that Visa offers customers some protection if goods bought on their card are damaged. HSBC plans to start issuing Visa debit cards to its current account customers at the end of 2008 and expects the changeover to be complete by 2010 [6] .
Visa’s recent reorganisation should improve centralisation and efficiency and the funds retrieved from its IPO should
[4]TimesOnline (5 March 2008) ‘Predictions of further writedowns and cash shortfall rock Citigroup’; Reuters (12 March 2008) ‘BoC sees more subprime-related writedowns globally.’; Bloomberg (March 18 2008) ‘Bernanke May Cut Benchmark Rate by Most Since Volcker Update 6’
[5] Visa Inc, Form S-1 (25 February 2008) SEC Website; The Nilson Report, issue 874 (February 2007) and issue 877 (April 2007).
[6] Financial Times (April 9 2008), ‘HSBC to switch debit cards of 10m customers’: http://www.ft.com/cms/s/0/38929aea-05c1-11dd-a9e0-0000779fd2ac,dwp_uuid=f4ebce78-e821-11db-b2c3-000b5df10621.html
IG Index plc Visa Report 89th May 2008
Anthony Grech, Research Analyst, IG Index
help the company cover short term liabilities. For all of the above reasons, Visa’s market position and bottom line should continue to improve, therefore a valuation premium over its smaller rival MasterCard is warranted.
At this juncture, I believe that most of the upside potential in Visa’s share price has been factored in and, assuming that there is no new information that will significantly alter future earnings, investors should not expect Visa’s share price to repeat MasterCard’s fivefold performance over a two year period. When MasterCard listed for the first time, there was no other publicly traded open-loop provider to benchmark its valuations. As a result, MasterCard’s valuations were probably benchmarked against closed-loop platform providers and this may have contributed to undervaluation issues. This time around, Visa had an almost identical benchmark, which minimises the likelihood of severe undervalued issues.
Consensus estimates provided by Bloomberg show that the market expects Visa Inc’s share price to rise to $74.25 within the next 12 months, leaving 5.6% upside on Visa’s closing price on 22 April 2008. MasterCard’s median price target is $243.43 per share, leaving 3.8% upside on its closing price on 22 April 2008 - Forecasts are available on Tables 7 and 9.
Table 3: Visa Forward Multiples (at IPO stage)
Table 4: MasterCard Forward Multiples
Table 5: Visa Forward Multiples (Post IPO stage)
Source: Bloomberg (22 April 2008)NB: Forward multiples are calculated on Bloomberg’s financial
Source: Bloomberg (22 April 2008)NB: Forward multiples are calculated on Bloomberg’s financial projections
Source: Bloomberg (22 April 2008)NB: Forward multiples are calculated on Bloomberg’s financial projections

IG Index plc Visa Report 99th May 2008
Anthony Grech, Research Analyst, IG Index
Table 6: MasterCard Forward Multiples
Table 7: Visa Inc Analyst Recommendations
Table 8: Visa Historic Fundamentals – Pre & Post IPO
Source: Bloomberg (22 April 2008)NB: Forward multiples are calculated on Bloomberg’s financial projections
Source: Bloomberg (22 April 2008)
NB: the data above has been manipulated by the analyst for comparison purposes.
Source: Visa Inc, Form S-1 (25 February 2008) SEC Website. The adjustments have been made by the author for analytical purposes and do not form part of Visa’s report
Assumptions:* Visa’s fiscal year end is in September has been adjusted to conform to MasterCard’s fiscal year which ends in December.
* Litigation settlements have been excluded

IG Index plc Visa Report 109th May 2008
Anthony Grech, Research Analyst, IG Index
Table 9: MasterCard Analyst Recommendations
Table 10: MA Historic Fundamentals – Pre & Post IPO
Source: Bloomberg (22 April 2008)
NB: the data above has been manipulated by the analyst for comparison purposes.
Source: MasterCard, 10-K (21 February 2008) SEC Website. The adjustments have been made by the author for analytical purposes and do not form part of MasterCard’s 10-K form.
Assumptions:* MasterCard’s financials exclude charitable contributions of $20 million in 2007 and $414.8 million in 2006; and excludes litigation settlements of $3.4 million in 2007 and $24.9 million in 2006.
DisclaimerNo representation or warranty is given as to the accuracy or completeness of this information. Consequently any person acting on it does so entirely at their own risk. The research does not have regard to the specific investment objectives, financial situation and needs of any specific person who may receive it. It has not been prepared in accordance with legal requirements designed to promote the independence of investment research and as such is considered to be a marketing communication. Although we are not specifically constrained from dealing ahead of our recommendations we do not seek to take advantage of them before they are provided to our clients. IG Index is authorised and regulated by the Financial Services Authority (FSA No: 114059).


