Virtual Reality Simulations of Wild Fire Prevention policies.
33
Virtual Reality Simulations of Wild Fire Prevention policies
-
date post
22-Dec-2015 -
Category
Documents
-
view
216 -
download
0
Transcript of Virtual Reality Simulations of Wild Fire Prevention policies.

Virtual Reality Simulations of Wild Fire Prevention policies

Virtual Field Experiments
Virtual Experiments and Environmental PolicyAn Application to Valuation of Wild Fire
Prevention Stephen M. Fiore, Glenn W. Harrison
Charles E. Hughes, E. Elisabet Rutström
The University of Central Florida

Empirical Approaches
• Field data – little control, many unobservables• Lab Experiments – high control, fewer un-
observables• Field Experiments using artefactual tasks • Field Experiments using natural tasks – • Natural Experiments – control, observability,
natural task, natural environment• Virtual Experiments – more control,
observability, natural task, natural environment

Virtual Experiment
• Power of laboratory control and cognitive relevance of field task
• Representation of field task using Virtual Reality computer rendering
• Replicability – larger sample
• Sample selection control - not restricted to participants who self select into environment

Policy Question: Valuation of policies to reduce risk of wild fires
• Florida has 5,000 wild fires each year• Wild fire season is March – June• 1998 were unusually severe
– Following a climate pattern of El Nino – La Nina similar to this year• 340 homes at $59,000 • 500 million acres of timber land at 1,000 per acre• Health cost (asthma)• Traffic accidents due to smoke• Lost tourism revenues• Total 1998 estimated cost: $448 million• Compare to 2006-7 beach restorations due to hurricane damage at
$80 million• State budget about $65 billion

Wild Fire Prevention
• Mechanical Clearing• Chemical Treatment• Prescribed burn• Latter is lower cost and better at preserving
species habitats• Stigma – risk of causing wild fires, displeasing
aesthetic effects• $25 per acre• ½ million acres treated each year in Florida• 4% of all forested acreage

Experiment
• Like Lottery choice but with realistic setting• Choice between a riskier and a safer option
– Riskier option – no additional fire prevention– Safer – costly prescribed burns as prevention
• Presentation of task:– Virtual rendering of both options
• Visual, dynamic, stochastic
– Simulation of fire spread using scientifically consistent model - Farsite

Standard lottery choice – Multiple Price List


Pilot Experiment
• Choice between – costly expansion of prescribed burn as fire prevention– no expansion
• Ashley National Forest in Utah– GIS data on topography and vegetation / fire fuel
• Stochastic environment:– Weather, wind, fuel moisture, lightning location
• 96 possible fire scenarios– 48 for each of the prescribed burn choices– High or low fuel loads

Multiple Price ListCost in $ Prescribed Burn
2 Yes No
4 Yes No
6 Yes No
8 Yes No
10 Yes No
12 Yes No
14 Yes No
16 Yes No
18 Yes No
20 Yes No

Pilot Experiment Task
• Assigned a house as their own
• Given initial credit of $80
• Damage to house by simulated fire is -$59
• Cost of prescribed burn ($0 - $20)
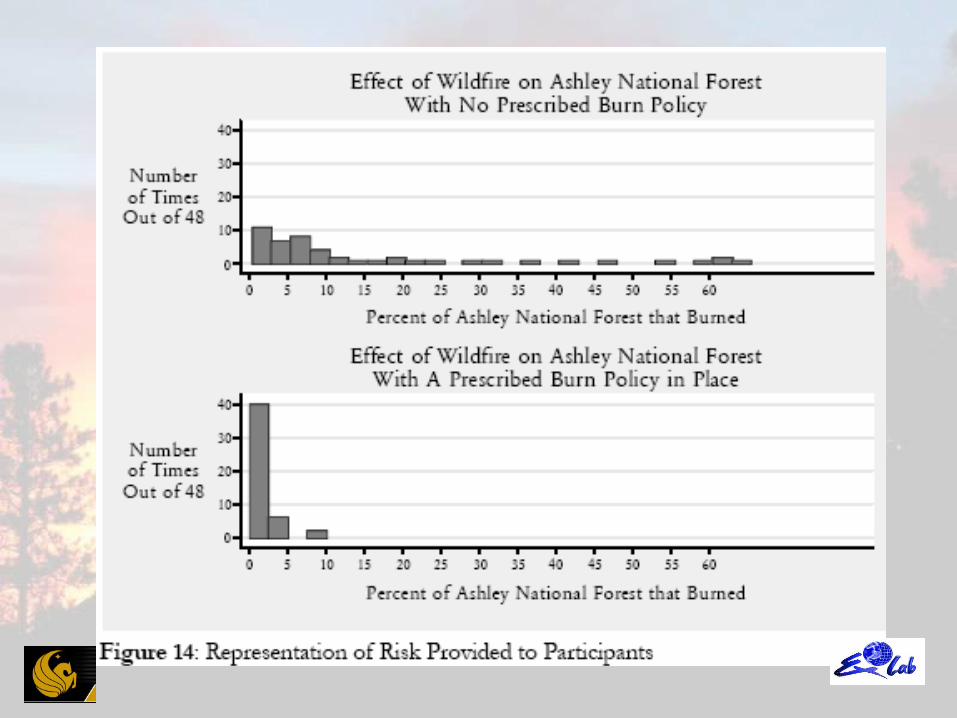

Risk to private house?
• Subjective risk perception formed through information on total acreage burned
• And through experience in 4 scenarios– High fuel load and severe weather
• 65% of Ashley burns including house
– High fuel load and benign weather• 9.5% of Ashley burns but not house
– Low fuel load and severe weather• 9% of Ashley burns including house
– Low fuel load and benign weather• 1% of Ashley burns but not house
• These scenarios are explored actively, not passively• Moving in 3D plus time

Procedures• Demographic Questionnaire• Training and paid test in navigation of VR environment• Written instructions about wild fires, the simulations, and their task• Experience in the 4 scenarios• Choice of prevention – Yes or No and if yes at what cost?
– 10 sided dice• Implement prevention choice as low or high fuel load
– Random determination of weather, wind, fuel moisture, duration, and ignition location using dice
• Did house burn?• Presence questionnaire• Questionnaire on previous game and fire experiences• Holt and Laury style risk attitude elicitation in independent task

Pilot Data
• 12 subjects– 5 males, 7 females– Ages 18 – 57– 6 had played video games before (all of the
males plus the youngest female)
• Average WTP for prescribed burn $12 - $14 (row 6-7)
• Average number of safe lottery choices in HL lottery: 4.5 (CRRA approx 0.4)

True probabilities and RN prediction
Risk averse subjects would switch on even higher row

Proportion of acreage burnt as estimate for probability
Risk averse subjects would switch on even higher row

Actual choices
• Modal PB choice is row 6 (WTP=$12)• Consistent with true probability of house burning
and Risk Neutrality• BUT – 9 of the subjects are somewhat risk
averse• WTP of $12 plus risk aversion jointly implies that
the perceived probability of house burning is less than the true one
• Closer to the probability calculated as the proportion of acreage burnt


How good is VR?
• What is the distinction between a synthetic world and the actual world?
• Our experiences of the actual world are to a large extent synthetic –– Sensorial updating is incomplete– The mind simulates “the blanks”
• Rendering of synthetic worlds can exploit this functioning of the mind
• VR technologies differ in how immersive they are• Temporal coordination of sensory experiences and
actions/reactions more important than graphical quality
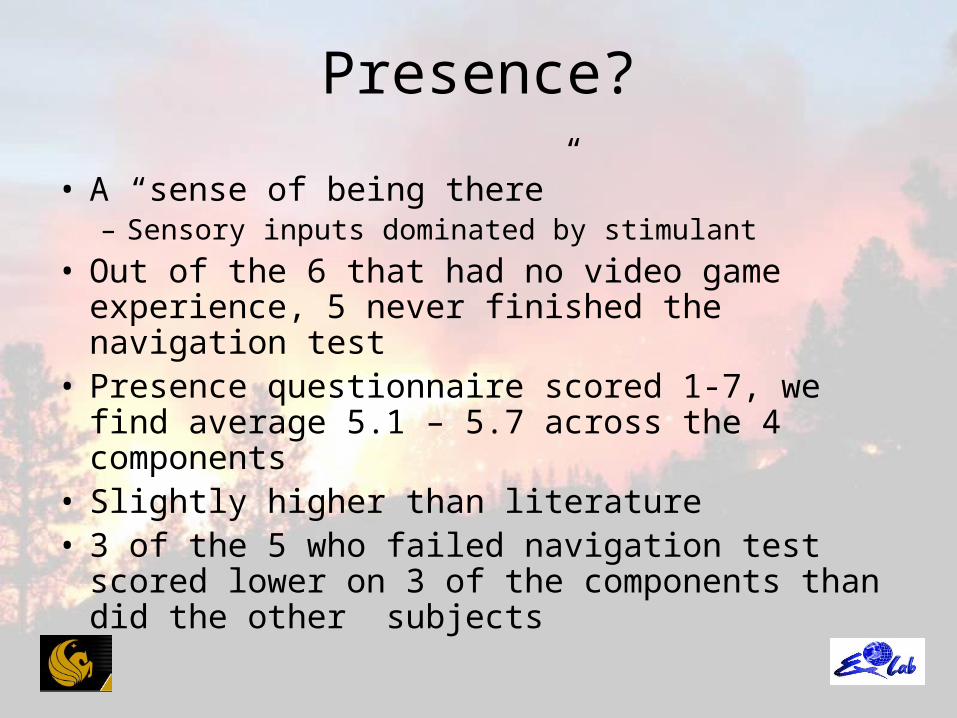
Presence?
• A “sense of being there”– Sensory inputs dominated by stimulant
• Out of the 6 that had no video game experience, 5 never finished the navigation test
• Presence questionnaire scored 1-7, we find average 5.1 – 5.7 across the 4 components
• Slightly higher than literature• 3 of the 5 who failed navigation test scored lower
on 3 of the components than did the other subjects

Four factors• Involvement:
– How completely were you able to actively survey or search the environment using vision?
– How involved were you in the virtual environment experience?• Adaptation/Immersion:
– Were you able to anticipate what would happen next in response to the actions that you performed?
– How quickly did you adjust to the virtual environment experience?
– How completely were your senses engaged in this experience? • Sensory Fidelity:
– How closely were you able to examine objects?• Interface Quality:
– How much delay did you experience between your actions and expected outcomes?
– How much did the visual display quality interfere or distract you from performing assigned tasks or required activities?

Conclusions from Pilot
• VX shows potential as an experimental environment that can provide field cues in controlled contexts
• By controlling for risk attitudes one can infer risk perceptions (latent beliefs)
• Or by inducing perceptions one can estimate risk attitudes in the presence of field cues

Broader Questions
• Will responses differ from those using standard Contingent Valuation Methods?– Text and pictures– Hypothetical consequence to decisions
• Will responses of lay people and experts be more similar in VR setting than in CVM setting?– Can simulation experiences serve as
substitute for field experience?