
Vignalietal Supinfo 1
12
Supplementary Material: Read assignment and analysis: FASTQ files were processed using the R software package ‘DuffyRNAseq’ (available at http://duffyrnaseq.sourceforge.net/), which implements a multistep read assignment and analysis pipeline built around the Bowtie algorithm (1). All pipeline steps used the following Bowtie alignment arguments: (-n 2 -l 26 -e 75). The flowchart of the analysis is diagrammed in Supplementary Figure 1. The first step (Prefiltering) aligns all reads to an ‘globin/rRNA’ index of human globin and human and parasite rRNA sequences. Reads that are not prefiltered move on to a second step, in which they are aligned against a combined ‘genomic’ index containing the Homo sapiens (hg19 assembly) and P. falciparum (3D7 strain, v6.4) genomes downloaded from the UCSC Genome Browser (2) and PlasmoDB (3), respectively. Reads not assigned in this step move on to the next stage, in which they are aligned against a ‘splice detection’ index of possible theoretical splices for each gene, using exons defined in RefSeq (hg19 assembly) (2) and PlasmoDB (v6.4) (3), for human and parasite genes, respectively. At each step in the pipeline, assigned reads are categorized as being unique, having 2 to 30 matches, or having more than 30 matches. Prefiltered reads and those with more than 30 matches are excluded from further analysis. Reads that align to the genomic or splicing indexes with 1 to 30 matches are converted to WIG files for downstream visualization in the UCSD Genome Browser (4), and are carried forward to the transcription and differential expression steps of the pipeline. Reads not captured in any of the steps described above are classified as unaligned, and further analyzed to determine if they match genomic sequences from other P. falciparum strains obtained from the Broad Institute (5) and the Wellcome Trust Sanger Institute (6), variant surface antigen sequences from VarDB.org (7), oligonucleotides used for library construction, homopolymers, or the genomes of possible contaminants (such as E. coli and Mycoplasma spp.). The analysis pipeline partitions each genome into fixed-width bins to capture read counts along both strands of both genomes at high resolution, instead of counting read assignments by gene. We used 100 nt bins for P. falciparum and 250 nt bins for H. sapiens. Each uniquely assigned read is added to its strand-specific bin. Reads that overlap two bins are allocated proportionally, based on the number of bases covering each bin. Each assigned read with 2 to 30 matches is tallied in a separate parallel set of ‘Multi-Hit’ bins, with its count fractionally allocated among all match site genomic bins. This data structure provides a method of quantifying read depth for each strand along the entire length of multiple genomes, while being flexible regarding the inclusion or exclusion of non-unique reads in downstream calculations. Transcript levels are measured as the sum of all exon bins from the coding strand for each gene, expressed in RPKM (Reads Per Kilobase per Million assigned reads) units (8). Differential expression for each gene is measured as the fold change difference in RPKM values between two samples, with p-values derived from the complementary error function of the absolute deviation in RPKM values (9). Estimation of cell cycle progression Using published transcriptional expression profiles (10, 11), we developed two algorithms that estimate the contribution of different cell-cycle stages to the observed transcriptome of a sample of unknown stage composition (Morrison et al., unpublished). Each of them seeks to estimate a different metric of cell cycle progression. The first algorithm calculates the most likely Hours Post Invasion (HPI) of a sample, using the published transcriptional expression profiles corresponding to every hour of the 48-hour intraerythrocytic cycle for in vitro cultured P. falciparum (10) as a reference dataset for the HPI calculation. In brief, the absolute magnitude difference in expression over the 48-hour intraerythrocytic cycle is calculated for all genes in the reference dataset, and genes are sorted by this criteria in order to identify the parasite genes whose expression varies the most (top HPI marker genes). Vignali et al., Suppementary Information, p. 1
Transcript of Vignalietal Supinfo 1
Supplementary Material:
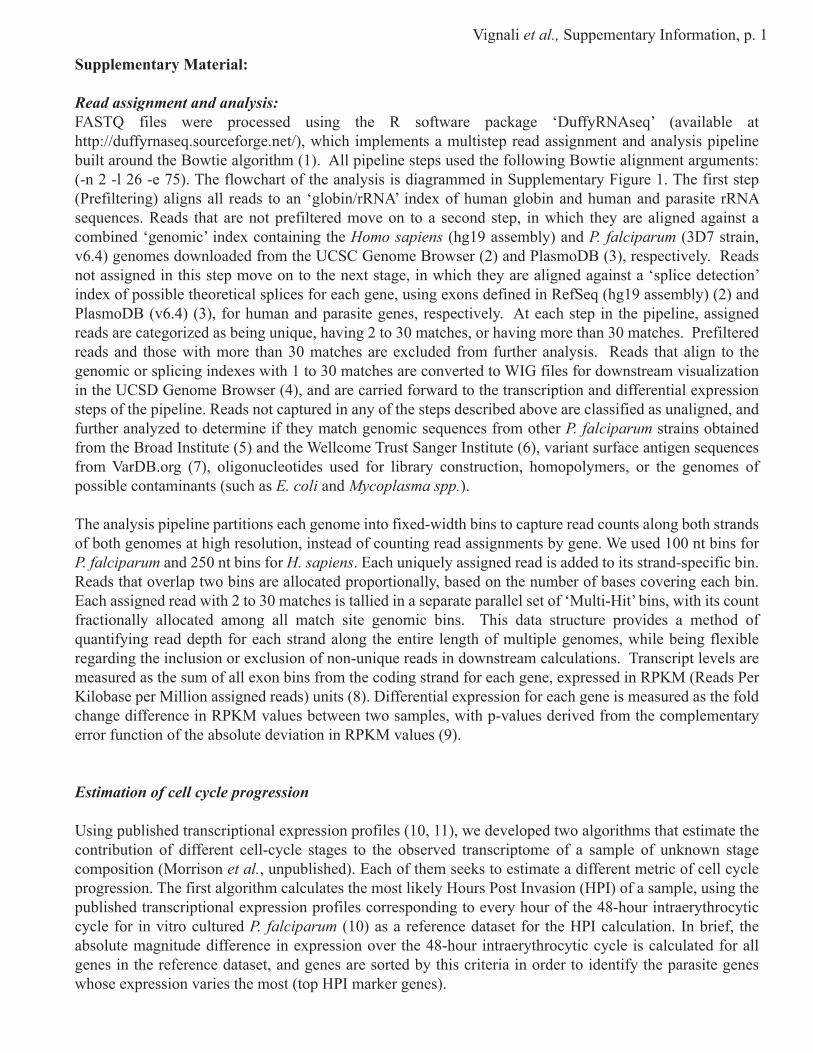
Read assignment and analysis:FASTQ files were processed using the R software package ‘DuffyRNAseq’ (available at http://duffyrnaseq.sourceforge.net/), which implements a multistep read assignment and analysis pipeline built around the Bowtie algorithm (1). All pipeline steps used the following Bowtie alignment arguments: (-n 2 -l 26 -e 75). The flowchart of the analysis is diagrammed in Supplementary Figure 1. The first step (Prefiltering) aligns all reads to an ‘globin/rRNA’ index of human globin and human and parasite rRNA sequences. Reads that are not prefiltered move on to a second step, in which they are aligned against a combined ‘genomic’ index containing the Homo sapiens (hg19 assembly) and P. falciparum (3D7 strain, v6.4) genomes downloaded from the UCSC Genome Browser (2) and PlasmoDB (3), respectively. Reads not assigned in this step move on to the next stage, in which they are aligned against a ‘splice detection’ index of possible theoretical splices for each gene, using exons defined in RefSeq (hg19 assembly) (2) and PlasmoDB (v6.4) (3), for human and parasite genes, respectively. At each step in the pipeline, assigned reads are categorized as being unique, having 2 to 30 matches, or having more than 30 matches. Prefiltered reads and those with more than 30 matches are excluded from further analysis. Reads that align to the genomic or splicing indexes with 1 to 30 matches are converted to WIG files for downstream visualization in the UCSD Genome Browser (4), and are carried forward to the transcription and differential expression steps of the pipeline. Reads not captured in any of the steps described above are classified as unaligned, and further analyzed to determine if they match genomic sequences from other P. falciparum strains obtained from the Broad Institute (5) and the Wellcome Trust Sanger Institute (6), variant surface antigen sequences from VarDB.org (7), oligonucleotides used for library construction, homopolymers, or the genomes of possible contaminants (such as E. coli and Mycoplasma spp.).
The analysis pipeline partitions each genome into fixed-width bins to capture read counts along both strands of both genomes at high resolution, instead of counting read assignments by gene. We used 100 nt bins for P. falciparum and 250 nt bins for H. sapiens. Each uniquely assigned read is added to its strand-specific bin. Reads that overlap two bins are allocated proportionally, based on the number of bases covering each bin. Each assigned read with 2 to 30 matches is tallied in a separate parallel set of ‘Multi-Hit’ bins, with its count fractionally allocated among all match site genomic bins. This data structure provides a method of quantifying read depth for each strand along the entire length of multiple genomes, while being flexible regarding the inclusion or exclusion of non-unique reads in downstream calculations. Transcript levels are measured as the sum of all exon bins from the coding strand for each gene, expressed in RPKM (Reads Per Kilobase per Million assigned reads) units (8). Differential expression for each gene is measured as the fold change difference in RPKM values between two samples, with p-values derived from the complementary error function of the absolute deviation in RPKM values (9).
Estimation of cell cycle progression
Using published transcriptional expression profiles (10, 11), we developed two algorithms that estimate the contribution of different cell-cycle stages to the observed transcriptome of a sample of unknown stage composition (Morrison et al., unpublished). Each of them seeks to estimate a different metric of cell cycle progression. The first algorithm calculates the most likely Hours Post Invasion (HPI) of a sample, using the published transcriptional expression profiles corresponding to every hour of the 48-hour intraerythrocytic cycle for in vitro cultured P. falciparum (10) as a reference dataset for the HPI calculation. In brief, the absolute magnitude difference in expression over the 48-hour intraerythrocytic cycle is calculated for all genes in the reference dataset, and genes are sorted by this criteria in order to identify the parasite genes whose expression varies the most (top HPI marker genes).
Vignali et al., Suppementary Information, p. 1
Vignali et al., Supplementary Information, p. 2
Four subsets (N=100, 250, 500 and 1000) of the most variable genes are selected from this list. For each of these subsets, the expression of the corresponding top HPI marker genes in the sample of unknown stage composition are log-transformed, and compared to the log transform of the same subset of genes for every hour timepoint in the reference dataset, using Pearson’s Correlation Coefficient R. The results for the 4 gene subsets are combined to yield a score for each HPI, and the timepoint with the best score is selected as the best estimate of the HPI for the sample of unknown stage compositions.
The second algorithm seeks to address the complexity of unsynchronized mixed parasite cultures and field samples, by modeling the unknown sample as a combination of multiple cell cycle stages instead of attempting to assign a single time point. Using published P. falciparum transcriptional expression profiles (11), a reference library of 9 distinct cell cycle normalized transcriptomes was generated, covering sporozoite, merozoite, early and late ring, early and late trophozoite, early and late schizont, and gametocyte stages. From this library, each gene in P. falciparum is modeled as a k-tuple, to quantify the relative contribution of the expression profile of that gene to each of the 9 stages. To estimate the contribution of the different stages to the transcriptional profile of a sample of unknown stage composition, its gene expression values are input into the model, and the algorithm calculates the projection of that sample onto all 9 stages defined above. The final result is a histogram of expression over all cell cycle stages, where peaks indicate the dominant cell cycle stages.
trim 4 nt from 5’ end
prealign to ‘globin/rRNA’ index
no match
36-mer reads
match to human or parasite seqs.
2-30 alignments
rRNA/globin match
no match
align to ‘genomic’ indexmatch to human or parasite seqs. 1 alignment
align to ‘splice detection’ index
match to human or parasite seqs. >30 alignments
unalignedno match
Supplementary Figure 1: Flowchart of the bioinformatic analysis pipeline. After 36-mer Illumina reads were trimmed to remove the first 4 nucleotides, we used the Bowtie algorithm (1) with custom parameters that allow about 2 mismatches per read to consecutively align the resulting 32-mers to a ‘globin/rRNA’ index, a ‘genomic’ index, and a ‘splice detection’ index (see above). Reads that aligned to the ‘genomic’ or ‘splice detection’ indexes were assigned to three groups depending on the number of matches to parasite and/or human sequences (1, 2-30 or >30). Reads that were not captured in any of these steps were classified as unaligned.
Vignali et al., Supplementary Information, p. 3
2,906,500 |
PFA0130c
B
A
PFA0110w PFA0115wPFA0120c
PFA0125wGenes
115,000 | 120,000 |110,000 |105,000 |
Rea
d C
over
age
(+ s
trand
)R
ead
Cov
erag
e (-
stra
nd)
chr. 1
MerozoiteLate Schizont
Early SchizontLate Trophozoite
Early TrophozoiteLate Ring
Early Ring
500 -
500 -1 -
1 -
chr. 14 2,905,500 | 2,906,000 |
Rea
d C
over
age
(- st
rand
)
PF14_0678
200-
1 -
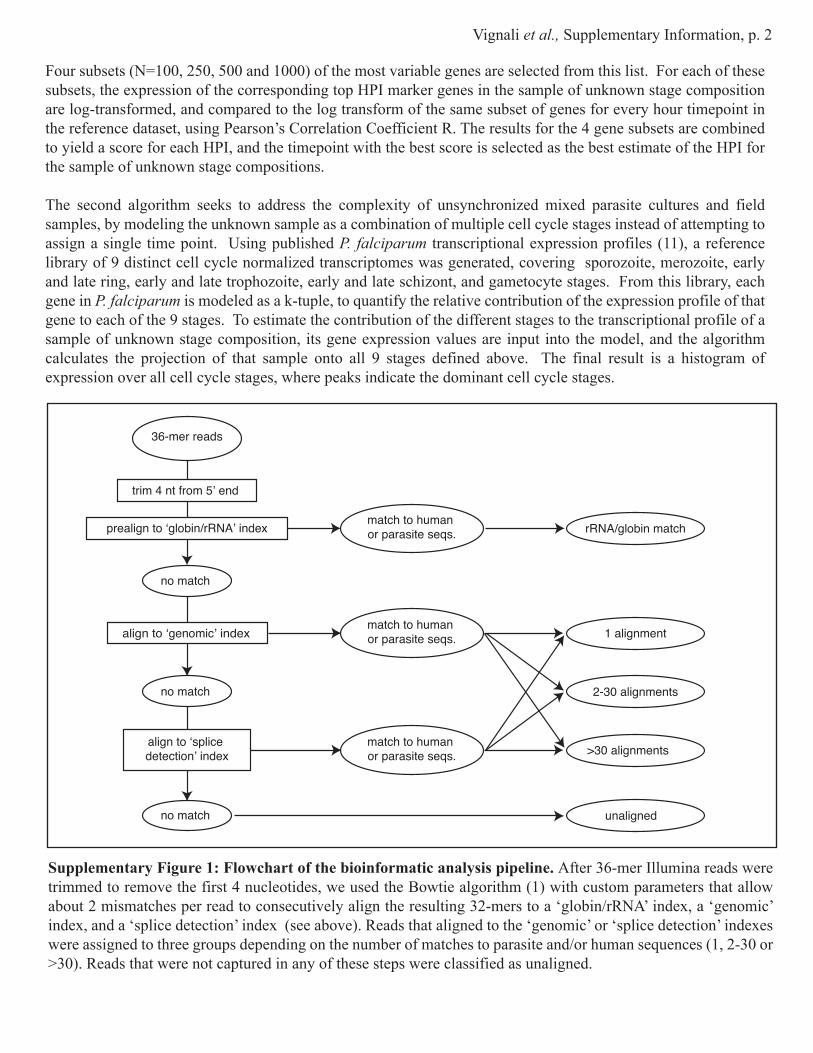
Supplementary Figure 2: Snapshot of important features of the dataset. The images were obtained by uploading NSR-seq data from the unsynchronized P. falciparum reference strain 3D7 sample into the UCSC Genome Browser from the Ares Laboratory (4). (A) A typical view of a randomly chosen genomic region is depicted, showing that the majority of the assigned reads match the coding strand of predicted genes, and that very low background levels are detected in the non-coding strand of predicted genes and in intergenic regions. The chromosome number and coordinates of the genomic region displayed are shown on top of the figure, which includes raw read coverage for the + and – strand as indicated. Gene models are from PlasmoDB (version 6.4) (3). Genes encoded in the - strand are indicated by arrowheads pointing towards the left. The bottom panel shows that the number of reads received by parasite genes is comparable to expression values obtained by microarray for different stages of intraerythrocytic parasite development (12). (B) Finer scale coverage across the length of a gene with multiple exons, in this example PF14_0678.
PFA0130c

Vignali et al., Supplementary Information, p. 4
C D
MAL7P1.231 MAL7P1.228
Rea
d C
over
age
(1 m
atch
, + s
trand
)R
ead
Cov
erag
e (2
-30
mat
ches
, + s
trand
)chr. 7 100,000 | 108,000 |//
500-
1 -500-
1 -
E
Rea
d C
over
age
(- st
rand
)
200-
1 -
PFD0315c
Rea
d C
over
age
(+ s
trand
)
PFB0120w
500-
1 -
336,500 | 128,500 |chr. 4 chr. 2
Rea
d C
over
age
(+ s
trand
) 200-
1 -
3,250,000 |chr. 14
Predicted exons
724,700 | 725,000 | 725,300 | 724,600 |chr. 5exon 2
exon 1
PFE0865c
Exoniphy
F
200-
1 -
Rea
d C
over
age
(- st
rand
)
Supplementary Figure 2 (continued): (C) Depending on the uniqueness of their sequence, some genes receive only unambiguously aligned reads, while other genes receive many reads that also map to other genomic locations, including different coordinates within the same gene. For example, heat shock protein 70 (hsp70/MAL7P1.228) receives almost exclusively reads with a single match, while histidine-rich protein II (HRPII/MAL7P1.231) receives many reads with 2 to 30 matches, in agreement with the abundance of low complexity regions in its sequence. (D) Examples of reads in the 3’ UTR regions of predicted genes. (E) An example of reads that suggest a novel gene in chromosome 14, which was also identified by Otto et al. (13) and agree with ExoniPhy (14) predictions (in green). (F) An example of reads that support modification of gene models. Our reads agree with Exoniphy predictions suggesting that exon 1 of putative splicing factor PFE0865c should extend into the sequence of the intron predicted in the 5.5 version of the P. falciparum genome, as modified in more recent genome annotations (3).

Vignali et al., Supplementary Information, p. 5
Supplementary Figure 3: Evaluation of the ability of NSR oligonucleotides to amplify P. falciparum genes. (A) Theoretical calculation of number of Hexamer Binding Sites (HBS) per 100bp present in P. falciparum protein-coding genes for the NSR oligonucleotide set used in this study. Parasite genes were classified into different bins based on the number of HBS per 100bp of exonic sequence. The graph indicates how many genes were included in each of those categories. (B) Same calculation as in (A) but using a reduced set of NSR that also excludes hexamers with perfect matches to P. falciparum 18S and 28S rRNA. (C) Comparison of gene abundance in in vitro cultured P. falciparum reference strain 3D7 as determined by the NSR-seq approach (NSR, this study) and standard RNA-seq (NMC, (16)). Raw gene expression values were normalized as described (8). (D) Comparison of gene abundance in the NSR dataset and the Affinity Depletion/Exonuclease study (ADE, (13)).
C
A B
0
500
1000
1500
2000
2500
3000
3500
Num
ber o
f Gen
es
0 1 2 69
794
3203
1315
420-5 5-10 10-15 15-20 20-25 25-30 30-35 35+
Number of HBS per 100 bp
0-5
3225
0
500
1000
1500
2000
2500
3000
3500
Num
ber o
f Gen
es
5-10 10-15 15-20 20-25 25-30 30-35 35+
Number of HBS per 100 bp
2084
14 3 0 0 0 0
D
1x10
11x
102
1x10
31x
104
1x10
5
NMC gene abundance (RPKM)
NSR
gen
e ab
unda
nce
(RPK
M)
1x101 1x10² 1x10³ 1x10⁴ 1x10⁵
1x10
11x
102
1x10
31x
104
1x10
5N
SR g
ene
abun
danc
e (R
PKM
)
1x101 1x10² 1x10³ 1x10⁴ 1x10⁵
ADE gene abundance (RPKM)

Vignali et al., Supplementary Information, p. 6
ESc
ore
(com
bine
d R
val
ue)
0
0.2
0.4
0.6
0.8
1.0
Intraerythrocytic cycle (HPI)
0 10 20 30 40
NSRNMCADE
F
Perc
ent o
f Tot
al G
ene
Inte
nsity
0
5
10
15
20
Spor
ozoi
te
Mer
ozoi
te
Early
Rin
g
Late
Rin
g
Early
Tro
phoz
oite
Late
Tro
phoz
oite
Early
Sch
izon
t
Late
Sch
izon
t
Gam
etoc
yte
NSRNMCADE
Supplementary Figure 3 (continued): (E) Estimate of intraerythrocytic cycle progression of the NSR, NMC and ADE samples, as measured in hours post-invasion (HPI), based on comparison of their transcriptional profile to IEC time-course microarray data (10). The Y axis score is based on the combined R value for all genes used in the analysis. (F) Estimate of stage composition of the NSR, NMC and ADE samples, based on comparison of their transcriptional profile to microarray data from multiple life-cycle stages (11).

Vignali et al., Supplementary Information, p. 7
A B
105000 110000 115000 120000 125000Chromosome Position ( Bases)
Rea
d C
ount
600
1200
1800
2400
3000
105000 110000 115000 120000 125000Chromosome Position ( Bases)
Rea
d C
ount
80
160
240
320
400
105000 110000 115000 120000 125000Chromosome Position ( Bases)
Rea
d C
ount
8
16
24
32
40
Rea
d C
ount
1200
2400
3600
4800
6000
Rea
d C
ount
800
1600
2400
3200
4000
PFB0100c PFB0105c PFB0106c PFB0110w PFB0115w PFB0100c PFB0105c PFB0106c PFB0110w PFB0115w
PFB0100c PFB0105c PFB0106c PFB0110w PFB0115wPFB0100c PFB0105c PFB0106c PFB0110w PFB0115w
PFB0100c PFB0105c PFB0106c PFB0110w PFB0115w
105000 110000 115000 120000 125000Chromosome Position ( Bases)
105000 110000 115000 120000 125000Chromosome Position ( Bases)
Supplementary Figure 4: Comparison of gene coverage by the different RNA-seq approaches. (A) The figure shows the number of reads received per 100bp genomic bin in the in vitro cultured P. falciparum reference strain 3D7 sanples analyzed in the NSR (top panel, this work), ADE (middle panel, (13)) or NMC (bottom panel, (16)) datasets. The Y-axis values correspond to the raw number of reads received by each 100bp bin, and numbers on the X-axis correspond to genomic coordinates along the chromosome. Reads from the coding strand and non-coding strand are indicated in red and blue, respectively. Black boxes correspond to predicted exons and the intervening white boxes marks the location of introns. The shaded green rectangles indicate the uniqueness of the sequence within the corresponding 100 bp bin in the parasite’s genome, while the red shaded rectangles indicate bins containing sequences also found in the human genome. (B) Coverage of the genomic region depicted in (A) in the maternal (top panel) and children’s (bottom panel) datasets.

Vignali et al., Supplementary Information, p. 8
A
B
Intraerythrocytic cycle (HPI)
0 10 20 30 40
MaternalChildren’s
Scor
e (c
ombi
ned
R v
alue
)
0
0.2
0.4
0.6
0.8
1.0
0
5
10
15
MaternalChildren’s
Perc
ent o
f Tot
al G
ene
Inte
nsity
Spor
ozoi
te
Mer
ozoi
te
Early
Rin
g
Late
Rin
g
Early
Tro
phoz
oite
Late
Tro
phoz
oite
Early
Sch
izon
t
Late
Sch
izon
t
Gam
etoc
yte
Supplementary Figure 5: Comparison of P. falciparum isolates from children and pregnant women. (A) Estimate of IEC progression of the maternal (red) and children’s (green) pools, as measured in hours post-invasion (HPI), based on comparison of their transcriptional profile to the intracerythrocytic time-course microarray data (10) as described above. (B) Estimate of stage composition of the maternal and children's pools, based on comparison of their transcriptional profile to microarray data from multiple life-cycle stages (11).
Vignali et al., Supplementary Information, p. 9
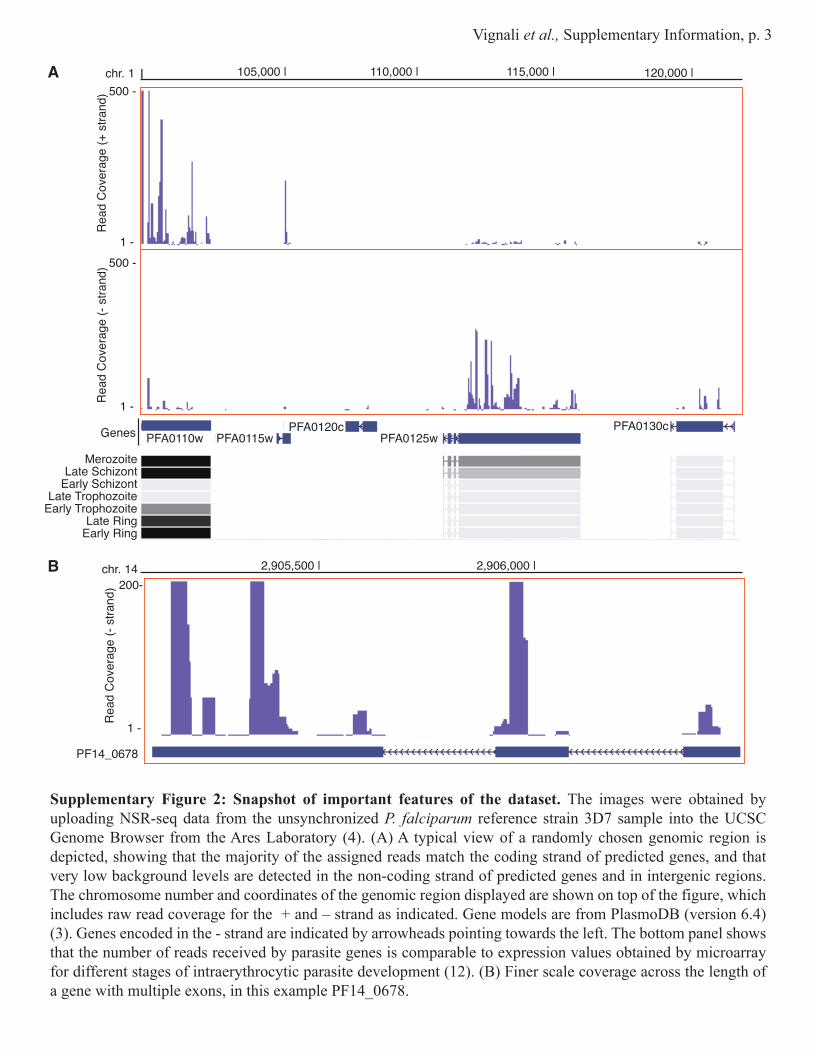
Supplementary Figure 5 (continued): (C) Comparison of abundance of all parasite protein-coding genes in maternal and children's parasites by RNA-Seq by M/A plot. The Y axis corresponds to the log2 ratio of maternal vs. children’s gene expression after normalization by the RPKM method as described (8). The X-axis corresponds to the log2 average RPKM for protein-coding parasite genes. Genes marked with an asterisk correspond to those identified by previous microarray analysis as up-regulated in maternal parasites (17).
Log2
(Rat
io m
ater
nal/c
hild
ren’
s R
PKM
)
Log2 (Average RPKM)
4
-3
-1
0
3
2
1
C
6 8 10 12 14
-2
PFL0030c* PFD1140w*
PFL0050c*MAL13P1.470* PFB0115w*
MAL7P1.214PFI0040c
PFE0495wPF13_0045
PFA0620cPF13_0010
PFC0120wPFE0040c
PFA0700c PF10_0350
PF10_0345PFD0080c
PFE1640wPFL0940c
PF10_0343
PFC0120w
Mann-Whitney p-value =1.00
PFA0070c
Mann-Whitney p-value =0.25
ΔC
T
Children MaternalChildren Maternal
15
10
5
15
10
5
0
20
0
ΔC
T
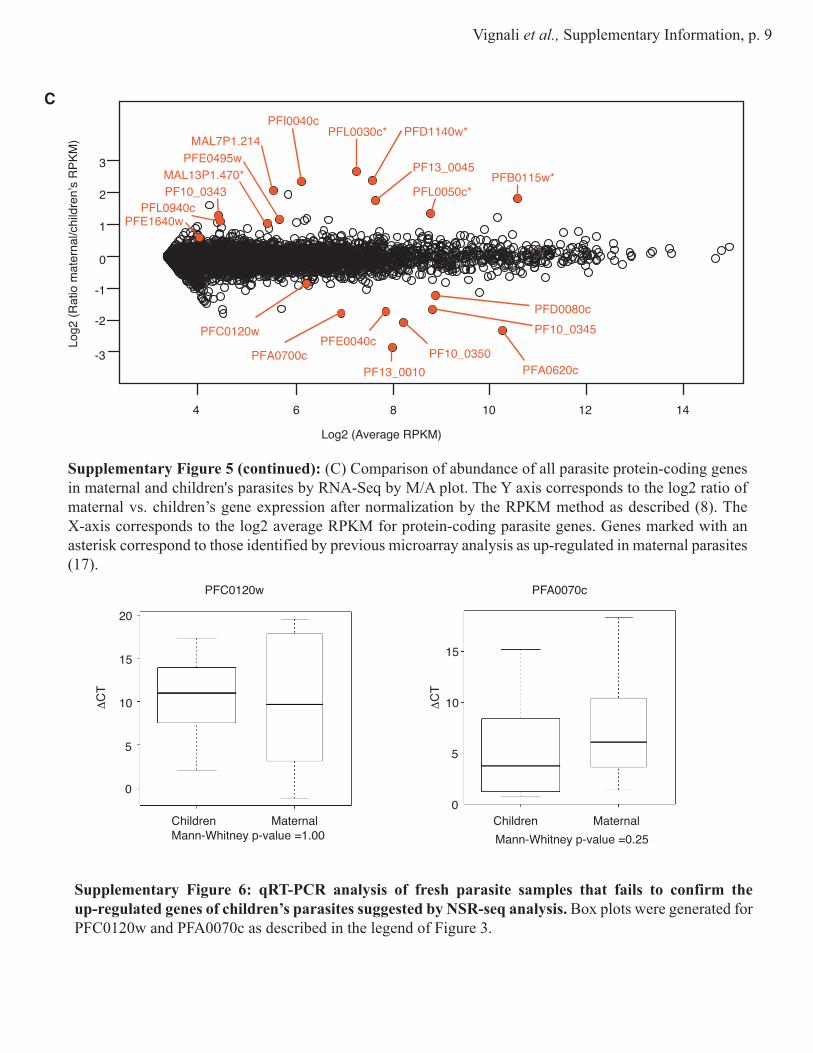
Supplementary Figure 6: qRT-PCR analysis of fresh parasite samples that fails to confirm the up-regulated genes of children’s parasites suggested by NSR-seq analysis. Box plots were generated for PFC0120w and PFA0070c as described in the legend of Figure 3.
Vignali et al., Supplementary Information, p. 10
Legends to Supplementary Tables:
Supplementary Table 1: List of hexamer sequences in the NSR oligonuclotide sets used for library construction. Shown are the hexamer sequences encoded at the 3’ end of the First Strand and Second Strand oligonucleotides used for double stranded cDNA generation.
Supplementary Table 2: Samples used for NSR-seq library construction and qRT-PCR assays. The table lists the 21 samples used for construction of the 4 NSR-seq libraries described in this work (individually or after pooling their RNA), as well as the 18 fresh parasite samples used for qRT-PCR analysis of candidate genes. The amount of total RNA used is indicated for samples used in NSR-seq library construction. The table also shows the percentages of red blood cells in the culture that contained rings, trophozoites and schizonts as evaluated by microscopy.
Supplementary Table 3: Read alignment statistics. For each of the 4 NSR-seq libraries analyzed in this study, the table includes the total number of reads obtained; the number of reads and percentage of total reads corresponding to the prefiltered, aligned and unaligned categories described in the text; and the number of reads, percentage of total reads and percentage of aligned reads for reads with 1, 2 to 30, or more than 30 alignments. For reads with 1 to 30 matches (or ‘Assigned reads’), the table also includes the number of reads, percentage of total reads and percentage of assigned reads with perfect match or 1 mismatch to genome sequences; and the average number of mismatches per aligned read.
Supplementary Table 4: Analysis of unaligned reads. For each of the samples analyzed in this study, the table shows the number of reads, percentage of total reads and percentage of unaligned reads that match the sequences of oligonucleotides used in library construction, sequences of P. falciparum isolates different from reference strain 3D7, sequences of common contaminants (E. coli, Mycoplasma spp. and Acholeplasma spp.), and homopolymeric sequences (polyA, polyC, polyG and polyT).
Supplementary Table 5: Analysis of gene coverage and strand correctness. For each of the samples analyzed in this study, the table shows the number and percentage of genes in the parasite and human genomes that received at least 1, 10 or 100 reads; the number and percentage of unique reads and all assigned reads (i.e. those with less than 30 matches) that matched annotated genes vs. intergenic regions, as well as those that matched the coding vs. the non-coding strand of annotated genes.
Supplementary Table 6: Analysis of species-specificity. For each of the samples analyzed in this study, the table indicates the number, and percentage of total reads and percentage of assigned reads (i.e. those with less than 30 matches) that yielded a single match to P. falciparum or human sequences, as well as those that match multiple sequences within each species and in both species.
Supplementary Table 7: Comparison of read alignment between NSR-seq and other published P. falciparum RNA-seq datasets. For each of the three datasets (NSR, this study), Not-Marched Control (NMC, (16)), and Affinity Depletion/Exonuclease Depletion (ADE, (13)), the table indicates the total number of reads that correspond to pre-filtered, aligned and unaligned reads. The table also includes the number of pre-filtered reads that fall into three non-mutually exclusive categories: those that match human globin, those that match 18S/28S sequences, and those that match other rRNA sequences, as indicated. The percentage of the total reads corresponding to each of these categories is also indicated.
Vignali et al., Supplementary Information, p. 11
Supplementary Table 8: Number of binding sites for NSR-hexamer sequences for P. falciparum genes and normalized gene abundance values in the NSR, NMC and ADE datasets. For each protein coding gene, the table indicates the gene length in base pairs (bp), the number of hexamer binding sites (HBS) in the gene, the number of HBS per 100bp, and the HBS category corresponding to that gene (0-5, 5-10, 10-15, 15-20, 20-25, 25-30, 30-35 and 35+ HBS per 100bp) both for the set of oligonucleotides used in this study (NSR=931), as well as the reduced oligonucleotide set (NSR=410) that also excludes hexamers that align to parasite 18S and 28S rRNA. The last six columns display the normalized number of reads (8) assigned to each protein coding gene in this study (NSR), and the two previously published studies (NMC and ADE, see legend of Supplementary Table 7), both for reads with 1 alignment and for those with 2 to 30 alignments.
Supplementary Table 9: Analysis of coverage of exonic bases in available RNA-Seq datasets for P. falciparum reference strain 3D7. The table includes the number of aligned reads for the NSR, NMC and ADE datasets, and indicates the percentage of exonic bases matched by at least n reads (where n varies from 1 to 11).
Supplementary Table 10: Comparison of expression level for all protein-coding parasite genes in cultured maternal and children’s parasite pools. The table includes a brief description of the gene product and function if known, and the gene expression values in the maternal and children’s pools, normalized as described (8).
Supplementary Table 11: List of genes analyzed by qRT-PCR and oligonucleotides used for their amplification. For each of the 8 genes analyzed by qRT-PCR, the table indicates the corresponding gene product, whether it was identified as up-regulated in maternal or children’s parasites by NSR-Seq, the sequence of the forward and reverse oligonucleotides used for their amplification, and whether they were designed for this study or have been previously published.
Supplementary Table 12: Peptide and spectral count in maternal and children’s field isolates for PFA0620c and PFE0040c. The number of unique peptides and spectra observed for PFA0620c and PFE0040c in each parasite isolate is indicated, as well as the proportion of total spectra collected for that sample corresponding to PFA0620c or PFE0040c. The source of the isolate (child or placenta) is also shown.
Supplementary Table 13: Summary of NSR-Seq, microarray, RT-PCR and proteomics data for the 8 genes up-regulated in children’s parasites by NSR-seq. For each of the genes, the table indicates the corresponding gene product, the number of normalized reads (in RPKM) in the maternal and children’s pools, the Log2 Fold change; the average intensity in maternal and children fresh field isolates previously analyzed by microarray (17) and the Log2 fold; the qRT-PCR results presented in Figures 3 and Supplementary Figure 6, as the ratio of median ΔCt (as compared to control P. falciparum gene seryl-tRNA synthetase/PF07_0073) in children’s vs. maternal samples (where a negative value indicates a higher expression level in the children’s samples); and the proteomics data included in Supplementary Table 12, as the number and % of samples in which peptides for each of the encoded proteins were detected, and the percentage of total peptides in the samples that correspond to each protein listed. P-values are included for all analyses. NT = Not Tested, ND = Not Determined.
Vignali et al., Supplementary Information, p. 12
References cited in the Supplementary Material:
1. Langmead B, Trapnell C, Pop M, Salzberg SL. Ultrafast and memory-efficient alignment of short DNA sequences to the human genome. Genome Biol. 2009;10(3):R25.2. UCSC Genome Browser. http://hgdownload.cse.ucsc.edu/downloads.html#human. Updated February, 2009. Accessed September 15, 2010.3. PlasmoDB. http://www.plasmodb.org/. Updated July 15, 2010. Accessed September 15, 2010.4. Ares Lab Malaria Browser. http://areslab.ucsc.edu/. Updated 2002. Accessed September 15, 2010.5. Broad Institute. http://www.broadinstitute.org/. Updated April 10, 2010. Accessed September 15, 2010.6. Wellcome Trust Sanger Institute. http://www.sanger.ac.uk/. Updated September 1, 2010. Accessed September 15, 2010.7. varDB. http://www.vardb.org/. Updated July 10, 2010. Accessed September 15, 2010.8. Mortazavi A, Williams BA, McCue K, Schaeffer L, Wold B. Mapping and quantifying mammalian transcriptomes by RNA-Seq. Nat Methods. 2008;5(7):621-628.9. Armour CD, Castle JC, Chen R, Babak T, Loerch P, Jackson S, Shah JK, Dey J, Rohl CA, Johnson JM, et al. Digital transcriptome profiling using selective hexamer priming for cDNA synthesis. Nat Methods. 2009;6(9):647-649.10. Bozdech Z, Llinas M, Pulliam BL, Wong ED, Zhu J, DeRisi JL. The transcriptome of the intraerythrocytic developmental cycle of Plasmodium falciparum. PLoS Biol. 2003;1(1):E5.11. Young JA, Fivelman QL, Blair PL, de la Vega P, Le Roch KG, Zhou Y, Carucci DJ, Baker DA, Winzeler EA. The Plasmodium falciparum sexual development transcriptome: a microarray analysis using ontology-based pattern identification. Mol Biochem Parasitol. 2005;143(1):67-79.12. Le Roch KG, Zhou Y, Blair PL, Grainger M, Moch JK, Haynes JD, De La Vega P, Holder AA, Batalov S, Carucci DJ, et al. Discovery of gene function by expression profiling of the malaria parasite life cycle. Science. 2003;301(5639):1503-1508.13. Otto TD, Wilinski D, Assefa S, Keane TM, Sarry LR, Bohme U, Lemieux J, Barrell B, Pain A, Berriman M, et al. New insights into the blood-stage transcriptome of Plasmodium falciparum using RNA-Seq. Mol Microbiol. 2010.14. Siepel A, Haussler D. Computational identification of evolutionarily conserved exons. Published in: Proceedings of the The Eigth Annual International Conference on Research in Computational Molecular Biology, pp 177-186. Bourne P, Gusfield Ds. (Eds). March 27 - 31, 2004. San Diego, CA, USA. 15. Hiller NL, Bhattacharjee S, van Ooij C, Liolios K, Harrison T, Lopez-Estrano C, Haldar K. A host-targeting signal in virulence proteins reveals a secretome in malarial infection. Science. 2004;306(5703):1934-1937.16. Sorber K, Chiu C, Webster D, Dimon M, Ruby JG, Hekele A, DeRisi JL. The long march: a sample preparation technique that enhances contig length and coverage by high-throughput short-read sequencing. PLoS One. 2008;3(10):e3495.17. Francis SE, Malkov VA, Oleinikov AV, Rossnagle E, Wendler JP, Mutabingwa TK, Fried M, Duffy PE. Six genes are preferentially transcribed by the circulating and sequestered forms of Plasmodium falciparum parasites that infect pregnant women. Infect Immun. 2007;75(10):4838-4850.


