· Web viewThe company that makes the cereal claims that a voucher can be found in 20 percent of...
18
AP Statistics Frappy Packet for End-Of-Year Graded Homework Assignments Page | 1 This Frappy Packet Belongs to _______________________________________. 1997-4- Unfortunate Remarks (2Prop) A random sample of 415 potential voters was interviewed 3 weeks before the start of a state-wide campaign for governor; 223 of the 415 said they favored the new candidate over the incumbent. However, the new candidate made several unfortunate remarks one week before the election. Subsequently, a new random sample of 630 potential voters showed that 317 voters favored the new candidate. Do these data support the conclusion that there was a decrease in voter support for the new candidate after the unfortunate remarks were made? Give appropriate statistical evidence to support your answer. Also include a confidence interval and explain how it supports your answer. I. Hypothesis P 1 : True proportion of voters who supported the new candidate before the unfortunate remarks P 2 : True proportion of voters who supported the new candidate after the unfortunate remarks H o : P 1 =P 2 The true proportion of voters who supported the new candidate were the same before and after the remarks. H a : P 1 >P 2 The true proportion of voters supported the new candidate was smaller after the remarks were made. II. Conditions I. P 1 : SRS of independent voters selected np= 223 ≥ 10 nq=415−223=192 ≥ 10 II. P 2 : SRS of independent voters selected np= 317 ≥ 10 nq=630−317=313 ≥ 10 III. Assume the voters polled before the unfortunate remarks are independent of the voters polled after the unfortunate remarks III. 2-Prop Z Test z=1.081722368; p-value= 0.1396879905 IV. Conclusion
Transcript of · Web viewThe company that makes the cereal claims that a voucher can be found in 20 percent of...

AP Statistics Frappy Packet for End-Of-Year Graded Homework AssignmentsP a g e | 1
This Frappy Packet Belongs to _______________________________________.
1997-4- Unfortunate Remarks (2Prop)A random sample of 415 potential voters was interviewed 3 weeks before the start of a state-wide campaign for governor; 223 of the 415 said they favored the new candidate over the incumbent. However, the new candidate made several unfortunate remarks one week before the election. Subsequently, a new random sample of 630 potential voters showed that 317 voters favored the new candidate. Do these data support the conclusion that there was a decrease in voter support for the new candidate after the unfortunate remarks were made? Give appropriate statistical evidence to support your answer. Also include a confidence interval and explain how it supports your answer.
I. Hypothesis
P1: True proportion of voters who supported the new candidate before the unfortunate remarks
P2: True proportion of voters who supported the new candidate after the unfortunate remarks
Ho: P1=P2 The true proportion of voters who supported the new candidate were the same before and after the remarks.
Ha: P1>P2 The true proportion of voters supported the new candidate was smaller after the remarks were made.
II. ConditionsI. P1: SRS of independent voters selected
np=223≥10nq=415−223=192≥10 II. P2: SRS of independent voters selected
np=317≥10nq=630−317=313≥10 III. Assume the voters polled before the unfortunate remarks are independent of the voters polled
after the unfortunate remarks
III. 2-Prop Z Testz=1.081722368; p-value= 0.1396879905
IV. Conclusion
We do not reject Ho because our p=value (.140) is large at any acceptable significance level. We do not have enough evidence to support the claim that the true proportion of voters supported the new candidate was smaller after the remarks were made.
V. Confidence Interval: 2-Prop z-interval(−.0277 , .09603)
AP Statistics Frappy Packet for End-Of-Year Graded Homework AssignmentsP a g e | 2
We are 95% confident that the true difference in proportion of voters who support the new candidate is between 2.77% less and 9.603% more before the unfortunate remarks were made. This supports our conclusion to not reject Ho since 0 is in our confidence interval.
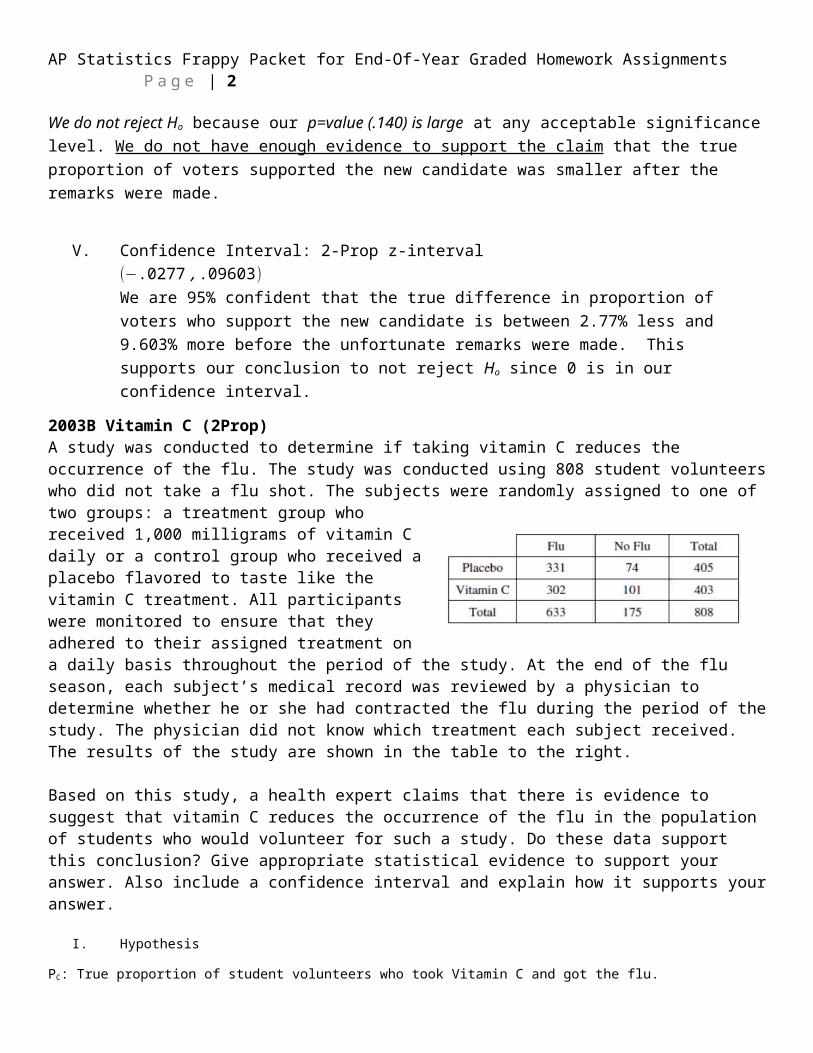
2003B Vitamin C (2Prop)A study was conducted to determine if taking vitamin C reduces the occurrence of the flu. The study was conducted using 808 student volunteers who did not take a flu shot. The subjects were randomly assigned to one of two groups: a treatment group who received 1,000 milligrams of vitamin C daily or a control group who received a placebo flavored to taste like the vitamin C treatment. All participants were monitored to ensure that they adhered to their assigned treatment on a daily basis throughout the period of the study. At the end of the flu season, each subject’s medical record was reviewed by a physician to determine whether he or she had contracted the flu during the period of the study. The physician did not know which treatment each subject received. The results of the study are shown in the table to the right.
Based on this study, a health expert claims that there is evidence to suggest that vitamin C reduces the occurrence of the flu in the population of students who would volunteer for such a study. Do these data support this conclusion? Give appropriate statistical evidence to support your answer. Also include a confidence interval and explain how it supports your answer.
I. Hypothesis
PC: True proportion of student volunteers who took Vitamin C and got the flu.
PP: True proportion of student volunteers who did not take Vitamin C (took a placebo) and got the flu.
Ho: PC=PP The true proportion of students who got the flu were the same whether they took Vitamin C or not.
Ha: PC<PPThe true proportion of student who got took Vitamin C and got the flu was smaller than the true proportion of student who did not take Vitamin C and got the flu.
II. Conditionsa. PC: SRS of independent volunteer students selected np=302≥10 ( got flu )nq=101≥10 (did not get flu)
b. P2: SRS of independent volunteer students selectednp=331≥10 (got flu )nq=74≥10(did not get flu)
c. Students could not be in both groups (taking Vitamin C and not taking Vitamin C)
III. 2-Prop Z Testz=-2.342945031; p-value= 0.0095660811
IV. Conclusion
We reject Ho because our p=value (.0096) is small at any acceptable significance level. We have enough evidence to support the claim that the true proportion of student who got took Vitamin C and got the flu was smaller than the true proportion of student who did not take Vitamin C and got the flu.

AP Statistics Frappy Packet for End-Of-Year Graded Homework AssignmentsP a g e | 3
V. Confidence Interval: 2-Prop z-interval(−.1245 ,−.0113) We are 95% confident that the true difference in proportion of students who took Vitamin C and got the flu was between 12.45% and 1.13% less than students who did not take Vitamin C and got the flu. This supports our conclusion to reject Ho since 0 is not in our confidence interval.
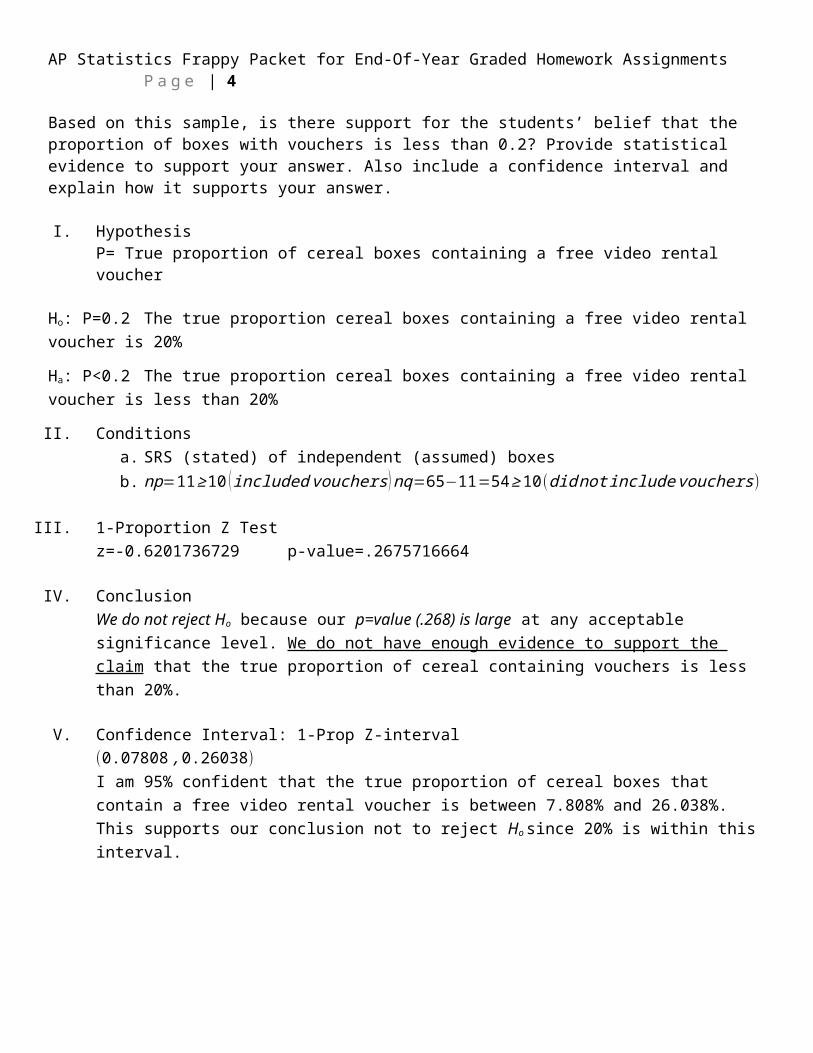
2005-4 Cereal Boxes (1Prop)Some boxes of a certain brand of breakfast cereal include a voucher for a free video rental inside the box. The company that makes the cereal claims that a voucher can be found in 20 percent of the boxes. However, based on their experiences eating this cereal at home, a group of students believes that the proportion of boxes with vouchers is less than 0.2. This group of students purchased 65 boxes of the cereal to investigate the company’s claim. The students found a total of 11 vouchers for free video rentals in the 65 boxes. Suppose it is reasonable to assume that the 65 boxes purchased by the students are a random sample of all boxes of this cereal. Based on this sample, is there support for the students’ belief that the proportion of boxes with vouchers is less than 0.2? Provide statistical evidence to support your answer. Also include a confidence interval and explain how it supports your answer.
I. HypothesisP= True proportion of cereal boxes containing a free video rental voucher
Ho: P=0.2 The true proportion cereal boxes containing a free video rental voucher is 20%
Ha: P<0.2 The true proportion cereal boxes containing a free video rental voucher is less than 20%
II. Conditionsa. SRS (stated) of independent (assumed) boxesb. np=11≥10 (included vouchers )nq=65−11=54≥10(did not includevouchers)
III. 1-Proportion Z Testz=-0.6201736729 p-value=.2675716664
IV. ConclusionWe do not reject Ho because our p=value (.268) is large at any acceptable significance level. We do not have enough evidence to support the claim that the true proportion of cereal containing vouchers is less than 20%.
V. Confidence Interval: 1-Prop Z-interval(0.07808 ,0.26038) I am 95% confident that the true proportion of cereal boxes that contain a free video rental voucher is between 7.808% and 26.038%. This supports our conclusion not to reject Ho since 20% is within this interval.
AP Statistics Frappy Packet for End-Of-Year Graded Homework AssignmentsP a g e | 4
1998-5 Grad Students (1Prop)A large university provides housing for 10 percent of its graduate students to live on campus. The university’s housing office thinks that the percentage of graduate students looking for housing on campus may be more than 10 percent. The housing office decides to survey a random sample of graduate students, and 68 of the 481 respondents say that they are looking for housing on campus. On the basis of the survey data, is there enough evidence for housing office to consider increasing the amount of housing on campus available to graduate students? Give appropriate evidence to support your recommendation. Also include a confidence interval and explain how it supports your answer.
I. HypothesisP= True proportion of graduate students looking for housing on campus
Ho: P=0.1 The true proportion of graduate students looking for housing on campus is 10%
Ha: P>0.1 The true proportion of graduate students looking for housing on campus is more than 10%
II. Conditionsa. SRS (stated) of independent (assumed) graduate studentsb. np=68≥10 ( looking for housing ) nq=481−68=413≥10(are not looking for housing )
III. 1-Proportion Z Testz=3.0245396459 p-value=.0012451283
IV. ConclusionWe reject Ho because our p=value (.0012) is small at any acceptable significance level. We have enough evidence to support the claim that the true proportion of graduate students seeking housing is greater than 10%
V. Confidence Interval: 1-Prop Z-interval(.11024 ,.17251) I am 95% confident that the true proportion of graduate students looking for housing on campus is between 11.024% and 17.251%. This supports our conclusion to reject Ho since 10% is not contained in (and is less than) this interval.

AP Statistics Frappy Packet for End-Of-Year Graded Homework AssignmentsP a g e | 5
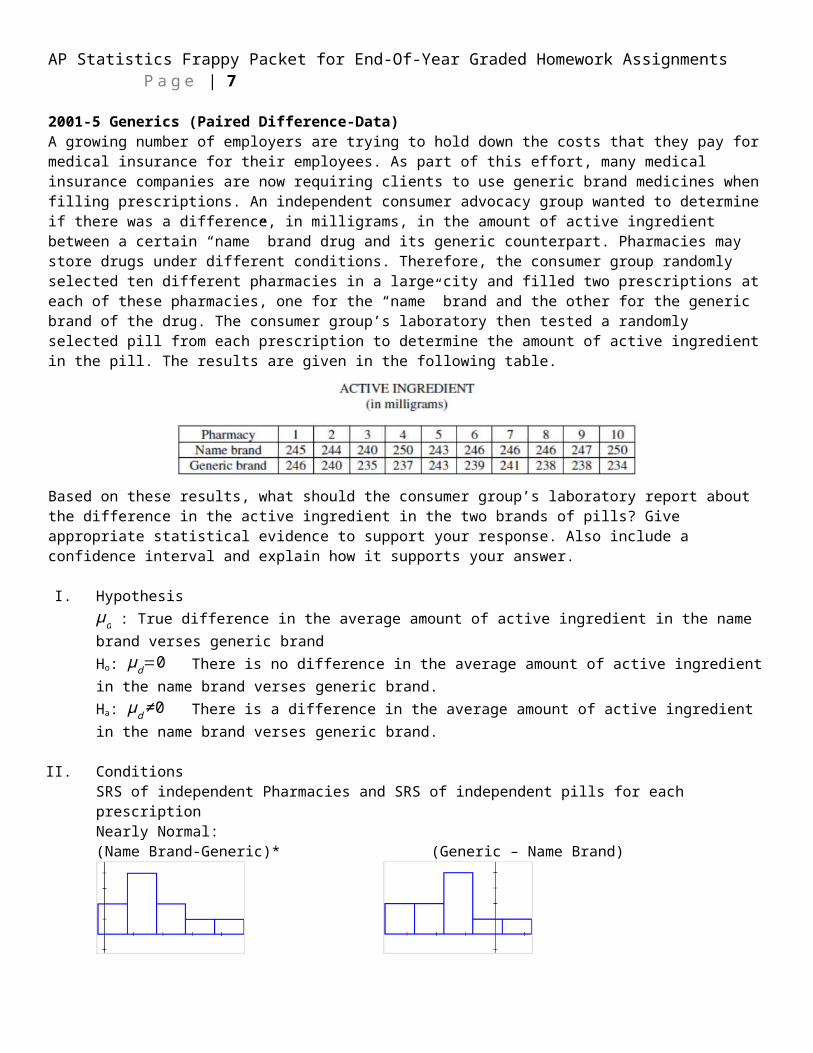
2001-5 Generics (Paired Difference-Data)A growing number of employers are trying to hold down the costs that they pay for medical insurance for their employees. As part of this effort, many medical insurance companies are now requiring clients to use generic brand medicines when filling prescriptions. An independent consumer advocacy group wanted to determine if there was a difference, in milligrams, in the amount of active ingredient between a certain “name” brand drug and its generic counterpart. Pharmacies may store drugs under different conditions. Therefore, the consumer group randomly selected ten different pharmacies in a large city and filled two prescriptions at each of these pharmacies, one for the “name” brand and the other for the generic brand of the drug. The consumer group’s laboratory then tested a randomly selected pill from each prescription to determine the amount of active ingredient in the pill. The results are given in the following table.
Based on these results, what should the consumer group’s laboratory report about the difference in the active ingredient in the two brands of pills? Give appropriate statistical evidence to support your response. Also include a confidence interval and explain how it supports your answer.
I. Hypothesisμd : True difference in the average amount of active ingredient in the name brand verses generic brandHo: μd=0 There is no difference in the average amount of active ingredient in the name brand verses generic brand.Ha: μd≠0 There is a difference in the average amount of active ingredient in the name brand verses generic brand.
II. ConditionsSRS of independent Pharmacies and SRS of independent pills for each prescriptionNearly Normal: (Name Brand-Generic)* (Generic – Name Brand)
III. Paired Difference Test (T-test)t=3.956835797 p-value=.003320146
IV. ConclusionWe reject Ho because our p=value (.0033) is small at any acceptable significance level. We have enough evidence to support the claim that there is a difference in the amount of active ingredient in the name brand verses generic brand.
V. Confidence Interval- T-Interval(2.8267 ,10.373)

AP Statistics Frappy Packet for End-Of-Year Graded Homework AssignmentsP a g e | 6
I am 95% confident that the true difference in means of the active ingredient in generic verses name brand medicine is between 2.8267 and 10.373 milligrams. This supports our conclusion to reject Ho since 0 milligrams is not in our confidence interval.
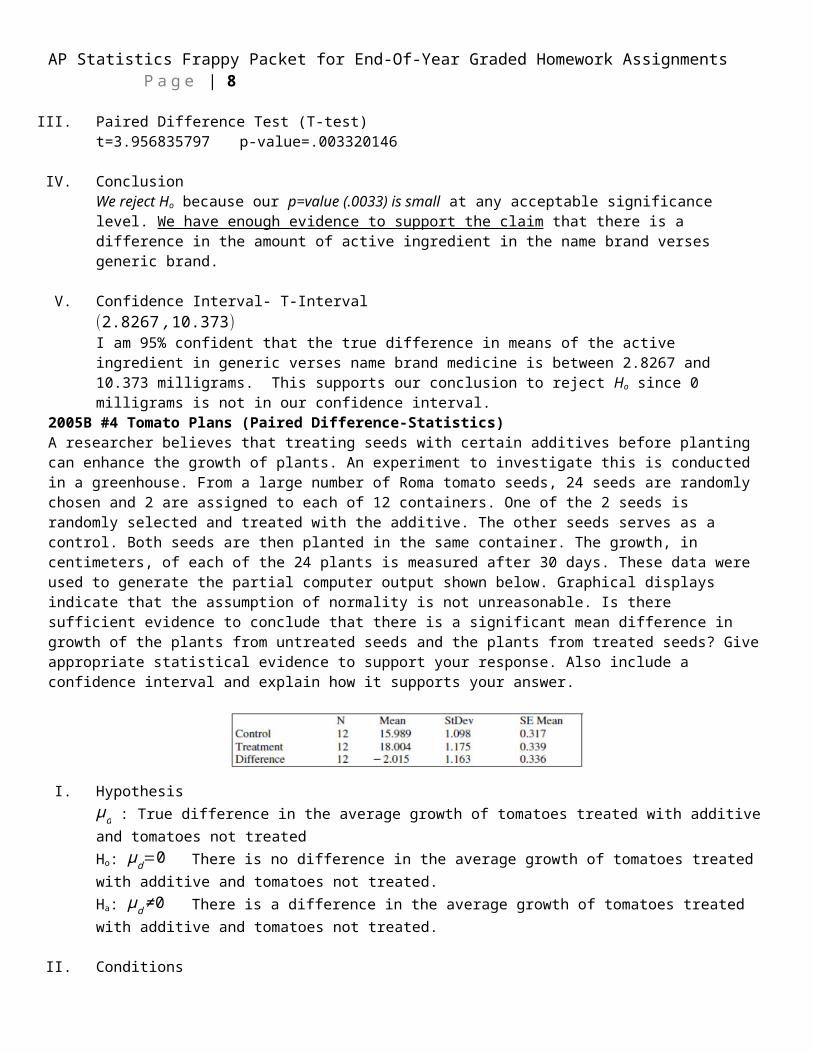
2005B #4 Tomato Plans (Paired Difference-Statistics)A researcher believes that treating seeds with certain additives before planting can enhance the growth of plants. An experiment to investigate this is conducted in a greenhouse. From a large number of Roma tomato seeds, 24 seeds are randomly chosen and 2 are assigned to each of 12 containers. One of the 2 seeds is randomly selected and treated with the additive. The other seeds serves as a control. Both seeds are then planted in the same container. The growth, in centimeters, of each of the 24 plants is measured after 30 days. These data were used to generate the partial computer output shown below. Graphical displays indicate that the assumption of normality is not unreasonable. Is there sufficient evidence to conclude that there is a significant mean difference in growth of the plants from untreated seeds and the plants from treated seeds? Give appropriate statistical evidence to support your response. Also include a confidence interval and explain how it supports your answer.
I. Hypothesisμd : True difference in the average growth of tomatoes treated with additive and tomatoes not treated Ho: μd=0 There is no difference in the average growth of tomatoes treated with additive and tomatoes not treated.Ha: μd≠0 There is a difference in the average growth of tomatoes treated with additive and tomatoes not treated.
II. ConditionsSRS of independent seeds, seed given additive was randomly chosen. Container for each pair of seeds was randomly chosen.Nearly normal condition stated.
III. Paired Difference Test (T-test) t=-6.001861354 p-value=.000089023026
IV. ConclusionWe reject Ho because our p=value (.000089) is very small at any acceptable significance level. We have enough evidence to support the claim that there is a difference in the average growth of tomatoes treated with additive and tomatoes not treated.
V. Confidence Interval- T-Interval(−2.754 ,−1.276) I am 95% confident that the true difference in average growth in tomato plants treated with an additive is between 1.276 cm and 2.754 cm more than those not treated with an additive. This supports our conclusion to reject Ho since 0 cm is not in our confidence interval.
AP Statistics Frappy Packet for End-Of-Year Graded Homework AssignmentsP a g e | 7
AP Statistics Frappy Packet for End-Of-Year Graded Homework AssignmentsP a g e | 8
2006-4 Wait Time (2 Means-Statistics)Patients with heart-attack symptoms arrive at and emergency room either by ambulance or self-transportation provided by themselves, family, or friends. When a patient arrives at the emergency room, the time of arrival is recorded. The time when the patient’s diagnostic treatment begins is also recorded. An administrator of a large hospital wanted to determine whether the mean wait time (time between arrival and diagnostic treatment) for patients with heart-attack symptoms differs according to the mode of transportation.
A random sample of 150 patients with heart-attack symptoms who had reported to the emergency room was selected. For each patient, the mode of transportation and wait time were recorded. Summary statistics for each mode of transportation are show in the table below.
Based on this set of information, is there evidence to support that the average wait time for people who transport themselves to the hospital is different than the average wait time for patients who arrive via ambulance? Give appropriate statistical evidence to support your response. Also include a confidence interval and explain how it supports your answer. Also include a confidence interval and explain how it supports your answer.
I. HypothesisμA= Average wait time for patients transported to the hospital by AmbulanceμS= Average wait time for patients transported to the hospital by Self
H o : μA=μS Average wait time for patients transported to the hospital is the same for either mode of transportationH o : μA≠μS Average wait time for patients transported to the hospital is different for either mode of transportation
II. ConditionsSRS of patients, independent of one anotherNo patient arrived using both methods of transportationn=77≥30 for patients arriving by Ambulance n=73≥30 for patients arriving by Self(Do not need to assume the distribution of wait time for both modes of transportation to be approximately normal since sample is large enough)
III. 2-Sample T-Testt=-2.905892397p-value= .0042566391
IV. Conclusion:We reject Ho because our p=value (.0042566391) is small at any acceptable significance level. We have enough evidence to support the claim that the average wait time for patients transported to the hospital is different depending on the mode of transportation.
V. Confidence interval: 2-Sample T-Interval(−3.798 ,−.77224)

AP Statistics Frappy Packet for End-Of-Year Graded Homework AssignmentsP a g e | 9
I am 95% confident that the true difference in average wait time for patients arriving by ambulance between .77224 and 3.798 minutes less than patients arriving by themselves. This support our conclusion since 0 is not in the interval.
2007B-5 Cholesterol #1 (2 Means-Statistics)A serum cholesterol level above 250 milligrams per deciliter (mg/dl) of blood is a risk factor for cardiovascular disease in humans. At a medical center in St. Louis, a study to test the effectiveness of a new cholesterol lowering drug was conducted. One hundred people with cholesterol levels between 250 mg/dl and 300 mg/dl were available for this study. Fifty people were assigned at random to each of two treatment groups. One group received the standard cholesterol-lowering medication and the other group received the new drug.
After taking the drug for three weeks, the 50 subjects who received the standard treatment had a mean decrease in cholesterol level of 10 mg/dl with a standard deviation of 8 mg/dl, and the 50 subjects who received the new drug had a mean decrease of 18 mg/dl with a standard deviation of 12 mg/dl. Does the new drug appear to be more effective than the standard treatment in lowering mean cholesterol level? Give appropriate statistical evidence to support your conclusion. Also include a confidence interval and explain how it supports your answer.
I. HypothesisμS= Average decrease in cholesterol level using the standard drugμN= Average decrease in cholesterol level using the new drug
H o : μs=μN The average decrease in cholesterol level is the same using either drugH a : μS<μN The average decrease in cholesterol level is greater for the new drug than the standard drug
II. ConditionsPatients were distributed to each treatment group randomly.Patients were independent of each other within each groupn=50≥30 for both groupsNo patient was in both groups(Do not need to assume the distribution of Cholesterol level is approximately normal since sample is large enough)
III. 2-Sample T-Testt=-3.922322703p-value= .000088356653
IV. Conclusion:We reject Ho because our p=value (.000088) is small at any acceptable significance level. We have enough evidence to support the claim that the new drug lowers cholesterol better on average than the standard drug
V. Confidence Interval: 2-Sample T-Interval(−12.06 ,−3.945) I am 95% confident that the true difference in average decrease in cholesterol using the new drug is between 3.945 and 12.06 mg/dl more than the standard drug. This supports our conclusion since 0 is not in our confidence interval.

AP Statistics Frappy Packet for End-Of-Year Graded Homework AssignmentsP a g e | 10
2004-6 Cholesterol #2 (1 Mean-Statistics)A pharmaceutical company has developed a new drug to reduce cholesterol. A regulatory agency will recommend the new drug for use if there is convincing evidence that the mean reduction in cholesterol level after one month of use is more than 20 milligrams/deciliter (mg/dl), because a mean reduction of this magnitude would be greater than the mean reduction for the current most widely used drug.
The pharmaceutical company collected data by giving the new drug to a random sample of 50 people from the population of people with high cholesterol. The reduction in cholesterol level after one month of use was recorded for each individual in the sample, resulting in a sample mean reduction and standard deviation of 24 mg/dl and 15 mg/dl, respectively.
Does the new drug have enough convincing evidence that the mean reduction in cholesterol level after one month of use is more than 20 mg/dl? Give appropriate statistical evidence to support your conclusion. Also include a confidence interval and explain how it supports your answer.
I. Hypothesis
H o : μ=20 The average decrease in cholesterol level is 20 mg/dl.H a : μ>20 The average decrease in cholesterol level is greater than 20 mg/dl.
II. ConditionsPatients were chosen randomly for each groupPatients can be reasonably assumed as independent of one anothern=50≥30 (Do not need to assume the distribution of cholesterol levels are nearly normal because sample is large enough)
III. 1-Sample T-Testt=1.885618083 p-value= .0326419275
IV. Conclusion:We reject Ho because our p=value (.0326) is small at the 5% significance level. We have enough evidence to support the claim that the new drug lowers cholesterol more than 20mg/dl on average than the standard drug.
OR: We do not reject Ho because our p=value (.0326) is large at the 1% significance level. We do not have enough evidence to support the claim that the new drug lowers cholesterol more than 20mg/dl on average than the standard drug.
V. Confidence Interval: 2-Sample T-Interval(20.443,27 .557) OR: (18.898, 29.102)I am 90% confident that the true average decrease in cholesterol using the new drug is between 20.443 mg/dl and 27.557mg/dl. This supports our conclusion since 20 mg/dl is not in our confidence interval.
OR: I am 98% confident that the true average decrease in cholesterol using the new drug is between 18.898 mg/dl and 29.103 mg/dl. This supports our conclusion since 20 is in our confidence interval.

AP Statistics Frappy Packet for End-Of-Year Graded Homework AssignmentsP a g e | 11
1999-2 Lost Hikers (Chi-Squared Independence)The Colorado Rocky Mountain Rescue Service wishes to study the behavior of lost hikers. If more were known about the direction in which lost hikers tend to walk, then more effective search strategies could be devised. Two hundred hikers selected at random from those applying for hiking permits are asked whether they would head uphill, downhill, or remain in the same place if they became lost while hiking. Each hikers in the sample was also classified according to whether he or she was an experienced or novice hiker. The resulting data are summarized in the following table.
Do these data provide convincing evidence of an association between the level of hiking expertise and the direction the hiker would head if lost? Give appropriate statistical evidence to support your conclusion.
I. HypothesisHo: Response to getting lost in the woods is independent of experience level (no association)Ha: Response to getting lost in the woods is dependent of experience level (association)
II. ConditionsCategorical DataSRS of independent HikersExpected frequency count for each cell is greater than 5
III. Chi-Squared Test of IndependenceChi-Squared: 4.452 p-value=.107959242
IV. Conclusion:We do not reject Ho because our p=value (.1079) is large at the 5% significance level. We do not have enough evidence to support the claim that response to getting lost in the woods is dependent of experience level.

AP Statistics Frappy Packet for End-Of-Year Graded Homework AssignmentsP a g e | 12
2003-5 Presidential Affairs (Chi-Squared Independence)A random sample of 200 students was selected from a large college in the United States. Each selected student was asked to give his or her opinion about the following statement. “The most important quality of a person who aspires to be the President of the United States is a knowledge of foreign affairs.” Each response was recorded in one of five categories. The gender of each selected student was noted. The data are summarized in the table below.
Is there sufficient evidence to indicate that the response is dependent on gender? Provide statistical evidence to support your conclusion.
I. HypothesisHo: Response to survey is independent of gender (no association)Ha: Response to survey is dependent of gender (association)
II. ConditionsCategorical DataSRS of studentsExpected frequency count for each cell is greater than 5
III. Chi-Squared Test of IndependenceChi-Squared: 8.922558923 p-value=.0630645568
IV. Conclusion:We do not reject Ho because our p=value (.063) is large at the 5% significance level. We do not have enough evidence to support the claim that response to the survey is dependent on gender.
AP Statistics Frappy Packet for End-Of-Year Graded Homework AssignmentsP a g e | 13
2008-5 Moose (Chi-Squared Goodness of Fit)A study was conducted to determine where moose are found in a region containing a large burned area. A map of the study area was partitioned into the following four habitat types.
(1) Inside the burned area, not near the edge of the burned area,(2) Inside the burned area, near the edge,(3) Outside the burned area, near the edge, and(4) Outside the burned area, not near the edge.The figure to the right shows these four habitat types.
The proportion of total acreage in each of the habitat types was determined for the study area. Using an aerial survey, moose locations were observed and classified into one of the four habitat types. The results are given in the table below.
The researchers who are conducting the study expect the number of moose observed in a habitat type to be proportional to the amount of acreage of that type of habitat. Are the data consistent with this expectation? Conduct an appropriate statistical test to support your conclusion. Assume the conditions for inference are met.
I. HypothesisHo: The number of moose observed in each habitat is consistent with the expected number based on acreage.Ha: The number of moose observed in each habitat is not consistent with the expected number based on acreage.
II. ConditionsAssume they are met (stated)
III. Chi-Squared Goodness of Fit Test(To get expected, multiply Proportion of Total Acreage by 117)Chi-Squared: 43.68926643 p-value=.000000017568857
IV. Conclusion:We reject Ho because our p=value (.00000002) is very small at any acceptable significance level. We have enough evidence to support the claim that the number of moose observed in each habitat is not consistent with the expected number based on acreage.