Web viewEconomic Notes by Banca Monte dei Paschi de Siena SpA, ... AGSB has formulated sustainable...
88
Effectiveness of Rational Strategizing: Exploring Sustainability Implications on Graduate Business Education Gary A. Grey March 1, 2017 Ateneo de Manila University Ateneo Graduate School of Business 1
Transcript of Web viewEconomic Notes by Banca Monte dei Paschi de Siena SpA, ... AGSB has formulated sustainable...

Effectiveness of Rational Strategizing: Exploring Sustainability
Implications on Graduate Business Education
Gary A. Grey
March 1, 2017
Ateneo de Manila University
Ateneo Graduate School of Business
1

Grey 2
Abstract
This paper explores sustainability for its implications on graduate
business education using analysis made on selected Philippine
companies for the effectiveness of its use of rational strategizing. The
analysis of rational strategizing proved that there is a positive
outcome resulting from the proper execution of a rational strategizing
process. The hypothesis of rational strategizing having a positive
outcome is proven to be valid given the empirical evidence using the
Chi-Square test. The strength of this positive outcome is dependent
on the interaction among the three components of change
management: the change agent (the leader), the change element (the
strategy process of formulation and execution), and the change target
(the organization). The outcome is measured by a credit risk measure,
specifically the Altman Z-score for emerging markets. The basis for
measuring the outcome is through selecting samples of implemented
strategic management (STRAMA) papers from AGSB’s almost 3,700
digitized strategic management papers. Specifically, papers from

Grey 3
AGSB’s MBA Regis program and MBA Health programs were
selected with the cut-off year of implementation of 2004-2005 to
allow for a 3-year performance window for analysis of the before and
after implementation Altman Z-score outcome measure. A literature
review was conducted to scan and review strategizing methodologies
within the scope of the components of change management resulting
in creating a Strategy-Organization-Leadership model that explain
the positive outcome of implemented STRAMA paper using left-brain
strategizing processes. Cross-tabulation analysis and literature review
on the types of leadership, their strategies, and implementation show
the link between sustainable leadership and transformational
leadership and their impact on the organization as measured by the
Altman Z-score.
The insights provide a template for graduate business education
to incorporate sustainable strategy formulation in the teaching of its
courses. . Through strategic and systemic thinking embedded in the
Strategic Management integrative course of AGSB and the
recommendations and conclusions emanating from the study, a guide

Grey 4
is provided for future research directions and improvement of the
strategizing process for higher education to assure sustainability.
Key Words: Rational Strategizing, Change Management, Strategy,
Change Agent, Change Element, Change Target, Data Mining,
Leadership, Organization, Strategy Management, Sustainable
Strategic Management, Sustainable Higher Education, Emerging
Market

Grey 5
1 Introduction
This paper explores sustainability for its implications on graduate
business education using analysis made on selected Philippine
companies for their effectiveness of rational strategizing. Rational
strategizing or “left brain” strategizing is the andragogical approach
used by the Ateneo Graduate School of Business (AGSB) in its
integrative course called Strategic Management (STRAMA). The
strategy formulation tools employed are part of the Fred David
framework used in the course Strategy Management1 where the
output of the graduate student is the STRAMA paper . The analysis
done on the selected Philippine companies showed that the
STRAMA paper as applied in the business world once the students
graduate has a positive outcome. The hypothesis of rational
strategizing having a positive outcome is proven to be valid given the
empirical evidence using the Chi-Square test. The strength of this
positive outcome is dependent on the interaction among the three
components of change management: the change agent (the leader), the
change element (the strategy process of formulation and execution),
1 Fred R. David, Strategic Management: Concepts & Cases, 2009 12th Edition, Pearson Education

Grey 6
and the change target (the organization). The outcome is measured by
a credit risk measure, specifically the Altman Z-score for emerging
markets. The basis for measuring the outcome is through selecting
samples of implemented strategic management (STRAMA) papers
from AGSB’s almost 3,700 digitized strategic management papers.
Specifically, papers from AGSB’s MBA Regis program and MBA
Health programs were selected with the cut-off year of
implementation of 2004-2005 to allow for a 3-year performance
window for analysis of the before and after implementation Altman
Z-score outcome measure.
The paper starts off by presenting a Conceptual and Analytical
Framework of the paper which includes the Change Management
Process, the Altman Z-Score as Measurement of Outcome,
Sustainability, Types of Leadership and the Strategy-Organization-
Leadership Scoring System. A summary of the survey results and
analysis of the study “Effectiveness of Rational Strategizing”2 is
presented followed by simple cross tabulation analysis to discover
new insights in the incorporation of the sustainability dimension. .
2 Gary A. Grey, Rational Strategizing of Philippine Companies: Implications for Sustainability, published in the proceedings of the International Business and Information Conference, Hiroshima, Japan, July 4-6 2017.

Grey 7
Finally, the paper comes out with the implications for Graduate
Business Education when sustainability is incorporated to the Triple
Bottom Line perspective of Profit, People, and Planet as embedded in
the Leader (Change Agent), Strategy (Change Element), and
Organization (Change Target).
2 Conceptual and Analytical Framework
This paper views the change management model as the starting
point of the analysis. A measure used to determine the interaction
among the model’s components, the Altman Z-score, provides a
useful indicator to determine different component outcomes,
particularly sustainability.
2.1 Change Management Process
The conceptual framework (Figure 1) employs the change
management paradigm of the three components of change, viz.,
Change Agent (the Leader), Change Element (Strategy), and Change
Target (Organization).

Grey 8
Figure 1: Change Management Framework
The appropriateness of using Change Management as the
theoretical framework is perhaps best expressed through this
comment from Robert Kaplan and David Norton, creators of the
Balanced Scorecard: “Managing strategy is synonymous with
managing change.”3
Figure 2: Interaction among Change Management Components
The interaction amongst various parameters within each
overlapping individual component is shown in Figure 2. It can be seen
3 Lagace, M., Q & A with HBS Professor Robert S. Kaplan, Harvard Business School, Working Knowledge for Business Leaders (n.d.)

Grey 9
that strategy planning, decision-making, and implementation, along
with the creation of vision, mission, objectives, key result areas
(KRAs) and performance indicators (PIs), interface with the leader
with his innate capabilities and attitudes, providing motivation,
evaluation, control, and reward, coupled with leading, staffing,
relating, and supporting activities that will enhance organizational
structure, systems, and resources.4 The change element which is the
rational strategizing process and the elements of leadership and
organization with the Altman Z-Score Outcome can thus be
visualized in Figure 3.
4 Ed Morato, (2006) Strategic Planning and Management: Strategizing, Organizing, and Implementing, Singapore: Pearson Education South Asia Pte Ltd.

Grey 10
Figure 3: Strategy-Organization-Leadership Interaction Diagram
2.2 The Altman Z-Score as a Measure of Outcome
The three major components of change interact with each other; as
represented by the double-headed arrows and yield an outcome. The
outcome is measured by the Altman Z-score which is also a measure
of risk, particularly credit risk, as used by the banking community. ,36

Grey 11
The literature on the Altman Z-Score and various literature on
modeling and data mining became the basis for determining the use of
the Altman Z-Score for Emerging Markets. Specifically, these
concepts are found in the various articles by Edward Altman that
pertain to the Z-Score, Bruce G. Carruthers and B. Cohen on Credit
Rating in the 19th Century, Nikolai Chuvakhin and L. Wayne
Gertmenian on Bankruptcy Prediction in the WorldCom Age, David
Loshin’s book on Business Intelligence, Armando Veira et al. on
Model Selection and Feature Ranking for Distress Classification,
Raymond Anderson’s The Credit Scoring Toolkit, and Linda Allen,
Gayle L. de Long, and Anthony Saunders work on Issues on the
Credit Risk Modeling of Retail Markets.5
5 Altman, E. I. (2000, July). Predicting Financial Distress of Companies: Revisiting the Z-Score and ZETA® Models.; Altman, E. I. (2002a). Managing Credit Risk: A Challenge for the New Millennium. Economic Notes by Banca Monte dei Paschi de Siena SpA, 31(2), 201-214.; Altman, E. I. (2002b). Revisiting Credit Scoring Models in a Basel 2 Environment. London Risk Books; Altman, E. I. (1968). Financial Ratios, Discriminant Analysis and the Prediction of Corporate Bankruptcy. The Journal of Finance; Altman, E. I. (n.d.). The Use of Credit Scoring Models and the Importance of a Credit Culture. Stern School of Business, New York University. Retrieved from https://www.coursehero.com/file/6226451/Z-Score-of-Altman/; Altman, E., Haldeman, R., & Naranayan, P. (1977). Zeta Analysis: A New Model to Identify Bankruptcy Risk of Corporations. Journal of Banking & Finance, 1.; Altman, E., & Altman, R. (1968). Financial Ratios, Discriminant Analysis and the Prediction of Corporate Bankruptcy. Journal of Finance.; Altman, E. I. (2002c). Corporate Distress Prediction Models in a Turbulent Economic and Basel II Environment. ”, Stern School of Business, New York University.; Altman, E. I. (1993). Corporate Financial Distress and Bankruptcy (Vol. ), Chapter 3). New York: John Wiley & Sons.;Carruthers, B. G., & Cohen, B. (2006). The

Grey 12
Ideally, the best tool for outcome measurement is the balanced
scorecard, analyzing the four areas of outcome, viz., financial
perspective, internal business perspective, customer perspective, and
learning and growth perspective. It would be impractical to use these
as the measurement of effectiveness as this would entail having a
monitoring system within the AGSB academe that will track the
Mechanization of Trust: Credit Rating in 19th c. America. Department of Sociology, Northwester University.; Chuvakhin, N., & Gertmenian, W. I. (n.d.). Bankruptcy Prediction in the Worldcom Age. Retrieved from http://ncbase.com/papers/BP.pdf; Loshin, D. (2003). Business Intelligence: The Savvy Manager’s Guide (ISBN: 1-55860-916-4). Morgan Kaufmann .; Adriaans, P., & Zantinge. D. (1996). Data Mining. Addison Wesley Longman Limited.; Mukkamala, S., Vieira, A. S., & Sung, A. H. (n.d.). Model Selection and Feature Ranking for Financial Distress Classification. Dept. of Computer Science, New Mexico Tech, Socorro, and ISEP and Computational Physics Center, University of Coimbra, Coimbra, Portugal. Retrieved from http://www.academia.edu/25892429/Model_selection_and_feature_ranking_for_financial_distress_classification; Anderson, R. (2007). The Credit Scoring Toolkit: The Theory and Practice of Retail Credit Risk Management and Decision Automation (ISBN: 9780199226405 ed.). Oxford University Press.; Allen, L., DeLong, & Saunders, A. (2003). Issues in the Credit Risk Modeling of Retail Markets. NYU Stern School of Business Working Paper No. FIN-03-007. http://dx.doi.org/10.2139/ssrn.412520

Grey 13
outcomes of companies operating in the corporate world. For
practicality, therefore, the Altman Z Score is used as the preferred
benchmark measure.
2.3 Sustainability
The Triple Bottom Line (TBL) concept developed by John
Elkington has changed the way businesses, nonprofits and
governments measure sustainability and the performance of projects
or policies. Business sustainability is often defined as managing the
TBL- a process by which companies manage their financial, social
and environmental risks, obligations and opportunities. However, this
approach relies on an accounting based perspective and does not fully
capture the time element that is inherent within business
sustainability. A more robust definition is that business sustainability
represents resiliency over time – businesses that can survive shocks
because they are intimately connected to healthy economic, social and
environmental systems. These businesses create economic value and
contribute to healthy ecosystems and strong communities. These
concepts can be found in the papers of Joana Radomska “ The
Concept of Sustainable Strategy Implementation”, Wikipedia’s

Grey 14
“Triple Bottom Line”, and Timothy Slafer & Tanya Hall’s “The
Triple Bottom Line: What is it and How Does it Work?”6
Beyond the foundation of measuring sustainability on three fronts
—people, planet and profits—the flexibility of the TBL allows
organizations to apply the concept in a manner suitable to their
specific needs.
2.4 Types of Leadership
There are three types of leadership, viz., Transformational,
Transactional, and Laissez-faire, which the paper considered in
surveying the STRAMA students who implemented their papers. The
paper used the Multifactor Leadership Questionnaire (MLQ) factors,
6 Joanna Radomska. The Concept of Sustainable Strategy Implementation,Sustainability 2015, 7, 15847–15856; doi:10.3390/su7121579; Timothy F. Slafer, & Tanya J. Hall, (n.d.). The Triple Bottom Line: What Is It and How Does It Work? Retrieved February 10, 2017, from Http://www.ibrc.indiana.edu/ibr/2011/spring/article2.html retrieved February 10, 2017, from Http://www.ibrc.indiana.edu/ibr/2011/spring/article2.html; Triple Bottom Line. (n.d.). Retrieved February 20, 2017, from https://en.wikipedia.org/wiki/Triple_bottom_lin; Slafer, T. F., & Hall, T. J. (n.d.). The Triple Bottom Line: What Is It and How Does It Work? Retrieved February 10, 2017, from Http://www.ibrc.indiana.edu/ibr/2011/spring/article2.html

Grey 15
a survey which identifies different leadership characteristics based on
examples and provides a basis for leadership training.7
Transformational leadership is a style of leadership where a leader
works with subordinates to identify needed change, creating
a vision to guide the change through inspiration, and executing the
change in tandem with committed members of a group.
In contrast to transformational leadership, transactional
leadership styles focus on the use of rewards and punishments in
order to achieve compliance from followers. Transformational leaders
look towards changing the future to inspire followers and accomplish
goals, whereas transactional leaders seek to maintain the status quo,
not aiming for progress.
Studies have shown transformational leadership practices lead to
higher satisfaction with leader among followers and greater leader
effectiveness, while transactional practices lead to higher follower job
satisfaction and leader job performance.
In a laissez-faire leadership style, a person may be given a
leadership position without providing leadership, which leaves
7 Jens Rowold, Multifactor Leadership Questionnaire: Psychometric Properties of the German Translation, 2005. University of Muenster, Germany, Published by Mindgarden, Inc.

Grey 16
followers to fend for themselves. This leads to subordinates having a
free hand in deciding policies and methods.
Studies have shown that while transformational leadership styles
are associated with positive outcomes, laissez-faire leadership is
associated with negative outcomes, especially in terms of follower
satisfaction with leader and leader effectiveness.8
This paper‘s findings jives with the studies found in the literature
review as will be discussed in the summary of findings and cross-
tabulation analysis.
2.5 The Strategy-Organization-Leadership Scoring System
Based on the literature review, the variables inferred as part of the
components of the interaction among the strategy-organization-leader
are as follows (Table 1).
Table 1: Component Variable among the Strategy-Organization-Leadership Catogories
Variable Name Definition
STRATEGY FORMULATION AND EXECUTION VARIABLES
8 Transformational leadership From Wikipedia, the free encyclopedia https://en.wikipedia.org/wiki/Transformational_leadership accessed May 14, 2017

Grey 17
Strategy Development
1 Mission Degree of clarity of mission
2 Vision Degree of clarity of vision
3 Environment Degree of correct identification of environmental factors that impact strategy
Strategy Mapping
4 Scope Degree of proper definition of where and how the organization will compete
5 Model Degree of development of a comprehensive integrated model of the strategy
6 Target Degree of conversion of strategic direction statements into measures and targets
7 Action Plans Degree of defining the portfolio of initiatives/action plans to close performance gaps
8 Funding Degree of providing a source of funding for strategic initiatives separate from operational budget
9 Accountability Degree of establishing accountability for execution of cross-business strategic themes
ORGANIZATIONAL ALIGNMENT ENABLERS
Cascading Strategy Structures
Horizontal-vertical alignment structures
10 Cross-functional Teams Degree of using teams, cross-functional groups, or a matrix/"grid" structure to share resources or knowledge
11 Informal Communication Degree of using informal communication (i.e., person-to-person contact)
12 Formal Integrators Degree of using formal integrators (e.g. a project management or quality assurance organization)
13 Information reliabilityDegree of information reliability (from unreliable/managers do not trust information outside own departments to reliable)
14 Information enablersDegree of information reaching those who need it (from "information falls through the cracks" to information gets acted on by people who need it)
15 Decision-making/response time
Degree of speed in executing decisions (from slow response to high speed) (e.g. response to customer complaints)
16 Bureaucratic waste Degree of time or money being wasted because of inefficiency or bureaucracy in the execution process.
17 Appreciation of change Degree of appreciating strategy relevance to tasks (from none to seeing the whole picture of where the strategy fits)

Grey 18
Individual alignment structures
18 Employee reluctance Degree of sharing important information or knowledge with others (from none to whole-hearted collaboration)
19 Political self-gainDegree of "Playing politics" as more important than performance against strategy execution goals for gaining individual recognition (from high to low)
Operational Planning
20 Translation Degree of monitoring and managing the strategic initiatives and the Balanced Scorecard
21 Resource Appropriate Degree of ensuring that resource capacity, operational plans, and budgets reflect the directions and needs
Monitor, Learn, & Adapt
22 Finance and Operations Management
Degree of monitoring and managing short-term financial and operational performance
23 Balanced Scorecard Degree of monitoring and managing the strategic initiatives and the Balanced Scorecard
24 Feedback monitoring Degree of periodically assessing results hypothesized in cause-effect diagrams are occurring as anticipated
LEADERSHIP VARIABLES
25 Trust Builds trust
26 Integrity Acts with integrity
27 Inspiration Inspires others
28 Innovation Encourages innovative thinking
29 Coaching Coaches people
30 Rewards Rewards achievement
31 Mistakes prevention Monitors mistakes
32 Fight fire syndrome Does not just fight fires
33 Involvement Does not avoid involvement
34 Extra Mile Generates extra effort
35 Efficiency Is efficient
36 Satisfaction Generates satisfaction
As can be seen in Table 1, there are 36 variables identified through
the literature review. In order to assess the “before” and “after”
implementation scores, these independent variables were used in the

Grey 19
survey questionnaire administered to the selected STRAMA-
implemented companies. Each category component (i.e., Strategy
Formulation and Execution, Organizational Alignment Variables, and
Leadership Variables) will have a total score summed up from the
scores of the variables from each category. The total point is 1,000 for
the three main categories, and the weight distribution (almost 1/3 per
main category) is shown in Table 2.
Table 2: Weight Distribution of Strategy-Organization-Leadership Score
Each major category has a range of scores as shown in Table 3.
Table 3: Range of Scores by Category and Sub-Category
Category Minimum MaximumStrategy Strong 234 350 Medium 118 233 Weak 0 117Organization Strong 218 325
Maximum Points
Points % to Total
Strategy 350 35.00Organization 325 32.50Leadership 325 32.50
Total 1,000 100.00

Grey 20
Medium 110 217 Weak 0 109LeadershipTransformational 218 325Transactional 110 217 Laissez-Faire
(None) 0 109
The Strategy-Organization-Leadership Scoring system uses a
1,000 point system similar to a bank‘s. A common cut-off point for
banks to accept or reject a loan application is 70% or 700 points. This
decision point is also represented in the Altman Z-score’s distressed
zone score, which is 1.1 and below.
The score per category becomes the basis for measuring the
strength of outcome as measured by the Altman Z-Score, whose
determination is based on the four financial variables for the
Emerging Market Z-Score configuration.
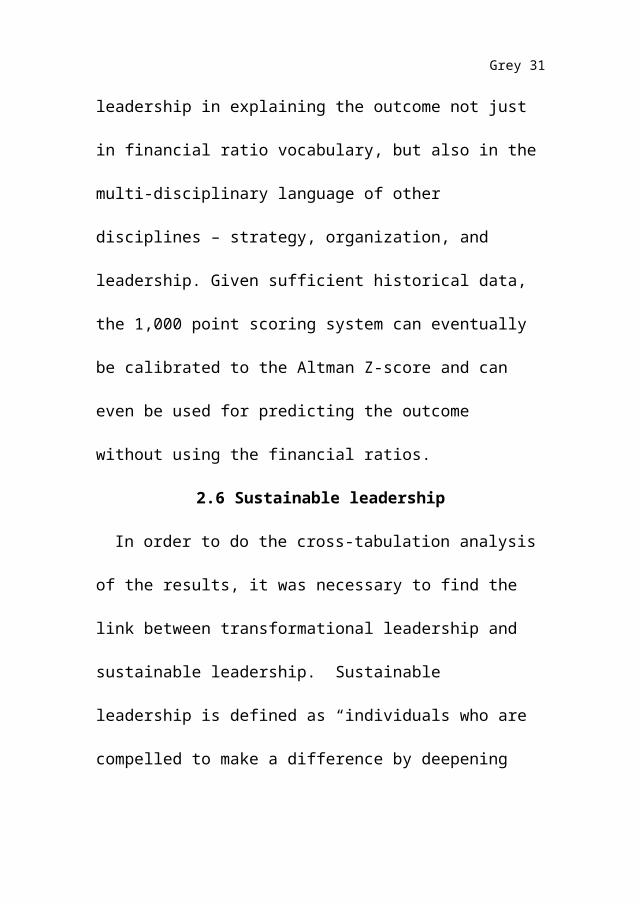
The “expert”-determined SOL scoring system provides a fresh
insight on the interaction of strategy, organizational alignment, and
leadership in explaining the outcome not just in financial ratio
vocabulary, but also in the multi-disciplinary language of other
disciplines – strategy, organization, and leadership. Given sufficient
historical data, the 1,000 point scoring system can eventually be

Grey 21
calibrated to the Altman Z-score and can even be used for predicting
the outcome without using the financial ratios.
2.6 Sustainable leadership
In order to do the cross-tabulation analysis of the results, it was
necessary to find the link between transformational leadership and
sustainable leadership. Sustainable leadership is defined as
“individuals who are compelled to make a difference by deepening
awareness of themselves in relation to the world around them”. In
doing so, they adopt new ways of seeing, thinking, and interacting
that result in innovative sustainable solutions. Some take the view
that sustainability leadership or more precisely leadership for
sustainability is not a separate school of leadership but a particular
blend of leadership characteristics applied within a definitive context.
A number of business leaders felt that the need to differentiate
leadership from leadership in general may be a necessary but
temporary phenomenon and really embedding it in the organization is
the unique current set of challenges on a 10 year view. Beyond that
hopefully it becomes business as usual.9 9 Wayne Visser & Polly Courtice, Sustainability Leadership: Linking Theory &
Practice. SSRN Working Paper Series 21 October 2011. Report also presented in the CPSL 2011 Report entitled A Journey of a Thousand Miles: The State of Sustainability Leadership 2011

Grey 22
A recent CEO study on sustainability conducted by the UN Global
Compact and Accenture – the third one of its kind – reached out
to more than 1,000 executives from 27 industries in 103 countries
around the world, asking for their views on the past, present and
future of sustainable business. This largest-ever CEO study on
sustainability offered a mixed picture of global movement in the
positive direction juxtaposed with the frustration over slow progress.
In the previous edition of this study, conducted in 2010, CEOs
were optimistic that sustainability – understood as the active
management of social, environmental, and governance issues as a part
of core business – would soon become a norm embedded into
operations of companies worldwide, with leadership on
sustainability incentivized and rewarded. In 2013, 63 percent of CEOs
still expect sustainability to transform their industry within five years
and 76 percent believe that embedding sustainability into core
business will drive revenue growth and new opportunities.
However, the predominant feeling is that global business efforts on
sustainability may have plateaued, and despite deeper awareness and

Grey 23
commitment levels many business leaders deem the pace of change
and the scale of impact insufficient.
The report notes that
CEOs see business caught in a cycle of ‘pilot paralysis’—individual, small-scale projects, programs and business units with an incremental impact on sustainability metrics—and while they see a role for business in promoting sustainable development, their responsibilities to the more traditional fundamentals of business success, and to the expectations of markets and stakeholders, are preventing greater scale, speed and impact
Such views are not surprising given a prolonged recovery from the
global financial crisis that pushed businesses to focus more narrowly
on the bottom line. And the lack of solid metrics tying sustainability
to business performance isn’t helping. In 2007, just 18 percent of
surveyed CEOs reported that they perceived no link between
sustainability and business value. In 2010, this number rose to 30
percent, and this year to 37 percent. Changing that trend requires a
shift of the context in which companies strive to be good corporate
citizens.
The surveyed CEOs envision a significant role for national and
local governments in re-shaping the landscape for sustainability: 83

Grey 24
percent of them see the need for greater efforts by governments and
policymakers to provide an enabling environment for the private
sector as integral to advancing sustainability, and 85 percent demand
clearer policy and market signals to support sustainable growth.10
From the literature review, the link between the sustainable
leadership and transformational leadership through the traits and
mindsets of the leader was brought out. By drawing an input-process-
output chart and comparing transformational leadership traits against
sustainable leadership traits, the picture clearly emerges that they are
the same and supports the assumption used by the cross-tabulation
analysis of the results that transformational leaders are sustainable
leaders. In Isabel Rimanoczy’s A Matter of Being: Developing
Sustainability-Minded Leaders11, a reframing of the findings map of
the paper shows the input, process, and output elements as shown in
Table 4.
10 Anna Nadgrodkiewicz, In Search of Transformational Leadership on Sustainability Posted on 19 December,2013 by Anna Kompanek http://www.cipe.org/blog/2013/12/19/in-search-of-transformational-leadership-on-sustainability/#.WRfChZKGPMw accessed May 14, 2017
11 Isabel Rimanoczy, A Matter of Being: Developing Sustainability-Minded Leaders, p. 95, Journal of Management for Global Sustainability, vol. 2, Issue 1,2014

Grey 25
Table 4: Developing Sustainable Leadership
In Les Bell & Phil Smith, “A Case Study of Sustainable
Transformational Leadership in a Challenging School”12, the output
elements from the reframed map in Table 4 are transposed into 7
sustainable traits and compared against similar 7 transformational
traits as shown in Table 5
Table 5: Comparison of the Principles of Transformational & Sustainable Leadership
12 Les Bell & Phil Smith,“Creatures that by a Rule in Nature Teach the Act of Order (Henry V Act Scene 2): A Case Study of Sustainable Transformational Leadership in a Challenging School“ in Building for a Sustainable Future in our Schools Brick by Brick ed. Rosemary Papa & Anna Sarti.Springer International Publishing Switzerland 2017 DOI 10.1007/978-3-319-12403-2 p, 171

Grey 26
3 Summary of Survey Results and Analysis
This section covers the results of the Chi-Square test which prove
the main hypothesis of the study and the results of the two surveys (or
interviews) meant to support the secondary hypothesis: (1) Altman Z-
Score of Selected Companies (2) The Strategy-Organization-
Leadership (SOL) Score of Company Respondents. Under the survey
of Altman Z-Score of Selected Companies, there is also a variance
analysis of the score, vis-à-vis the companies’ identified main
competitors. These tables are used to conduct the cross-tabulation
analysis. Further results can be found in Grey, Rational
Strategizing.13
3.1 Chi-Square Test Results and Analysis
13 Grey, Rational Strategizing, 2017

Grey 27
The Chi-Square test results show that the study’s main hypothesis
(i.e., there is a positive outcome in the proper execution of a rational
strategizing process) is valid based on empirical evidence. Based on
the methodology of the Chi-Square Test, if the null hypothesis is
proven invalid because the p value is less than the alpha (α) value,
then the alternative hypothesis is proven valid.
In this study, the following are the null and alternative hypotheses:
H0 = Null Hypothesis = the Rational Strategizing Process has a
negative outcome
H1 = Alternative Hypothesis = the Rational Strategizing Process
has a positive outcome
Assuming,
α = .01 (level of significance) 99% confidence
If p value < α, reject H0
Hence, accept H1.
The results of the Chi-Square test using the normal distribution
template are shown in Table 6.
Table 6. Chi-Square Test on Selected Companies’ Altman Z-Score

Grey 28
1. The p value is 1.25E-15, a negative value that is lower than α = .01 leading to the rejection of the null hypothesis and acceptance of the alternative hypothesis.
2. Conclusion. the left brain strategizing process of the AGSB, as implemented in the real world, has a positive outcome.
The next sections analyze the selected companies amongst
themselves, against their competitors, and the explanatory variables of
the SOL Score.
3.2 Altman Z-Scores of Selected Companies
The basis for the computation of the Chi-Square test is found in
Table 7. 10 companies which implemented the STRAMA papers were
interviewed. The average of the Altman Z-Score in the three years
prior to implementation and the three years after implementation were
derived.

Grey 29
Table 7: Altman Z-Scores of Selected Companies with Implemented STRAMA Papers
1. The average Altman Z-Score of the before and after implementation of the STRAMA paper shows an overall positive variance of 1.05 or .14%
2. Six of the 10 companies showed positive variance, with the highest positive variance at 58.4% and the lowest at 2.81%.
3. Of the four companies which showed negative variance, the highest negative variance recorded was -14.60% and the lowest was -.15%.
3.3 Altman Z-Score of Company vs. Competitor
Another analytical view would be to compare how the selected
companies performed relative to their main competitor.
Table 8 shows the company versus competitor analysis of the
Altman Z Score.

Grey 30
Table 8: Companyr vs.Competitor Analysis of the Altman Z-Score
1. Overall, shows a deterioration on a before and after implementation basis from .-94 or -16.56% before and -1.20 or -30.85% after (company vs. Competitor).
2. Of the 10 selected companies, five fully implemented the strategies recommended in the STRAMA paper, while five only partially implemented the recommended strategies.
3. 5 companies with fully-implemented strategies showed a negative variance -8.15%. before implementation and a positive variance of 8.88% after implementation.
4. 5 companies with partially implemented strategies suffered deterioration from -24.96% to -70.38% vis-a-vis competitors.
Grey 31
3.4 Strategy-Organization-Leadership (SOL) Score of Company Respondents
There were 10 respondents who completed the SOL online survey.
Of the 10, two had matching Altman Z-Scores before and after
implementation. The results are shown in Table 9.
Table 9: Strategy-Organization-Leadership Scores of Company Respondents

Grey 32
3.5 Summary of Results on Survey on Strategy-Organization-Leadership Score
Table 10: Average Strategy-Organization-Leadership Score of Respondent Companies
1. SOL Scores shows a movement from Medium-Medium-Transactional before and a Strong-Strong-Transformational after implementation.
2. Seen as an aggregate the effect of the rational strategizing process shows a transformation of the respondent companies towards strong strategic execution, strong organizational execution, and transformational leadership.
3.6 Application of the SOL Score to the Altman Z-Score Results
The SOL Scores were designed to explain the Altman Z-Score of
the selected companies. In effect, the SOL Score would illuminate the
secondary hypothesis: The strength of the positive outcome of the
rational strategizing process is dependent on the interaction among
the three components of change: change agent (the leader), change
element (the strategy process of formulation and execution), and
change target (the organization). Since the number of respondents of
the SOL survey does not represent sufficient sample size required to

Grey 33
come out with a predictive analytics model (at the least the sample
size should equal the number of the 36 explanatory variables under
the three main categories of change management), the SOL survey
results can be used to explain the movement of the Altman Z-Score
for the companies with both the Altman Z-Score and SOL Score.
The two companies with completed Altman Z-Score and SOL
Score are Company D and Company A. A sample illustration of how
the SOL Score can be used to explain the movement of the Altman Z-
Score is in Table 11.

Grey 34
Table 11: Application of SOL Score to Explain Altman Z-Score Movement
1. High positive variance of Company D (58.4%) and Company A 51.24% can be explained by the SOL Score movement from Medium-Medium-Transformational to Strong-Strong-Transformational for Company D, and from Medium-Medium-Transactional to Strong-Strong-Transformational for Company A.
2. Probing the sub-categories of Strategy, Organization, and Leadership could further provide insights.

Grey 35
4 Cross-Tabulation Analysis
Table 12, which compares Sustainable versus Transactional
strategizing, cross-tabulates the results from Tables 7 and 9. Table 12
is based on the following premises: a. Sustainable leadership is
equivalent to Transformational Leadership as supported by Table 5
and the findings from Table 10 which shows that the effect of the
rational strategizing process shows a transformation of the respondent
companies towards strong strategic execution, strong organizational
execution, and transformational leadership.
b. Companies that fully implemented the recommendations of the
STRAMA paper are considered transformational and those that only
partially implemented the recommendations are transactional. This is
inferred from the findings of Table 10 that the effect of the rational
strategizing process shows a transformation of the respondent
companies towards strong strategic execution, strong organizational
execution, and transformational leadership. Table 8 reveals that
partially implemented papers by the same respondent companies as in
Table 10 showed a deterioration of their Altman Z-Scores versus their
competitors. Since the execution of the STRAMA recommendations

Grey 36
is only partial, then it cannot be considered transformational. Hence,
it is considered transactional.
Table 12: Sustainable versus Transactional Strategizing
1. Sustainable strategy formulation and implementation are superior than transactional : 13.24% vs. 8.24% improvement (sustainable vs. Transactional)
2. Fully implemented sustainable strategies have highest improvement at 25.02% while partially implemented sustatainable exhitibt deterioration at -2.66%..
These findings from rational strategizing of Philippine companies
that sustainable leaders fully implementing their sustainable strategy
as having the biggest improvement is also supported by findings of

Grey 37
the United Nations Business and Sustainability Development
Commission (UN BSDC)14
The Leader-Strategy-Organization framework cross-tabulated with
leadership style shows that transformational/sustainable leaders have
the biggest impact. A UN BSDC study points out that the
improvement is in the areas of efficiency gains, innovation gains,
enhanced reputation, attraction and retention of employees,
consumers, B2B customers and investors.15 Cross-tabulating Tables 8
and 9 using the same premises as Table 12 and the further
assumption that the competitor strategies are transactional since the
competitors did not form part of the survey) , a company-to-
competitor analysis is formed in Table 13.
14 Malloch-Brown, L. (2017). .Better Business, Better World: The Report of the Business and Sustainable Development Commission. Business and Sustainable Development Commission, (January). Retrieved from http://report.businesscommission.org/uploads/BetterBiz-BetterWorld.pdf
15 Malloch-Brown,Better Business, 2017

Grey 38
Table 13: Sustainable versus Transactional Strategizing Company versus Competitor Analysis
1. Sustainable strategizing companies improved 16.87% over competitors
2. Transactional strategizing companies deteriorated (-70.8%) over competitors.

Grey 39
5 Exploring Sustainability in Graduate Business Education
Given the findings of this paper on the positive outcome of the
rational strategizing process with the most significant impact coming
from sustainable strategizing and implementation, this section comes
out with recommendations on the application of the sustainability
features of the Triple Bottom Line Parameters on graduate business
education through the lens of the change management framework of
the Leader, the Strategy, and the organization.
5.1. Embed Sustainability in the Change Management Framework
The findings point to the need to embed sustainability in the
components of change management in graduate business education,
viz., the Leader (Change Agent), the Strategy (Change Element), and
the Organization (Change Target)
5.1.1. Leader
The paper showed that the transformational leader generates the
best outcome (vs. the laissez-faire and transactional leader). While
the literature review shows that the transformational leader has a
sustainable mindset the literature also points out that the sustainability

Grey 40
mindset is not an inborn trait among leaders and has to be developed.
Using the input-process-output process diagram in Table 4, training
and developing leaders for sustainability involves inputs from the Self
and from a Coach. The inputs from the Self involves coming out with
a Personal Mission with a spirituality dimension that aligns with a
universal mission on sustainability. The inputs from the
Coach/Trainor/Facilitator are the provision of training on Sustainable
content, messages, development of sustainable habits, and sustainable
learning methods. These learning methods can be self-directed
learning, reactive learning, reflective learning, and social learning.
The features attributed to sustainable leadership are the sustainable
mindset of systems thinking, innovative thinking, and being
orientation; the sustainable attitudes of introspection, persistence,
entrepreneurial, learner-oriented, positive, inspiring, communication,
engaging, and implementation orientation coupled with sustainable
responsibility, knowledge, and skills. 16
The Business & Sustainable Development Commission (BSDC)
has identified 6 actions for leaders to take.17
16 Rimanoczy, A Matter of Being, 9517 Malloch-Brown,Better Business, 2017

Grey 41
1. Build support for the right growth strategy.
2. Incorporate the Global Goals into company strategy.
3. Drive the transformation to sustainable markets with sector
peers.
4. Work with policy-makers to pay the true cost of natural and
human resources.
5. Push for a financial system oriented towards longer-term
sustainable investment.
6. Rebuild the Social Contract.
5.1.2. Strategy
5.1.2.1 Embed sustainability in the entire Fred David Framework
The sustainability concepts may be embedded in the rational
strategizing framework of Fred David in the aspect of Mission
Statement Formulation, Industry Analysis, General Environment
Analysis, Company Analysis, Strategy Formulation, Prioritization of
Strategies, and Strategy Evaluation and Control using the Balanced
Scorecard and Strategy Map.
5.1.2.1.1 Mission Statement Formulation

Grey 42
While the STRAMA papers have the component of sustainability
(viz., concern for survival and growth, nation-building), concern for
sustainability is not explicit. The UN Sustainable Development Goals
has pointed out 17 goals for sustainable development18 viz., no
poverty; zero hunger; good health & well-being; quality education;
gender equality; clean water & sanitation; affordable & clean energy;
decent work & economic growth; industry, innovation &
infrastructure; reduced inequalities; sustainable cities & communities;
responsible consumption & production; climate action; life below
water; life on land; peace, justice & strong institutions; partnerships
for the goals. While these are on the macro level, these may be
included in the mission formulation as may be appropriate for the
business and cascaded to all levels of the organization. The business
case for sustainable development as core strategy gets much stronger
as the world achieves the Global Goals. The BSDC research shows
achieving the Global Goals in just four economic systems could open
60 market “hot spots” worth an estimated US$12 trillion by 2030 in
business savings and revenue. The total economic prize from
implementing the Global Goals could be 2-3 times bigger, assuming
18 Malloch-Brown, Better Business, 2017

Grey 43
that the benefits are captured across the whole economy and
accompanied by much higher labor and resource productivity.19
5.1.2.1.2 Industry and General Environment and Company
Analysis
The process of external environment analysis which involves the
Social, Technological, Environmental, and Political (STEP) trends
should take advantage of the BSDC’s findings that four economic
systems, viz., food & agriculture, cities, energy & materials, health &
well-being, will account for US$12 trillion by 2030 in business
savings and revenue.
The tools used for strategy formulation, viz., External Factor
Evaluation (EFE) Matrix, Porter’s Competitive Forces, Competitive
Profile Matrix (CPM) , Internal Factor Evaluation (IFE) , Strength-
Weaknesss-Opportunities-Threat (SWOT) Matrix, Strategic Position
& ACtion Evaluation (SPACE) Matrix, Boston Consulting Group
(BCG Matrix) Analysis, Internal-External (IE) Matrix, Grand
Strategy Matrix, and the Quantitative Strategic Planning Matrix
19 Malloch-Brown, Better Business, 2017

Grey 44
(QSPM) should embed sustainability as may be appropriate forming a
“shadow” parallel analysis when using these tools.
5.1.2.1.3 Strategy Evaluation and Control using the Balanced Scorecard and Strategy Map
The implementation of sustainable strategy should be measured
with a sustainable balanced scorecard. In Frank Figge, Tobias Hahn,
Stephan Schalteger, and Marcus Wagner’s paper on The
Sustainability Balanced Scorecard, it is suggested that the TBL
framework be integrated into the balanced scorecard by adding social
and environmental components into the financial perspective, the
customer perspective, internal business processes, and learning &
growth20
5.1.2.2 Adapt Sustainability Strategizing Methodologies in
STRAMA Course
20 Figge, F., Hahn, T. Schalteger, S., Wagner M. The Sustainability Balanced Scorecard-Theory and Application of a Tool for Value-Based Sustainability Management. Center for Sustainability Management, University of Lueneberg, Scharnhorststr. 1,D-21335, Luneburg, Germany. Paper presented at the Greening of Industry Network Conference, Gothenburg. “Corporate Social Responsibility-Governance for Sustainability”

Grey 45
Scanning the various strategizing methodologies, there are two that
have sustainability features, viz., W. Chan Kim & Renee
Mauborgne’s the Blue Ocean Strategy21 and Alexander Osterwalder
& Yves Pigneur’s Business Model Canvas.22
The Blue Ocean Strategy which may be considered “right” brain as
it encourages “innovative” or creative thinking to expand boundaries
of red oceans into blue oceans, can be incorporated into the Fred
David methodology particularly in the Competitive Profile Matrix.
The sustainability element inherent in the Blue Ocean Strategy lies in
its Four Actions Framework (Reduce-Create-Raise-Eliminate as
shown in Figure 4.
21 Kim, W., Mauborgne, R., (2005) Blue Ocean Strategy: How to Create Uncontested Market Space and Make Competition Irrelevant, Boston: Harvard Business Press
22 Osterwalder, A.& Pigneur, Y, Businees Model Generation: A Handbook for Visionaries, Game Changers and Challengers, 2010, John Wiley & Sons, Inc

Grey 46
Adapted from Kim & Maugborgne (2005)
Figure 4: The Four Actions Framework (Reduce-Create-Raise-Eliminate) of the Blue Ocean Strategy
Blue Ocean Strategy is about simultaneously increasing value
while reducing cost. This is achieved by identifying which elements
of the Value Proposition can be Eliminated, Reduced, Raised, or
Newly Created. The first goal is to lower costs by eliminating or
reducing less valuable features or services. The second goal is to

Grey 47
enhance or create high value features or services that do not
significantly increase the cost base.
In Fred David’s CPM Matrix, the Critical Success Factors used by
the industry to gauge competitiveness among the industry players can
be modified to accommodate the Four Actions Framework by
changing the ratings per Critical Success Factor (scaled from 1-4 with
4 having the highest score). For instance, if the company wants to
eliminate a factor, the rating should be 0 relative to the industry curve.
The Business Model Canvas of Osterwalder can also be
incorporated into the STRAMA paper as a summary sheet which
draws from the information found in the STRAMA paper,viz., Key
Partners, Key Activities, Key Resources, Value Proposition,
Customer Relationships, Channels, Customer Segments, Cost
Structure, and Revenue Streams as shown in Figure 5.

Grey 48
Adapted from Osterwalder, Business Model Generation (2010) www.businessmodelgeneration.com
Figure 5: Business Model Canvas
The Four Actions Framework can in turn be blended into the
Business Model Canvas. By asking questions from the Four Actions
Framework about each Business Model building block, one can
immediately recognize implications on both the cost side and value
side of the Business Model Canvass
5.1.2.3 Embed Sustainability in the Curriculum
Since the STRAMA course is an integrative course that
synthesizes the various management disciplines of Finance,

Grey 49
Management Accounting, Operations, Information Technology,
Human Resource, Marketing, Leadership, and Ethics, the sustainable
concepts must similarly embedded in the core MBA subjects. Cases
that raises awareness and critical thinking about sustainability could
be incorporated into core management disciplines as may be
appropriate to the course.
5.1.3. Organization
Graduate Business Education organizations should inculcate the
sustainability culture by creating metrics that involve the TBL. The
inculcation of the metrics could take into consideration the prevalence
of 5 new business models across the 12 business themes to achieve
the UN Goals. The BSDC identified the following new business
models, viz., the sharing economy, lean service model, the circular
economy, big data machine learning, and new social enterprise
business models. The identified 12 business themes were: mobility
systems; new healthcare solutions; energy efficiency; affordable
housing; clean energy; circular economy manufacturing; agricultural
solutions; healthy lifestyles; food loss & waste; urban infrastructure;
building solutions; forest ecosystem services.23
23 Malloch-Brown, Better Business, 2017

Grey 50
5.1.3.1 Create a Center of Excellence on Sustainability to plan,
implement, and monitor progress on a continuous improvement basis.
Along the line of these creating a TBL culture, AGSB has
formulated sustainable punch lines in its mission statement like “Our
Country is Our Business”, “The Purpose of Business is not just for
profits but to build the nation,” and “Serve by Leading, Lead by
Serving”.
5.2 Collaboration Among Academe, Business, Government and
Community Sectors for Sustainability
The academe is only one leg in the equation of sustainability. The
Business sector where the sustainable strategies take effect should do
its part to ensure the TBL implementation in the supply chain and
partner relationships, customer relationships, internal business
processes, and human resource training on sustainability The
Government should come out with the appropriate regulations as well
as apply the TBL framework in the operations of all its agencies. The
community where the companies operate should also take part as well

Grey 51
by vigilance in seeing to it that environmental damage is minimized if
not eliminated.
5.3 Continuous Improvement Program
There should also be a constant improvement program on the
strategizing process and periodic scanning of new strategizing
methodologies which may be blended with the AGSB rational
strategizing process While the paper focused on the effectiveness of
rational strategizing and exploring sustainability in graduate business
education, the collateral benefit was to come out with a template for
measuring sustainability in strategic management. While applied to
business operating in the Philippines, further studies can be done to
compare this experience with other emerging markets as well as the
more developed economies. Moreover, other business schools can
adopt the template and can compare their experiences thus elevating
higher education to a new level. With the shift of the global
economic growth towards Asia and emerging markets like the
Philippines, the paper study provides a strategic framework for
spurring business growth which promotes the social good and
sustainability.

Grey 52

Grey 53
Bibliography
[Interview by M. Lagace]. (2004). “Q & A with HBS Professor Robert S. Kaplan“, (Working Knowledge for Business Leaders. Harvard Business School).
Adriaans, P., & Zantinge. D. (1996). Data Mining. Addison Wesley Longman Limited.
Allen, L., DeLong, & Saunders, A. (2003). “Issues in the Credit Risk Modeling of Retail Markets“. NYU Stern School of Business Working Paper No. FIN-03-007. http://dx.doi.org/10.2139/ssrn.412520
Altman, E. I. (1968). “Financial Ratios, Discriminant Analysis and the Prediction of Corporate Bankruptcy“. The Journal of Finance.
Altman, E. I. (1993). Corporate Financial Distress and Bankruptcy (Vol. ), Chapter 3). New York: John Wiley & Sons.
Altman, E. I. (2000, July). “Predicting Financial Distress of Companies: Revisiting the Z-Score and ZETA® Models“. Retrieved from https://scholar.google.com.ph/scholar?q=Altman, E. %E2%80%9CPredicting Financial Distress of Companies: Revisiting the Z-Score and ZETA%C2%AE Models&hl=en&as_sdt=0&as_vis=1&oi=scholart&sa=X&ved=0ahUKEwiu9Kbo_4zTAhUDso8KHXtFDQQQgQMIGTAA
Altman, E. I. (2002a). “Managing Credit Risk: A Challenge for the New Millennium“. Economic Notes by Banca Monte dei Paschi de Siena SpA, 31(2), 201-214.
Altman, E. I. (2002b). “Revisiting Credit Scoring Models in a Basel 2 Environment“. London Risk Books.Stern School of Business, New York University. This paper was originally prepared for the following publication, Ong, M. "Credit Rating Methodologies, Rationale and Default Risk" London Risk Books 2002

Grey 54
Altman, E. I. (2002c). “Corporate Distress Prediction Models in a Turbulent Economic and Basel II Environment. ”, Stern School of Business, New York University.
Altman, E. I. (n.d.). “The Use of Credit Scoring Models and the Importance of a Credit Culture“. Stern School of Business, New York University. Retrieved from https://www.coursehero.com/file/6226451/Z-Score-of-Altman/.
Altman, E., & Altman, R. (1968). “Financial Ratios, Discriminant Analysis and the Prediction of Corporate Bankruptcy“. Journal of Finance.
Altman, E., Haldeman, R., & Naranayan, P. (1977).“ Zeta Analysis: A New Model to Identify Bankruptcy Risk of Corporations“. Journal of Banking & Finance, 1.
Anderson, R. (2007). The Credit Scoring Toolkit: The Theory and Practice of Retail Credit Risk Management and Decision Automation (ISBN: 9780199226405ed.). Oxford University Press.
Bell, L. & Smith, A. “Creatures that by a Rule in Nature Teach the Act of Order (Henry V Act 1 Scene2): A Case Study of Sustainable Transformational Leadership in a Challenging School“, in ed. Papa, R. & Sarti A. Building for a Sustainable Future in our Schools Brick by Brick. Springer International Publishing Switzerland 2017 DOI 10.1007/978-3-319-12403-2, 171
Carruthers, B. G., & Cohen, B. (2006). “The Mechanization of Trust: Credit Rating in 19th c. America“. Department of Sociology, Northwester University.
Chuvakhin, N., & Gertmenian, W. I. (n.d.). “Bankruptcy Prediction in the Worldcom Age“. Retrieved from http://ncbase.com/papers/BP.pdf

Grey 55
David, F. R. (2009). Strategic Management: Concepts & Cases (9th ed.). Pearson Education.
Grey, G. “Rational Strategizing of Philippine Companies: Implications for Sustainability“, published in the proceedings of the International Business and Information Conference, Hiroshima, Japan, July 4-6, 2017
Figge, F., Hahn, T. Schalteger, S., Wagner M. “The Sustainability Balanced Scorecard-Theory and Application of a Tool for Value-Based Sustainability Management“. Center for Sustainability Management, University of Lueneberg, Scharnhorststr. 1,D-21335, Luneburg, Germany. Paper presented at the Greening of Industry Network Conference, Gothenburg. “Corporate Social Responsibility-Governance for Sustainability”
Kim, W., & Mauborgne, R., (2005) Blue Ocean Strategy: How to Create Uncontested Market Space and Make Competition Irrelevant, Boston: Harvard Business Press
Loshin, D. (2003). Business Intelligence: The Savvy Manager’s Guide (ISBN: 1-55860-916-4). Morgan Kaufmann.
Malloch-Brown, L. (2017).“Better Business, Better World: The Report of the Business and Sustainable Development Commission“. Business and Sustainable Development Commission,(January). Retrieved from http://report.businesscommission.org/uploads/BetterBiz-BetterWorld.pdf
Morato, E.,(2006) Strategic Planning and Management: Strategizing, Organizing, and Implementing, Singapore: Pearson Education South Asia Pte Ltd.
Mukkamala, S., Vieira, A. S., & Sung, A. H. (n.d.). Model Selection and Feature Ranking for Financial Distress Classification. Dept. of Computer Science, New Mexico Tech, Socorro, and ISEP and Computational Physics Center, University of Coimbra, Coimbra,

Grey 56
Portugal. Retrieved from http://www.academia.edu/25892429/Model_selection_and_feature_ranking_for_financial_distress_classification
Nadgrodkiewicz, A.,“ In Search of Transformational Leadership on Sustainability“ Posted on 19 December, 2013 by Anna Kompanek http://www.cipe.org/blog/2013/12/19/in-search-of-transformational-leadership-on-sustainability/#.WRfChZKGPMw accessed May 14, 2017
Osterwalder, A., & Pigneur, Y. (2010). Businees Model Generation: A Handbook for Visionaries, Game Changers and Challengers. John Wiley & Sons, Inc.
Radomska, J. (2015). “The Concept of Sustainable Strategy Implementation“. Sustainability, 7, 15847-15856. doi:10.3390/su7121579
Rimanoczy, I., “A Matter of Being: Developing Sustainability-Minded Leaders“, Journal of Management for Global Sustainability,95 vol. 2, Issue 1,2014
Rowold, J.,“Multifactor Leadership Questionnaire: Psychometric Properties of the German Translation, 2005. University of Muenster, Germany, Published by Mindgarden, Inc.
Slafer, T. F., & Hall, T. J. (n.d.).“The Triple Bottom Line: What Is It and How Does It Work?“ Retrieved February 10, 2017, from Http://www.ibrc.indiana.edu/ibr/2011/spring/article2.html
Transformational leadership From Wikipedia, the free encyclopedia https://en.wikipedia.org/wiki/Transformational_leadership accessed May 14, 2017
Triple Bottom Line. (n.d.). Retrieved February 20, 2017, from https://en.wikipedia.org/wiki/Triple_bottom_lin

Grey 57
Visser, W.& Courtice, P.,“ Sustainability Leadership: Linking Theory & Practice“. SSRN Working Paper Series 21 October 2011. Report also presented in the CPSL 2011 Report entitled A Journey of a Thousand Miles: The State of Sustainability Leadership 2011

Grey 58
Acknowledgements
To raise the research capability of AGSB, a Research Unit headed
by the former Dean Alberto Buenviaje (current Dean is Rodolfo P.
Ang) with selected members of the faculty was created. Dr. Carol S.
Guina was appointed as the research advisor to the Dean. The thrust
of the Research Unit among other things is to publish research papers
written by AGSB faculty members and participate in research
conferences. This paper on the “Effectiveness of Rational
Strategizing” is part of the AGSB Research Unit’s initiative to award
research grants to faculty members. The paper was peer reviewed by
Dr. Epitectus Patalinghug, Dr. Eduardo A. Morato,Jr. and Dr. Carol
Guina, with the participation of faculty members Ric Palo and Winnie
Constantino. Research assistance was provided by the research staff
of the Research Unit, particularly Anna Medrano and Ysa Cayabyab
and the student researchers of the Research Unit. Continuing
mentoring was also provided by Dr. Maria Cristina G. Bautista.
About the Author
Gary A. Grey, MBM is a faculty member of the Ateneo Graduate
School of Business, Ateneo de Manila University where he teaches

Grey 59
Information Technology, Business Intelligence, E-Marketing,
Technopreneurship, and E-Commerce and in the Ateneo School of
Medicine and Public Health where he teaches Health Informatics. He
is also a consultant of Vision Analytics, Inc., a software
development company engaged in creating optimal decision-making
systems and intelligent process support software for the global
market.. He recently completed a research dissertation on
“Effectiveness of Rational Strategizing” for eventually acquiring a
PhD. He completed his Masters in Business Management at the
Asian Institute of Management (1974). He took up undergraduate
studies at De La Salle University where he graduated Magna Cum
Laude major in Economics in 1972. He served in the banking
community for the last 26 years with stints in Union Bank of the
Philippines, Bancom Development Corporation, and PCIBank (now
Banco de Oro).
Contact Details:
Ateneo Graduate School of Business, Ateneo de Manila University
# 20 Rockwell Drive, Rockwell Center, Makati City,1200
Philippines

Grey 60
Word count: 8,156


