· Web view*Adjusted for age, sexe, AST, ALT, GGT, albumin, total bilirubin, glomerular...
38
Supplementary material Supplementary Table 1. HCC Characteristics according to SVR a Characteristics All patients (n = 1323) Patients with virological status (n = 1291) Patients with SVR [n = 653 (50.6%)] Patients without SVR [n = 638 (49.4%)] P- value b Number of HCC patients 186 (14.1) 182 (14.1) 28 (4.3) 154 (24.1) < .00 1 Tumour type Uninodular 108 (63.9) 107 (64.5) 16 (61.5) 91 (65.0) 2 or 3 nodules 44 (26.0) 44 (26.5) 9 (34.6) 35 (25.0) .41 > 3 nodules 10 (5.9) 10 (6.0) 0 10 (7.1) Infiltrating 7 (4.2) 5 (3.0) 1 (3.9) 4 (2.9) MD 17 16 2 14 Diameter of largest nodule (mm) ≤ 20 86 (56.2) 85 (55.9) 17 (68.0) 68 (53.6) 21-30 36 (23.5) 36 (23.7) 5 (20.0) 31 (24.4) 31-50 16 (10.5) 16 (10.5) 1 (4.0) 15 (11.8) .60 > 50 15 (9.8) 15 (9.9) 2 (8.0) 13 (10.2) MD 33 30 3 27 Portal thrombosis 14 (8.6) 14 (8.8) 2 (7.7) 12 (9.0) 1.00 MD 24 22 2 20 Within Milan criteria 132 (80.0) 131 (80.9) 23 (88.5) 108 (79.4) .28 1 nodule ≤ 50 mm 99 98 15 83 2 ou 3 nodules ≤ 30 mm 33 33 8 25 Outside Milan criteria 33 (20.0) 31 (19.1) 3 (11.5) 28 (20.6) MD 21 20 2 18 AFP level at HCC diagnosis (ng/mL) Median [Q1- Q3] 15.5 [7.0 – 90.2] 15.1 [6.7 – 90.1] 4.2 [3.0 – 9.4] 19.6 [9.0 – 99.8] < .00 1 > 200 ng/mL 19 (14.3) 18 (13.6) 1 (5.3) 17 (15.0) .47 MD 53 50 9 41 Time of last imaging examination before HCC diagnosis (months) 6.5 [5.6 – 9.1] 6.5 [5.6 – 9.1] 6.3 [5.8 – 8.7] 6.6 [5.6 – 9.2] .81 HCC treatment c .35 - Curative intent 113 (68.5) 112 (69.1) 20 (76.9) 92 (67.6) Transplantation 12 (7.3) 12 (7.4) 1 (3.9) 11 (8.1) Resection 27 (16.4) 26 (16.1) 5 (19.2) 21 (15.4) Ablation 80 (48.5) 80 (49.4) 14 (53.8) 66 (48.5) - Palliative intent or no treatment 52 (31.5) 50 (30.9) 6 (23.1) 44 (32.4) TACE 23 (13.9) 23 (14.2) 4 (15.4) 19 (14.0) Other palliative approach 7 (4.2) 7 (4.3) 1 (3.8) 6 (4.4) Biotherapy 9 (5.5) 9 (5.6) 1 (3.8) 8 (5.9) Best supportive care 12 (7.3) 11 (6.8) 0 11 (8.1) No treatment 1 (0.6) 1 (0.6) 0 1 (0.7) 1
Transcript of · Web view*Adjusted for age, sexe, AST, ALT, GGT, albumin, total bilirubin, glomerular...

Supplementary material
Supplementary Table 1. HCC Characteristics according to SVRa
Characteristics All patients(n = 1323)
Patients with virological status
(n = 1291)
Patients withSVR
[n = 653 (50.6%)]
Patients without SVR
[n = 638(49.4%)]
P-valueb
Number of HCC patients 186 (14.1) 182 (14.1) 28 (4.3) 154 (24.1) < .001Tumour type Uninodular 108 (63.9) 107 (64.5) 16 (61.5) 91 (65.0) 2 or 3 nodules 44 (26.0) 44 (26.5) 9 (34.6) 35 (25.0) .41 > 3 nodules 10 (5.9) 10 (6.0) 0 10 (7.1) Infiltrating 7 (4.2) 5 (3.0) 1 (3.9) 4 (2.9) MD 17 16 2 14
Diameter of largest nodule (mm) ≤ 20 86 (56.2) 85 (55.9) 17 (68.0) 68 (53.6) 21-30 36 (23.5) 36 (23.7) 5 (20.0) 31 (24.4) 31-50 16 (10.5) 16 (10.5) 1 (4.0) 15 (11.8) .60 > 50 15 (9.8) 15 (9.9) 2 (8.0) 13 (10.2) MD 33 30 3 27Portal thrombosis 14 (8.6) 14 (8.8) 2 (7.7) 12 (9.0) 1.00 MD 24 22 2 20 Within Milan criteria 132 (80.0) 131 (80.9) 23 (88.5) 108 (79.4) .28 1 nodule ≤ 50 mm 99 98 15 83 2 ou 3 nodules ≤ 30 mm 33 33 8 25 Outside Milan criteria 33 (20.0) 31 (19.1) 3 (11.5) 28 (20.6) MD 21 20 2 18
AFP level at HCC diagnosis (ng/mL) Median [Q1-Q3] 15.5 [7.0 – 90.2] 15.1 [6.7 – 90.1] 4.2 [3.0 – 9.4] 19.6 [9.0 – 99.8] < .001 > 200 ng/mL 19 (14.3) 18 (13.6) 1 (5.3) 17 (15.0) .47 MD 53 50 9 41Time of last imaging examinationbefore HCC diagnosis (months) 6.5 [5.6 – 9.1] 6.5 [5.6 – 9.1] 6.3 [5.8 – 8.7] 6.6 [5.6 – 9.2] .81
HCC treatmentc .35 - Curative intent 113 (68.5) 112 (69.1) 20 (76.9) 92 (67.6) Transplantation 12 (7.3) 12 (7.4) 1 (3.9) 11 (8.1) Resection 27 (16.4) 26 (16.1) 5 (19.2) 21 (15.4) Ablation 80 (48.5) 80 (49.4) 14 (53.8) 66 (48.5) - Palliative intent or no treatment
52 (31.5) 50 (30.9) 6 (23.1) 44 (32.4)
TACE 23 (13.9) 23 (14.2) 4 (15.4) 19 (14.0) Other palliative approach 7 (4.2) 7 (4.3) 1 (3.8) 6 (4.4) Biotherapy 9 (5.5) 9 (5.6) 1 (3.8) 8 (5.9) Best supportive care 12 (7.3) 11 (6.8) 0 11 (8.1) No treatment 1 (0.6) 1 (0.6) 0 1 (0.7) - MD 21 20 2 18
MD: missing dataa Among the 668 patients achieving SVR at end of follow-up, 15 were included in the group of patients without SVR because they developed a first HCC before achieving SVR.b SVR versus non-SVR
c Including one or a combination of several treatment procedures.
1

Supplementary Table 2. Baseline features of SVR patients according to the development of liver decompensation during follow-upa
Characteristics at inclusion Number of patientsPatients with
decompensation[n = 29 (4.5%)]
Patients without decompensation
[n = 616 (95.5%)]P–valueb
Male gender 645 19 (65.5) 411 (66.7) .89Age (years) 645 52.4 [47.3 – 60.1] 55.3 [48.4 – 62.4] .19Platelet count (103/mm3) 632 93.5 [59.5 – 164.0] 154.0 [110.0 – 202.0] < .001AST (IU/mL) 644 52.0 [36.0 – 83.0] 42.0 [28.0 – 74.0] .11ALT (IU/mL) 644 45.0 [37.0 – 84.0] 46.0 [27.0 – 96.0] .67GGT (IU/mL) 643 101.0 [52.0 – 179.0] 62.5 [36.0 – 114.0] .005Serum albumin (g/L) 643 40.5 [38.0 – 43.6] 43.0 [39.5 – 46.0] .03Bilirubin (µmol/L) 644 13.0 [10.0 – 19.2] 10.0 [7.0 – 14.7] .020Prothrombin time (%) 619 76.5 [68.0 – 81.5] 91.0 [82.0 – 100.0] < .001Creatinin (µmol/L) 639 70.7 [61.4 – 82.0] 71.0 [62.0 – 80.4] .94GFR (MDRD formula) c 639 101.1 [83.6 – 114.3] 97.5 [82.7 – 113.8] .75Past excessive alcohol consumption 612 9 (31.0) 188 (32.3) .89Ongoing alcohol consumption (g/day)
598
0 17 (65.4) 434 (75.9) <10 4 (15.4) 94 (16.4) 10 – 50 4 (15.4) 33 (5.8) .06 50 – 100 0 9 (1.6) >100 1 (3.8) 2 (0.3)Ongoing tobacco consumption 596 Never 8 (28.6) 226 (39.8) Past 9 (32.1) 128 (22.5) .38 Ongoing 11 (39.3) 214 (37.7)Substance or drug abuse 631 Never 22 (75.9) 403 (66.9) Past 7 (24.1) 196 (32.6) .50 Ongoing 0 3 (0.5)BMI 566 27.9 [26.0 – 29.8] 25.7 [23.2 – 28.9] .08Diabetes 645 7 (24.1) 93 (15.1) .19Dyslipidaemia 645 2 (6.9) 31 (5.0) .66Arterial hypertension 645 7 (24.1) 154 (25.0) .92Past history of CV events 644 2 (6.9) 42 (6.8) 1.00Past history of malignancy 644 1 (3.5) 23 (3.7) 1.00BMI: body mass index; GFR: glomerular filtration rate; CV: cardiovasculara Among the 668 patients achieving SVR at end of follow-up, 23 were not analyzed because they developed a first episode of liver decompensation before achieving SVR.b Patients with decompensation versus patients without decompensation.
c GFR = 186.3 × (creatinin (µmol/L) / 88.4)-1.154 × age-0.203 × k; k = 1 for men and k = 0.742 for women
2

Supplementary Table 3. Baseline characteristics of patients according to HCV genotype.
Characteristics All patients(n = 1323)
Number of patients
Non-genotype 3[n = 1055 (79.7%)]
Genotype 3[n = 195 (14.7%)] P-valuea
Male gender 839 (63.4) 1250 632 (59.9) 155 (79.5) < .001Age (years) 55.4 [48.9 – 64.4] 1250 56.8 [50.0 – 65.9] 50.1 [45.0 – 54.9] < .001Platelet count(103/mm3) 136.0 [96.0 – 182.0] 1229 136.0 [98.0 – 182.0] 129.5 [93.5 – 184.5] .28AST (IU/mL) 58.0 [35.0 – 92.0] 1247 62.0 [38.0 – 94.5] 51.0 [31.0 – 91.0] .010ALT (IU/mL) 63.0 [35.0 – 108.0] 1247 66.0 [38.0 – 111.0] 54.0 [31.0 – 100.0] .016GGT (IU/mL) 85.0 [47.0 – 160.5] 1247 94.0 [49.0 – 175.0] 71.0 [39.0 – 125.0] < .001Serum albumin (g/L) 41.6 [38.0 – 44.8] 1240 41.3 [38.0 – 44.6] 43.0 [39.1 – 45.6] .002Bilirubin (µmol/L) 12.0 [8.0– 16.0] 1247 12.0 [8.4 – 16.0] 10.3 [7.0 – 17.0] .035Prothrombin time (%) 89.0 [79.0 – 98.0] 1211 89.0 [79.0 – 98.0] 88.8 [79.0 – 99.0] .45Creatinin (µmol/L) 71.0 [61.9 – 81.0] 1240 71.0 [62.0 – 79.6] 73.0 [65.5 – 81.0] .56GFR (MDRD formula) b 96.7 [81.9 – 113.2] 1240 95.7 [81.2 – 112.8] 101.0 [89.5 – 116.9] .001Oesophageal varices 332 (31.0) 1015 271 (31.6) 41 (26.1) .17Anti-HBc antibodies 1243 .029 Negative 112 (57.7) 691 (65.9) 112 (57.7) Positive 82 (42.3) 358 (34.1) 82 (42.3)Positive HCV viral Load 921 (73.9) 1247 824 (78.3) 97 (50.0) < .001SVR 211 (17.0) 1247 151 (14.3) 60 (30.9) < .001HIV Co-infection 56 (4.3) 1236 43 (4.1) 9 (4.7) .71
BMI: body mass index; SVR: sustained virological response; GFR: glomerular filtration rate; CV: cardiovasculara Non-genotype 3 versus Genotype 3b GFR = 186.3 × (creatinin (µmol/L) / 88.4)-1.154 × age-0.203 × k; k = 1 for men and k = 0.742 for womenc P-value obtained by the following regroupment of modalities of variable alcohol consumption [1: “0” or “< 10”, 2: “10-50”, 3: “> 50”]
3

Supplementary Table 3. Baseline characteristics of patients according to HCV genotype (continued).
Characteristics All patients(n = 1323)
Number of patients
Non-genotype 3[n = 1055 (79.7%)]
Genotype 3[n = 195 (14.7%)] P-valuea
Past excessive alcohol consumption 406 (32.1) 1200 275 (27.2) 105 (55.6) < .001Ongoing alcohol consumption (g/day) 1160 0 918 (74.9) 730 (74.6) 136 (74.7) <10 193 (15.8) 163 (16.7) 21 (11.5) 10 – 50 91 (7.4) 67 (6.9) 21 (11.5) .08c
50 – 100 18 (1.5) 14 (1.4) 3 (1.7)
>100 5 (0.4) 4 (0.4) 1 (0.6)
Tobacco consumption 1164
Never 491 (39.9) 430 (43.8) 39 (21.4)
Past 276 (22.5) 227 (23.1) 36 (19.8) < .001 Ongoing 462 (37.6) 325 (33.1) 107 (58.8)
Substance or drug abuse 1229 Never 889 (68.5) 762 (73.6) 81 (42.0) Past 400 (30.8) 267 (25.7) 111 (57.5) < .001 Ongoing 9 (0.7) 7 (0.7) 1 (0.5)BMI (kg/m2) 25.8 [23.0 – 28.8] 1104 25.9 [23.2 – 28.9] 25.4 [22.0 – 28.4] .030BMI (class) 1104
< 25 487 (41.9) 382 (41.3) 84 (46.9) [25; 30 [ 457 (39.3) 364 (39.35) 67 (37.4) .31 ≥ 30 218 (18.8) 179 (19.35) 28 (15.6)Diabetes 253 (19.1) 1250 216 (20.5) 32 (16.4) .19Dyslipidaemia 69 (5.2) 1250 60 (5.7) 8 (4.1) .37Arterial hypertension 373 (28.2) 1250 330 (31.3) 32 (16.4) < .001Past history of CV events 115 (8.7) 1250 103 (9.8) 6 (3.1) .002Past history of malignancy 55 (4.2) 1250 49 (4.6) 6 (3.1) .33Substudy on liver biopsiesSteatosis 319 .52 0-5% 84 (26.3) 71 (26.8) 13 (24.1) 6-30% 141 (44.2) 114 (43.0) 27 (50.0) 30-60% 76 (23.8) 63 (23.8) 13 (24.1) >60% 18 (5.6) 17 (6.4) 1 (1.9)Activity 319 .08 A0 10 (3.1) 7 (2.6) 3 (5.6) A1 159 (49.8) 135 (50.9) 24 (44.4) A2 141 (44.2) 118 (44.5) 23 (42.6) A3 9 (2.8) 5 (1.9) 4 (7.4)
BMI: body mass index; SVR: sustained virological response; GFR: glomerular filtration rate; CV: cardiovasculara Non-genotype 3 versus Genotype 3b GFR = 186.3 × (creatinin (µmol/L) / 88.4)-1.154 × age-0.203 × k; k = 1 for men and k = 0.742 for womenc P-value obtained by the following regroupment of modalities of variable alcohol consumption [1: “0” or “< 10”, 2: “10-50”, 3: “> 50”
4

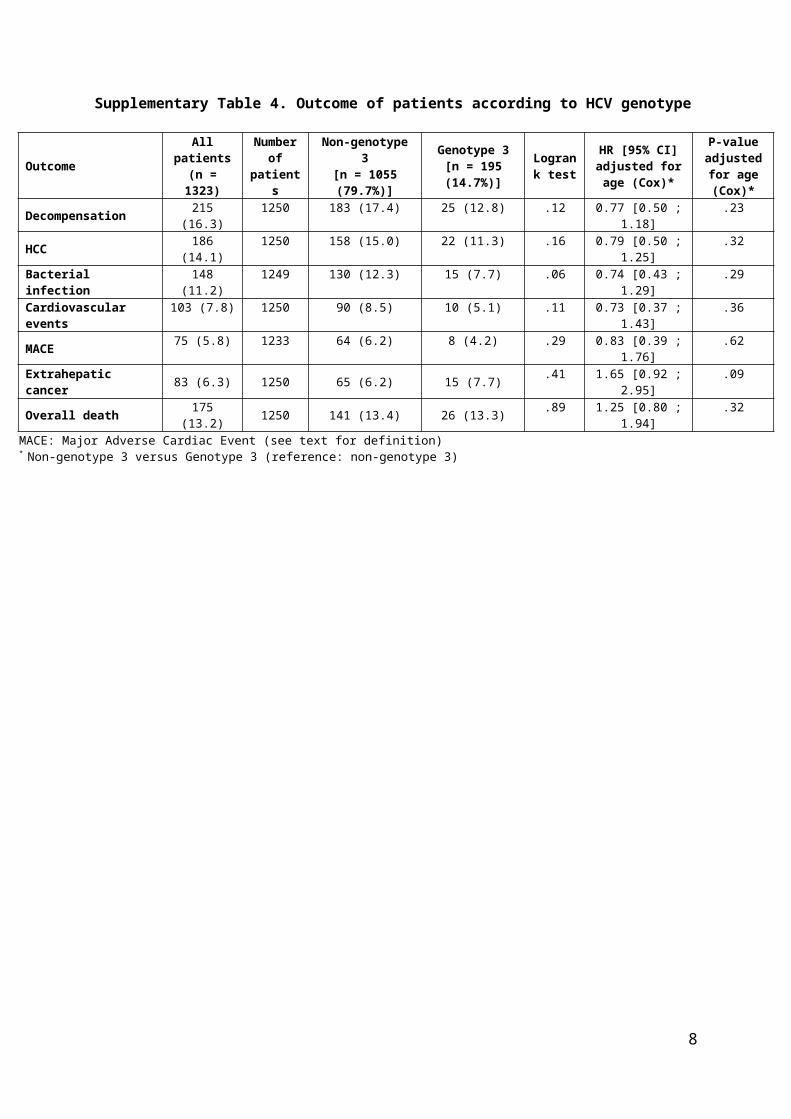
Supplementary Table 4. Outcome of patients according to HCV genotype
Outcome All patients(n = 1323)
Number of
patients
Non-genotype 3[n = 1055 (79.7%)]
Genotype 3[n = 195 (14.7%)]
Logrank test
HR [95% CI] adjusted for age
(Cox)*
P-value adjusted for age (Cox)*
Decompensation 215 (16.3) 1250 183 (17.4) 25 (12.8) .12 0.77 [0.50 ; 1.18] .23HCC 186 (14.1) 1250 158 (15.0) 22 (11.3) .16 0.79 [0.50 ; 1.25] .32Bacterial infection 148 (11.2) 1249 130 (12.3) 15 (7.7) .06 0.74 [0.43 ; 1.29] .29Cardiovascular events 103 (7.8) 1250 90 (8.5) 10 (5.1) .11 0.73 [0.37 ; 1.43] .36MACE 75 (5.8) 1233 64 (6.2) 8 (4.2) .29 0.83 [0.39 ; 1.76] .62Extrahepatic cancer 83 (6.3) 1250 65 (6.2) 15 (7.7) .41 1.65 [0.92 ; 2.95] .09Overall death 175 (13.2) 1250 141 (13.4) 26 (13.3) .89 1.25 [0.80 ; 1.94] .32
MACE: Major Adverse Cardiac Event (see text for definition)* Non-genotype 3 versus Genotype 3 (reference: non-genotype 3)
5

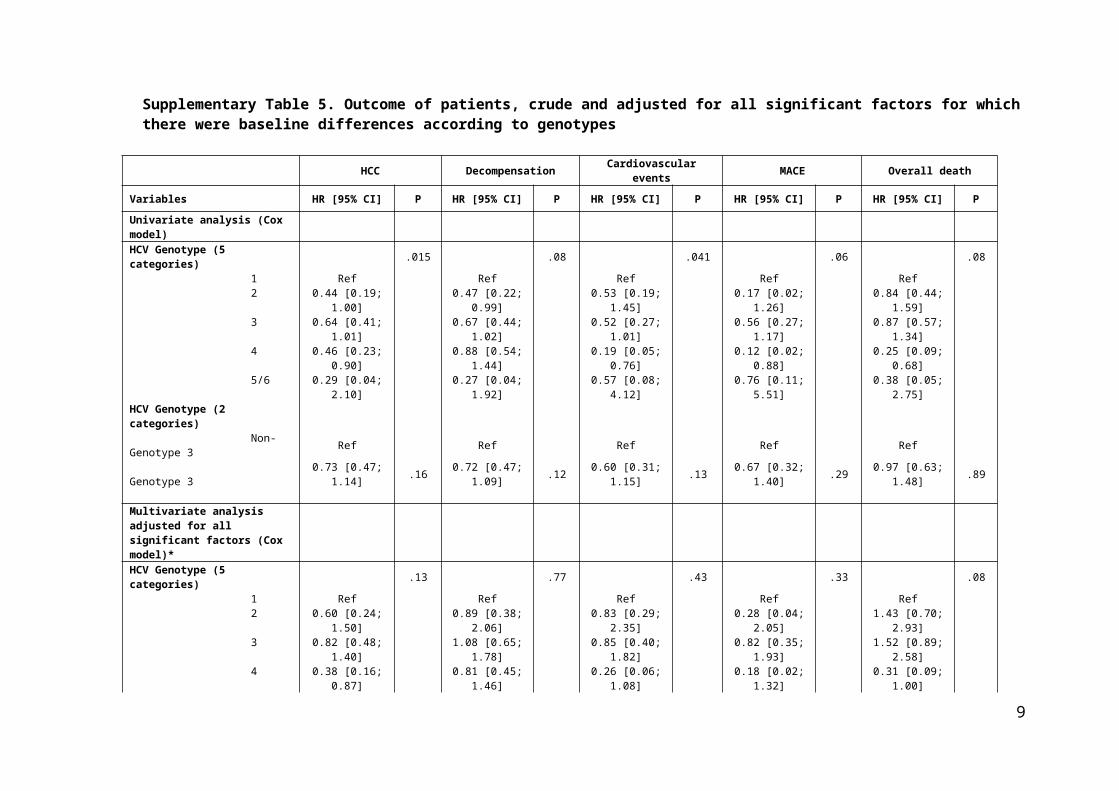
Supplementary Table 5. Outcome of patients, crude and adjusted for all significant factors for which there were baseline differences according to genotypes
HCC Decompensation Cardiovascular events MACE Overall death
Variables HR [95% CI] P HR [95% CI] P HR [95% CI] P HR [95% CI] P HR [95% CI] P
Univariate analysis (Cox model)HCV Genotype (5 categories) .015 .08 .041 .06 .08 1 Ref Ref Ref Ref Ref 2 0.44 [0.19; 1.00] 0.47 [0.22; 0.99] 0.53 [0.19; 1.45] 0.17 [0.02; 1.26] 0.84 [0.44; 1.59] 3 0.64 [0.41; 1.01] 0.67 [0.44; 1.02] 0.52 [0.27; 1.01] 0.56 [0.27; 1.17] 0.87 [0.57; 1.34] 4 0.46 [0.23; 0.90] 0.88 [0.54; 1.44] 0.19 [0.05; 0.76] 0.12 [0.02; 0.88] 0.25 [0.09; 0.68] 5/6 0.29 [0.04; 2.10] 0.27 [0.04; 1.92] 0.57 [0.08; 4.12] 0.76 [0.11; 5.51] 0.38 [0.05; 2.75]HCV Genotype (2 categories) Non-Genotype 3 Ref Ref Ref Ref Ref Genotype 3 0.73 [0.47; 1.14] .16 0.72 [0.47; 1.09] .12 0.60 [0.31; 1.15] .13 0.67 [0.32; 1.40] .29 0.97 [0.63; 1.48] .89
Multivariate analysis adjusted for all significant factors (Cox model)*HCV Genotype (5 categories) .13 .77 .43 .33 .08 1 Ref Ref Ref Ref Ref 2 0.60 [0.24; 1.50] 0.89 [0.38; 2.06] 0.83 [0.29; 2.35] 0.28 [0.04; 2.05] 1.43 [0.70; 2.93] 3 0.82 [0.48; 1.40] 1.08 [0.65; 1.78] 0.85 [0.40; 1.82] 0.82 [0.35; 1.93] 1.52 [0.89; 2.58] 4 0.38 [0.16; 0.87] 0.81 [0.45; 1.46] 0.26 [0.06; 1.08] 0.18 [0.02; 1.32] 0.31 [0.09; 1.00] 5/6 0.38 [0.05; 2.79] 0.34 [0.05; 2.53] 0.60 [0.08; 4.61] 0.70 [0.08; 5.92] 0.47 [0.06; 3.54]HCV Genotype (2 categories) Non-Genotype 3 Ref Ref Ref Ref Ref Genotype 3 0.93 [0.54; 1.59] .79 1.12 [0.69; 1.84] .64 0.98 [0.46; 2.06] .95 0.97 [0.41; 2.28] .94 1.65 [0.97; 2.78] .06
*Adjusted for age, sexe, AST, ALT, GGT, albumin, total bilirubin, glomerular filtration rate, past excessive alcohol intake, tobacco, Substance Abuse, BMI, arterial hypertension, diabetes, past history of cardiovascular events and SVR
6

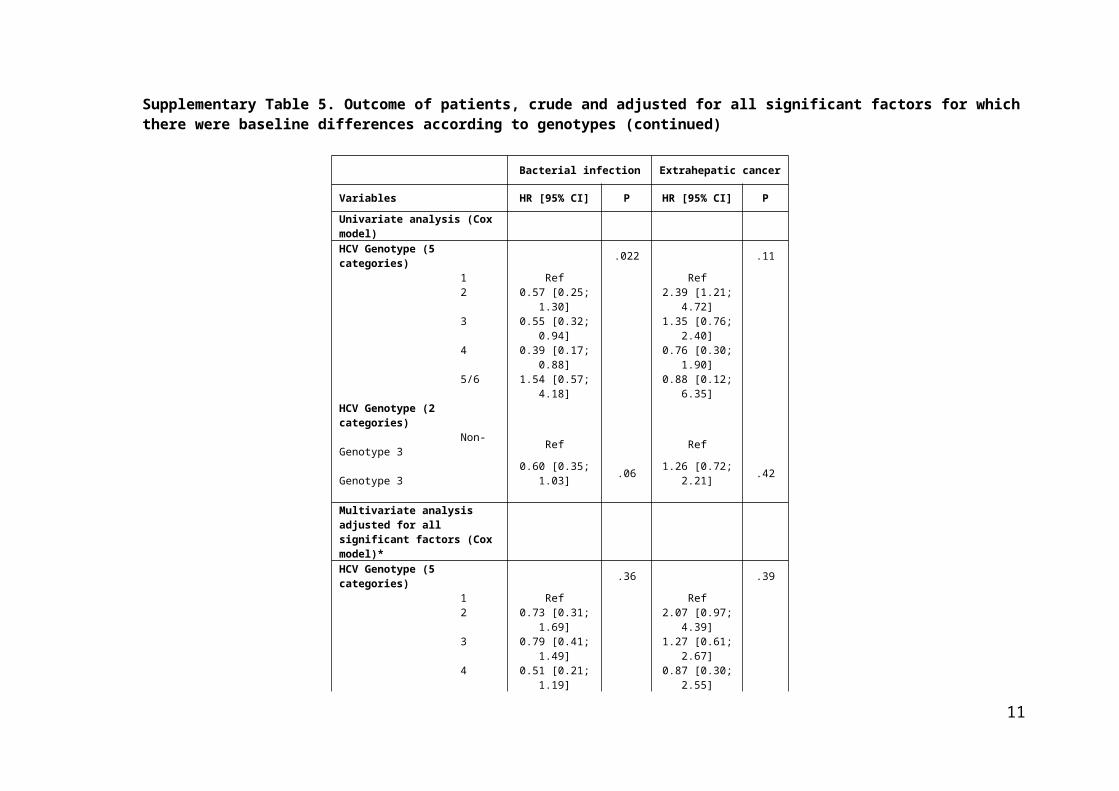
Supplementary Table 5. Outcome of patients, crude and adjusted for all significant factors for which there were baseline differences according to genotypes (continued)
Bacterial infection Extrahepatic cancer
Variables HR [95% CI] P HR [95% CI] P
Univariate analysis (Cox model)HCV Genotype (5 categories) .022 .11 1 Ref Ref 2 0.57 [0.25; 1.30] 2.39 [1.21; 4.72] 3 0.55 [0.32; 0.94] 1.35 [0.76; 2.40] 4 0.39 [0.17; 0.88] 0.76 [0.30; 1.90] 5/6 1.54 [0.57; 4.18] 0.88 [0.12; 6.35]HCV Genotype (2 categories) Non-Genotype 3 Ref Ref Genotype 3 0.60 [0.35; 1.03] .06 1.26 [0.72; 2.21] .42
Multivariate analysis adjusted for all significant factors (Cox model)*HCV Genotype (5 categories) .36 .39 1 Ref Ref 2 0.73 [0.31; 1.69] 2.07 [0.97; 4.39] 3 0.79 [0.41; 1.49] 1.27 [0.61; 2.67] 4 0.51 [0.21; 1.19] 0.87 [0.30; 2.55] 5/6 1.72 [0.60; 4.90] 0.75 [0.10; 5.74]HCV Genotype (2 categories) Non-Genotype 3 Ref Ref Genotype 3 0.85 [0.45; 1.61] .63 1.17 [0.57; 2.41] .66
*Adjusted for age, sexe, AST, ALT, GGT, albumin, total bilirubin, glomerular filtration rate, past excessive alcohol intake, tobacco, Substance Abuse, BMI, arterial hypertension, diabetes, past history of cardiovascular events and SVR
7
Supplementary Table 6. Baseline characteristics of patients according to PI intake.
Baseline Characteristics All patients(n = 1323)
Number of patients
No PI intake[n = 1044 (78.9%)]
PI intake[n = 279 (21.1%)] P-value a
Male gender 839 (63.4) 1323 645 (61.8) 194 (69.5) .017Age at PI intake (years) 55.4 [48.9 – 64.4] 1323 55.8 [49.2 – 65.5] 56.4 [50.0 – 63.8] .96Platelet count(103/mm3) 136.0 [96.0 – 182.0] 1301 138.0 [96.0 – 182.5] 131.0 [98.0 – 182.0] .55AST (IU/mL) 58.0 [35.0 – 92.0] 1320 55.0 [33.0 – 90.0] 66.0 [42.0 – 105.0] < .001ALT (IU/mL) 63.0 [35.0 – 108.0] 1320 58.0 [33.0 – 101.0] 83.0 [47.0 – 127.0] < .001GGT (IU/mL) 85.0 [47.0 – 160.5] 1320 81.0 [43.0 – 151.0] 107.0 [65.0 – 186.0] < .001Serum albumin (g/L) 41.6 [38.0 – 44.8] 1312 41.7 [38.0 – 44.9] 41.5 [38.3 – 44.2] .99Bilirubin (µmol/L) 12.0 [8.0– 16.0] 1320 12.0 [8.0 – 17.0] 11.0 [8.0 – 16.0] .78Prothrombin time (%) 89.0 [79.0 – 98.0] 1282 88.0 [79.0 – 98.0] 90.0 [81.0 – 97.0] .14Creatinin (µmol/L) 71.0 [61.9 – 81.0] 1313 71.0 [62.0 – 81.0] 69.8 [61.0 – 79.0] .25GFR (MDRD formula) b 96.7 [81.9 – 113.2] 1313 95.6 [81.7 – 111.8] 100.5 [83.6 – 117.1] .007Oesophageal varices 332 (31.0) 1071 265 (31.5) 67 (29.1) .49
BMI: body mass index; PI : Protease Inhibitor; GFR: glomerular filtration rate; CV: cardiovasculara No PI intake versus PI intakeb GFR = 186.3 × (creatinin (µmol/L) / 88.4)-1.154 × age-0.203 × k; k = 1 for men and k = 0.742 for women
8
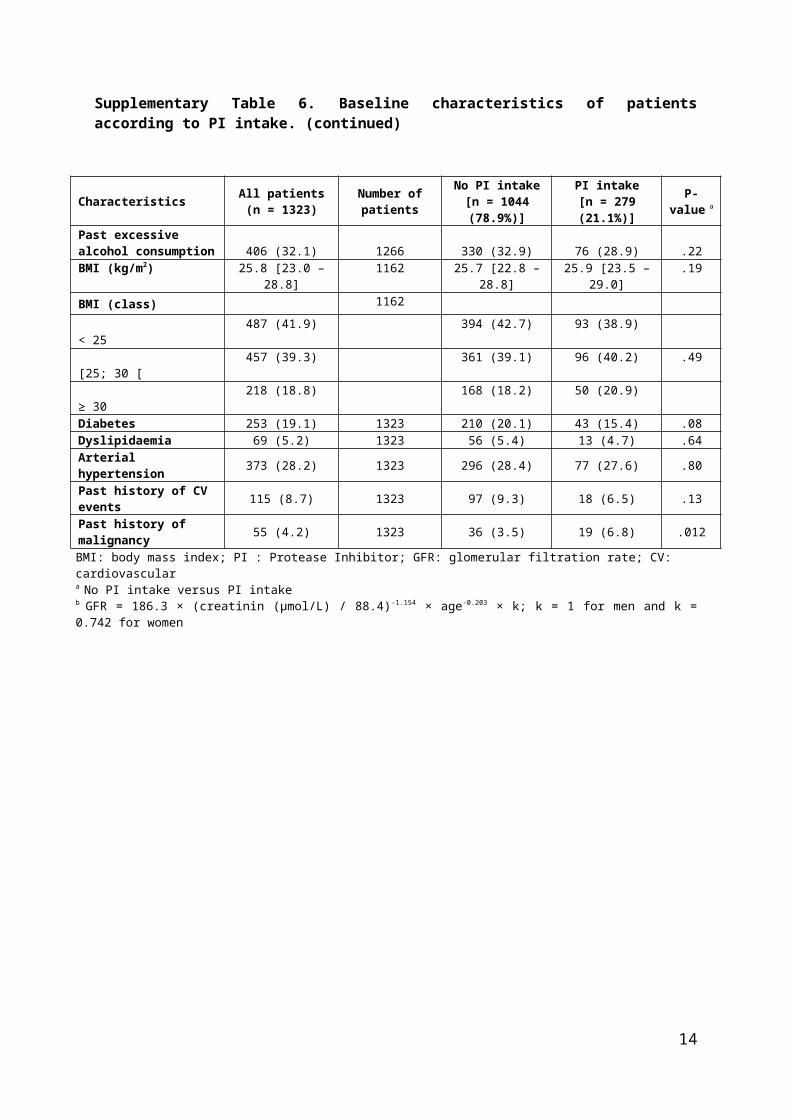
Supplementary Table 6. Baseline characteristics of patients according to PI intake. (continued)
Characteristics All patients(n = 1323)
Number of patients
No PI intake[n = 1044 (78.9%)]
PI intake[n = 279 (21.1%)] P-value a
Past excessive alcohol consumption 406 (32.1) 1266 330 (32.9) 76 (28.9) .22BMI (kg/m2) 25.8 [23.0 – 28.8] 1162 25.7 [22.8 – 28.8] 25.9 [23.5 – 29.0] .19BMI (class) 1162
< 25 487 (41.9) 394 (42.7) 93 (38.9) [25; 30 [ 457 (39.3) 361 (39.1) 96 (40.2) .49 ≥ 30 218 (18.8) 168 (18.2) 50 (20.9)Diabetes 253 (19.1) 1323 210 (20.1) 43 (15.4) .08Dyslipidaemia 69 (5.2) 1323 56 (5.4) 13 (4.7) .64Arterial hypertension 373 (28.2) 1323 296 (28.4) 77 (27.6) .80Past history of CV events 115 (8.7) 1323 97 (9.3) 18 (6.5) .13Past history of malignancy 55 (4.2) 1323 36 (3.5) 19 (6.8) .012BMI: body mass index; PI : Protease Inhibitor; GFR: glomerular filtration rate; CV: cardiovasculara No PI intake versus PI intakeb GFR = 186.3 × (creatinin (µmol/L) / 88.4)-1.154 × age-0.203 × k; k = 1 for men and k = 0.742 for women
9

Supplementary Table 7. Outcome of patients according to PI intake.
Outcome Number of patients All patients No PI intake
[n = 1044 (78.9%)]PI intake
[n = 279 (21.1%)]Logrank
testHR [95% CI],P-value (Cox)*
Decompensation 1322 212 (16.0) 180/1044 (17.2) 32/278 (11.5) .49 1.15 [0.78; 1.69], P= .49
HCC 1313 176 (13.4) 149/1044 (14.3) 27/269 (10.0) .51 1.15 [0.76; 1.76], P= .51
Bacterial infection 1322 139 (10.5) 102/1044 (9.8) 37/278 (13.3) < .001 1.92 [1.30; 2.82], P= .001
Cardiovascular events 1322 97 (7.3) 82/1044 (7.8) 15/278 (5.4) .57 1.19 [0.66; 2.14], P= .57
MACE 1305 71 (5.4) 59 (5.7) 12 (4.3) .37 1.36 [0.69; 2.68], P= .38
Extrahepatic cancer 1323 83 (6.3) 73/1044 (7.0) 10/279 (3.6) .16 0.59 [0.28; 1.24], P= .16
Overall death 1323 175 (13.2) 152/1044 (14.6) 23/279 (8.2) .36 1.24 [0.78; 1.96], P= .36
Non-liver death 1305 67 (5.1) 57/1028 (5.5) 10/277 (3.6) .48 1.29 [0.64; 2.60], P= .48
PI : Protease Inhibitor ; MACE: Major Adverse Cardiac Event (see text for definition)*No PI intake versus PI intake (reference: No PI intake)
10
Supplementary Table 8- Results of multivariate logistic regression (propensity to achieve SVR)
Features Coefficient OR [95% CI] P-value
Male gender 0.14483 1.16 [0.83 ; 1.61] .39Age -0.02123 0.98 [0.96 ; 0.99] .009Platelet count(103/mm3) 0.00524 1.01 [1.00 ; 1.01] < .001AST (IU/mL) -0.00324 1.00 [0.99 ; 1.00] .31ALT (IU/mL) 0.00046 1.00 [1.00 ; 1.00] .83GGT (IU/mL) -0.00188 0.998 [0.997 ; 0.999] .002Serum albumin (g/L) 0.06757 1.07 [1.03 ; 1.11] < .001Bilirubin (µmol/L) -0.01160 0.99 [0.97 ; 1.01] .26Prothrombin time (%) -0.01035 0.99 [0.98 ; 1.01] .10Oesophageal varices -0.32307 0.72 [0.53 ; 0.99] .045HCV genotype .07 1 0 2 0.77035 2.16 [1.10 ; 4.24] .025 3 0.40979 1.51 [0.99 ; 2.29] .06 4 -0.16764 0.85 [0.52 ; 1.38] .50 5 0.48576 1.63 [0.52 ; 5.08] .40 6 0.25045 1.28 [0.06 ; 26.32] .87Diabetes -0.22842 0.80 [0.55 ; 1.14] .22Arterial hypertension 0.09973 1.10 [0.79 ; 1.54] .56Past history of CV events -0.72361 0.48 [0.28 ; 0.83] .008CV: cardiovascular
11

Supplementary Table 9- Comparisons according to matching
Characteristics Before matching (n=1291) After matching (n=630)
Number of patients
SVR at inclusion or during follow-up
n=668
Without SVRn=623 P-value* STD Number of
patients
SVR at inclusion or during follow-up
n=315
Without SVRn=315 P-value* STD
Male gender 1291 444 (66.7) 375 (60.2) .019 0.130 630 195 (61.9) 197 (62.5) .87 -0.013Age 1291 55.7±9.7 58.1±11.2 < .001 -0.233 630 57.0±9.7 57.0±10.9 .98 -0.002Platelet count(103/mm3) 1269 158.4±70.4 130.5±56.3 < .001 0.437 630 134.3±54.5 136.4±56.6 .60 -0.038AST (IU/mL) 1288 62.2±50.1 84.7±55.1 < .001 -0.427 630 76.7±58.1 76.6±47.9 .99 0.001ALT (IU/mL) 1288 74.5±71.3 95.4±74.1 < .001 -0.287 630 89.5±80.9 88.8±68.6 .91 0.009GGT (IU/mL) 1288 106.9±133.9 162.3±164.5 < .001 -0.370 630 138.2±144.8 134.5±120.5 .67 0.027Serum albumin (g/L) 1280 42.5±4.5 40.2±4.9 < .001 0.506 630 40.9±4.2 40.9±4.8 .93 -0.006Bilirubin (µmol/L) 1288 12.4±7.2 14.9±8.7 < .001 -0.319 630 14.0±8.3 13.6±7.1 .46 0.057Prothrombin time (%) 1250 88.0±12.8 86.4±12.3 .027 0.125 630 86.5±12.1 86.4±12.4 .95 0.005Oesophageal varices 1043 136 (25.4) 184 (36.2) < .001 -0.235 630 93 (29.5) 92 (29.2) .93 0.007HCV genotype 1218 630 1 381 (62.7) 448 (73.4) -0.233 226 (71.8) 220 (69.8) 0.042 2 46 (7.6) 23 (3.8) 0.165 12 (3.8) 15 (4.8) -0.047 3 120 (19.7) 67 (11.0) < .001 0.244 39 (12.4) 45 (14.3) .85 -0.056 4 49 (8.1) 64 (10.5) -0.084 32 (10.2) 31 (9.8) 0.011 5 9 (1.5) 7 (1.1) 0.029 6 (1.9) 4 (1.3) 0.051 6 3 (0.5) 1 (0.2) 0.058 0 0 NADiabetes 1291 103 (15.4) 143 (23.0) .001 -0.192 630 60 (19.1) 65 (20.6) .61 -0.040Arterial hypertension 1291 166 (24.9) 197 (31.6) .007 -0.151 630 94 (29.8) 92 (29.2) .86 0.014Past history of CV events 1291 46 (6.9) 67 (10.8) .014 -0.137 630 26 (8.3) 21(6.7) .47 0.060
BMI: body mass index; SVR: sustained virological response; NA: non applicable; CV: cardiovascular; STD: standardized difference* SVR versus non-SVR
12

Supplementary Table 10- Impact of SVR in the paired population (univariate analysis by Cox model)
Outcome HR [95% CI]* P-value
Decompensation 0.50 [0.30; 0.84] .009
HCC 0.48 [0.29; 0.80] .005
Bacterial infection 0.46 [0.22; 0.97] .043
Cardiovascular events 0.41 [0.18; 0.94] .035
MACE 0.56 [0.24; 1.31] .18
Extrahepatic cancer 1.81 [0.88; 3.73] .11Overall death 0.44 [0.25; 0.78] .005
Non-liver death 0.54 [0.21; 1.38] .20MACE: Major Adverse Cardiac Event (see text for definition)* Non-SVR versus SVR (reference: Non-SVR)
13
Supplementary Table 11. Baseline characteristics of patients according to centers size8 centers with number of patients ≤ 10 (minimum = 4, maximum =10, IQR = [6.5 – 10])27 centers with number of patients >10 (minimum = 11, maximum=165, IQR = [20 – 55])
Characteristics All patients(n = 1323)
Number of patients
Center size ≤ 10 patients
[n = 65 (4.9%)]
Center size > 10 patients
[n = 1258 (95.1%)]P-valuea
Male gender 839 (63.4) 1323 39 (60.0) 800 (63.6) .56Age (years) 55.4 [48.9 – 64.4] 1323 56.9 [51.7 – 66.2] 55.3 [48.8 – 64.2] .17Platelet count(103/mm3) 136.0 [96.0 – 182.0] 1301 138.0 [98.0 – 175.0] 136.0 [96.0 – 183.5] .59AST (IU/mL) 58.0 [35.0 – 92.0] 1320 57.0 [39.0 – 91.0] 58.0 [35.0 – 92.0] .87ALT (IU/mL) 63.0 [35.0 – 108.0] 1320 66.0 [36.0 – 108.0] 63.0 [35.0 – 108.0] .77GGT (IU/mL) 85.0 [47.0 – 160.5] 1320 103.5 [49.5 – 176.0] 85.0 [46.0 – 160.0] .29Serum albumin (g/L) 41.6 [38.0 – 44.8] 1312 42.0 [38.0 – 45.0] 41.6 [38.0 – 44.7] .96Bilirubin (µmol/L) 12.0 [8.0– 16.0] 1320 12.5 [8.0 – 18.0] 11.4 [8.0 – 16.0] .43Prothrombin time (%) 89.0 [79.0 – 98.0] 1282 88.0 [77.0 – 98.0] 89.0 [79.0 – 98.0] .64Creatinin (µmol/L) 71.0 [61.9 – 81.0] 1313 72.0 [65.0 – 83.0] 71.0 [61.9 – 81.0] .18GFR (MDRD formula) b 96.7 [81.9 – 113.2] 1313 90.8 [78.0 – 110.6] 96.9 – 82.5 – 113.5] .05Oesophageal varices 332 (31.0) 1071 24 (40.0) 308 (30.5) .12HCV genotype 1250 1 849 (67.9) 47 (75.8) 802 (67.5) 2 69 (5.5) 3 (4.8) 66 (5.6) 3 195 (15.6) 12 (19.4) 183 (15.4) .06 4 115 (9.2) 0 115 (9.7) 5 18 (1.4) 0 18 (1.5) 6 4 (0.3) 0 4 (0.3)Anti-HBc antibodies 1313 .41 Negative 846 (64.4) 45 (69.2) 801 (64.2) Positive 467 (35.6) 20 (30.8) 447 (35.8)Positive HCV viral Load 931 (70.5) 1320 45 (69.2) 886 (70.6) .81SVR 258 (19.6) 1314 12 (18.5) 246 (19.7) .81HIV Co-infection 56 (4.3) 1309 4 (6.2) 52 (4.2) .36
BMI: body mass index; SVR: sustained virological response; GFR: glomerular filtration rate; CV: cardiovasculara Center size ≤ 10 patients versus center size > 10 patientsb GFR = 186.3 × (creatinin (µmol/L) / 88.4)-1.154 × age-0.203 × k; k = 1 for men and k = 0.742 for womenc P-value obtained by the following regroupment of modalities of variable alcohol consumption [1: “0” or “< 10”, 2: “10-50”, 3: “> 50”]
14

Supplementary Table 11. Baseline characteristics of patients according to centers size (continued)8 centers with number of patients ≤ 10 (minimum = 4, maximum =10, IQR = [6.5 – 10])27 centers with number of patients >10 (minimum = 11, maximum=165, IQR = [20 – 55])
Characteristics All patients(n = 1323)
Number of patients
Center size ≤ 10 patients
[n = 65 (4.9%)]
Center size > 10 patients
[n = 1258 (95.1%)]P-valuea
Past excessive alcohol consumption 406 (32.1) 1266 16 (26.2) 390 (32.4) .32Ongoing alcohol consumption (g/day) 1225 0 918 (74.9) 44 (73.3) 874 (75.0) <10 193 (15.8) 11 (18.3) 182 (15.6) 10 – 50 91 (7.4) 4 (6.7) 87 (7.5) 1.00c
50 – 100 18 (1.5) 0 18 (1.6)
>100 5 (0.4) 1 (1.7) 4 (0.3)
Tobacco consumption 1229
Never 491 (39.9) 27 (43.6) 464 (39.76)
Past 276 (22.5) 16 (25.8) 260 (22.28) .50 Ongoing 462 (37.6) 19 (30.6) 443 (37.96)
Substance or drug abuse 1298 Never 889 (68.5) 42 (64.6) 847 (68.7) Past 400 (30.8) 23 (35.4) 377 (30.6) .68 Ongoing 9 (0.7) 0 9 (0.7)BMI (kg/m2) 25.8 [23.0 – 28.8] 1162 25.5 [22.9 – 30.4] 25.8 [23.0 – 28.7] .81BMI (class) 1162
< 25 487 (41.9) 25 (41.7) 462 (41.9) [25; 30 [ 457 (39.3) 19 (31.7) 438 (39.8) .22 ≥ 30 218 (18.8) 16 (26.7) 202 (18.3)Diabetes 253 (19.1) 1323 12 (18.5) 241 (19.2) .90Dyslipidaemia 69 (5.2) 1323 3 (4.6) 66 (5.3) 1.00Arterial hypertension 373 (28.2) 1323 16 (24.6) 357 (28.4) .57Past history of CV events 115 (8.7) 1323 8 (12.3) 107 (8.5) .29Past history of malignancy 55 (4.2) 1323 6 (9.2) 49 (3.9) .048
BMI: body mass index; SVR: sustained virological response; GFR: glomerular filtration rate; CV: cardiovasculara Center size ≤ 10 patients versus center size > 10 patientsb GFR = 186.3 × (creatinin (µmol/L) / 88.4)-1.154 × age-0.203 × k; k = 1 for men and k = 0.742 for womenc P-value obtained by the following regroupment of modalities of variable alcohol consumption [1: “0” or “< 10”, 2: “10-50”, 3: “> 50”]
15

Supplementary Table 12. Outcome of patients according to centers size8 centers with number of patients ≤ 10 (minimum = 4, maximum =10, IQR = [6.5 – 10])27 centers with number of patients >10 (minimum = 11, maximum=165, IQR = [20 – 55])
Outcome All patients(n = 1323)
Number of patients
Center size ≤ 10 patients
[n = 65 (5.0%)]
Center size > 10 patients
[n = 1231 (95.0%)]P-value* Logrank
test
Decompensation 215 (16.3) 1323 12 (18.5) 203 (16.1) .62 .98HCC 186 (14.1) 1323 10 (15.4) 176 (14.0) .75 .99Bacterial infection 148 (11.2) 1322 9 (13.9) 139 (11.1) .49 .72Cardiovascular events 103 (7.8) 1323 7 (10.8) 96 (7.6) .36 .39MACE 75 (5.8) 1305 4 (6.3) 71 (5.7) .78 .91Extrahepatic cancer 83 (6.3) 1323 6 (9.2) 77 (6.1) .29 .43Overall death 175 (13.2) 1323 13 (20.0) 162 (12.9) .10 .23
MACE: Major Adverse Cardiac Event (see text for definition)* Center size ≤ 10 patients versus center size > 10 patients
16

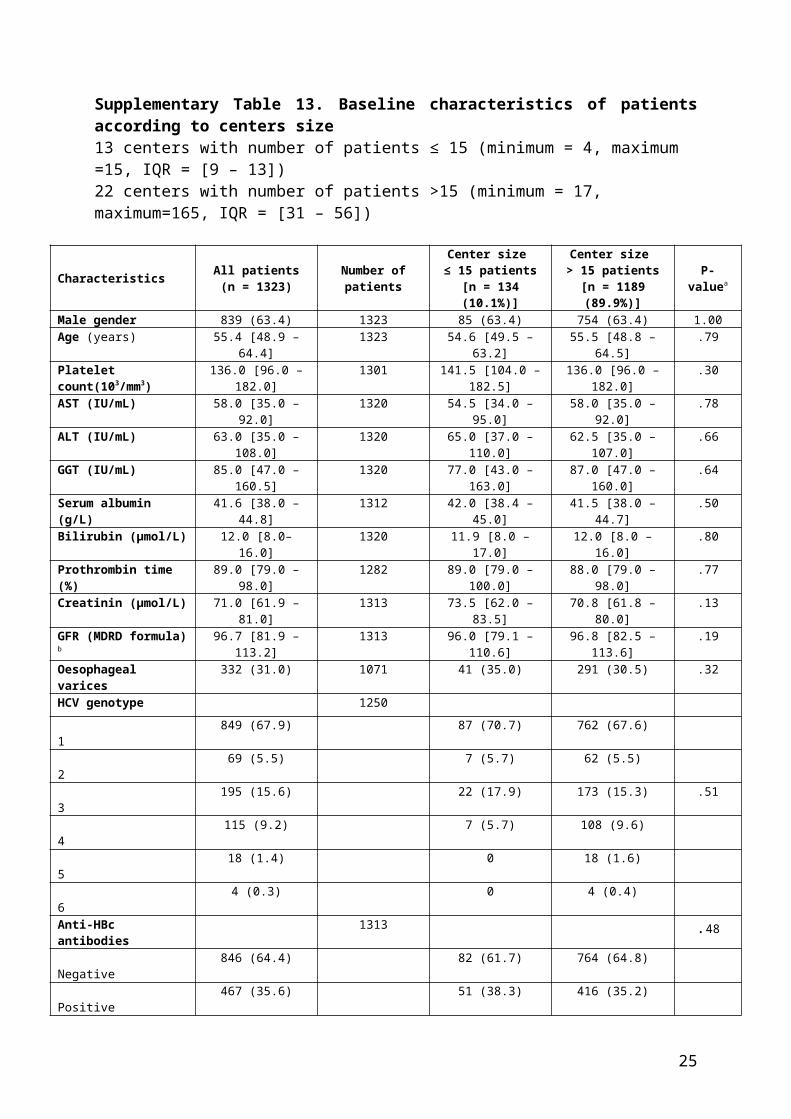
Supplementary Table 13. Baseline characteristics of patients according to centers size13 centers with number of patients ≤ 15 (minimum = 4, maximum =15, IQR = [9 – 13])22 centers with number of patients >15 (minimum = 17, maximum=165, IQR = [31 – 56])
Characteristics All patients(n = 1323)
Number of patients
Center size ≤ 15 patients
[n = 134 (10.1%)]
Center size > 15 patients
[n = 1189 (89.9%)]P-valuea
Male gender 839 (63.4) 1323 85 (63.4) 754 (63.4) 1.00Age (years) 55.4 [48.9 – 64.4] 1323 54.6 [49.5 – 63.2] 55.5 [48.8 – 64.5] .79Platelet count(103/mm3) 136.0 [96.0 – 182.0] 1301 141.5 [104.0 – 182.5] 136.0 [96.0 – 182.0] .30AST (IU/mL) 58.0 [35.0 – 92.0] 1320 54.5 [34.0 – 95.0] 58.0 [35.0 – 92.0] .78ALT (IU/mL) 63.0 [35.0 – 108.0] 1320 65.0 [37.0 – 110.0] 62.5 [35.0 – 107.0] .66GGT (IU/mL) 85.0 [47.0 – 160.5] 1320 77.0 [43.0 – 163.0] 87.0 [47.0 – 160.0] .64Serum albumin (g/L) 41.6 [38.0 – 44.8] 1312 42.0 [38.4 – 45.0] 41.5 [38.0 – 44.7] .50Bilirubin (µmol/L) 12.0 [8.0– 16.0] 1320 11.9 [8.0 – 17.0] 12.0 [8.0 – 16.0] .80Prothrombin time (%) 89.0 [79.0 – 98.0] 1282 89.0 [79.0 – 100.0] 88.0 [79.0 – 98.0] .77Creatinin (µmol/L) 71.0 [61.9 – 81.0] 1313 73.5 [62.0 – 83.5] 70.8 [61.8 – 80.0] .13GFR (MDRD formula) b 96.7 [81.9 – 113.2] 1313 96.0 [79.1 – 110.6] 96.8 [82.5 – 113.6] .19Oesophageal varices 332 (31.0) 1071 41 (35.0) 291 (30.5) .32HCV genotype 1250 1 849 (67.9) 87 (70.7) 762 (67.6) 2 69 (5.5) 7 (5.7) 62 (5.5) 3 195 (15.6) 22 (17.9) 173 (15.3) .51 4 115 (9.2) 7 (5.7) 108 (9.6) 5 18 (1.4) 0 18 (1.6) 6 4 (0.3) 0 4 (0.4)Anti-HBc antibodies 1313 .48 Negative 846 (64.4) 82 (61.7) 764 (64.8) Positive 467 (35.6) 51 (38.3) 416 (35.2)Positive HCV viral Load 931 (70.5) 1320 93 (69.4) 838 (70.7) .76SVR 258 (19.6) 1314 31 (23.1) 227 (19.1) .27HIV Co-infection 56 (4.3) 1309 5 (3.7) 51 (4.3) .74
BMI: body mass index; SVR: sustained virological response; GFR: glomerular filtration rate; CV: cardiovasculara Center size ≤ 15 patients versus center size > 15 patientsb GFR = 186.3 × (creatinin (µmol/L) / 88.4)-1.154 × age-0.203 × k; k = 1 for men and k = 0.742 for womenc P-value obtained by the following regroupment of modalities of variable alcohol consumption [1: “0” or “< 10”, 2: “10-50”, 3: “> 50”]
17

Supplementary Table 13. Baseline characteristics of patients according to centers size (continued)13 centers with number of patients ≤ 15 (minimum = 4, maximum =15, IQR = [9 – 13])22 centers with number of patients >15 (minimum = 17, maximum=165, IQR = [31 – 56])
Characteristics All patients(n = 1323)
Number of patients
Center size ≤ 15 patients
[n = 134 (10.1%)]
Center size > 15 patients
[n = 1189 (89.9%)]P-valuea
Past excessive alcohol consumption 406 (32.1) 1266 45 (35.2) 361 (31.7) .43Ongoing alcohol consumption (g/day) 1225 0 918 (74.9) 82 (65.1) 836 (76.1) <10 193 (15.8) 27 (21.4) 166 (15.1) 10 – 50 91 (7.4) 14 (11.1) 77 (7.0) .18c
50 – 100 18 (1.5) 1 (0.8) 17 (1.6)
>100 5 (0.4) 2 (1.6) 3 (0.3)
Tobacco consumption 1229
Never 491 (39.9) 45 (35.4) 446 (40.5)
Past 276 (22.5) 31 (24.4) 245 (22.2) .55 Ongoing 462 (37.6) 51 (40.2) 411 (37.3)
Substance or drug abuse 1298 Never 889 (68.5) 82 (61.7) 807 (69.3) Past 400 (30.8) 50 (37.6) 350 (30.0) .15 Ongoing 9 (0.7) 1 (0.7) 8 (0.7)BMI (kg/m2) 25.8 [23.0 – 28.8] 1162 25.5 [22.5 – 30.1] 25.8 [23.0 – 28.7] .83BMI (class) 1162
< 25 487 (41.9) 53 (43.4) 434 (41.7) [25; 30 [ 457 (39.3) 38 (31.2) 419 (40.3) .06 ≥ 30 218 (18.8) 31 (25.4) 187 (18.0)Diabetes 253 (19.1) 1323 24 (17.9) 229 (19.3) .71Dyslipidaemia 69 (5.2) 1323 5 (3.7) 64 (5.4) .42Arterial hypertension 373 (28.2) 1323 31 (23.1) 342 (28.8) .17Past history of CV events 115 (8.7) 1323 14 (10.5) 101 (8.5) .45Past history of malignancy 55 (4.2) 1323 8 (6.0) 47 (4.0) .27
BMI: body mass index; SVR: sustained virological response; GFR: glomerular filtration rate; CV: cardiovasculara Center size ≤ 15 patients versus center size > 15 patientsb GFR = 186.3 × (creatinin (µmol/L) / 88.4)-1.154 × age-0.203 × k; k = 1 for men and k = 0.742 for womenc P-value obtained by the following regroupment of modalities of variable alcohol consumption [1: “0” or “< 10”, 2: “10-50”, 3: “> 50”]
18

Supplementary Table 14. Outcome of patients according to centers size13 centers with number of patients ≤ 15 (minimum = 4, maximum =15, IQR = [9 – 13])22 centers with number of patients >15 (minimum = 17, maximum=165, IQR = [31 – 56])
Outcome All patients(n = 1323)
Number of patients
Center size ≤ 15 patients
[n = 134 (10.1%)]
Center size > 15 patients
[n = 1189 (89.9%)]P-value* Logrank
test
Decompensation 215 (16.3) 1323 22 (16.4) 193 (16.2) .96 .68HCC 186 (14.1) 1323 18 (13.4) 168 (14.1) .83 .65Bacterial infection 148 (11.2) 1322 12 (9.0) 136 (11.4) .40 .32Cardiovascular events 103 (7.8) 1323 10 (7.5) 93 (7.8) .88 .97MACE 75 (5.8) 1305 6 (4.5) 69 (5.9) .52 .58Extrahepatic cancer 83 (6.3) 1323 8 (6.0) 75 (6.3) .88 .79Overall death 175 (13.2) 1323 19 (14.2) 156 (13.1) .73 .80
MACE: Major Adverse Cardiac Event (see text for definition)* Center size ≤ 15 patients versus center size > 15 patients
19

Supplementary Table 15. Characteristics of SVR patients at baseline (inclusion or date of SVR) according to antiviral treatment.
Characteristics All SVR patients(n = 668)
Number of SVR patients
SVR after IFN[n = 489 (73.2%)]
SVR after DAA[n = 179 (26.8%)] P-valuea
Male gender 444 (66.5) 668 321 (65.6) 123 (68.7) .46Age (years) 57.2 [50.3 – 64.7] 668 56.0 [49.6 – 63.6] 60.4 [53.8 – 67.3] < .001Platelet count(103/mm3) 154.0 [98.0 – 203.0] 457 158.0 [99.0 – 210.0] 142.5 [94.0 – 192.0] .18AST (IU/mL) 31.0 [25.0 – 43.0] 464 30.0 [25.0 – 41.0] 35.0 [25.0 – 53.0] .022ALT (IU/mL) 29.0 [21.0 – 44.0] 467 29.0 [21.5 – 42.0] 31.0 [21.0 – 51.0] .17GGT (IU/mL) 47.5 [30.0 – 91.5] 428 46.0 [27.0 – 84.0] 53.0 [38.0 – 105.0] .019Serum albumin (g/L) 43.0 [39.9 – 46.0] 385 43.6 [40.0 – 46.2] 40.8 [38.0 – 43.6] < .001Bilirubin (µmol/L) 10.0 [7.0– 14.0] 440 10.0 [7.0 – 14.0] 12.7 [9.0 – 18.0] < .001Creatinin (µmol/L) 72.0 [62.0 – 82.0] 433 71.3 [63.0 – 81.0] 73.5 [60.0 – 83.1] .95GFR (MDRD formula) b 94.2 [81.1 – 109.5] 433 94.3 [81.1 – 109.6] 92.9 [78.4 – 109.0] .48Prothrombin time (%) 90.0 [80.0 – 100.0] 384 91.0 [81.0 – 100.0] 85.0 [77.0 – 99.0] .025Oesophageal varices 160 (28.4) 563 100 (25.0) 60 (36.8) .005HCV genotype 608 1 381 (62.66) 251 (57.7) 130 (75.1) 2 46 (7.57) 43 (9.9) 3 (1.7) 3 120 (19.74) 98 (22.5) 22 (12.7) < .001 4 49 (8.06) 34 (7.8) 15 (8.7) 5 9 (1.48) 6 (1.4) 3 (1.7) 6 3 (0.49) 3 (0.7) 0Anti-HBc antibodies 664 .96 Negative 433 (65.2) 316 (65.2) 117 (65.4) Positive 231 (34.8) 169 (34.8) 62 (34.6)HIV Co-infection 25 (3.8) 1662 17 (3.5) 8 (4.5) .57
BMI: body mass index; SVR: sustained virological response; MD: missing data; IFN: interferon; DAA: direct-acting antiviral; GFR: glomerular filtration rate; CV: cardiovasculara SVR by IFN versus SVR by DAAb GFR = 186.3 × (creatinin (µmol/L) / 88.4)-1.154 × age-0.203 × k; k = 1 for men and k = 0.742 for womenc P-value obtained by the following regroupment of modalities of variable alcohol consumption [1: “0” or “< 10”, 2: “10-50”, 3: “> 50”]
20

Supplementary Table 15. Characteristics of SVR patients at baseline (inclusion or date of SVR) according to antiviral treatment. (continued)
Characteristics All SVR patients(n = 668)
Number of SVR patients
SVR by IFN[n = 489 (73.2%)]
SVR by DAA[n = 179 (26.8%)] P-valuea
Past excessive alcohol consumption 202 (31.9) 634 156 (33.5) 46 (27.4) .15Ongoing alcohol consumption (g/day) 535 0 505 (94.4) 372 (93.2) 133 (97.8) <10 24 (4.5) 21 (5.3) 3 (2.2) 10 – 50 6 (1.1) 6 (1.5) 0 .14c
50 – 100 0 0 0
>100 0 0 0
Tobacco consumption 516
Never 214 (41.5) 155 (39.9) 59 (46.5)
Past 145 (28.1) 108 (27.8) 37 (29.1) .22 Ongoing 157 (30.4) 126 (32.4) 31 (24.4)
Substance or drug abuse 654 Never 549 (83.9) 386 (80.6) 163 (93.1) Past 102 (15.6) 91 (19.0) 11 (6.3) < .001 Ongoing 3 (0.5) 2 (0.4) 1 (0.6)BMI (kg/m2) 25.6 [22.8 – 28.9] 472 25.4 [22.7 – 28.7] 26.3 [23.8 – 29.3] .08BMI (class) 472
< 25 200 (42.4) 167 (44.8) 33 (33.3) [25; 30 [ 189 (40.0) 143 (38.3) 46 (46.5) .12 ≥ 30 83 (17.6) 63 (16.9) 20 (20.2)Diabetes 122 (18.4) 663 85 (17.5) 37 (21.0) .30Dyslipidaemia 38 (5.7) 667 29 (5.9) 9 (5.1) .67Arterial hypertension 189 (28.5) 663 130 (26.6) 59 (33.7) .08Past history of CV events 56 (8.4) 668 36 (7.4) 20 (11.2) .12Past history of malignancy 30 (4.5) 668 20 (4.1) 10 (5.6) .41
BMI: body mass index; SVR: sustained virological response; IFN: interferon; DAA: direct-acting antiviral; GFR: glomerular filtration rate; CV: cardiovascular a SVR by IFN versus SVR by DAAb GFR = 186.3 × (creatinin (µmol/L) / 88.4)-1.154 × age-0.203 × k; k = 1 for men and k = 0.742 for womenc P-value obtained by the following regroupment of modalities of variable alcohol consumption [1: “0” or “< 10”, 2: “> 10”]
21

Supplementary Table 16. Outcome of SVR patients according to antiviral treatment.
Outcome Number of patients All patients SVR after IFN
[n = 489 (73.2%)]SVR after DAA
[n = 179 (26.8%)]Logrank
testHR [95% CI],P-value (Cox) a,
HRa [95% CI],P-value (Cox) a, b
Decompensation 668 31 (4.6) 29/489 (5.9) 2/179 (1.1) .37 0.52 [0.12; 2.27], P= .38
0.55 [0.12; 2.44], P= .43
HCC 653 28 (4.3) 27/486 (5.6) 1/167 (0.6) .61 0.59 [0.07; 4.70], P= .62
0.55 [0.07; 4.47], P= .58
Bacterial infection c 647 30 (4.6) 29/485 (6.0) 1/162 (0.6) .17 0.27 [0.04; 2.01], P= .20
0.25 [0.03; 1.92], P= .18
Cardiovascular events 666 21 (3.2) 21/487 (4.3) 0 .13 NA NA
MACE 663 17 (2.6) 17 (3.5) 0 .15 NA NA
Extrahepatic cancer 668 34 (5.1) 33/489 (6.8) 1/179 (0.6) .48 0.49 [0.06; 3.75], P= .49
0.46 [0.06; 3.56], P= .46
Overall death 668 26 (3.9) 23/489 (4.7) 3/179 (1.7) .09 3.05 [0.78; 11.98], P= .11
2.83 [0.70; 11.45], P= .14
Non-liver death 665 13 (2.0) 11/487 (2.3) 2/178 (1.1) .16 3.34 [0.58; 19.35], P= .18
3.02 [0.50; 18.28], P= .23
MACE: Major Adverse Cardiac Event (see text for definition); SVR: sustained virological response; IFN: interferon; DAA: direct-acting antiviral; NA: non applicablea IFN-based regimen versus DAA (reference: IFN-regimen)b Adjusted for agec Patients having a first liver decompensation before SVR were excluded from this analysis
22

Supplementary Table 17. Multivariate analyses taking int account interferon-based regimen as potential risk factors for extrahepatic complications
Bacterial Infection Cardiovascular events MACE
Variables HR [95% CI] P HR [95% CI] P HR [95% CI] P
Agea 1.94 [1.21; 3.11] .006Albumin (g/L) 2.16 [1.11; 4.22] .024 ≤ 35 2.13 [1.36; 3.33] .001 1.83 [1.07;
3.15].029 Ref
> 35 Ref RefGFR (MDRD formula) 0.99 [0.98 ; 1.00] .005Tobacco consumption .039 Never Ref Past 1.72 [0.92; 3.21] .09 Ongoing 2.16 [1.18; 3.98] .013Past history of CV events 3.10 [1.89;
5.06]< .001 3.24 [1.77; 5.94] < .001
Arterial hypertension 2.05 [1.34; 3.12]
.001 2.27 [1.35; 3.80] .002
Beta-blockers intakeb 1.54 [0.99; 2.38]
.06
SVRb 0.53 [0.34; 0.82] .004 0.47 [0.28; 0.80]
.005 0.51 [0.28; 0.94] .031
IFN and ribavirin intake 1.52 [1.08; 2.13] .015 0.80 [0.53; 1.22]
.31 0.78 [0.47; 1.28] .33
SVR: sustained virological response; GFR: glomerular filtration rate; CV: cardiovasculara Age was studied as a categorical variable: Age > 50 years for Cox models analysing bacterial infection occurrence. For the Cox models analysing, vascular events and MACE occurrence, age was studied as a quantitative variable.b Included as a time-dependent variable.
23

SUPPLEMENTARY FIGURE LEGENDS
Supplementary Figure 1- Consort Diagram.
Supplementary Figure 2. Outcome of HCC patients according to SVR status.
Supplementary Figure 3- Impact of SVR on MACE.
Supplementary Figure 4. Competing risk analyses for occurrence of events during follow-up. A. Hepatocellular carcinoma. B. Hepatic decompensation. C. Vascular events. D. Extrahepatic malignancies.
Supplementary Figure 5-Distribution of propensity score on the entire population (left) and on the paired population (right).
24
25

![Glomerular Function and Structure in Living Donors ... · glomerular filtration rate (SNGFR) and glomerular capillary hydraulic pressure (P GC)[3]. Further insights into glomerular](https://static.fdocuments.net/doc/165x107/5ed58c3d3f40d10acd516aa6/glomerular-function-and-structure-in-living-donors-glomerular-filtration-rate.jpg)