VIETNAM PHARMACEUTICAL INDUSTRY REPORT...
76
1 VIETNAM PHARMACEUTICAL INDUSTRY REPORT Q1/2018
Transcript of VIETNAM PHARMACEUTICAL INDUSTRY REPORT...

1
VIETNAM PHARMACEUTICAL INDUSTRY REPORT Q1/2018

Contents
Executive Summary 4
1. Business environment 6
1.1 Macroeconomic situation 6
1.2 Legal framework 10
2. Pharmaceutical Industry Overview 19
2.1 Global Pharmaceutical Industry 19
2.1.1 Production - Consumption 20
2.2 Vietnam Pharmaceutical Industry Overview 23
2.2.1 History of Vietnam Pharmaceutical Industry 24
2.2.2 Industry Position 25
2.2.3 Industry Scale and Feature 26
2.2.4 Value Chain of Vietnam Pharmaceutical Industry 29
2.2.5 Production 30
2
2.2.6 Consumption 33
2.2.7 Export - Import 42
2.2.8 Price movements 47
2.3 Industry planning 50
2.4 Driving forces of industry development 52
3. Enterprise analysis 55
3.1 Profitability Ratios 58
3.2 Cost structure 62
3.3 Asset Management Ratios 65
3.4 Capital Structure 69
3.5 Solvency 71
3.6 Return on Investment 73

3
ETC Ethical drugs
EU-GMP Europe Good Manufacturing Practice
EVFTA EU – Vietnam Free Trade Agreement
GDP Good Distribution Practice
Generic Drug
Drug product that is comparable to a brand/reference
listed drug product in dosage form, strength, quality
and performance characteristics, and intended use."
GLP Good Laboratory Practice
GMP Good Manufacturing Practice
GMP - WHOGood Manufacturing Practice recommended by the
World Health Organization (WHO - GMP)
GPP Good Pharmacy Practice
GSP Good Storage Practice
Abbreviations
OTC Over The Counter (nonprescription-drugs)
Patent Drug Drugs under intellectual property rights
Pharmerging Countries with emerging Pharmaceutical Industry
PIC/S - GMPPharmaceutical Inspection Co-operation Scheme on Good
Manufacturing Practice (EU-GMP)
GDC General Department of Vietnam Custom
GSO General Statistic Office of Vietnam
TPP Trans-Pacific Partnership
WHO World Health Organization
WTO World Trade Organization
MOH Ministry of Health
DAV Drug Administration of Vietnam

4
Executive Summary
There are approximately 178 pharmaceutical
manufacturers nationwide.
Vietnam's pharmaceutical sector uses about
60,000 tons of pharmaceuticals, including 80-
90% of imported pharmaceuticals.
The growth of the prescription drug market
will exceed the growth rate of Over-the-
counter (OTC) market
The market value of patented drugs in Vietnam
tends to increase
According to the Drug Administration of
Vietnam - Ministry of Health, the number of
drug items re-declared price as of 12/6/2017:
the number of drug items with fluctuating
price increase/decrease occupy very little
(about 0.026%) of the total commercially
available drugs..
Content is intentionally removed for demo purpose

5
Executive Summary
The biggest wholesale market systems in
Vietnam pharmaceutical distribution in Ho Chi
Minh City and Hanoi.
Pharmaceutical products are necessities, thus,
economic growth virtually has hardly any
impact on the industry growth rate,
For the WTO, the Vietnamese pharmaceutical
market has gradually opened
M&A trend between domestic and foreign
enterprises takes place strongly in the form of
franchise drug production and the field of
distribution.
Most of the enterprises of pharmaceutical
industry maintained positive operation with
high levels of gross profit and net profit in the
period 2015-2016
Content is intentionally removed for demo purpose

6
1. Business environment
1.1 Macroeconomic situation
1.2 Legal framework
Contents
7
1. Business environment
1.1 Macroeconomic situation
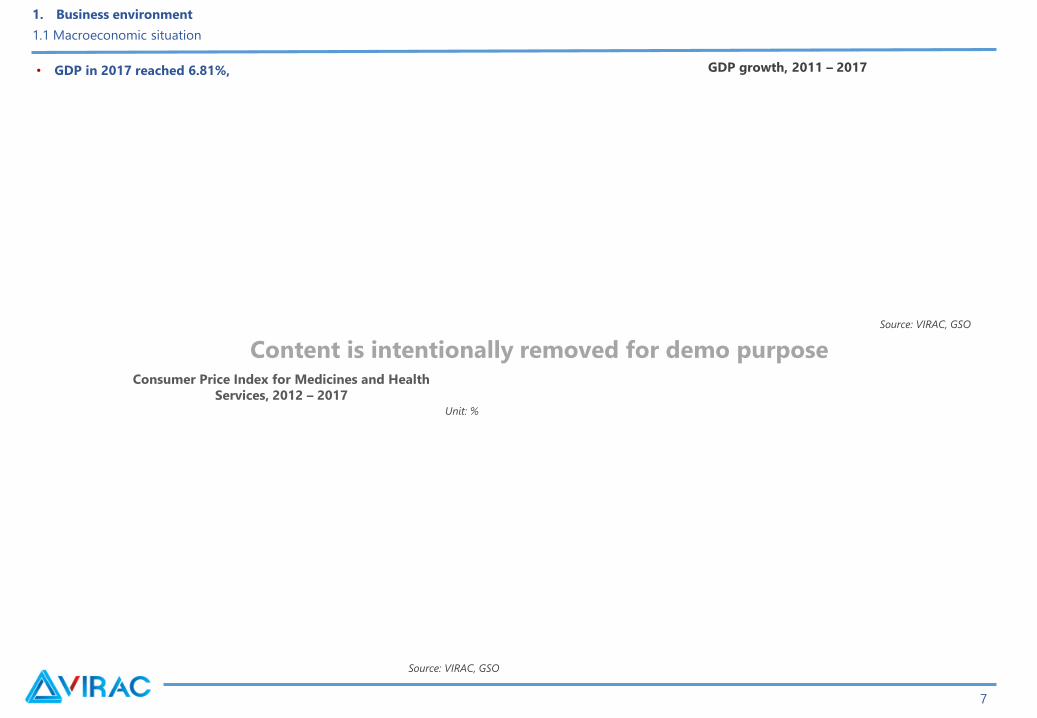
GDP growth, 2011 – 2017• GDP in 2017 reached 6.81%,
Source: VIRAC, GSO
Source: VIRAC, GSO
Unit: %
Consumer Price Index for Medicines and Health
Services, 2012 – 2017
Content is intentionally removed for demo purpose

8
1. Business environment
1.1 Macroeconomic situation
In 2017, the VND/USD exchange rate was stable around VND 22,400.
Source: VIRACSource: VIRAC, SBV
VND/USD exchange rate, 2013 - 2017VND/CNY exchange rate, 2016 – 2017
Content is intentionally removed for demo purpose

9
The pharmaceutical market has a lot of potential when the
demand for medicines is always increasing
1. Business environment
1.1 Macroeconomic situation
Source: VIRAC, GSO
Population and population growth, 2006 -2017
Million people
Source: VIRAC, GSO
Population structure, 1999 - 2016 Content is intentionally removed for demo purpose

10
1. Business environment
1.1 Macroeconomic situation
1.2 Legal framework
Contents

11
1. Business environment
1.2 Legal framework
Regulations on standards of Pharmaceutical Industry
Content is intentionally removed for demo purpose

12
1. Business environment
1.2 Legal framework
Content is intentionally removed for demo purpose
Regulations on drug registration
Regulations on control of drug prices

13
1. Business environment
1.2 Legal framework
Content is intentionally removed for demo purpose
Regulations on import-export
Regulations on drug advertising information

14
1. Business environment
1.2 Legal framework
Content is intentionally removed for demo purpose
Regulations on drug promotion
Distribution
Bidding

15
1. Business environment
1.2 Legal framework
Content is intentionally removed for demo purposeRegulations on importing pharmaceutical materials

16
1. Business environment
1.2 Legal framework
Content is intentionally removed for demo purpose

17
1. Business environment
1.2 Legal framework
Content is intentionally removed for demo purpose

18
1. Business environment
1.2 Legal framework
Content is intentionally removed for demo purpose

19
2. Pharmaceutical Industry Overview
2.1 Global Pharmaceutical Industry
2.2 Vietnam Pharmaceutical Industry Overview
2.3 Industry planning
2.4 Driving forces of industry development
Contents

20
In the period of 2010 - 2016, global drug spending increased at a CAGR of
4.6% per year from USD 888.2 billion in 2010 to USD 1,163.6 billion in
2016.
2. Pharmaceutical Industry Overview
2.1 Global Pharmaceutical Industry – 2.1.1 Production – Consumption
Source: VIRAC, IMS health
Global spending on medicines, 2010 - 2016e
Content is intentionally removed for demo purpose

21
Source: VIRAC, EvaluatePharma
2. Pharmaceutical Industry Overview
2.1 Global Pharmaceutical Industry – 2.1.1 Production – Consumption
Source: VIRAC, IMS health
Consumption structure by types of medicines, 2011 - 2016World sales of prescription drugs, 2010 - 2016
USD billion
Content is intentionally removed for demo purpose

22
World’s top 10 consumed phamaceuticals, 2016
Source: VIRAC, IMS health
Source: VIRAC, IMS health
2. Pharmaceutical Industry Overview
2.1 Global Pharmaceutical Industry – 2.1.1 Production – Consumption
USD billion
Consumption market share by group, 2016
Content is intentionally removed for demo purpose

23
2. Pharmaceutical Industry Overview
2.1 Global Pharmaceutical Industry
2.2 Vietnam Pharmaceutical Industry Overview
2.3 Industry planning
2.4 Driving forces of industry development
Contents

24
Northern domination before 1858,
From 1858, during the French colonial period,
1946 - 1954 resistance war against France,
1954 – 1975,
After 1975,
2. Pharmaceutical Industry Overview
2.2 Vietnam Pharmaceutical Industry Overview – 2.2.1 History of Vietnam Pharmaceutical Industry
2005
1990
Content is intentionally removed for demo purpose

25
2. Pharmaceutical Industry Overview
2.2 Vietnam Pharmaceutical Industry Overview – 2.2.2 Industry Position
Content is intentionally removed for demo purpose

26
Classification by ownership:
Classification by product segment:
2. Pharmaceutical Industry Overview
2.2 Vietnam Pharmaceutical Industry Overview – 2.2.3 Industry Scale and Feature
Content is intentionally removed for demo purpose

27
Classification of medicine markets by distribution methods Classification of medicine markets by ownership
2. Pharmaceutical Industry Overview
2.2 Vietnam Pharmaceutical Industry Overview – 2.2.3 Industry Scale and Feature
Source: VIRAC, Hanoi University of Medicine and Pharmacy
Content is intentionally removed for demo purpose

28
Hà Nội
Hoàng Sa
Trường Sa
Nam Định
Đồng NaiHồ Chí Minh
An Giang
Phú Yên
Khánh Hòa
Bắc Ninh
Tiền Giang
Đồng Tháp
Cà Mau
Hải Phòng
Bình Định
Bình Phước
Bến Tre
Thanh Hóa
Cần Thơ
Hưng Yên
Source: VIRAC
2. Pharmaceutical Industry Overview
2.2 Vietnam Pharmaceutical Industry Overview – 2.2.3 Industry Scale and Feature
Content is intentionally removed for demo purpose

29
Value chain of Vietnam pharmaceutical industry
Source: VIRAC
2. Pharmaceutical Industry Overview
2.2 Vietnam Pharmaceutical Industry Overview – 2.2.4 Value chain of the industry
Content is intentionally removed for demo purpose
30
In fact, medicine companies in Vietnam are facing many difficulties in funding investment in research and development, technical staff and equipment of
high quality which has not met the requirements yet.
Outsourcing
Franchising
2. Pharmaceutical Industry Overview
2.2 Vietnam Pharmaceutical Industry Overview – 2.2.5 Production
Content is intentionally removed for demo purpose
31
Source: VIRAC, DAV
2. Pharmaceutical Industry Overview
2.2 Vietnam Pharmaceutical Industry Overview – 2.2.5 Production
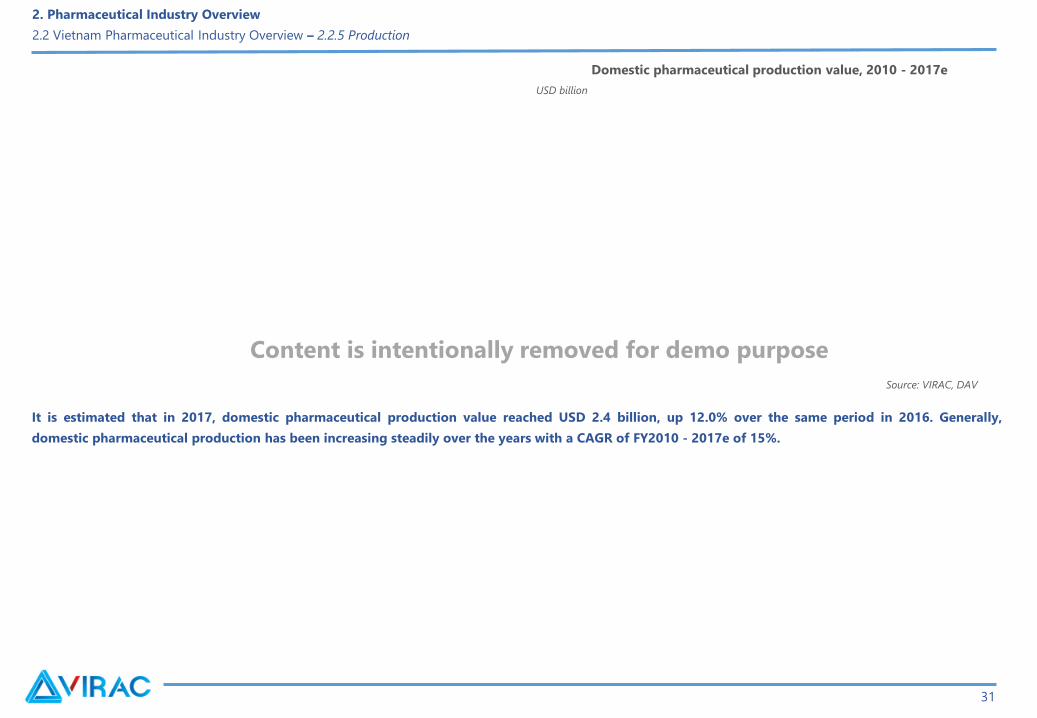
It is estimated that in 2017, domestic pharmaceutical production value reached USD 2.4 billion, up 12.0% over the same period in 2016. Generally,
domestic pharmaceutical production has been increasing steadily over the years with a CAGR of FY2010 - 2017e of 15%.
USD billion
Domestic pharmaceutical production value, 2010 - 2017e
Content is intentionally removed for demo purpose

32
Source: VIRAC, GSO
2. Pharmaceutical Industry Overview
2.2 Vietnam Pharmaceutical Industry Overview – 2.2.5 Production
Medicine production by type, 2010 – 2017e
Content is intentionally removed for demo purpose
Products Unit 2012 2013 2014 2015e 2016e 2017e
Content is intentionally removed for demo purpose

33
2. Pharmaceutical Industry Overview
2.2 Vietnam Pharmaceutical Industry Overview – 2.2.6 Consumption
Pharmaceutical market value, 2010 – 2017e
USD billion
Source: VIRAC, DAV
The pharmaceutical industry is growing at a compound annual
growth rate (CAGR) of 17.4% for the period 2010 - 2017e. Causes
are:
Content is intentionally removed for demo purpose

34
The pharmaceutical industry in Vietnam is still considered relatively
young compared to the global industry.
2. Pharmaceutical Industry Overview
2.2 Vietnam Pharmaceutical Industry Overview – 2.2.6 Consumption
Source: VIRAC, DAV
Value ratio of domestically produced medicines in Vietnam,
2010 – 2017e
Content is intentionally removed for demo purpose

35
According to data from the General Statistics Office, the amount of pharmaceuticals consumed domestically focused on drugs containing penicillin or
antibiotics, drugs containing hormones and vitamins. Drugs like serum and vaccines are domestically consumed at a very small number. Causes leading to
this:
2. Pharmaceutical Industry Overview
2.2 Vietnam Pharmaceutical Industry Overview – 2.2.6 Consumption
Source: VIRAC, GSO
VND trillion
Domestically produced medicine consumption, 2010 - 2017e
Content is intentionally removed for demo purpose

36
Source: VIRAC, DAV, StatistaSource: VIRAC, DAV
2. Pharmaceutical Industry Overview
2.2 Vietnam Pharmaceutical Industry Overview – 2.2.6 Consumption
Spending on medicines in Vietnam, 2009 – 2017e
USD/person/year
Spending on medicines per capita in some countries, 2016e
Content is intentionally removed for demo purpose

37
2. Pharmaceutical Industry Overview
2.2 Vietnam Pharmaceutical Industry Overview – 2.2.6 Consumption
Source: VIRAC, DAV
Pharmaceuticals are distributed throughout the country through two
distribution channels through the hospital (prescribed) or through the
drug stores (not prescribed).
Source: VIRAC, DAV
Medicines consumption structure by channel, 2010 - 2017e
Current status of Patented and Generic drugs, 2010 - 2017e
Content is intentionally removed for demo purpose

38
Market data for prescription and non-prescription medicines is unclear
because there is a lack of clear distinction between these two forms of sales. USD billion
Source: VIRAC, DAV
2. Pharmaceutical Industry Overview
2.2 Vietnam Pharmaceutical Industry Overview – 2.2.6 Consumption - ETC market
Market value of prescription drugs (ETC), 2011 – 2017e
Content is intentionally removed for demo purpose
39
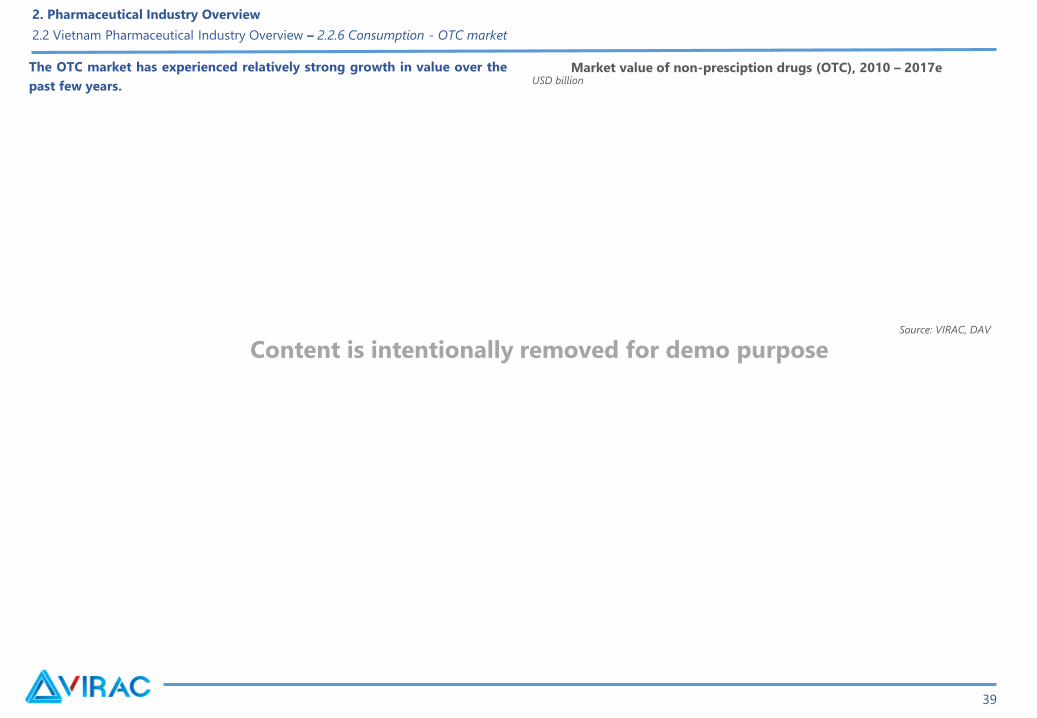
The OTC market has experienced relatively strong growth in value over the
past few years.
2. Pharmaceutical Industry Overview
2.2 Vietnam Pharmaceutical Industry Overview – 2.2.6 Consumption - OTC market
Market value of non-presciption drugs (OTC), 2010 – 2017eUSD billion
Source: VIRAC, DAV
Content is intentionally removed for demo purpose
40
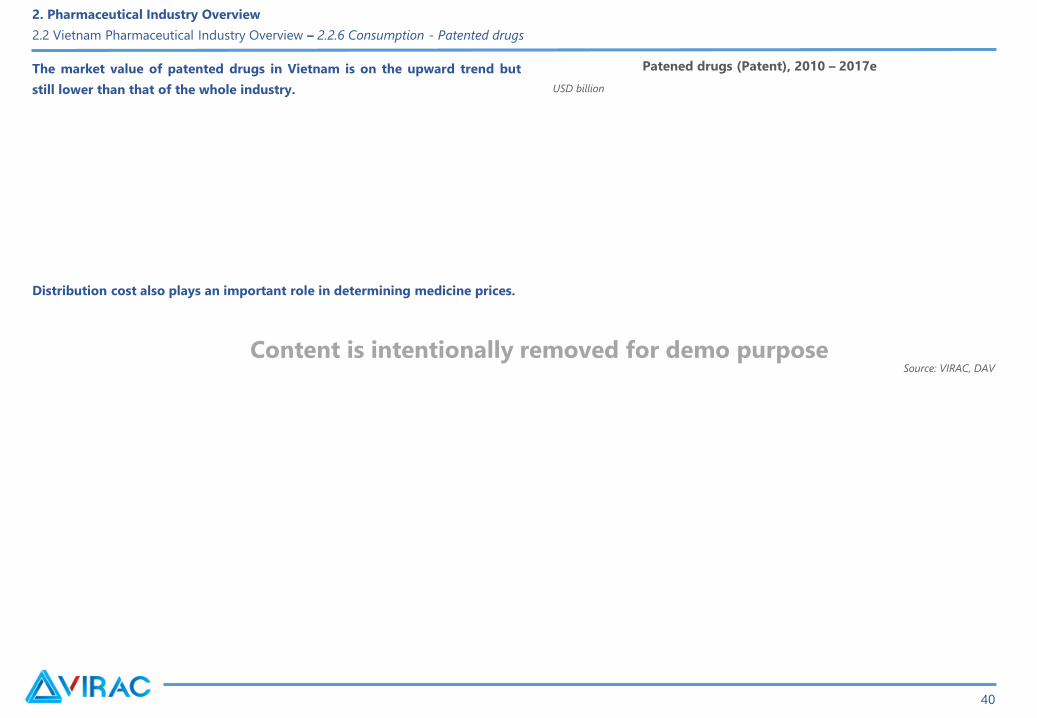
The market value of patented drugs in Vietnam is on the upward trend but
still lower than that of the whole industry.
Distribution cost also plays an important role in determining medicine prices.
Source: VIRAC, DAV
2. Pharmaceutical Industry Overview
2.2 Vietnam Pharmaceutical Industry Overview – 2.2.6 Consumption - Patented drugs
USD billion
Patened drugs (Patent), 2010 – 2017e
Content is intentionally removed for demo purpose

41
Source: VIRAC, DAV
2. Pharmaceutical Industry Overview
2.2 Vietnam Pharmaceutical Industry Overview – 2.2.6 Consumption - Generic drugs
USD billion
Generic drug market, 2010 – 2017e
Content is intentionally removed for demo purpose

42
Vietnam pharmaceutical industry mostly depends on imported sources
with the total value of over USD 2 billion each year, moreover, in 2017,
Vietnam imported more than USD 2.8 billion, an increase of 10%
compared to the previous year.
Source: VIRAC, GDVC
2. Pharmaceutical Industry Overview
2.2 Vietnam Pharmaceutical Industry Overview – 2.2.7 Export - Import
USD million
Source: VIRAC, GDVC
Pharmaceutical imports, 2010 - 2017e
Pharmaceutical imports, 2016 - 2017e
USD million
Content is intentionally removed for demo purpose

43
Source: VIRAC, GDVC
2. Pharmaceutical Industry Overview
2.2 Vietnam Pharmaceutical Industry Overview – 2.2.7 Export - Import
Top importing enterprises, 2017e
No Partners Importing enterprises
Source: VIRAC, GDVC
Vietnam’s top import partners, 2017e
Content is intentionally removed for demo purpose
44
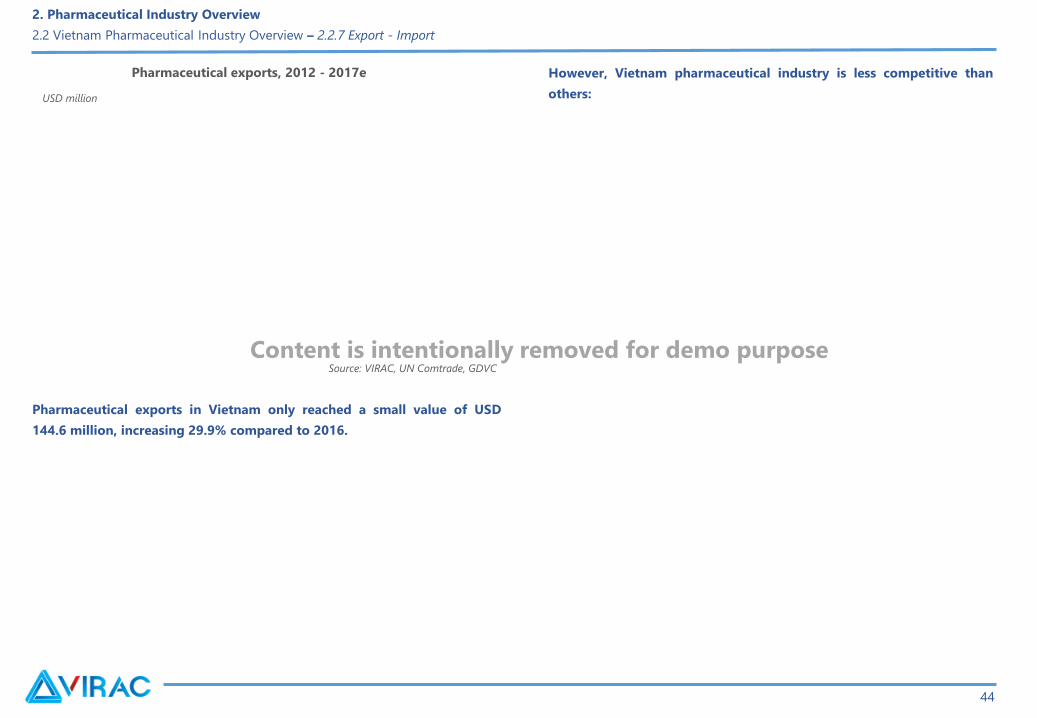
However, Vietnam pharmaceutical industry is less competitive than
others:
Pharmaceutical exports in Vietnam only reached a small value of USD
144.6 million, increasing 29.9% compared to 2016.
2. Pharmaceutical Industry Overview
2.2 Vietnam Pharmaceutical Industry Overview – 2.2.7 Export - Import
Source: VIRAC, UN Comtrade, GDVC
Pharmaceutical exports, 2012 - 2017e
USD million
Content is intentionally removed for demo purpose

45
2. Pharmaceutical Industry Overview
2.2 Vietnam Pharmaceutical Industry Overview – 2.2.7 Export - Import
Top exporting enterprises, 2017
Source: VIRAC, GDVC
Source: VIRAC, GDVC
No Exporting enterprises
Export structure by country, 2017
Content is intentionally removed for demo purpose

46
2. Pharmaceutical Industry Overview
2.2 Vietnam Pharmaceutical Industry Overview – 2.2.7 Export - Import
2017 financial information of some major importing-exporting enterprises
Source: VIRAC
No Exporting enterprises Revenue(VND billion)
No Importing enterprises Revenue(VND billion)
Content is intentionally removed for demo purpose

47
Drug prices tend to be stable over the years with a low increase.
Source: VIRAC, DAV
2. Pharmaceutical Industry Overview
2.2 Vietnam Pharmaceutical Industry Overview – 2.2.8 Price movements
Rate of drug re-price (increase), 2013 - 2016
Content is intentionally removed for demo purpose

48
Price movements of some major drugs in the market, 12/2016 – 12/2017Unit: VND 1,000
Source: VIRAC, Agency for Price Management
2. Pharmaceutical Industry Overview
2.2 Vietnam Pharmaceutical Industry Overview – 2.2.8 Price movements
No Drugs Unit Manufacturer 12/2016 3/2017 6/2017 9/2017 12/2017
Compared
to the
beginning
of the
same
period
Drug prices in the market in 2017 continueto be stable, which could meet all demands for disease prevention and treatment.
Content is intentionally removed for demo purpose

49
Type of drugLong Chau
drug store
Yen Trang
drug storeDifference
Source: VIRAC
There is a huge difference in drug prices listed at Ministry of Health and the
ones distributed to customers.
The difference in the price of some drugs at some drug stores, 2017
2. Pharmaceutical Industry Overview
2.2 Vietnam Pharmaceutical Industry Overview – 2.2.8 Price movements
Unit: VND thousand
Content is intentionally removed for demo purpose

50
2. Pharmaceutical Industry Overview
2.1 Global Pharmaceutical Industry
2.2 Vietnam Pharmaceutical Industry Overview
2.3 Industry planning
2.4 Driving forces of industry development
Contents

51
2. Pharmaceutical Industry Overview
2.3 Industry planning
Content is intentionally removed for demo purpose

52
2. Pharmaceutical Industry Overview
2.1 Global Pharmaceutical Industry
2.2 Vietnam Pharmaceutical Industry Overview
2.3 Risks and challenges
2.3 Industry planning
2.4 Driving forces of industry development
Contents

53
Subsidy policy of the State
Policy to increase domestic drug spending
Extension policy of the national health insurance system
Impact from world economic agreements
2. Pharmaceutical Industry Overview
2.4 Driving forces of industry development
Content is intentionally removed for demo purpose

54
Population motivation and healthcare awareness:
Source: VIRAC, WHO
2. Industry Overview
2.4. Driving forces of industry development
USD million
Total healthcare expenses, 2010 – 2016f
Source: VIRAC, IMS health
Million people
Over-60 population growth in the world, 1950 – 2050
Source: VIRAC, GSO
Population tower, 2016
Content is intentionally removed for demo purpose

55
3. Enterprise analysis
3.1 Profitability Ratios
3.2 Cost structure
3.3 Asset Management Ratios
3.4 Capital Structure
3.5 Solvency
3.6 Return on Investment
Contents

3. Enterprise analysis
10 typical pharmaceutical enterprises in 2016
56
No Company
Busine
ss
sector
Revenue
(VND
billion)
Main features
1
DHG
Pharmaceutical
Joint Stock
Company
2TRAPHACO Joint
Stock Company
3
Domesco
Medical Import
Export JSC
4
Imexpharm
Pharmaceutical
JSC
5
OPC
Pharmaceutical
JSC
10 typical pharmaceutical enterprises in 2016
Source: VIRAC
Content is intentionally removed for demo purpose

3. Enterprise analysis
10 typical pharmaceutical enterprises in 2016
57
No CompanyBusiness
sector
Revenue
(VND
billion)
Main features
6 S.P.M JSC
7
Vimedimex
Medi –
Pharma JSC
8
Ha Tay
Pharmaceut
ical JSC
9
Ben Tre
Pharmaceut
ical JSC
10
Lam Dong
Pharmaceut
ical JSC
Source: VIRAC
Content is intentionally removed for demo purpose

58
3. Enterprise analysis
3.1 Profitability Ratios
3.2 Cost structure
3.3 Asset Management Ratios
3.4 Capital Structure
3.5 Solvency
3.6 Return on Investment
Contents

3. Enterprise Analysis
3.1 Profitability Ratios
59
Pharmaceutical companies have a good business year when they have a positive profit margin, with the average group of producers having higher gross
margins and ROS than the distribution group.
Profit indicators, 2015 - 2016
VND billion
Source: VIRAC
Content is intentionally removed for demo purpose

60
3. Enterprise analysis
3.1 Profitability Ratios
Content is intentionally removed for demo purpose

61
3. Enterprise Analysis
3.1 Profitability Ratios
Source: VIRAC
COGS/NR, 2015 - 2016
Content is intentionally removed for demo purpose

62
3. Enterprise analysis
3.1 Profitability Ratios
3.2 Cost structure
3.3 Asset Management Ratios
3.4 Capital Structure
3.5 Solvency
3.6 Return on Investment
Contents

63
3. Enterprise analysis
3.2 Cost structure
Source: VIRAC
Selling expenses, 2015 - 2016
Content is intentionally removed for demo purpose

64
3. Enterprise analysis
3.2 Cost structure
Source: VIRAC
Administrative expenses, 2015 - 2016
Content is intentionally removed for demo purpose

65
3. Enterprise analysis
3.1 Profitability Ratios
3.2 Cost structure
3.3 Asset Management Ratios
3.4 Capital Structure
3.5 Solvency
3.6 Return on Investment
Contents

66
3. Enterprise analysis
3.3 Asset Management Ratios
Day
Source: VIRAC
Days in inventory, 2016
Content is intentionally removed for demo purpose
67
3. Enterprise analysis
3.3 Asset Management Ratios
Day
Source: VIRAC
Days of sales outstanding, 2016
Content is intentionally removed for demo purpose

68
3. Enterprise analysis
3.3 Asset Management Ratios
Source: VIRAC
Asset turnover, 2016
Content is intentionally removed for demo purpose
69
3. Enterprise analysis
3.1 Profitability Ratios
3.2 Cost structure
3.3 Asset Management Ratios
3.4 Capital Structure
3.5 Solvency
3.6 Return on Investment
Contents

70
3. Enterprise analysis
3.4 Capital Structure
Source: VIRAC
Self-financing ratio, 2015 - 2016
Content is intentionally removed for demo purpose

71
3. Enterprise analysis
3.1 Profitability Ratios
3.2 Cost structure
3.3 Asset Management Ratios
3.4 Capital Structure
3.5 Solvency
3.6 Return on Investment
Contents

72
Solvency, 2015 - 2016
Source: VIRAC
3. Enterprise analysis
3.5 Solvency
Content is intentionally removed for demo purpose

73
3. Enterprise analysis
3.1 Profitability Ratios
3.2 Cost structure
3.3 Asset Management Ratios
3.4 Capital Structure
3.5 Solvency
3.6 Return on Investment
Contents

74
3. Enterprise analysis
3.6 Return on investment
Profit ratio, 2015 - 2016
Source: VIRAC
Content is intentionally removed for demo purpose

REPORT DISCLAIMER
REPORT DISCLAIMER
This document has been prepared in good faith on the basis of information available at the date of publication without any
independent verification. VIRAC has produced this report for private circulation to professional clients only. All information and
statistical data herein have been obtained from sources we believe to be reliable and made to ensure the accuracy of the contents of
the pages of the report at the time of preparation. Such information has not been independently verified and VIRAC makes no
representation or warranty, whether express or implied, of any kind with respect to the document and its contents, information and
materials. The content found in this report is proprietary to VIRAC and is provided solely for your personal and non-commercial use.
You agree that you will not use this report for any purpose that is unlawful and that you will not reproduce the report or redistribute it
outside your organisation, or place it on a website for public access without the express written permission of VIRAC.
SHOULD YOU NEED ANY ASSISTANCE, PLEASE CONTACT US:
VIETNAM INDUSTRY RESEARCH AND CONSULTANCY (VIRAC JSC.,)
6th Floor, Anh Minh Building, 36 Hoang Cau, O Cho Dua, Dong Da, Hanoi, Vietnam
Website: http://virac.com.vn/
Email: [email protected] | Tel: +84 463289520
123

Thank you !